Mechanical phenotyping of K562 cells by the Micropipette Aspiration Technique allows identifying mechanical changes induced by drugs - Forza10
←
→
Page content transcription
If your browser does not render page correctly, please read the page content below
www.nature.com/scientificreports

                        OPEN          Mechanical phenotyping of K562
                                      cells by the Micropipette Aspiration
                                      Technique allows identifying
Received: 24 November 2016
Accepted: 3 January 2018              mechanical changes induced by
                                      drugs
Published: xx xx xxxx

                                      Alessandro Di Cerbo 1, Valentina Rubino2, Francesca Morelli1, Giuseppina Ruggiero7,
                                      Rosaria Landi8, Gianandrea Guidetti3, Sergio Canello4, Giuseppe Terrazzano2,5 &
                                      Andrea Alessandrini1,6
                                      Mechanical properties of living cells can be used as reliable markers of their state, such as the presence
                                      of a pathological state or their differentiation phase. The mechanical behavior of cells depends on
                                      the organization of their cytoskeletal network and the main contribution typically comes from the
                                      actomyosin contractile system, in both suspended and adherent cells. In the present study, we
                                      investigated the effect of a pharmaceutical formulation (OTC – Ossitetraciclina liquida 20%) used as
                                      antibiotic, on the mechanical properties of K562 cells by using the Micropipette Aspiration Technique
                                      (MAT). This formulation has been shown to increase in a time dependent way the inflammation and
                                      toxicity in terms of apoptosis in in vitro experiments on K562 and other types of cells. Here we show
                                      that by measuring the mechanical properties of cells exposed to OTC for different incubation times, it
                                      is possible to infer modifications induced by the formulation to the actomyosin contractile system. We
                                      emphasize that this system is involved in the first stages of the apoptotic process where an increase
                                      of the cortical tension leads to the formation of blebs. We discuss the possible relation between the
                                      observed mechanical behavior of cells aspirated inside a micropipette and apoptosis.

                                      Mechanical properties of living cells are related to their physiological/pathophysiological changes and metabolic
                                      states. This relation prompted a plethora of studies devoted to characterizing mechanical properties of single
                                      cells and understanding the link between the phenomenological measurement of mechanical properties and the
                                      underlying biochemical events. In many cases, altered mechanical properties of cells have been associated with
                                      their pathological conditions. Examples are the development of cell metastatic ability, typically associated with a
                                      decreased rigidity1, malaria disease2 and asthma3. Different experimental techniques have been exploited to study
                                      the mechanical aspects of living cells. Among these techniques there are Atomic Force Microscopy (AFM)4,5,
                                      Magnetic Twisting Cytometry (MTC)6, Micropipette Aspiration Technique (MAT)7,8, Particle Tracking Rheology
                                      (PTR)9 and the Optical Stretching Technique (OST)10.
                                          The mechanical properties of living cells are connected to the state and the activity of the cytoskeleton, with
                                      dissimilar contributions from different types of cytoskeletal polymer networks and to the viscous properties of the

                                      1
                                       Department of Physics, Informatics and Mathematics, University of Modena and Reggio Emilia, Via G. Campi 213/A,
                                      41125, Modena, Italy. 2Department of Molecular Medicine and Medical Biotechnology, University of Naples Federico
                                      II, Via Pansini 5, 80131, Naples, Italy. 3Division of Research and Development, SANYpet SpA, Via Austria 3, 35023,
                                      Bagnoli di Sopra (PD), Italy. 4Research and Development Department, Forza10 USA Corp, ORLANDO FL, USA.
                                      5
                                        Department of Science, University of Basilicata, Via Sauro 85, 85100, Potenza, Italy. 6CNR-Nanoscience Institute-
                                      S3, Via Campi 213/A, 41125, Modena, Italy. 7Department of Translational Medical Sciences, University of Naples
                                      Federico II, Via Pansini 16, 80131, Naples, Italy. 8Department of Molecular Medicine and Medical Biotechnology,
                                      University of Naples, Federico II, Via Pansini 5, 80131, Naples, Italy. Alessandro Di Cerbo and Valentina Rubino
                                      contributed equally to this work. Correspondence and requests for materials should be addressed to A.A. (email:
                                      andrea.alessandrini@unimore.it)

        SCIeNTIFIC ReporTS | (2018) 8:1219 | DOI:10.1038/s41598-018-19563-z                                                                            1
www.nature.com/scientificreports/

                              cytoplasm. One of the most important contributions to the mechanical behavior, when techniques like AFM and
                              MAT are used, comes from the actin component together with myosin II. The complex composed by actin and
                              myosin II is indeed responsible for cell contractility. The organization of the actin network is strongly dependent
                              on the state of the cell (such as for the mitotic or apoptotic phase) and its depolymerization in specific condi-
                              tions could make other cytoskeleton components such as microtubules or intermediate filaments become more
                              relevant in determining the overall mechanical properties11–13. When considering the actin/myosin II complex,
                              there is a fundamental difference between adherent and suspended cells. In the former case, the actin/myosin II
                              couple, together with focal adhesion complexes, give rise to stress fibers whose strength is strongly related to the
                              properties of the substrate on which cells are growing and the main contribution to the cell mechanical properties
                              comes from the stress-fibers and the associated pre-stressed state of cells14,15. In suspended cells, stress fibers are
                              not present and the acto/myosin II complex is mainly concentrated in the cortical region, just below the mem-
                              brane, forming many contacts with it. The distinction is also fundamental to selecting the most suitable technique
                              for the experimental cellular analysis. For example, MAT and OST are more suitable for suspended cells whereas
                              AFM is one of the techniques of choice for adherent cells.
                                  Many theoretical models for the mechanics of cells have been introduced in the literature16–19. Also in the
                              case of theoretical modeling it is important to distinguish between adherent and suspended cells. In the case of
                              suspended cells, the introduced theoretical models embrace situations in which just viscous contributions are
                              considered with a constant tension coming from the cortical region (liquid drop model) and situations in which
                              elastic contributions together with viscous dissipation are required to reproduce the experimental results17,20–22.
                              The model to be adopted strongly depends on the cell type. In the case of hematopoietic cell types, a heterogene-
                              ous model including the elastic-viscous region inside the cell and the cortical tension is frequently used, whereas
                              a homogeneous model represented by spring-dashpot elements is usually exploited for non-hematopoietic cells.
                                  In the case of adherent cells a large consensus has been received by the soft-glass rheology model, which
                              manifests itself by a power-law behavior of the cell stiffness as a function of the frequency of the stimulus used
                              to mechanically probe the cell23,24. The model establishes the absence of a characteristic relaxation time for cells
                              in favor of a continuous distribution of relaxation times, highlighting the relevance of disorder, rearrangements
                              and metastability conditions for the cytoskeleton. Within the power-law model, cells are characterized by a flu-
                              idity parameter, which can vary from 0 (completely elastic behavior) to 1 (completely viscous behavior) and by
                              an elasticity term (the pre-exponential term). The same type of behavior can be equivalently obtained by creep
                              compliance experiments in the time domain instead of the frequency domain (see SI). The power-law model has
                              been found to accurately describe also the behavior of suspended cells25–27, which means that the model doesn’t
                              depend on the presence of stress fibers. It has also been found that the effect of drugs on cells could be described
                              by a preserved power-law relation with a variation on the fluidity parameter27,28. The possibility of investigating
                              variations of these parameters could offer the opportunity for an early detection of pathological conditions. At
                              the same time it is in principle possible, by exploiting the measurement of the mechanical parameters, to develop
                              drugs aimed at restoring normal mechanical conditions29.
                                  Many of the above mentioned experimental techniques lack high-throughput capabilities and, in considering
                              the broad distribution of parameters defining the mechanical properties of even a single cell type, this limitation
                              could represent an obstacle to clearly identify altered mechanical properties. To overcome these limits, tech-
                              niques based on microfluidic technology have been developed and exploited to obtain a significant statistics for
                              suspended cells26,30–32. However, in some cases, specific techniques such as MAT, even if endowed with a lower
                              throughput, could be relevant to provide evidence of particular features in the mechanical behavior of living cells.
                              In fact, one of the main difficulties in modeling cell mechanical properties is due to the active behavior of the
                              cytoskeleton. With long enough time (tens of seconds) the cytoskeleton could actively rearrange to oppose the
                              imposed deformation. In this case biphasic behaviors could be found in the response of a cell to strains and single
                              cell analysis over long time intervals is required33,34.
                                  In the present work, we studied by MAT the behavior of the human K562 erythroleukemic cell line, commonly
                              used as in vitro tumor model that is able to stimulate the immune-system35, affected by the incubation with a
                              pharmaceutical formulation (Ossitetraciclina liquida 20% - in the following we will refer to this formulation as
                              OTC)36. The active ingredient of this formulation (oxytetracycline) represents the main employed antibiotic in
                              zootechnical and veterinary practice as feed supplementation to ensure wellness of farmed animals (i.e. poultry,
                              ovine, bovine and swine livestock)37–40. Several studies have investigated the potential toxic effects of oxytetracy-
                              cline and, in particular, the drug showed teratogenic effects41 exerting some impacts on immune system42–45. In
                              this regard, we recently demonstrated an in vitro pro-inflammatory role of OTC and its ability to induce apoptosis
                              in hematopoietic cells in human and dogs36,46.
                                  In this context, we raised the hypothesis that, since the actin cytoskeleton and cell mechanics in general are
                              strongly involved in the different phases of the apoptotic process, the Micropipette Aspiration Technique could
                              detect modification in the mechanical behavior, possibly related to apoptosis, of K562 cells exposed to OTC.
                              Considering that the pro-apoptotic effect of OTC is time-dependent, we were also interested in establishing if
                              MAT could be able to detect some changes in the cells for incubation times shorter than the ones needed to detect
                              the effect by the AnnexinV marker. To this aim we characterized by MAT the creep compliance behavior of cells,
                              which had been exposed to OTC for different incubation times. At the same time, cells exposed to OTC for the
                              same incubation times were characterized by using AnnexinV marker to detect the presence of phosphatidylser-
                              ine in the outer leaflet of the membrane47.

                              Material And Methods
                              Cells and OTC incubation. The cells used were from the human K562 erythroleukemic cell line35,36. Cells
                              were cultured in RPMI 1640 culture medium (Gibco BRL, Rockville, MD) at 37 °C in a humidified atmosphere
                                                                                           ®
                              containing 5% CO2. OTC (Ossitetraciclina liquida 20% , TreI, Reggio Emilia, Italy) was used as previously

SCIeNTIFIC ReporTS | (2018) 8:1219 | DOI:10.1038/s41598-018-19563-z                                                                                2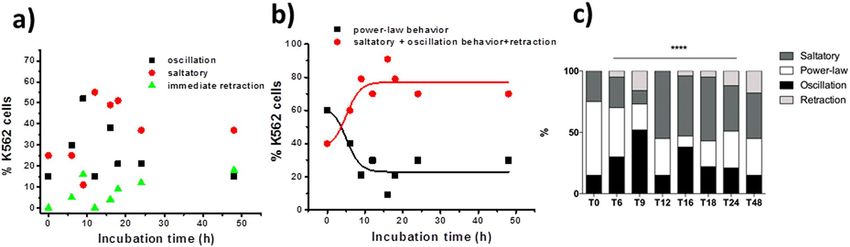
www.nature.com/scientificreports/

                              described36,45. Briefly, the K562 cells (2.5 × 10⁶/ml) were cultured in RPMI 1640 medium with 10% FCS, with (in
                              the case of treated cells) or without (untreated control cells) 4 μM OTC at 37 °C for different times (6, 9, 12, 15, 16,
                              18, 24, and 48 h). The untreated K562 cells were used as control of naturally occurring apoptosis (in absence of
                              OTC) in the experiments. 200 μM hydrogen peroxide (H2O2) was used as a standard positive control of apoptosis
                              in a 5 × 10⁵ K562 cells/mL culture for 1 h at 37 °C, 5% CO2.
                                  Apoptosis was assessed by staining the cell membrane-exposed phosphatidylserine with fluorescein
                              isothiocyanate-conjugated (FITC) Annexin V according to the manufacturer’s instructions (Becton Dickinson
                              PharMingen, San Jose, CA) as previously described48. Samples were analyzed by flow cytometry by using a two
                              laser-equipped FACS Calibur (Becton Dickinson PharMingen, San Jose, CA) and the CellQuest Analysis Software.
                              Cells undergoing apoptosis were indicated by the percentage of Annexin V-positive cells through FACS analysis.

                              Micropipette Aspiration Technique.              Capillaries with an external diameter of 1.5 mm were bought from
                              World Precision Instruments (WPI, Sarasota, FL, USA). BSA for glass surface passivation and blebbistatin to
                              block myosin II activity were purchased from Sigma-Aldrich (Sigma-Aldrich, St. Louis, MO, USA). Blebbistatin
                              was diluted in DMSO to have a final concentration of 50 μM, with DMSO concentration less than 0.5% in the
                              chamber where cells are mechanically characterized.
                                  Microaspiration was performed by using pulled borosilicate glass capillaries with a terminal cylindrical shape
                              and an internal diameter in the order of 5–10 μm. It has been shown that results obtained with pipettes with the
                              diameter in this range should be largely independent of the exact pipette radius25. Pipettes were fire-polished to
                              ensure good cell-pipette contact and pretreated with BSA (10 mg mL−1) or Surfasil to avoid adhesion between
                              glass and cells. In the case of pretreatment with BSA the pipettes were immersed in the BSA solution for 5 min-
                              utes and then they were thoroughly rinsed with distilled water before being filled with the culture medium. In
                              the case of Surfasil pretreatment, the micropipettes were immersed for 5 minutes in a Surfasil solution diluted
                              in toluene; they were subsequently thoroughly washed with toluene and then kept for 10 minutes in the oven at
                              90 °C. Each pipette was then connected to a pneumatic pressure transducer (Lorenz MPCU-3) to get pressure
                              differences between the internal side of the pipette and the external solution with a sensitivity of 1 mm H2O.
                              The pressure difference was applied by controlling the air pressure on top of a cylindrical tube containing the
                              culture medium solution and initially kept at the right height to assure a negligible starting pressure difference
                              (verified by controlling the null aspiration or repulsion of small objects in solution). Cells were kept inside a
                              chamber made by glass-slides separated by a PDMS or Teflon ring allowing the entry of the pipette. We typically
                              changed the chamber containing the cells we were working on every hour taking new cells from the incubator
                              (see Supplementary Material for a discussion on the analysis conditions). The internal sides of the chamber were
                              pretreated with BSA or Surfasil to avoid cell-surface adhesion. We made creep compliance analysis in the time
                              domain (see Supplementary Material). In response to pressure differences (between the internal pipette region
                              and the region just outside the pipette), the cell is aspirated into the pipette and the progressive cell protrusion
                              entry into the pipette can be measured by Optical Microscopy as a function of the applied pressure difference or
                              as a function of time at constant applied pressure. To study the viscoelastic properties of cells, a rapid pressure
                              difference was applied by using a home-developed Lab-view and Arduino-based hardware. After the pressure
                              jump was applied, images of the cell were acquired at a rate of 1 frame per second. Images were acquired by an
                              Olympus IX 70 inverted microscope in Differential Interference Contrast (DIC) mode with a 20x or 40x objective.
                              The images were then analyzed by using the ImageJ software (NIH, Washington, USA) in order to automatically
                              detect the position of the cell protrusion inside the micropipette (a detailed description of the protocol for the
                              automatic detection of the cell protrusion position together with the handling of cell blebs in the analysis is
                              reported in the Supplementary Material). Assuming a linear viscoelastic behavior for the cells, we measured the
                              increase of the projection length starting from the initial position of the projection inside the micropipette. We
                              also verified that the initial holding pressure difference was not able to induce a significant variation of the cell
                              protrusion over times in the order of 3–4 minutes (see Fig. S1).

                              Creep compliance analysis.         The analysis was based on the power-law model. In this model, the instanta-
                              neous creep compliance J(t) can be described by:
                                                                               J (t ) = AJ (t /t0)α                                               (1)
                              where AJ represents the value of J(t) for t = t0 = 1 s and α is the power-law exponent. α can vary from 0 (com-
                              pletely elastic behavior) to 1 (completely viscous behavior). The stiffness parameter in Pa can be obtained from
                              the fit of the power-law expression to the relaxation trend25:
                                                                                           1
                                                                             AG =
                                                                                      AJ Γ(1 + α)                                                 (2)
                              where Γ (..) is the gamma function. In some cases we also used the Standard Linear Model or similar models to
                              analyze the cell creep compliance behavior. These models use springs and dashpots to phenomenologically repro-
                              duce the experimentally obtained creep behavior of the cells. We found that the power-law model generally fit the
                              behavior in a better way (see Figure S4).
                                 By using the half-space model49 it is possible to connect the projection variation inside the pipette to the shear
                              creep compliance to be used for the quantitative fit. According to this model we have:

SCIeNTIFIC ReporTS | (2018) 8:1219 | DOI:10.1038/s41598-018-19563-z                                                                                 3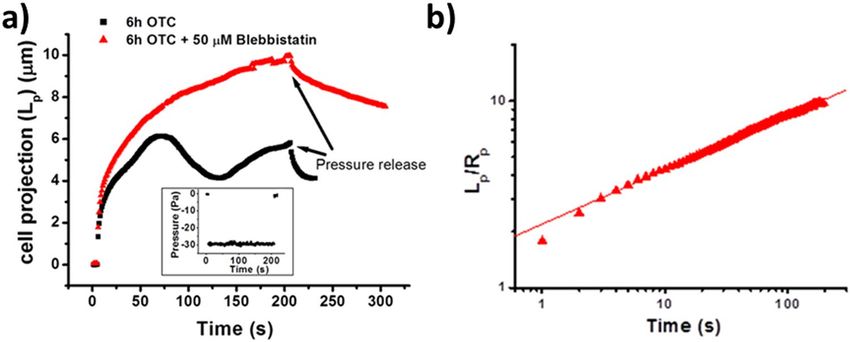
www.nature.com/scientificreports/

                                                                                          2 π L p(t )
                                                                              J (t ) =
                                                                                         ΦP RP ΔP                                                 (3)
                              where Rp is the pipette diameter, ΦP is a parameter depending on the ratio between the pipette wall thickness and
                              the pipette radius (typically ≈ 2.1) and ΔP is the applied pressure.
                                  If the creep analysis was limited to the first 5 or 6 seconds after the pressure step was applied the behavior of
                              almost all the tested cells could be accounted for by a power-law fit (see below). For longer time-scale several
                              cells deviated significantly from the power-law model. In some cases the cell protrusion inside the micropipette
                              showed a biphasic trend with also oscillatory behavior. In these cases, for different OTC incubation times, we
                              counted the percentages of cells showing the different behaviors. The averaged behaviors for the power-law model
                              at long time scale that we show in this work have been obtained excluding the cells with oscillatory trend. We also
                              considered at short time scale the power-law behavior for cells which undergo an oscillatory behavior at longer
                              time scale.
                                  For each OTC treatment, a set of 20/30 cells was analyzed. Each treatment was also compared to control
                              cells, which were kept for the same time period in normal culture conditions without being exposed to OTC.
                              For the statistical analysis we used the Chi-squared test to establish if the number of cells characterized by each
                              different behavior was different from the situation of the negative control in a statistically significant way. For the
                              statistics of the values of the α-exponent and of the stiffness parameters of the power law behavior we used the
                              Kruskal-Wallis test because in many cases it has been found that the mechanical parameters for a cell population
                              follow a log-normal distribution.
                                  It is important to stress that the diameter of the exploited micropipettes typically exceeds the nucleus size and
                              the measured mechanical properties are not expected to be affected by the mechanics of the nucleus, which is
                              typically more rigid than the cytoplasm and the cortical actin.

                              Results
                              Figure 1 shows the typical behavior of cell protrusion as a function of time for control, not exposed to OTC,
                              K562 cells when a negative pressure jump is applied (see inset to Fig. 1e for the corresponding pressure val-
                              ues). The behavior can be fitted by a power-law relationship with an average feature of the exponent α = 0.44
                              ± 0.02 (mean ± SEM). In some cases it seems that at short time some experimental points depart from the fit
                              (see Fig. 1g). It is possible that in these cases, at very short time (2–3 s), a power-law regime with a higher fluidity
                              parameter exists, but the fit would be based on a very small number of experimental points. This behavior could
                              be due to the raising ramp of the pressure step or to the cells which are initially not in good contact with the
                              micropipette. In the control sample (considering all the experiments we performed), 32 out of 44 cells showed
                              a creep compliance behavior that could be described by the power-law model. The remaining 12 cells showed a
                              biphasic behavior for the cell projection inside the micropipette. The presence of a retraction movement is related
                              to an active mechanism, which is able to feel the cell deformation and to establish a biochemical mechanism
                              to oppose it, especially at longer time-scales. In some cases there was a fast increase followed by a retraction
                              phase. In these cases the projection comes to an almost equilibrated position or to a minimum followed by a new
                              increase. If cells presenting the latter behavior are kept at the same constant pressure for long periods (about 300 s)
                              an oscillatory movement is observed. In other cases there was a small increase of the projection followed by a
                              continuous decrease. Both types of behavior are represented in Figure S5.
                                  The power-law model has been already applied to describe K562 mechanical properties in the literature26.
                              In the case of microfluidic platforms, the entry-time of K562 WT cells in narrow channels has been fitted by a
                              power-law model showing a broad distribution for the exponent value with a peak around a feature of 0.3[26].
                              The average value we obtained for the exponent is within the broad distribution found from the measurement of
                              the entry–time but it doesn’t correspond to the peak position. The discrepancy could be due to several factors: the
                              different measured phenomenon, the different timescale for the relaxation phenomenon (milliseconds instead of
                              seconds), the different geometry of the channel (square section with respect to cylindrical section of the micro-
                              pipette), the value of the applied pressure difference (much lower in our case – a few Pa vs kPa), and our limited
                              statistical sample. The second parameter we can extract from the fit is the pre-exponential factor. It represents the
                              cell compliance at the reference time t0 = 1 s. Its inverse is a measure of the cell stiffness parameter. The average
                              AJ value we obtained for control K562 is (0.0040 ± 0.0015) Pa−1 (mean ± SD). Considering the corresponding α
                              value we obtain a feature of about 90 Pa for the stiffness parameter (see Supplementary Material for the details of
                              the used formulas). Similar values have been obtained in other studies using Optical Tweezers50 or microfluidic
                              platforms26. It is important to stress that we did not perform any type of synchronization on the cell cycle. As a
                              consequence, in the same sample we could have cells in different phases of their life cycle, each one characterized
                              by its mechanical properties resulting in a large standard deviation for the fluidity parameter.
                                  We then concentrated on K562 cells exposed to OTC for different incubation times. We noted that by increas-
                              ing the incubation time of OTC the cells started to present other specific creep behaviors with an increase of the
                              cases ascribable to high cellular cortical activity. We classified the main behaviors in four different categories
                              and they are represented in Fig. 2: a) growth of the protrusion followed by retraction and a new growth with no
                              evidence of bleb formation (see Fig. 3 for an example); b) continuous growth of the cell protrusion with a progres-
                              sion that could be fitted by the power-law model in a Log-Log plot with a correlation coefficient higher than 0.99;
                              c) oscillating behavior characterized by alternating growth and retraction cycles with a very rapid growth step
                              and evident formation of large cell blebs (see Figure S6 for this particular case); d) step-growth characterized by
                              growth followed by stabilization and then a new growth and stabilization cycle (saltatory behavior). This last case
                              is distinguished with respect to the case reported in Fig. 2b by the fact that a linear fit in a Log-Log plot results in
                              a correlation coefficient with a feature of 0.98 or lower. Representative movies for different behaviors are reported

SCIeNTIFIC ReporTS | (2018) 8:1219 | DOI:10.1038/s41598-018-19563-z                                                                                 4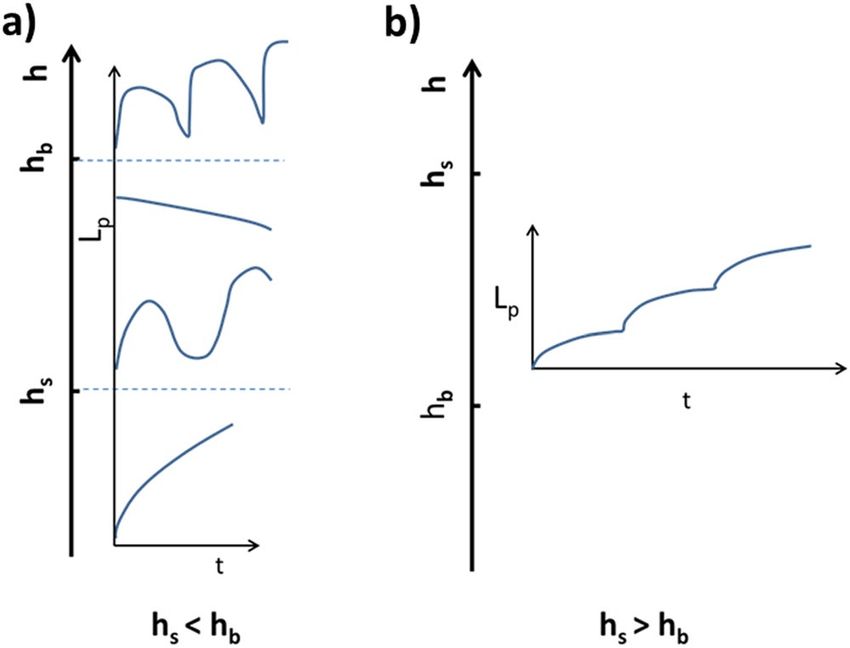
www.nature.com/scientificreports/
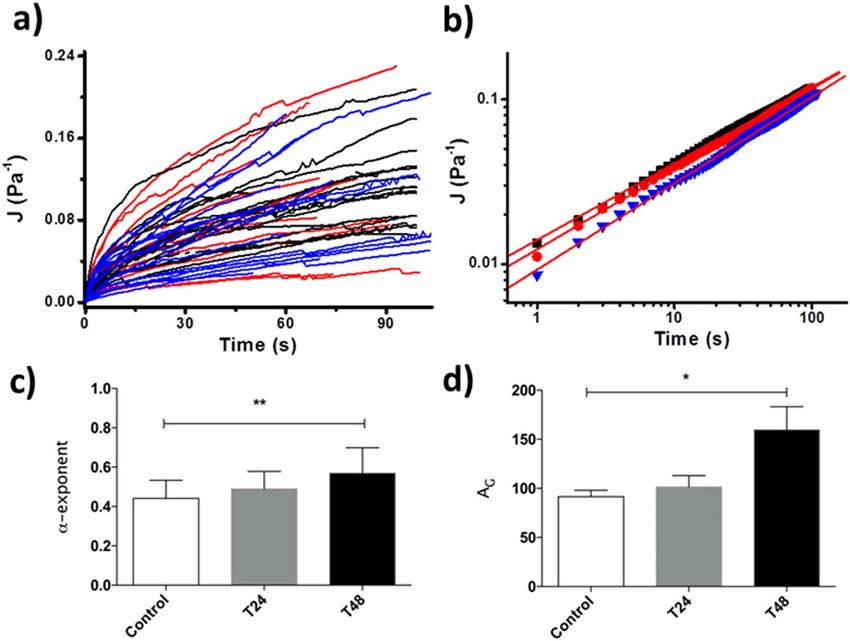
Figure 1. From (a) to (d): sequence of images (DIC contrast; scale bar =10 μm) of a K562 cell showing the
increase of the cell-protrusion length inside the micropipette after a pressure step of 30 Pa is applied by the
micropipette aspiration set-up. The time associated to each image is reported. The dashed black lines have
been introduced to mark the position of the cell protrusion in the different snapshots; (e) plot showing the
cell protrusion variation with time for several cells. The protrusion length variation is normalized to the
micropipette radius. The red line represents the averaged behavior. Inset: time variation of the measured
pressure difference in the micropipette aspiration set-up. (f) plot of the average curve reported in e; (g) Log-Log
representation of the average behavior for the control cells (the same as in f) to highlight the power-law fit to the
data (continuous red line).
in the Supplementary Information (Movies S1–5). Another type of behavior that we already mentioned is the
almost immediate retraction of the cell protrusion after the application of the pressure step. We also performed
a detailed analysis of the behavior at short time in the cases where the oscillatory behavior at longer time was
found. The analysis (see Fig. S7) shows that the power-law is a good model to describe the short time behavior of
the cell protrusion and the value of the α exponent that we found (we didn’t perform a statistical analysis for the
different incubation times) was in all cases higher than the value obtained for cells showing a power-law behavior
on a longer time scale.
We found that the percentage of cells following different behaviors changed in a way correlated with the OTC
incubation time. Table S1 in the Supplemental Material reports the percentage of the different cases for the differ-
ent incubation times we concentrated on whereas Fig. 4a shows the trends of the single types of behavior together
with a statistical analysis to determine the presence of significant differences between the different incubation
times and the control experiment (Fig. 4c). Considering that the trends of the single behaviors reported in Fig. 4a
are not able to show a clear trend, in Fig. 4b we reported the comparison between the number of cells undergoing
the power-law behavior and the number of cells showing behaviors ascribable to active mechanics (oscillatory,
saltatory or immediate retraction) as a function of the incubation time. We also included a sigmoidal fit to the two
groups of data. It is evident that the percentage of cells whose behavior could be described by a power-law relax-
ation process decreases as the OTC incubation time increases whereas the occurrence frequency for behaviors
ascribable to increased contraction of the acto/myosin complex rises.
In cases of cells showing a continuously growing protrusion inside the micropipette (well described by a power
law function) even after the exposition to OTC, we extracted an average behavior and we obtained the values for
the power-law exponent and for the stiffness parameter. We concentrated on the incubation times of 24 h and 48 h
compared to the control case. As shown in Fig. 5, cells presented an increase of the fluidity upon an increase of
the incubation time with OTC and also an increase of the stiffness parameter. The numerical values of the two dif-
ferent parameters for the different incubation times have been reported in Table S2. The differences we obtained
for the α exponent and the stiffness parameter between the control cells and the cells incubated in OTC for 48 h
are statistically significant, In Figure S8 we reported the distributions of the α and stiffness parameters for control
cells, cells incubated for 24 h and 48 h with OTC. At the same time, in Figure S9a we analyzed the correlation
SCIeNTIFIC ReporTS | (2018) 8:1219 | DOI:10.1038/s41598-018-19563-z 5www.nature.com/scientificreports/
Figure 2. Most commonly found behaviors for the cell protrusion once K562 cells are exposed to OTC and
they are subjected to a fast pressure jump. (a) oscillating behavior with no evidence of bleb formation; (b)
continuously growing cell projection which can be fitted by a power-law relationship; (c) oscillating behavior
with the formation of membrane blebs causing the rapid progression of the cell protrusion followed by a
retraction; (d) alternating phases of stability followed by positive increases of the cell projection. The inset in
each image represents the corresponding values of the applied pressure during cell creep analysis.
between the fluidity of cells and their stiffness parameter, We found that an increase of the fluidity is typically
associated with an increase of the cell stiffness. We also established that in the condition used for the experiments
there is no correlation between the radius of the cells and the obtained fluidity parameter (Figure S9b).
We previously reported that OTC causes the induction of apoptosis in human cell line K562 and in human
peripheral blood cells (PBMC)36,46. Here, we investigated the cytotoxic effect of OTC after incubation at shorter
time-scales (see the Materials and Methods section). As a marker for the apoptotic process we used the transloca-
tion of phospatidylserine to the external leaflet of the membrane exploited by the cells to increase the recognition
ability by macrophages. The results are reported in Fig. 6. Here, we confirmed the toxicity of OTC in terms of
apoptosis induction36. Notably, the pro-apoptotic effect of OTC seems to be stringently time-dependent: it was
evident from T15, clearly observed at T24 and frankly occurred at T48, as previously described36. In contrast,
the short incubation times with the drug (6 h and 9 h) provide a percentage of apoptotic cells very similar to the
untreated cells, used as negative control. In this regard, the Annexin staining on untreated cells represents the
physiological probability of naturally occurring apoptosis during K562 cell line culture.
To shed further light on the oscillating and retraction behavior of cells inside the micropipette at constant
applied pressure, we raised the hypothesis that this behavior was due to the contractile acto/myosin II complex
and we studied the possibility of removing the cell retraction behavior by using blebbistatin, a well-established
inhibitor of myosin II activity. Blebbistatin is known to leave myosin II in a configuration in which its head is not
able to bind to actin in order to exert its contractile activity51,52. When we found cells showing oscillating behav-
ior, we repeated the pressure jump protocol to be sure that the oscillations were not present just in the first run
(Figure S13). Then we injected blebbistatin in the chamber to reach a final concentration of 50 μM while applying
the lowest possible pressure (less than about 9 Pa), which assured keeping the cell in contact with the micropi-
pette. After 10 minutes to allow blebbistatin reaching a uniform concentration in the cell chamber, we applied the
pressure jump again. Figure 7 shows that after exposing the cell to blebbistatin, the oscillating behavior is removed
in favor of a continuous growth of the protrusion. Moreover, the creep behavior in the presence of blebbistatin is
well fitted by the power-law model with an exponent value of 0.29 ± 0.08 (mean ± SD on the basis of three exper-
iments – see Fig. S14). We also considered the possibility that incubating the cells with OTC in the presence of
blebbistatin could prevent the effect of OTC on the active behavior of the cells. Cells were incubated for 12 h in the
presence of both drugs. This experiments allowed also verifying that 50 µM blebbistatin is not toxic for our cells.
After the incubation, blebbistatin and OTC were removed from the medium and the cells were analyzed by MAT.
SCIeNTIFIC ReporTS | (2018) 8:1219 | DOI:10.1038/s41598-018-19563-z 6www.nature.com/scientificreports/
Figure 3. Snapshots representing the protrusion of a cell undergoing an oscillatory behavior. At time t = 0 s a
negative pressure step was applied to the cell. Each image shows the corresponding acquisition time after the
pressure step. The vertical dashed lines have been inserted to immediately get the cell protrusion position with
respect to the previous snapshot.
Even in this case, cells showed an increase in the frequency of the oscillatory behavior (see Fig. S15) highlighting
that blocking myosin is not effective in preventing the effect of OTC.
Discussion
There are well-established relations between the apoptotic process and the cytoskeleton, especially the actin net-
work53,54. Different apoptotic stages are characterized by large actin polymeric network reorganization. The most
evident structural reorganization is the increase of the cellular cortical tension due to the acto/myosin II con-
tractile system in the first stages of apoptosis. Myosin II light chain is increasingly phosphorylated leading to
an increased contractile activity55. This reorganization leads to the detachment of the plasma membrane from
the cortical cytoskeleton and the formation of membrane blebs. This process is controlled by the activity of Rho
GTPases or the Rho effector ROCK156. Apart from the initial stages of the apoptotic process, other cytoskeletal
SCIeNTIFIC ReporTS | (2018) 8:1219 | DOI:10.1038/s41598-018-19563-z 7www.nature.com/scientificreports/
Figure 4. (a) Variation of the percentage of cells following the different behaviors as a function of the
incubation time in OTC; (b) Sigmoidal fits to the data representing the percentage of cells undergoing the
power-law behavior and percentage of cells undergoing the oscillatory, saltatory or immediate retraction
behavior as a function of the incubation time; (c) histograms showing percentage of cells exhibiting the
different behaviors reported in Table 1 for the different incubation times in OTC (control – no OTC incubation;
T6-6 h; T9-9 h; T12-12 h; T16-16 h; T18-18 h, T24-24 h, T48-48 h) (****p < 0.0001). Data were analyzed using
GraphPad Prism 6 software (GraphPad Software, Inc., La Jolla, CA, USA). The Chi-squared test was used for
cell protrusion behaviors. *p < 0.05 was considered significant. A significant difference among the different cell
treatments (incubation times in OTC) was observed with respect to the control (no incubation with OTC).
Figure 5. (a) Plot of the cell protrusion creep compliances as a function of the incubation time in OTC: control
(untreated cells) (black curves), 24 h (red curves), 48 h (blue curves); (b) averaged curves of the Log-Log plots
of the behaviors in a). The red continuous lines are the fit with the power-law relation. (c) Statistical analysis of
the value of the α- exponent corresponding to different incubation times in OTC (control, T24-24 h; T48-48 h)
(mean ± SEM). In the case of control vs T48 we obtain **p < 0.01 (Kruskal-Wallis test). (d) Statistical analysis
of the value of the stiffness parameter corresponding to different incubation times in OTC (control, T24-24 h;
T48-48 h) (mean ± SEM). In the case of control vs T48 we obtain *p < 0.1 (Kruskal-Wallis test).
processes, such as actin depolymerization, play a fundamental role for the last stage of apoptosis. Many drugs
that are active on the actin cytoskeleton have been demonstrated to induce apoptotic processes on specific cell
types54 with a relevant role played by the altered cytoskeletal actin dynamics. Caspases are known to be also active
on proteins such as Actin Binding Proteins (ABP), which establish connections between the cortical cytoskeletal
SCIeNTIFIC ReporTS | (2018) 8:1219 | DOI:10.1038/s41598-018-19563-z 8www.nature.com/scientificreports/
Figure 6. Panel a refers the Apoptosis induction evaluated as fluorescence intensity of fluorescein
isothiocyanate–Annexin V-staining in one representative experiment. The histogram plots show the staining
peaks in the different conditions for the K562 cell line cultures (Control = untreated cells; T6-T48 = OTC
incubation for 6 h, 9 h, 15 h, 24 h, 48 h, respectively; H2O2 = represents the positive control of apoptosis
induction on K562(see Materials and methods). The percentages of the K562 cells labeled with Annexin V
are reported in each histogram plots. The amount of the apoptosis induction is related to the shifting to the
right of the peak on the x-axis; Panel b refers the bar graph data (mean (percentage) ± SD) of the 3 performed
experiments based on Annexin V staining for apoptosis evaluation. Control represents the untreated cells and
refers to the apoptosis background (growth medium without OTC); T6-T48 represent the apoptosis evaluation
at the different incubation times of the K562 cell line in a growth medium with the addition of OTC. As positive
control of apoptosis induction is reported the effect of H2O2 (see Materials and methods). Thestatistical
significance of each incubation time vs the negative control (untreated cells) is indicated with asterisk (P ≤
0.005, with Paired T Test).
SCIeNTIFIC ReporTS | (2018) 8:1219 | DOI:10.1038/s41598-018-19563-z 9www.nature.com/scientificreports/
Figure 7. Effect of blebbistatin on K562 cell exposed to OTC and showing an oscillation behavior. (a) The black
squares represent the behavior of the protrusion of a cell exposed for 6 h to OTC. After 200 s the pressure jump
is removed and the pressure is taken back to the initial value. The red triangles represent the behavior of the
same cell after it has been exposed to 50 μM blebbistatin for 10 min; The inset reports the corresponding values
of the pressure drop during the creep analysis before blebbistatin injection; (b) Log-Log plot of the cell in (a)
after it has been exposed to blebbistatin.
layer and the membrane. If these connections are removed, blebbing of the plasma membrane gets much more
probable in the presence of small pressure differences between the inside and outside of the cell.
According to the strong relation between the apoptotic process and the cytoskeleton structure, it is reasonable
to expect specific mechanical signatures in cells undergoing apoptosis. For example, Lam et al.57 demonstrated
that the first stages of apoptosis for suspended cells are characterized by a marked increase of the cell stiffness. In
the case of adherent cells the relation between cell mechanical properties and apoptosis has been studied using
AFM by Pelling et al.58. The authors found that apoptosis induced by staurosporine is connected to an organized
cell mechanical alteration characterized by a non-monotonic trend. After an initial rapid decrease of the cell
Young modulus, an increase is observed again followed by a continuous decrease.
In the literature, cases in which cells kept at constant applied stress show a reaction corresponding to active
behavior have already been reported. Using a microfluidic optical stretcher, Chan et al.59 showed that in the
case of HL60 cells, a temperature higher than 52 °C induces an active retraction of the cells after the initial
deformation. The initial temperature increase induced an increase of cellular fluidity but above 52 °C, a trend
inversion was observed at longer time-scales. This behavior has been explained by the increased activity of
temperature-sensitive Ca2+ channels. Intracellular calcium is then able to increase the activity of myosin II intro-
ducing an active behavior of the cells.
When a cell is aspirated inside a micropipette, the state of the acto/myosin cortical layer plays an important
role in establishing the way in which the cell react and the activity of myosin II is fundamental to resist the defor-
mation. Typically, the cortical layer has a thickness spanning from 100 nm to 1 μm and the contractility due to
myosin II is due to different aspects: its abundance in the layer, the binding affinity with actin and its phosphoryl-
ation state. The cortical tension is a combination of viscoelastic contributions due to the dynamic activity, polym-
erization and depolymerization, of the cortical actin, and contributions due to the contractile activity of myosin
II. It has been found that the myosin II/actin bond can be modeled as a catch-bond, implying an increase of the
affinity when a force trying to break the bond increases34. An increase of the force applied to the bond could be
the result of a dilation strain in the cell cap inside the micropipette. In this context, by modeling cell deformation
in a micropipette subjected to a negative pressure it has been established that the cap region is the area where
the dilation strain is concentrated34. The increased affinity of myosin II in this particular cell region induces a
local accumulation of the molecular motor and this could increase the cortical tension leading to a retrograde
movement of the cell protrusion at constant applied pressure. Once the strain decreases, the affinity of myosin for
actin could decrease again, inducing a reduction of its accumulation in the cap region34. As a consequence, the
protrusion will start to increase again and an oscillatory behavior could be established. Apart from this explana-
tion for the oscillatory behavior, another mechanism is possible. In fact, it is possible that the increased cortical
tension could induce the detachment of the plasma membrane from the cortical actin with the formation of blebs.
The higher the activity of myosin II is, the higher the probability that this event occurs. In fact, we observed an
increased probability of cell blebbing when cells have been exposed to OTC compared to the control. Once a bleb
is formed, the cell protrusion inside the micropipette undergoes a fast inward movement and the membrane is no
more able to transmit the force to the cortical actin. What happens after a plasma membrane bleb has formed has
been thoroughly studied60. The presence on the plasma membrane of nucleation sites for the actin cytoskeleton
induces, immediately after a bleb is formed, actin polymerization underneath the membrane and the rapidly
growing actin network produces a contraction of the membrane bleb, taking it back to the rest of the cortex.
The continuously growing actin network can once again induce an increase of the cortical tension reaching the
threshold where another bleb starts. By this mechanism, an oscillatory behavior due to bleb formation could
be produced. We think that the difference between the two cyclic behaviors is marked by the kinetics of the cell
protrusion increase. Indeed, in the case of large bleb formation the protrusion increase is very fast and the plot
SCIeNTIFIC ReporTS | (2018) 8:1219 | DOI:10.1038/s41598-018-19563-z 10www.nature.com/scientificreports/
Figure 8. Phase diagram for the possible behaviors of the cell protrusion inside the micropipette as a function
of the thickness of the cortical layer, h, with respect to the critical thicknesses. The different lines represent the
trend of the cell projection Lp as a function of time, t. (a) Case in which the threshold thickness for protrusion
retraction, hs, is lower than the thickness threshold for plasma membrane detachment from the actin cortex,
hb. From the top: cell oscillations with large bleb formation, instantaneous retraction; oscillations with no bleb
formation, continuous growth. (b) Case in which hs is bigger than hb. Saltatory behavior: tongue increases to a
stationary situation followed by a new increase
showing the tracking of the protrusion inside the micropipette forms a sort of cuspid in the lower portions (see
Fig. 2c) whereas, without plasma membrane detachment the plot is smoother (see Fig. 2a).
In a very interesting paper Brugués et al.61 developed a model to explain the different behaviors which can be
observed when cells are exposed to a negative pressure jump inside a micropipette. Starting from the equilibrium
condition between the cortical tension and the applied pressure given by61:
σmyoh = ΔPRP /2 (4)
where σmyo is the contractile stress of myosin and h is the cortical thickness (the product on the left side represents
the cortical tension). If the equilibrium situation is not satisfied there will be a movement of the cell protrusion
(see Supplementary Material). In particular, the increase of the first member of Equation 4 could produce a
retraction of the cell tongue. Here we neglected the contribution coming from the plasma membrane tension
(from the lipids), which is negligible with respect to the cortical one. This condition determines a threshold value
for the cortical thickness, hs, above which a retraction behavior is produced. In ref.61 it has also been considered
that there is a limit value for the force, fb⁎, the bond between the cortical actin and the plasma membrane can
sustain before a bleb is formed. This threshold limit depends on the state of the molecules assuring this kind of
binding and once again on the myosin activity. The threshold force is connected to another thickness threshold
for the cortical actin, hb, over which blebs are formed (cortex detaches). The two limits are given by the following
expressions61:
ΔPRP /2
hs =
σmyo (5)
fb⁎ RP /2
hb =
σmyoξ 2 (6)
where ξ represents the mesh size for the cortical actin. Depending on the myosin activity these two threshold
values might change and they can affect the behavior of the cell protrusion. Brugués et al. obtained a sort of phase
diagram representing these different situations. A phase diagram slightly modified with respect to the one
reported in Brugues et al. is reproduced in Fig. 861. We modified the phase diagram by inserting a state in which
an oscillation behavior is present also in the presence of cytoskeletal attachment to the plasma. The driving force
for these oscillations comes from the strain dependent actin/myosin II affinity as explained above34. Among the
different possible behaviors there is the continuous growth of the projection length which occurs when the corti-
cal thickness doesn’t exceed the critical thicknesses together with the condition hb > hs. A low value of the myosin
activity could increase hs and hb values assuring a cell cortical thickness value lower than hs. This is the situation
we mainly observed for control K562 cells. In these cases we found that a power-law relation can describe the cell
mechanics. The same behavior has already been found for the same type of cells26. The feature for the exponent we
obtain is 0.44 ± 0.02 whereas the cell stiffness at t0 = 1 s is 91 ± 6 Pa. Other behaviors are observed for control cells,
but in a limited number of cases (see Table S1) that could represent the normal percentage of apoptotic cells in an
untreated population. The main result of the investigation of the cells, which have been exposed to OTC, is that
SCIeNTIFIC ReporTS | (2018) 8:1219 | DOI:10.1038/s41598-018-19563-z 11www.nature.com/scientificreports/
other behaviors for the cell protrusion inside the micropipette appear and the percentages of cells following each
behavior change with the incubation time in OTC. In particular, when increasing the incubation time in OTC, a
higher number of cells is subjected to an oscillating behavior. This trend could be explained on the basis of a
strong increase of the myosin II activity that could be associated with the rising of the apoptotic process. Starting
from 6 hours of OTC incubation, a significant variation with respect to the control condition is found. When
increasing the incubation time, the saltatory behavior seems to become the prevalent one. In this case hs is larger
than hb. This condition could be obtained in different ways. One possibility is to increase the aspiration pressure.
Another possibility is associated to the decrease of the limit force before the detachment of the plasma membrane
from the actin cortex fb⁎. Considering that the experiments have been performed using the same pressure-jump
value, we speculate that the apoptotic process could affect the proteins, which are involved in keeping the actin
cortex anchored to the plasma membrane. It has been shown that ERM (Ezrin/Radixin/Moesin) proteins, which
are responsible for the actin-cortex/plasma membrane attachment, migrate from the plasma membrane to the
cytoplasm during the first stages of the apoptotic process62.
In the case of OTC exposure, a variable fraction of cells still continued to show a power-law behavior. For
specific incubation times (control, 24 h and 48 h) we averaged all the curves recorded on cells showing this behav-
ior. We noticed (Fig. 5) that the cells become more fluid when exposed to OTC (the exponent α increases). This
behavior could suggest augmented fluidity as a consequence of an increased activity of myosin II. Table S2 reports
the analysis of the curves for the different incubation times giving the values for the fluidity and the cell stiffness
parameters. Together with an increase of the α value we observed an increase of the stiffness parameter measured
at 1 s. Considering the relationship between the α exponent and the stiffness, different results are present in the
literature. Experimental approaches based on Micropipette Aspiration showed that the increase of the fluidity
parameter is typically associated to an increase of the stiffness parameter (see for example: ref.25). It is like a cell
becoming stiffer at short time is also more able to flow. This is the same trend that we observed in our case. Using
other techniques such as microfluidic approaches where cells are induced to pass through microconstrictions by
the application of high pressure, pieces of evidence have been found concerning the presence of a master equa-
tion connecting an increase of the fluidity parameter to a decrease of cell stiffness (see for example: ref.26). This
behavior is opposite to the one we found in our case. We think that the difference in the two behaviors could be
connected to the fact that the two techniques consider very different time scales for the cell deformation (seconds
in the case of micropipette aspiration and milliseconds in the case of microfluidic approaches).
It has already been proposed that the contractile activity of myosin II could help disentangling an actin net-
work63 especially at longer time-scale (a few seconds). Accordingly, an augmented myosin II activity, as expected
in the very first stages of the apoptotic process, could be the reason for the increase of the cell fluidity, similarly
to the increased fluidity observed for high temperature. Another possible reason for the increased fluidity when
myosin II activity is enhanced is connected to the depolymerization of actin filaments64. The difference between
the two possibilities, disentangling activity and depolymerization process, could be related to the time-scale of the
effect. If the effect is observed at short time-scales (in the milliseconds range) myosin II could not have enough
time to induce a disentanglement of the actin network. If the effects are present only for longer time-scales (in the
range of seconds) the disentanglement phenomenon could be the prevailing one. According to this consideration
we think that the increased activity of myosin II in the very initial stage of apoptosis could produce a disentangle-
ment effect on the actin network resulting in enlarged cell fluidity.
Conclusions. We showed that a drug (Ossitetraciclina liquida 20% - OTC), which is known to induce apop-
tosis in a specific cell model in-vitro, is also able to affect the mechanical phenotype of the same cells. By using
the Micropipette Aspiration Technique, we found that the cells become more fluid when exposed for increased
time-intervals to OTC and the probability of an active behavior was enhanced, manifested by a retrograde move-
ment of the cell tongue inside the micropipette while aspirated by a constant pressure difference. Cell behavior
analyzed by MAT changed significantly with respect to control cells after an incubation time of just 6 h, whereas,
by using the Annexin V marker, a variation from the control cells is observed for incubation times of 15 h or
longer. All the mechanical phenomena we observed could be traced back to an increased activity of the myosin
II molecular motor. Considering that in the first stages of the apoptotic process myosin II activity is increased
we proposed that what we observed is due to the initial phases of the apoptotic process. The obtained results also
suggest that the mechanical phenotyping of living cells could be exploited to detect the early stages of pathological
processes.
References
1. Suresh, S. Biomechanics and biophysics of cancer cells. Acta Biomater 3, 413–438, https://doi.org/10.1016/j.actbio.2007.04.002
(2007).
2. Suresh, S. et al. Connections between single-cell biomechanics and human disease states: gastrointestinal cancer and malaria. Acta
Biomater 1, 15–30, https://doi.org/10.1016/j.actbio.2004.09.001 (2005).
3. Fabry, B. et al. Selected contribution: time course and heterogeneity of contractile responses in cultured human airway smooth
muscle cells. J Appl Physiol (1985) 91, 986–994 (2001).
4. Alessandrini, A. & Facci, P. AFM: a versatile tool in biophysics. Measurement Science and Technology 16, 65–92 (2005).
5. Kuznetsova, T. G., Starodubtseva, M. N., Yegorenkov, N. I., Chizhik, S. A. & Zhdanov, R. I. Atomic force microscopy probing of cell
elasticity. Micron 38, 824–833, https://doi.org/10.1016/j.micron.2007.06.011 (2007).
6. Puig-De-Morales, M. et al. Measurement of cell microrheology by magnetic twisting cytometry with frequency domain
demodulation. J Appl Physiol 91, 1152–1159 (2001). (1985).
7. Mitchison, J. M. & Swann, M. M. The mechanical properties of the cell surface I. The cell elastimeter. Journal of Experimental Biology
31, 443–460 (1954).
8. Hochmuth, R. M. Micropipette aspiration of living cells. J Biomech 33, 15–22 (2000).
9. Wirtz, D. Particle-tracking microrheology of living cells: principles and applications. Annu Rev Biophys 38, 301–326, https://doi.
org/10.1146/annurev.biophys.050708.133724 (2009).
SCIeNTIFIC ReporTS | (2018) 8:1219 | DOI:10.1038/s41598-018-19563-z 12www.nature.com/scientificreports/
10. Guck, J. et al. The optical stretcher: a novel laser tool to micromanipulate cells. Biophys J 81, 767–784, https://doi.org/10.1016/S0006-
3495(01)75740-2 (2001).
11. Huber, F., Boire, A., Lopez, M. P. & Koenderink, G. H. Cytoskeletal crosstalk: when three different personalities team up. Curr Opin
Cell Biol 32, 39–47, https://doi.org/10.1016/j.ceb.2014.10.005 (2015).
12. Liu, B. P., Chrzanowska-Wodnicka, M. & Burridge, K. Microtubule depolymerization induces stress fibers, focal adhesions, and
DNA synthesis via the GTP-binding protein Rho. Cell Adhes Commun 5, 249–255 (1998).
13. Rape, A., Guo, W. H. & Wang, Y. L. Microtubule depolymerization induces traction force increase through two distinct pathways. J
Cell Sci 124, 4233–4240, https://doi.org/10.1242/jcs.090563 (2011).
14. Lu, L., Oswald, S. J., Ngu, H. & Yin, F. C. Mechanical properties of actin stress fibers in living cells. Biophys J 95, 6060–6071, https://
doi.org/10.1529/biophysj.108.133462 (2008).
15. Stamenovic, D. Effects of cytoskeletal prestress on cell rheological behavior. Acta Biomater 1, 255–262, https://doi.org/10.1016/j.
actbio.2005.01.004 (2005).
16. Rodriguez, M. L., McGarry, P. J. & Sniadecki, N. J. Review on Cell Mechanics: Experimental and Modeling Approaches. Applied
Mechanics Reviews 65, 060801–060801, https://doi.org/10.1115/1.4025355 (2013).
17. Lim, C. T., Zhou, E. H. & Quek, S. T. Mechanical models for living cells–a review. J Biomech 39, 195–216, https://doi.org/10.1016/j.
jbiomech.2004.12.008 (2006).
18. Schmid-Schonbein, G. W., Sung, K. L., Tozeren, H., Skalak, R. & Chien, S. Passive mechanical properties of human leukocytes.
Biophys J 36, 243–256, https://doi.org/10.1016/S0006-3495(81)84726-1 (1981).
19. Stamenovic, D. Rheological behavior of mammalian cells. Cell Mol Life Sci 65, 3592–3605, https://doi.org/10.1007/s00018-008-
8292-y (2008).
20. Yeung, A. & Evans, E. Cortical shell-liquid core model for passive flow of liquid-like spherical cells into micropipets. Biophys J 56,
139–149, https://doi.org/10.1016/S0006-3495(89)82659-1 (1989).
21. Hoffman, B. D. & Crocker, J. C. Cell mechanics: dissecting the physical responses of cells to force. Annu Rev Biomed Eng 11, 259–288,
https://doi.org/10.1146/annurev.bioeng.10.061807.160511 (2009).
22. Stamenovic, D., Fredberg, J. J., Wang, N., Butler, J. P. & Ingber, D. E. A microstructural approach to cytoskeletal mechanics based on
tensegrity. J Theor Biol 181, 125–136, https://doi.org/10.1006/jtbi.1996.0120 (1996).
23. Alcaraz, J. et al. Microrheology of human lung epithelial cells measured by atomic force microscopy. Biophys J 84, 2071–2079,
https://doi.org/10.1016/S0006-3495(03)75014-0 (2003).
24. Fabry, B. et al. Scaling the microrheology of living cells. Phys Rev Lett 87, 148102, https://doi.org/10.1103/PhysRevLett.87.148102
(2001).
25. Zhou, E. H., Quek, S. T. & Lim, C. T. Power-law rheology analysis of cells undergoing micropipette aspiration. Biomech Model
Mechanobiol 9, 563–572, https://doi.org/10.1007/s10237-010-0197-7 (2010).
26. Lange, J. R. et al. Microconstriction arrays for high-throughput quantitative measurements of cell mechanical properties. Biophys J
109, 26–34, https://doi.org/10.1016/j.bpj.2015.05.029 (2015).
27. Maloney, J. M. & Van Vliet, K. J. Chemoenvironmental modulators of fluidity in the suspended biological cell. Soft Matter 10,
8031–8042, https://doi.org/10.1039/c4sm00743c (2014).
28. Maloney, J. M., Lehnhardt, E., Long, A. F. & Van Vliet, K. J. Mechanical fluidity of fully suspended biological cells. Biophys J 105,
1767–1777, https://doi.org/10.1016/j.bpj.2013.08.040 (2013).
29. Surcel, A. et al. Pharmacological activation of myosin II paralogs to correct cell mechanics defects. Proc Natl Acad Sci USA 112,
1428–1433, https://doi.org/10.1073/pnas.1412592112 (2015).
30. Darling, E. M. & Di Carlo, D. High-Throughput Assessment of Cellular Mechanical Properties. Annu Rev Biomed Eng 17, 35–62,
https://doi.org/10.1146/annurev-bioeng-071114-040545 (2015).
31. Rosenbluth, M. J., Lam, W. A. & Fletcher, D. A. Analyzing cell mechanics in hematologic diseases with microfluidic biophysical flow
cytometry. Lab Chip 8, 1062–1070, https://doi.org/10.1039/b802931h (2008).
32. Adamo, A. et al. Microfluidics-based assessment of cell deformability. Anal Chem 84, 6438–6443, https://doi.org/10.1021/ac300264v
(2012).
33. Mohan, K., Luo, T., Robinson, D. N. & Iglesias, P. A. Cell shape regulation through mechanosensory feedback control. J R Soc
Interface 12, 20150512, https://doi.org/10.1098/rsif.2015.0512 (2015).
34. Luo, T., Mohan, K., Iglesias, P. A. & Robinson, D. N. Molecular mechanisms of cellular mechanosensing. Nat Mater 12, 1064–1071,
https://doi.org/10.1038/nmat3772 (2013).
35. Ruggiero, G. et al. A case of myelodysplastic syndrome associated with CD14(+)CD56(+) monocytosis, expansion of NK
lymphocytes and defect of HLA-E expression. Leuk Res 33, 181–185, https://doi.org/10.1016/j.leukres.2008.03.019 (2009).
36. Odore, R. et al. Cytotoxic effects of oxytetracycline residues in the bones of broiler chickens following therapeutic oral administration
of a water formulation. Poult Sci 94, 1979–1985, https://doi.org/10.3382/ps/pev141 (2015).
37. Graham, F. et al. Risk of allergic reaction and sensitization to antibiotics in foods. Ann Allergy Asthma Immunol 113, 329–330,
https://doi.org/10.1016/j.anai.2014.06.029 (2014).
38. Di Cerbo, A. et al. Behavioral Disturbances: An Innovative Approach to Monitor the Modulatory Effects of a Nutraceutical Diet. J
Vis Exp, https://doi.org/10.3791/54878 (2017).
39. Di Cerbo, A., Pezzuto, F., Canello, S., Guidetti, G. & Palmieri, B. Therapeutic Effectiveness of a Dietary Supplement for Management
of Halitosis in Dogs. J Vis Exp, e52717, https://doi.org/10.3791/52717 (2015).
40. Sechi, S. et al. Effects in dogs with behavioural disorders of a commercial nutraceutical diet on stress and neuroendocrine
parameters. Vet Rec 180, 18, https://doi.org/10.1136/vr.103865 (2017).
41. Czeizel, A. E. & Rockenbauer, M. A population-based case-control teratologic study of oral oxytetracycline treatment during
pregnancy. Eur J Obstet Gynecol Reprod Biol 88, 27–33 (2000).
42. Glette, J., Sandberg, S., Haneberg, B. & Solberg, C. O. Effect of tetracyclines and UV light on oxygen consumption by human
leukocytes. Antimicrob Agents Chemother 26, 489–492 (1984).
43. Potts, R. C. et al. Some tetracycline drugs suppress mitogen-stimulated lymphocyte growth but others do not. Br J Clin Pharmacol
16, 127–132 (1983).
44. Van den Bogert, C. & Kroon, A. M. Effects of oxytetracycline on in vivo proliferation and differentiation of erythroid and lymphoid
cells in the rat. Clin Exp Immunol 50, 327–335 (1982).
45. Myers, M. J., Farrell, D. E. & Henderson, M. In vitro modulation of bovine blood neutrophils and mononuclear cells by
oxytetracycline. Am J Vet Res 56, 1007–1011 (1995).
46. Di Cerbo, A. et al. Toxicological Implications and Inflammatory Response in Human Lymphocytes Challenged with Oxytetracycline.
J Biochem Mol Toxicol 30, 170–177, https://doi.org/10.1002/jbt.21775 (2016).
47. Vermes, I., Haanen, C., Steffens-Nakken, H. & Reutelingsperger, C. A novel assay for apoptosis. Flow cytometric detection of
phosphatidylserine expression on early apoptotic cells using fluorescein labelled Annexin V. J Immunol Methods 184, 39–51 (1995).
48. De Vitis, S. et al. Tyr phosphatase-mediated P-ERK inhibition suppresses senescence in EIA+ v-raf transformed cells, which,
paradoxically, are apoptosis-protected in a MEK-dependent manner. Neoplasia 13, 120–130 (2011).
49. Theret, D. P., Levesque, M. J., Sato, M., Nerem, R. M. & Wheeler, L. T. The application of a homogeneous half-space model in the
analysis of endothelial cell micropipette measurements. J Biomech Eng 110, 190–199 (1988).
SCIeNTIFIC ReporTS | (2018) 8:1219 | DOI:10.1038/s41598-018-19563-z 13You can also read