Taking Stock With Teens - 20+ Years Of Researching U.S. Teens GenZ Insights - DECA Inc
←
→
Page content transcription
If your browser does not render page correctly, please read the page content below

SPRING 2021

           Taking Stock
           With Teens                                                                          ®

           20+ Years Of Researching U.S. Teens
           GenZ Insights

Piper Sandler does and seeks to do business with companies covered in its research reports. As a result, investors should be aware that the firm may have a conflict of interest
that could affect the objectivity of this report. Investors should consider this report as only a single factor in making their investment decisions. This report should be read in
conjunction with important disclosure information, including an attestation under Regulation Analyst Certification, found on pages 84 - 86 of this report or at the following site:
http://www.pipersandler.com/researchdisclosures.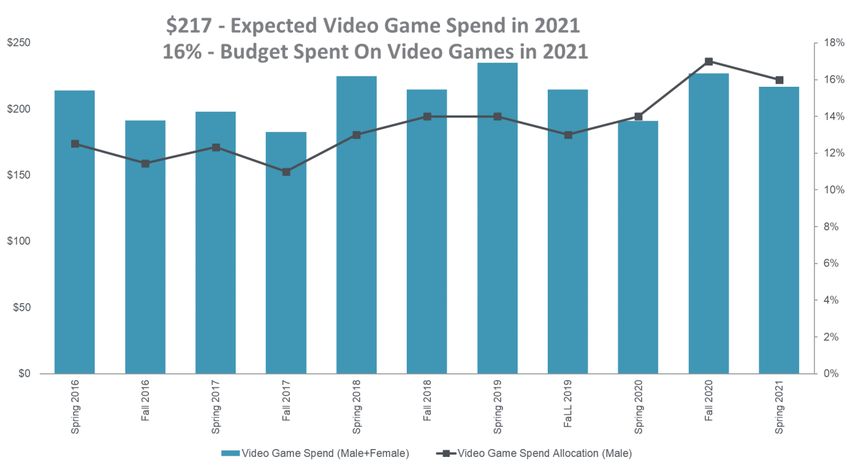
Investment Risks

Risks to achievement of investment objectives include, but are not limited to, the following:
   •   Reliance on key top management
   •   Changing consumer preferences
   •   Changes in input costs and raw materials
   •   Markdown risks
   •   Product flow and inventory disruptions
   •   Competition
   •   Lack of pricing power
   •   Deleveraging of fixed expenses
   •   Foreign exchange rate risk
   •   General macroeconomic uncertainty

                                                                             Taking Stock With Teens Survey - Spring 2021 Results   | 2
Table Of Contents

01                    02                        03                                04
Executive             Teen Behavior &           Teen Brand                        Demographics &
Summary               Habits                    Preferences                       Appendices

• Demographics        • Gen Z Insights          • Historic No. 1 Ranks              • Survey Demographics
• Key Takeaways       • Top Social Media        • Apparel & Footwear                • Spending Breakdown
• COVID-19 Insights   • Spending Trends         • Top Fashion Trends                  & Channel Trends

• Stock Highlights    • Channel Preferences     • Up- & Downtrending                • Top Brand Time Series

                      • Secondhand & Rental     • Accessories                       • Top Athletic Brands

                      • Fashion Casualization   • Beauty                            • Social Media History

                      • Content Consumption     • Websites                          • Content Consumption
                                                                                      History
                      • Video Games             • Restaurants
                                                                                    • Meet Our Senior
                      • Payment Preferences     • Snacks                              Analyst Team
                      • Cryptocurrency          • Plant-Based Meat
                      • Smartphone Trends

                                                        Taking Stock With Teens Survey - Spring 2021 Results   | 3
41st Semi-Annual Proprietary GenZ Research Project

   7,000   16.1                                                   TEENS
                                                                  SURVEYED
                                                                                                 AVERAGE AGE         51%                                           47%

   47                            U.S.
                                 STATES
                                                                                                                                 MALE   FEMALE      NON-BINARY
                                                                                                                                                                   2%

   $76,750
       AVERAGE HOUSEHOLD INCOME
                                                                                                                                                                       22%

                                                                                                                     48%                                               20%

   33%
Survey is executed in partnership with DECA
                                                       TEENS CURRENTLY
                                                       PART-TIME EMPLOYED

The source for all charts/tables within this report is Piper Sandler.
                                                                                                                         SOUTH      WEST     MIDWEST       NORTHEAST
                                                                                                                                                                       10%

                  Executive Summary                                     Teen Behavior & Habits          Teen Brand Preferences             Demographics & Appendices

                                                                                                               Taking Stock With Teens Survey - Spring 2021 Results    | 4
Key Takeaways – Demographics & Spending
•   Our 41st semi-annual Taking Stock With Teens survey was conducted between February 19 and March 24

•   Regional responses were 48% in the South (vs. 42% Fall); NE at 10% (same as Fall)

•   33% of teens hold a part-time job – unchanged from Fall 2020 but below the 37% level in Spring 2020

•   This Spring, in-class participation rose to 29% – above the 24% last Fall; 42% of teens are fully virtual however

•   69% of teens plan to take the vaccine when it is their turn (up from 64% in Fall)

•   Teen “self-reported” spending improved slightly to $2,165 – up 1% sequentially; parent contribution was 61%

•   Female spend inflecting for clothing +9% Y/Y, strongest Y/Y gain since 2015 (male spending still down)

•   Areas of wallet share expansion included: Clothing & Accessories (especially for females); Food is No. 1 priority

•   Areas of wallet share contraction included: Concerts/Events & Car (remains below multi-year average)

•   Skincare spending for females ahead of makeup spending; seeing modest recovery in overall beauty wallet

•   Over the next six months, consumer intent to fly on a plane moved up from 33% to 48%

•   Teens allocate 8% of their shopping time to secondhand; 47% of teens have purchased & 55% have sold secondhand

•   Food returns as teens’ No. 1 wallet priority at 23% share, up from 21% in Fall 2020 but down from 25% LY

        Executive Summary             Teen Behavior & Habits         Teen Brand Preferences            Demographics & Appendices

                                                                            Taking Stock With Teens Survey - Spring 2021 Results   | 5
Key Takeaways – Brand & Preference Rankings
•   Chick-Fil-A is No. 1 restaurant; Chipotle No. 3 gained 300 bps of share to 11% (vs. 8% LY); Starbucks remained No. 2

•   15% of teens consume plant-based meat with Impossible Foods & Beyond Meat tied as the No. 1 choice

•   Video games are 9% of teen wallet share vs. 8% LY; 53% expect to purchase a NextGen console & 4% already own

•   Teens spend 32% of their daily video consumption on Netflix followed by YouTube (31%); Prime & Other streaming gain

•   Cash is (still) king for teens as top payment method followed by Apple Pay; Venmo is the most used payment app

•   9% of teens claim to have traded cryptocurrency; 81% of these teens are male

•   56% of teens cite Amazon as their No. 1 favorite e-com site; SHEIN took No. 2 spot (7% share; +500 bps Y/Y)

•   Nike is the No. 1 fashion brand for teens—up 200 bps Y/Y; Nike is the No. 1 footwear brand—up 900 bps Y/Y

•   Ulta gained 700 bps share Y/Y as No. 1 beauty destination with 46% share; Sephora stabilized; Amazon lost share

•   Handbag spending improved to $93—up 4% Y/Y and up 7% sequentially, reversing a multi-year low; LV remained No. 1

•   88% of teens own an iPhone and 90% expect an iPhone to be their next phone. Both are new all-time highs

•   Snapchat is the favorite social media platform (31% share) followed by TikTok (30%) & Instagram (24%, -700 bps Y/Y)

•   Teens’ favorite celebrity is Kevin Hart and most followed influencer is David Dobrik

        Executive Summary             Teen Behavior & Habits         Teen Brand Preferences            Demographics & Appendices

                                                                            Taking Stock With Teens Survey - Spring 2021 Results   | 6
COVID-19 Insights
                                         Employment Impact                            Lockdown Unlocked
                                                                                     In the Next 6 Months…
                                          Did COVID-19 impact
                                          your part-time job or                      78% Plan to visit a retailer
                                             ability to work?                        (down from 81% in Fall)

                                                                                     81% Plan to dine-in
                                                 NO: 72%                             (up from 77% in Fall)

                                                 YES: 28%                            48% Expect to fly on a plane
                                                                                     (up from 33% in Fall)

                                                                                               42%
                                                                                     Returned to School Virtually

                                        69%
                                         Would take a Vaccine
                                                                                               29%
                                                                                     Returned to School In-Class

                                           when available                                      29%
                                                                                     Returned in a Hybrid Format

                                          COVID-19 Vaccine                                Back to School

    Executive Summary   Teen Behavior & Habits              Teen Brand Preferences            Demographics & Appendices

                                                                   Taking Stock With Teens Survey - Spring 2021 Results   | 7
Stock Highlights: Global Lifestyle Brands
Erinn Murphy, Managing Director | Sr. Research Analyst

                            NKE (+) NIKE CONTINUES TO GAIN SHARE AS NO. 1 APPAREL & FOOTWEAR BRAND
                            Nike has been the No. 1 apparel brand in our survey for 10 and a half years and further strengthened its lead
                            at 27% share—up 200 bps vs. LY. More impressive, as a preferred footwear brand, Nike represents 56% of
                            teen preference gaining a substantial 900 bps share. Nike ranks as the top trend for male teens with popular
     OW, PT $170            responses including AirForce 1s & Jordans. It is the No. 1 preferred athletic apparel & footwear brand for
                            teens.

                            LULU (+) NEW BRAND PEAK AS LULU BREAKS INTO THE NO. 4 APPAREL BRAND
                            lululemon is the No. 4 preferred apparel brand in our survey—moving up from No. 6 in Spring 2020. Among all
                            females, it ranked No. 4 but gained 200 bps Y/Y. Among upper-income females, it ranks No. 2 (behind
                            PacSun) at 10% share. It ranked No. 10 among upper-income males vs. No. 7 last year. Leggings/lululemon
                            are the No. 1 trend for females in school. lululemon is the No. 2 athletic apparel brand for upper-income teens
                            and the No. 3 athletic apparel brand for average-income teens (gaining 300 bps Y/Y).
     OW, PT $465

                            UAA (+) IMPROVING BRAND PREFERENCE ACROSS THE BOARD
                            Under Armour’s brand saw green shoots across the survey. In addition to climbing back into the top-ten
                            footwear brands for all teens (the first time since Fall 2019 and ahead of its No. 14 rank last year), it moved to
                            the No. 4 apparel brand for all male teens—up from No. 10 last year. While still cited as the brand “no longer
                            worn” by male teens—its % share improved, moving down from 23% last year to 17% this year. Finally, as a
     OW, PT $28             preferred athletic brand, it ranked No. 4 among upper-income teens (+100 bps Y/Y) with improvement driven
                            by all genders.

        Executive Summary                  Teen Behavior & Habits              Teen Brand Preferences             Demographics & Appendices

                                                                                       Taking Stock With Teens Survey - Spring 2021 Results      | 8
Stock Highlights: Global Lifestyle Brands
Erinn Murphy, Managing Director | Sr. Research Analyst
ELF (+) REGISTERS ALL TIME HIGH IN SURVEY
e.l.f. is the No. 2 preferred makeup brand for all teens—up from No. 4 last year and marks its highest ranking
to-date in our survey. Consolidated mindshare over the last year has moved up from 5% to 10% and is within
8 votes for the No. 1 spot (Tarte). Among average-income teens, it ranks No. 1 at 12%—vs. 6% last year (No.
5). It ranks No. 4 among upper-income teens as a preferred makeup brand—vs. No. 10 last year.
OW, PT $30
CROX (+) ACCELERATES FOOTWEAR RANKING SEQUENTIALLY AND Y/Y
Crocs moved to the No. 8 spot--up from No. 12 in last Spring’s survey and a rebound from Fall’s No. 9 ranking.
Seasonally, Crocs ranks the best in our Fall surveys and lower in Spring given the time of year of the survey.
We believe the strong performance coming out of Winter in this Spring’s survey is an indication that teens are
turning to Crocs for year-round comfort. We saw higher interest among females vs. males and higher among
OW, PT $104 average-income (No. 7) vs. upper-income teens.
RVLV (+) GOING-OUT GAINS TRACTION; REVOLVE MOVES UP TO NO. 11 PREFERRED WEBSITE
96% of females claim to shop online vs. 88% last year vs. males at 92% TY vs. 91% last year. With stores
under pressure for the last year tied to COVID closures & restrictions, females have reprioritized their dollars
online at a quicker pace vs. males. As a preferred website among upper-income females, Revolve took the
highest spot since Spring 2018—ranking No. 11 brand preference, just one vote away from the top-10. This
OW, PT $53 improvement in rank compares to the No. 17 rank in Fall 2020 and the No. 13 rank in Spring 2020.
TPR (+) HANDBAG SPENDING STARTING TO REBOUND; TAPESTRY MINDSHARE STRENGTHENS
Handbag spending improved to $93—up 4% Y/Y and up 7% sequentially, reversing a multi-year low. Tapestry
was the most relevant portfolio company in our coverage as a preferred handbag capturing 27% of total vote--
the highest since Fall 2017. Kate Spade moved up to No. 3 at 14% share (+200 bps Y/Y) and Coach while No.
4, had 13% collective mindshare—up 100 bps Y/Y. Michael Kors’ mindshare continued to slip as a preferred
OW, PT $54 handbag.
Executive Summary Teen Behavior & Habits Teen Brand Preferences Demographics & Appendices
Taking Stock With Teens Survey - Spring 2021 Results | 9Stock Highlights: Packaged Foods
Michael Lavery, Director | Sr. Research Analyst
GIS (+) TEENS REPORT STRONGEST INTENTIONS TO CONSUME MORE NATURE VALLEY
Nature Valley was the eighth most preferred snack brand among teens, an improvement vs. not being a top
ten brand in the Fall 2020 survey. Of those who listed Nature Valley as their favorite brand, net 68% of teens
plan to eat more or the same amount of it over the next six months (% planning to eat more + same – less), the
highest amount for any of the top ten brands.
OW, PT $70
CPB (+) TEENS REPORT STRONG INTENTIONS TO CONSUME MORE GOLDFISH
Campbell’s Goldfish was the second most preferred snack brand by teens, with 9% of teens listing it as their
favorite (second only to Lays with 11%). Also, net 61% of teens who listed Goldfish as their favorite brand plan
to eat more or the same amount of it over the next six months (% planning to eat more + same – less), which
OW, PT $57 was the second highest among the top ten most preferred snack brands.
UTZ (+) INCREASE IN SHARE OF BRAND MENTIONS IS POSITIVE
As a share of favorite snack brand, mentions for Utz brands increased 60% since our Fall 2020 teen survey.
Utz is currently expanding distribution of its brands to new geographies and channels in the US. We believe
OW, PT $28 growing popularity of its brands among teens, coupled with distribution expansion, could position it well.
BYND (+) WILLINGNESS TO TRY PLANT-BASED MEAT INCREASED SINCE OUR LAST SURVEY
Younger consumers appear more open to trying plant-based meat. Of the teens we surveyed, 49% either
consume or are willing to try plant-based meat, up from 47% in our Fall 2020 teen survey. Of the teens who do
not consume plant-based meat, 40% are willing to try it, up from 35% in our Fall 2020 survey. Impossible was
Neutral, PT $125 the most preferred plant-based brand, followed closely by Beyond (both had 33% of mentions (with rounding)
among teens with a plant-based brand preference).
Executive Summary Teen Behavior & Habits Teen Brand Preferences Demographics & Appendices
Taking Stock With Teens Survey - Spring 2021 Results | 10Stock Highlights: Restaurants & Branded Hospitality
Nicole Miller Regan, Managing Director | Sr. Research Analyst
CMG (+) STEADY BRAND SCORES
Chipotle remains third most preferred brand among Upper Income teens (mindshare increased to 11% vs. 9%
in Fall 2020 vs. 8% in Spring 2020, 6% in Fall 2019, 8% in Spring 2019, 8% in Fall 2018, 7% in Spring 2018,
and 8% in Fall 2017). Chipotle experienced sequentially higher mind share levels among Average Income
teens (#3 at 5% in Spring 2020 vs. #4 at 4% in Fall 2020 vs. #6 at 3% in Fall 2019) and within the brand’s
historical range. We believe gaining Average Income mindshare presents the largest opportunity as marketing
efforts aid awareness. Chipotle continues to be most preferred at Hispanic cuisine level across both Upper and
OW, PT $2,000
Average income teens.
SBUX (=) REMAINS MOST PREFERRED PUBLIC COMPANY BRAND AMONG TEENS
Starbucks maintained double-digit mindshare among Upper Income teens (with 12% mindshare vs. 10%
mindshare in Fall 2020 vs. 12% in Spring 2020 vs. 11% in Fall 2019, 10% in Spring 2019, and 12% in
Spring/Fall 2018). However, preference remains muted vs. historical peak levels (18% Fall 2013 & Spring
2007; 16% Spring 2008; 15% Fall 2014 & Spring 2009 & Fall 2007). Among Average Income teens, Starbucks
maintained its No. 2 spot (with 10% mindshare vs. 8% in Spring 2020 and 10% in Fall 2019). We continue to
view Starbucks’ brand equity as relevant social currency and note it is the most preferred brand at the coffee
N, PT $104 cuisine level.
MCD (=) REMAINS TOP 5 BRAND OVERALL WHILE SEQUENTIAL MINDSHARE MOVES LOWER
McDonald’s maintained a top 5 brand ranking among both Upper and Average Income teens while mindshare
ticked lower sequentially to 4% among Average Income teens (as compared to 6% in all of 2020, 2019, and
Spring 2018 and vs. 7% Fall 2018) and notably the lowest mindshare ranking since Spring 2010. McDonald’s
continues to be most preferred within the Hamburger cuisine category across Average Income teens. Looking
forward, the brand’s recent efforts around celebrity-inspired meals and driving heightened levels of digital
N, PT $209 engagement could gain incremental traction with teens.
Executive Summary Teen Behavior & Habits Teen Brand Preferences Demographics & Appendices
Taking Stock With Teens Survey - Spring 2021 Results | 11Stock Highlights: Financial Technology & Internet
Chris Donat, Managing Director | Tom Champion, Director
PYPL (+) STRENGTH IN TEEN USAGE OF APPS AND BUY NOW PAY LATER (covered by Chris Donat)
The strength of PayPal’s apps relative to teens’ other payment apps surprised us. PYPL’s Venmo ranked #1
with teens who have used a payment app in the last month. Venmo’s 47% penetration rate was complemented
by the 34% penetration of PayPal Mobile Cash. For buy now pay later, PYPL was the leading offering with
teens with 33% penetration. This is the first time payments and BNPL questions were part of the teen survey.
OW, PT $300
SNAP (+) STILL DOMINANT AMONGST TEENS (covered by Tom Champion)
SNAP was again the #1 favorite app amongst teens, and #2 for engagement behind Instagram. While it did
lose some ground to TikTok, we are still confident in Snap’s popularity among teens going forward, as SNAP
users check the app 30x a day on average. It is also worth noting that 26% of Teens have purchased one item
directly from a social media site, and we view SNAP as being in a great position to capitalize on social
OW, PT $83
e-commerce going forward.
AMZN (+) CONTINUES TO BUILD ON MARKET LEADERSHIP (covered by Tom Champion)
AMZN is again the most widely used retailer among teens with 56% of respondents saying AMZN is their
favorite online retailer (compared to Shein at 7%). This is up from 53% in Spring 2020. The category
dominance in the teen segment is underappreciated, in our view. Prime household adoption rate was strong,
with an incremental ~5% of U.S. households getting a prime subscription over the prior year. Prime adoption
OW, PT $3,903 and the maturation of the teen cohort should serve as a powerful tailwind for many years to come.
Executive Summary Teen Behavior & Habits Teen Brand Preferences Demographics & Appendices
Taking Stock With Teens Survey - Spring 2021 Results | 12Stock Highlights: Semis; Infrastructure & Comm. Software
Harsh Kumar, Managing Director | James Fish, Director
AAPL (+) GROWING SHARE IN IPHONE CONTINUES TO RECORD HIGHS (covered by Harsh Kumar)
Both the 88% iPhone ownership and 90% intention to purchase an iPhone metrics are record highs for our
survey, up from 85% and 88%, respectively, in Spring-20. We believe the increased penetration and intention
are important for a maturing premium smartphone market. In addition, these trends are encouraging as the
company continues to introduce new 5G iPhones, which could provide a significant product cycle refresh. We
think these positive trends can be a catalyst for further services growth, as the install base for Apple grows.
OW, PT $160
AKAM (+) WHEN “GAMERS GONNA GAME” – AKAMAI STANDS TO BENEFIT (covered by James Fish)
The Akamai network is the largest, most distributed architecture in the space. Teens are increasing their
viewing of streaming services that are Akamai customers, downloading of online games, and viewing of
websites / e-commerce. All of this is generating more traffic that Akamai delivers to the end-user, and thus
more revenue given its toll-booth model. Cord cutting is continuing with 37% of respondents no longer having
cable (vs 33% LY), and video game spending elevated likely due to the adoption of new consoles and greater
OW, PT $120 gaming interest amongst teens. Importantly, gaming downloads were up to 57% on a weighted average basis
vs 51% LY. E-commerce strength for various leading brands like Nike is also a positive for Akamai.
FIVN (+) TELEPHONY REMAINS THE CHANNEL OF FOCUS FOR TEENS (covered by James Fish)
Contact centers are becoming the main interaction point with end-consumers, including teens. Five9’s platform
can help contact centers (be it human or bot) service and better engage with teens that can drive a better
customer experience and a returning customer. Surprisingly, teens actually prefer a live phone call more than
the broader population, but also were more open to newer communication channels like live chat and social
media. As the population continues to shift towards Millennials / GenZ, we expect digital channels to take
share and for contact centers to have to be well-rounded across omni-channel. As the best pure-play in the
OW, PT $212
market, we find the results a positive for Five9.
Executive Summary Teen Behavior & Habits Teen Brand Preferences Demographics & Appendices
Taking Stock With Teens Survey - Spring 2021 Results | 13Teen Behavior & Habits
E-Commerce
Social Media & Content
Key Themes,
Trends &
Takeaways
Food & Snacks Payment & Crypto
Fashion & Beauty Video Games
Executive Summary Teen Behavior & Habits Teen Brand Preferences Demographics & Appendices
Taking Stock With Teens Survey - Spring 2021 Results | 14GenZ Insights: They Actually Care About The World
Most Important Political & Social Issues
FALL 2019 SPRING 2020 FALL 2020 SPRING 2021
1 Environment 16% 1 Environment 16% 1 Racial Equality 19% 1 Racial Equality 20%
2 Immigration 12% 2 Coronavirus 11% 2 Environment 9% 2 Environment 12%
3 Gun Control 10% 3 Abortion 8% 3 Black Lives Matter 8% 3 Black Lives Matter 6%
4 Abortion 8% 4 Gun Control 6% 4 2020 Election / Voting 7% 4 Coronavirus 5%
5 Racial Equality 7% 5 Racial Equality 6% 5 Coronavirus 6% 5 Equality 5%
6 Donald Trump 4% 6 Immigration 6% 6 Abortion 5% 6 Abortion 5%
7 Bullying 3% 7 2020 Election / Voting 4% 7 Equality 5% 7 Immigration 3%
8 Equality 3% 8 Equality 4% 8 Immigration 2% 8 Economy 3%
9 2020 Election / Voting 2% 9 Health Care 3% 9 Police Brutality 2% 9 Joe Biden 2%
10 LGBTQ+ Rights 2% 10 Donald Trump 2% 10 Gun Control 2% 10 Gun Control 2%
• We started asking teens to “name a political or social issue that is important” to them for the first time in Fall 2019
• GenZ is unique in that they appear to care more about social justice & the environment versus former generations
• In the last year, teens have been advocating for Racial Equality (20%) at the No. 1 spot, with Environment No. 2
• Additionally, specific mentions of the Black Lives Matter movement ranked No. 3.; Joe Biden moved into the top-ten
• Coronavirus-related concerns continue to linger as the issue moved from No. 5 to No. 4 sequentially in teens’ minds
Executive Summary Teen Behavior & Habits Teen Brand Preferences Demographics & Appendices
Taking Stock With Teens Survey - Spring 2021 Results | 15GenZ Insights...The Who’s Who?
Who They Like & Who They Follow
Favorite Celebrities Favorite Social Media Personalities
1. Kevin Hart 1. David Dobrik
2. Harry Styles 2. Emma Chamberlain
3. Taylor Swift 3. Kylie Jenner
4. Adam Sandler 4. LeBron James
5. Dwayne “The Rock” Johnson 5. Danny Duncan
6. Lebron James 6. Dwayne “The Rock” Johnson
7. Zendaya 7. Mr. Beast
8. Ariana Grande 8. Nelk Boys
9. Tom Holland 9. Kevin Hart
10. Donald Trump 10. Donald Trump
• Kevin Hart and Harry Styles re-affirmed their top spots in the minds of teens. Taylor Swift made a strong move up the
list; Ariana Grande and Donald Trump moved down on the Top 10
• David Dobrik again reigned supreme for Social Media personalities; as seen in previous surveys, half of the list is
dominated by YouTube and TikTok content creators.
Executive Summary Teen Behavior & Habits Teen Brand Preferences Demographics & Appendices
Taking Stock With Teens Survey - Spring 2021 Results | 16Snap As Favorite Social Media Platform; TikTok A Close 2nd
Social Media Preferences
Highest Social Media Engagement Favorite Social Media Platform
1 Instagram 84% 1 Snapchat 31%
2 Snapchat 78% 2 TikTok 30%
3 TikTok 71% 3 Instagram 24%
4 Twitter 41% 4 Discord 5%
5 Pinterest 34% 5 Twitter 3%
6 Facebook 28% 6 Facebook 2%
7 Discord 26% 7 Pinterest 2%
8 Reddit 16% 8 Reddit 1%
9 LinkedIn 4% 9 Other 1%
10 Other 3% 10 LinkedIn 0%
• Instagram continues to lead the pack in monthly usage at 84%, followed by Snapchat at 78% and TikTok at 71%.
• The trio of Snap #1 TikTok #2 and Instagram at #3 remained from the last survey, although Snap and Instagram both
appear to have slightly lost share to TikTok and Discord. Discord is now the 4th favorite app amongst teens.
• When asked, the average teen in our survey spends ~12 hours per week on social media, in-line with prior surveys.
Executive Summary Teen Behavior & Habits Teen Brand Preferences Demographics & Appendices
Taking Stock With Teens Survey - Spring 2021 Results | 17What’s In Your Wallet? Food, Video Games & Clothing
Upper-Income Teens
Males’ Wallet Share Females’ Wallet Share
1 Food 23% 1 Clothing 29%
2 Video Games 16% 2 Food 24%
3 Clothing 16% 3 Personal Care 11%
• Food remains the largest category for male spending, however, it fell 200 bps Y/Y
• Video Games asserted its place as the No. 2 priority in the male wallet at 16%—up 200 bps Y/Y but down from Fall
• Clothing stayed at No. 3 with 16% share for males—flat Y/Y
• Clothing remains the top-choice within the wallet for females, up 300 bps from Spring 2020; Food stayed at No. 2
• Personal care remained the No. 3 wallet choice for females at 11%--up 100 bps from Spring 2020
Executive Summary Teen Behavior & Habits Teen Brand Preferences Demographics & Appendices
Taking Stock With Teens Survey - Spring 2021 Results | 18Teen Spending Down 5% Y/Y, Up 1% Vs. Fall 2020
All Teens
$3,200
Peak Spend
$3,023
$3,000
$2,800
Annual Teenage Spend Per Year
$2,600
$2,400
Trough
$2,200 $2,165
$2,000
Spring 2005
Spring 2006
Spring 2007
Spring 2008
Spring 2009
Spring 2010
Spring 2011
Spring 2012
Spring 2013
Spring 2014
Spring 2015
Spring 2016
Spring 2017
Spring 2018
Spring 2019
Spring 2020
Spring 2021
Fall 2005
Fall 2006
Fall 2007
Fall 2008
Fall 2009
Fall 2010
Fall 2011
Fall 2012
Fall 2013
Fall 2014
Fall 2015
Fall 2016
Fall 2017
Fall 2018
Fall 2019
Fall 2020
• Teens self-reported spending ~$2,165 per year in our survey, implying total teen spending of ~$60B, assuming 27.7M
teens ages 13-19.
Executive Summary Teen Behavior & Habits Teen Brand Preferences Demographics & Appendices
Taking Stock With Teens Survey - Spring 2021 Results | 19Signs Of Recovery With Women’s Spending Inflecting
All Teens Reported Annual Clothing Spend
F: +24%
+9% Y/Y
-15% Y/Y
M: +15%
• Similar to what was seen in the ’08/’09 recession, females are leading the recovery in spending. From Fall 2009 to
Spring 2012, female clothing spend rallied 24% vs. the 15% rally for males (not to mention off a smaller base)
• From Spring 2019 to Fall 2020, Female and Male clothing spend dropped -16% and -18% respectively. This Spring’s
survey saw the female spend rally 9% Y/Y while the males spend continues to lag at -15% Y/Y.
Executive Summary Teen Behavior & Habits Teen Brand Preferences Demographics & Appendices
Taking Stock With Teens Survey - Spring 2021 Results | 20Clothing At Highest Level Of Female Wallet Share Since 2013
Upper-Income Females
• Among upper-income females, the wallet share for clothing has reached its highest level since 2013 at 29%. This is
up 300 bps Y/Y and a 400 bps gain after stagnating at 25% between Spring 2017 and Spring 2019.
Executive Summary Teen Behavior & Habits Teen Brand Preferences Demographics & Appendices
Taking Stock With Teens Survey - Spring 2021 Results | 21Shopping Channel Preference
Upper-Income Teens
• Last Fall, we included “secondhand” as an option to the question, “when shopping for clothing, what % do you spend
in the following channels?” for the first time. This Spring, it represented 8% of time allocated for shopping.
• Of importance, we changed the examples for "Specialty" in the question this Spring, from “Express, Abercrombie,
Gap” to “Pacsun, American Eagle, Hollister”, which we believe might have skewed the data some for this category.
Specialty was up 700 bps Y/Y.
• Despite altering our question, online/eTail remains ~22% of the shopping channel mix with teens.
Executive Summary Teen Behavior & Habits Teen Brand Preferences Demographics & Appendices
Taking Stock With Teens Survey - Spring 2021 Results | 22Women Now Lead Digital Shift
Upper-Income Teens
• When asked if teens shop online, until 2020 (outside of a single instance in Spring 2013), digital had higher
penetration with Men vs. Women
• In Fall 2020, digital penetration for the ladies came in neck-and-neck with the guys at 90% - this Spring, the
penetration for females accelerated substantially, outpacing the males 96% vs. 92% penetration
Executive Summary Teen Behavior & Habits Teen Brand Preferences Demographics & Appendices
Taking Stock With Teens Survey - Spring 2021 Results | 23Secondhand Market Adoption
Upper-Income Teens
Thrift/Consignment Stores Ranked
% of UI Teens Who Have Tried a Secondhand eCom Platform
47%
Have Purchased Secondhand
#10
As Favorite Brand/Retailer
This Compares to a Rank of
55%
Have Sold Secondhand
#23
In Spring 2020’s Survey 32%
Used a Secondhand eCom Platform
• We asked teens about their activity on popular Secondhand Marketplaces, including Poshmark, The RealReal, Tradesy,
thredUp, Mercari, and Depop – above, Upper Income teen participation on these platforms is charted
• Of Note, Depop rose to the #10 position on Favorite Websites for all teens; StockX ranked No. 5 among males
• Secondhand marketplace activity has picked up sequentially since the Fall, with UI Males moving from 18% to 19% and
upper-income females increasing to 46% from 40% in the Fall.
• 47% of UI teens have PURCHASED clothes secondhand (either a marketplace or a thrift store) & 55% have SOLD on the
Secondhand with female engagement higher than male
Executive Summary Teen Behavior & Habits Teen Brand Preferences Demographics & Appendices
Taking Stock With Teens Survey - Spring 2021 Results | 24Rental Market Appetite
Upper-Income Teens
Would You Pay a Monthly Fee For a Rent-and-Return Retail Service?
• Appetite from UI teens for a rent-and-return service to keep wardrobes fresh was down sequentially and Y/Y for both Men
and Women. We believe this is attributable to the pandemic, and we are curious to see if these sentiments are sticky in a
post-vaccine world, as everyone is seemingly more cognizant about germs.
Executive Summary Teen Behavior & Habits Teen Brand Preferences Demographics & Appendices
Taking Stock With Teens Survey - Spring 2021 Results | 25Athletic Apparel Trending Upward
Aggregate Athletic Mindshare As Favorite Apparel Brand - Upper-Income Teens
45%
41%
40%
37% 37% 38% 38%
36%
35% 35%
35% 33% 34%
32%
30% Average = 25% 28%
26%
25%
20%
15%
10%
5%
0%
• 38% of preferred apparel brands are “athletic,” in line with 38% in Fall 2020 and 37% in Spring 2020.
Executive Summary Teen Behavior & Habits Teen Brand Preferences Demographics & Appendices
Taking Stock With Teens Survey - Spring 2021 Results | 26Athletic Footwear Still Gaining Share Among Females
Favorite Footwear Brand Mindshare - Upper-Income Female Teens
• 82% of females prefer an athletic brand of footwear (above), up 400 bps Y/Y and reaching a new survey high
• 88% of males prefer an athletic brand of footwear, 100 bps from 87% in Spring 2020
Executive Summary Teen Behavior & Habits Teen Brand Preferences Demographics & Appendices
Taking Stock With Teens Survey - Spring 2021 Results | 27NFLX & YouTube Still Top Platforms
Teen Daily Video Consumption
Fall 2020 Spring 2021
1 Netflix 34% 1 Netflix 32%
2 YouTube 32% 2 YouTube 31%
3 Cable TV 9% 3 Hulu 8%
4 Hulu 7% 4 Cable TV 8%
5 Disney+ 6% 5 Other Streaming 7%
6 Other Streaming 6% 6 Disney+ 7%
7 Amazon 3% 7 Amazon 4%
8 Apple TV 1% 8 Apple TV 1%
9 Facebook Watch 1% 9 Facebook Watch 1%
• On average, teens spend 32% of their daily video consumption on Netflix, down slightly from 34% in Fall 2020.
• Netflix remained the top platform, ahead of second place YouTube at 31% (down from 32% in Fall 2020).
• Hulu (ranked #3) and Disney+ (#6) both improved slightly from Fall 2020, from 7% and 6% to 8% and 7%, respectively.
• Traditional Cable TV (#4) dipped again from 9% to 8%. Amazon Prime was slightly better at 4%, up from 3% in Fall 2020.
Executive Summary Teen Behavior & Habits Teen Brand Preferences Demographics & Appendices
Taking Stock With Teens Survey - Spring 2021 Results | 28Online Video Continuing To Gain Share
• Cord Nevers: 37% of teens in our survey indicated that they do not have
cable TV in their household; this is up from 33% in the Spring.
• Cord Cutters: 7% of teens said they expect their household to cancel cable
TV within the next 6 months, in-line with Fall 2020 but down slightly from 8%
in the Spring 2020.
• Migration of Time/Wallet to Online Video: As a result of these trends, we
expect to see an ongoing transition toward online video / streaming services.
Are you
Are youplanning to cancel
planning your cable
to cancel yoursubscription over the nextover
cable subscription 6 months?
the next 6 months?
(% of Students)
(% of students)
Spring Spring Spring Spring Spring
Fall 2015 Fall 2016 Fall 2017 Fall 2018 Fall 2019 Spring 2020 Fall 2020
2016 2017 2018 2019 2021
I don't have cable 17% 19% 17% 17% 20% 22% 25% 28% 32% 33% 35% 37%
No 74% 70% 75% 72% 72% 69% 66% 62% 60% 58% 58% 56%
Yes 9% 11% 8% 10% 8% 10% 9% 10% 9% 8% 7% 7%
Executive Summary Teen Behavior & Habits Teen Brand Preferences Demographics & Appendices
Taking Stock With Teens Survey - Spring 2021 Results | 29Customer Service Channel Preferences
“When having to interact with customer service, what communication channel do you most prefer to utilize?”
• 54% of teens prefer to pick up the phone and call a customer service agent, followed by live chat with a human and
text / sms messaging.
• Interestingly, teens are more willing to use new communication channels like live chat and social media than the
average consumer. As the population continues to shift towards Millennials & GenZ, we will see continued shifts to
digital channels
Executive Summary Teen Behavior & Habits Teen Brand Preferences Demographics & Appendices
Taking Stock With Teens Survey - Spring 2021 Results | 30Video Games: Teen Spending and Preferences
• Teens estimate to spend ~16% of their budgets on video games in Spring 2021 vs. 14% last year
• By triangulating the dollar spend, we estimate total video game spend (male & female) to be $217/year
• Among upper-income males, Food (23%) remained the largest expected spend, but for the second time in our survey,
Video Games (16%) was slightly ahead of clothing (16%)
• When asked “What video game are you most excited about buying during 2021?”, Call of Duty was overwhelmingly
the top selection excluding the “other” option
Executive Summary Teen Behavior & Habits Teen Brand Preferences Demographics & Appendices
Taking Stock With Teens Survey - Spring 2021 Results | 31Video Games: Current “Gamer” Behavior
All Teens
68% Of Teens In Our Survey Say They Are Gamers
(vs. 65% in Spring 2020)
53% Of Gamers Plan to Buy the New Console System in the Next 2 Years
(vs. 59% in Spring 2020)
4% Of All Teens Already Own a Xbox Series X/S or PS5
(vs. not applicable in Spring 2020)
Executive Summary Teen Behavior & Habits Teen Brand Preferences Demographics & Appendices
Taking Stock With Teens Survey - Spring 2021 Results | 32Teen Mobile Game Trends
Do you play games on your mobile phone or tablet (e.g. iPad)?
Do you play games on your mobile device or tablet (e.g. iPad)?
Spring Spring Spring Spring Spring Spring
Fall 2015 Fall 2016 Fall 2017 Fall 2018 Fall 2019 Fall 2020
2016 2017 2018 2019 2020 2021
Yes 79% 81% 77% 73% 72% 75% 69% 71% 70% 72% 66% 63%
No 21% 19% 23% 27% 28% 25% 31% 29% 30% 28% 34% 37%
When playing games on your mobile device, do you buy virtual goods like energy, coins or extra level…
When playing games on your mobile device, do you buy virtual goods like energy, coins or extra levels?
Spring Spring Spring Spring Spring Spring
Fall 2015 Fall 2016 Fall 2017 Fall 2018 Fall 2019 Fall 2020
2016 2017 2018 2019 2020 2021
Yes 24% 26% 24% 28% 28% 27% 28% 29% 28% 28% 27% 27%
No 76% 74% 76% 72% 72% 73% 72% 71% 72% 72% 73% 73%
• 63% of teens play games on their mobile phone or tablet, down from 66% in Fall 2020 and 72% in Spring 2020
• The decrease in teens playing mobile games could the results of the pandemic and teens having more access to
console games
• 27% of teens that do play video games buy virtual goods – this number has remained fairly consistent since 2015
Executive Summary Teen Behavior & Habits Teen Brand Preferences Demographics & Appendices
Taking Stock With Teens Survey - Spring 2021 Results | 33Top Payment Apps For Teens
For users of Venmo, Cash App & PayPal,
Penetration for Payment Apps Used in Last Month
Venmo Leads
50% 47% 26%
1% 1%
40% 2%
34%
28% 9%
30%
38% 23%
20% 21%
20%
14% 14%
10%
6%
0%
Venmo PayPal Cash App Bank of Zelle Wells Fargo JPMorgan Other (please
America Chase Other
list)
PayPal’s Venmo has highest penetration at 47% followed by PayPal Mobile Cash at 34%. Square’s Cash App ranks #3 in
penetration. Apps from traditional banks lag the fintech apps. We had expected to see more overlap of Venmo, PayPal and
Cash App, but teens tend to identify as users of only one of these three fintech apps.
Executive Summary Teen Behavior & Habits Teen Brand Preferences Demographics & Appendices
Taking Stock With Teens Survey - Spring 2021 Results | 34Cash Is (Still) King For Teens’ Top Payment Method
Penetration of Payment Methods Used in Last Month Among Teens
90%
83% 33% of Teens Do Not Have a Traditional Bank Account
80%
70% 33%
60%
50%
40% 67%
32%
30%
24%
20%
20% 16% Yes No
13% 12%
10%
4% 3% 2%
0%
Cash (paper Apple Pay PayPal Prepaid card Check Amazon Pay Google Pay QR Code Shop Pay Other (please list)
currency) Other
Prepaid Card
Cash is the most penetrated payment method among teens at nearly 85%. While we are somewhat surprised by the cash
penetration among teens, we believe it is a function of one-third of teens surveyed not having a traditional bank account.
(The CARD Act of 2009 also limits access to credit cards.) We expect as teenagers get older, they will graduate to electronic
payments methods such as Apple Pay, PayPal, and others.
Executive Summary Teen Behavior & Habits Teen Brand Preferences Demographics & Appendices
Taking Stock With Teens Survey - Spring 2021 Results | 35Only 9% Of Teens Have Bought Crypto, But Over 80% Are Male
Have you ever bought bitcoin or another cryptocurrency?
Gender Makeup of Teen Crypto Traders
4%
15%
26%
9%
81%
65%
Female Male Non-Binary
Yes No, but I've heard of cryptocurrency No, I don't know what cryptocurrency is
Only 9% of teens claim to have traded cryptocurrency, but another 26% say they do not know what cryptocurrency is. Of the
crypto traders, a striking 81% are male. Teens who traded crypto also tended to be older (i.e., 18), have above-average
household incomes and have after-school jobs.
Executive Summary Teen Behavior & Habits Teen Brand Preferences Demographics & Appendices
Taking Stock With Teens Survey - Spring 2021 Results | 36Teen iPhone Ownership And Purchase Intent Up
100%
90%
80%
70%
60%
50%
40%
30%
20%
10%
0%
Own an iPhone Expect next phone to be an iPhone
• iPhone ownership was up to 88%, the highest we’ve seen. We note ownership is up from 85% in last Spring’s survey.
• 90% of teens said their next phone will be an iPhone, up 2% from Spring-20 survey. 90% is the highest level we’ve seen.
Executive Summary Teen Behavior & Habits Teen Brand Preferences Demographics & Appendices
Taking Stock With Teens Survey - Spring 2021 Results | 37Teen Apple Watch Ownership Up To 28%
40%
35%
30%
25%
20%
15%
10%
5%
0%
Own A Smartwatch Plan to buy Apple Watch
• Smart watch ownership was up to 34% from 31% in Spring 2020. Apple Watch ownership was up to 28% from 25% last Spring.
• Apple Watch buying intent was down slightly, with 13% planning to buy in the next 6 months vs. 17% in the Spring-20 survey.
Executive Summary Teen Behavior & Habits Teen Brand Preferences Demographics & Appendices
Taking Stock With Teens Survey - Spring 2021 Results | 38Teen Brand Preferences
Image Source: Nike
Spring 2001
Gap
Fall 2001
Spring 2002
Executive Summary
Fall 2002
Spring 2003
3.5 years
Fall 2003
Spring 2004
Abercrombie & Fitch
Fall 2004
Spring 2005
Fall 2005
Spring 2006
Fall 2006
Hollister
3.5 years
Spring 2007
Fall 2007
Spring 2008
Teen Behavior & Habits
Fall 2008
Spring 2009
Fall 2009
Brands
2.5 years
Spring 2010
Action Sports
Fall 2010
Spring 2011
Fall 2011
Spring 2012
Fall 2012
Spring 2013
Teen Brand Preferences
Fall 2013
Spring 2014
Fall 2014
Spring 2015
Fall 2015
Spring 2016
Nike
10 years
Fall 2016
Spring 2017
Fall 2017
Spring 2018
Fall 2018
Spring 2019
Taking Stock With Teens Survey - Spring 2021 Results
Demographics & Appendices
Fall 2019
Spring 2020
| 39
Fall 2020
Spring 2021Favorite Apparel Brands
All Teens – See Appendix for more detail broken down by upper vs. average-income teens or male vs. female
FALL 2019 SPRING 2020 FALL 2020 SPRING 2021
1 Nike 23% 1 Nike 25% 1 Nike 27% 1 Nike 27%
2 American Eagle 10% 2 American Eagle 10% 2 American Eagle 8% 2 American Eagle 7%
3 Adidas 6% 3 Adidas 5% 3 Adidas 5% 3 PacSun 6%
4 Hollister 4% 4 Hollister 4% 4 Pacsun 4% 4 lululemon 4%
5 PacSun 4% 5 PacSun 3% 5 Hollister 4% 5 Adidas 4%
6 Forever 21 3% 6 lululemon 3% 6 lululemon 3% 6 Hollister 3%
7 lululemon 3% 7 Forever 21 3% 7 H&M 3% 7 Urban Outfitters 3%
8 Vans 3% 8 Urban Outfitters 3% 8 Urban Outfitters 3% 8 SHEIN 3%
9 H&M 2% 9 H&M 2% 9 Vans 2% 9 H&M 2%
10 Champion 2% 10 Vans 2% 10 Forever 21 2% 10 Thrift/Consignment Stores 2%
• Apparel spending was ~$508/year—down 3% Y/Y but flat sequentially
• Females outspend males by ~$175; female spending was +9% Y/Y vs. males down 16% Y/Y
• Nike is the No. 1 brand (>10 years running) at 27% share, flat sequentially but +200 bps Y/Y
• American Eagle remains its No. 2 spot but sheds 300 bps share Y/Y; Hollister slips to No. 6
• PacSun moves up from No. 5 to No. 3; adidas falls to No. 5—lowest level since Fall 2017
• lululemon moves up to the No. 4 spot at 4% share vs. No. 6 at 3% share
• SHEIN was a notable gainer—making its debut in the top-ten list at No. 8 (vs. No. 11 in Fall)
• Unaided mentions of thrift stores/consignment stores ranked No. 10 this Spring—vs. 23 LY
Executive Summary Teen Behavior & Habits Teen Brand Preferences Demographics & Appendices
Image Source: nike.com Taking Stock With Teens Survey - Spring 2021 Results | 40Favorite Footwear Brands
All Teens – See Appendix for more detail broken down by upper vs. average-income teens or male vs. female
FALL 2019 SPRING 2020 FALL 2020 SPRING 2021
1 Nike 42% 1 Nike 47% 1 Nike 52% 1 Nike 56%
2 Vans 20% 2 Vans 20% 2 Vans 16% 2 Vans 12%
3 Adidas 13% 3 Adidas 11% 3 Adidas 11% 3 Adidas 9%
4 Converse 4% 4 Converse 4% 4 Converse 4% 4 Converse 6%
5 Foot Locker 3% 5 Foot Locker 3% 5 Foot Locker 2% 5 Foot Locker 2%
6 Birkenstock 2% 6 New Balance 1% 6 Birkenstock 1% 6 Dr. Martens 2%
7 Crocs 1% 7 Birkenstock 1% 7 Dr. Martens 1% 7 New Balance 1%
New Balance 1% 8 Dr. Martens 1% 8 New Balance 1% 8 Crocs 1%
9 Under Armour 1% Steve Madden 1% 9 Crocs 1% 9 Birkenstock 1%
10 Steve Madden 1% 10 Finish Line 1% 10 Steve Madden 1% 10 Under Armour 1%
• Footwear spending was $270/year—down 5% Y/Y led by a HSD decline in male spend; female spend was stable
• Males still outspending females on footwear by almost $70/year
• Nike (No. 1) gains substantial share—up 900 bps Y/Y to 56% vs. 47% last year; taking share from Vans & adidas
• Vans still No. 2 position but share slipped 800 bps to 12%—likely disproportionately hurt by lack of in-person school
• adidas No. 3 but lost 200 bps of share and Converse gained 200 bps Y/Y solidifying its No. 4 spot
• Crocs moved up meaningfully—now the No. 8 brand—vs. 12 last Spring (No. 9 in Fall)
• Dr. Martens continues is upward climb to No. 6 (vs. No. 8 last year); Birkenstock moderates
• Under Armour moves back into the top-ten for the first time since Fall 2019 (vs. No. 14 LY)
Image Source: Nike.com
Executive Summary Teen Behavior & Habits Teen Brand Preferences Demographics & Appendices
Taking Stock With Teens Survey - Spring 2021 Results | 41Top Fashion Trends Right Now – “Smells Like Teen Spirit”
Upper-Income Teens, Female
FALL 2019 SPRING 2020 FALL 2020 SPRING 2021
1 Leggings / lululemon 17% 1 Leggings / lululemon 25% 1 Leggings / lululemon 21% 1 Leggings / lululemon 23%
2 Scrunchies 10% 2 Nike / Jordans 9% 2 Jeans 10% 2 Baggy / Saggy Pants 9%
3 Nike / Jordans 6% 3 Crop Tops 8% 3 Nike / Jordans 9% 3 Mom Jeans 8%
4 Baggy / Saggy Pants 6% 4 Jeans 7% 4 Crop Tops 8% 4 Nike / Jordans 7%
5 Jeans 5% 5 Ripped Jeans 4% 5 Baggy / Saggy Pants 4% 5 Crop Tops 6%
6 Vans 5% 6 Scrunchies 3% 6 Oversized Tops 3% 6 Jeans 5%
7 Crop Tops 4% 7 Vans 3% 7 Ripped Jeans 3% 7 Athletic Wear 3%
8 VSCO 4% 8 Brandy Melville 3% 8 Brandy Melville 2% 8 Ripped Jeans 2%
9 Birkenstock 3% 9 VSCO 2% 9 Vans 2% Brandy Melville 2%
10 Ripped Jeans 3% 10 Hoodies 2% 10 Athletic Wear 2% 10 Hair Trends 2%
• This unaided question goes to all teens to opine on top fashion trends for females in school
• While Leggings/lululemon is still the No. 1 trend (at 23%), we saw a noticeable acceleration denim trends—“mom
jeans” alone had enough votes to rank No. 3, jeans ranked No. 6 and “ripped jeans” ranked No. 8
• We are seeing significant influence from the 1990s—with baggy/pants taking No. 2 along with crop tops No. 6
• Nike/Jordans and athletic wear remain relevant—notably tied to the stay-at-home behavioral shift this past year
• One of the more unique trends we saw was “hair trends” for women which included mentions of “dying hair” “curtain
bangs”, “claw clips”, “butterfly hair clips”
• While not in the top 10, “thrifting”, “layering” and the color “brown” were also rising trends
• This response sums up the current trend the best “flare pants, curtain bangs, unique sunglasses, brown clothing”
Executive Summary Teen Behavior & Habits Teen Brand Preferences Demographics & Appendices
Taking Stock With Teens Survey - Spring 2021 Results | 42Top Fashion Trends Right Now – “Smells Like Teen Spirit”
Upper-Income Teens, Male
FALL 2019 SPRING 2020 FALL 2020 SPRING 2021
1 Nike / Jordans 13% 1 Nike / Jordans 14% 1 Nike / Jordans 15% 1 Nike / Jordans 15%
2 Athletic Wear 11% 2 Athletic Wear 11% 2 Athletic Wear 8% 2 Athletic Wear 13%
3 Vans 7% 3 Vans 6% 3 Hoodies 6% 3 Flannels 8%
4 Champion 5% 4 Jogger Pants 5% 4 5" Inseam Shorts 4% 4 Hoodies 8%
5 Adidas 4% 5 Supreme 5% 5 Shorts 4% 5 Shoes 4%
6 Hoodies 3% 6 Adidas 5% 6 Short Shorts 4% 6 Sweat Shirts 3%
7 Shorts 3% 7 Hoodies 4% 7 Jogger Pants 3% 7 Layering 2%
8 Sweatshirts 3% 8 Khakis / Chinos 3% 8 Flannels 3% Jeans 2%
9 Chains 3% 9 Leggings / lululemon 3% 9 Sweatshirts 3% 9 Shorts 2%
10 Short Shorts 2% 10 Flannels 3% 10 Vans 2% Baggy / Saggy Pants 2%
• Like the former question, this question goes to all teens to opine (unaided) on top fashion trends for males
• Mentions of Nike / Jordan take the No. 1 spot again and athletic wear while still No. 2 moved to 13% (+200 bps Y/Y)
• Flannels moved up from No. 10 to No. 3—another nod to the 1990s / grunge era; layering ranked No. 7
• Jeans, while not as strong a trend for males as females, ranked in the top-ten (No. 7) for first time since Spring 2018
• Shorts ranked No. 9; “short shorts” and “5” inseam shorts” combined (while not in top-ten) would have ranked No. 6
• Hair trends took the No. 12 spot—with several mentions of “middle part”, “curly hair” and “perms” (for males)
• Mentions of gender neutrality are on the rise including “trying makeup/eyeliner”, “painting nails black”, and “branching
out towards more "feminine" considered clothes/jewelry”
Executive Summary Teen Behavior & Habits Teen Brand Preferences Demographics & Appendices
Taking Stock With Teens Survey - Spring 2021 Results | 43Top Brands Starting To Be Worn
Upper-Income Teens
FALL 2019 SPRING 2020 FALL 2020 SPRING 2021
1 Adidas 15% 1 Champion 10% 1 Adidas 11% 1 Adidas 11%
2 Champion 11% 2 Adidas 10% 2 Champion 10% 2 Champion 9%
3 Nike 9% 3 Nike 8% 3 Nike 10% 3 Nike 9%
4 Vans 7% 4 Vans 7% 4 Vans 5% 4 Vans 4%
5 Under Armour 4% 5 American Eagle 5% 5 Hollister 4% 5 Under Armour 4%
6 Hollister 3% 6 lululemon 5% 6 lululemon 4% 6 Hollister 4%
7 American Eagle 3% 7 Under Armour 4% 7 American Eagle 4% 7 American Eagle 3%
8 lululemon 2% 8 Hollister 3% 8 Under Armour 3% 8 PacSun 2%
9 Ralph Lauren 2% 9 Ralph Lauren 3% 9 PacSun 2% 8 lululemon 2%
Vineyard Vines 2% 10 Patagonia 2% 10 H&M 2% 10 Patagonia 2%
FALL 2019 SPRING 2020 FALL 2020 SPRING 2021
1 American Eagle 8% 1 Brandy Melville 10% 1 SHEIN 7% 1 SHEIN 9%
2 lululemon 7% 2 lululemon 9% 2 PacSun 7% 2 PacSun 7%
3 Vans 7% 3 Champion 6% 3 lululemon 6% 3 lululemon 5%
4 Brandy Melville 6% 4 Urban Outfitters 5% 4 American Eagle 6% 4 Zara 5%
5 Champion 5% 5 American Eagle 5% 5 Brandy Melville 6% 5 Urban Outfitters 4%
6 Urban Outfitters 4% 6 PacSun 5% 6 Nike 5% 6 Brandy Melville 4%
7 PacSun 4% 7 Adidas 4% 7 Hollister 4% 7 American Eagle 4%
8 Nike 3% 8 Vans 3% 8 Champion 3% 8 Princess Polly 4%
9 Hollister 3% 9 Nike 3% 9 Urban Outfitters 3% 9 Nike 3%
10 Adidas 3% 10 Free People 2% 10 H&M 2% 10 Champion 3%
Princess Polly 2%
SHEIN 2%
Executive Summary Teen Behavior & Habits Teen Brand Preferences Demographics & Appendices
Taking Stock With Teens Survey - Spring 2021 Results | 44Top Brands No Longer Worn
Upper-Income Teens
FALL 2019 SPRING 2020 FALL 2020 SPRING 2021
1 Under Armour 21% 1 Under Armour 23% 1 Under Armour 22% 1 Under Armour 17%
2 Nike 12% 2 Adidas 12% 2 Adidas 12% 2 Adidas 12%
3 Adidas 7% 3 Nike 10% 3 Nike 12% 3 Gap 11%
4 Gap 7% 4 Gap 8% 4 Gap 7% 4 Nike 9%
5 Reebok 6% 5 Reebok 4% 5 Puma 5% 5 Puma 4%
6 Skechers 5% 6 Puma 4% 6 Reebok 4% 6 Skechers 4%
7 Puma 5% 7 Hollister 3% 7 Hollister 3% 7 Hollister 4%
8 Old Navy 3% 8 Skechers 3% 8 Skechers 3% 8 Reebok 4%
9 Vineyard Vines 3% 9 Champion 2% 9 Champion 3% 9 Old Navy 3%
10 Hollister 3% 10 Old Navy 2% 10 Ralph Lauren 2% 10 Champion 3%
FALL 2019 SPRING 2020 FALL 2020 SPRING 2021
1 Justice 38% 1 Justice 30% 1 Justice 26% 1 Justice 20%
2 Aeropostale 7% 2 Aeropostale 8% 2 Hollister 8% 2 Hollister 12%
3 Gap 5% 3 American Eagle 6% 3 Forever 21 7% 3 American Eagle 10%
4 Abercrombie & Fitch 4% 4 Hollister 6% 4 American Eagle 6% 4 Forever 21 7%
5 Hollister 4% 5 Victoria's Secret 5% 5 Aeropostale 6% 5 Gap 6%
6 Forever 21 3% 6 Adidas 5% 6 Gap 5% 6 Old Navy 4%
Nike 3% 7 Under Armour 4% 7 Adidas 5% 7 Abercrombie & Fitch 4%
8 American Eagle 3% 8 Gap 4% 8 Old Navy 4% 8 Aeropostale 4%
9 Adidas 3% 9 Old Navy 4% 9 Abercrombie & Fitch 4% 9 Brandy Melville 4%
Victoria's Secret 3% 10 Abercrombie & Fitch 4% 10 Victoria's Secret 3% 10 Adidas 3%
Executive Summary Teen Behavior & Habits Teen Brand Preferences Demographics & Appendices
Taking Stock With Teens Survey - Spring 2021 Results | 45Favorite Handbag Brands
All Female Teens
FALL 2019 SPRING 2020 FALL 2020 SPRING 2021
1 Michael Kors 27% 1 Michael Kors 25% 1 Louis Vuitton 19% 1 Louis Vuitton 18%
2 Louis Vuitton 14% 2 Louis Vuitton 16% 2 Michael Kors 18% 2 Michael Kors 16%
3 Coach 11% 3 Kate Spade 12% 3 Coach 13% 3 Kate Spade 14%
4 Kate Spade 11% 4 Coach 12% 4 Kate Spade 12% 4 Coach 13%
5 Gucci 9% 5 Gucci 6% 5 Gucci 6% 5 Gucci 6%
6 Vera Bradley 5% 6 Chanel 4% 6 Chanel 5% 6 Chanel 5%
7 Chanel 3% 7 Vera Bradley 3% 7 Vera Bradley 3% 7 Prada 4%
8 Steve Madden 2% 8 Steve Madden 2% 8 Prada 3% 8 Vera Bradley 3%
9 Calvin Klein 1% 9 Guess 2% 9 Steve Madden 1% 9 Guess 1%
10 Guess 1% 10 Prada 1% 10 Target 1% 10 SHEIN 1%
Tommy Hilfiger 1%
• Handbag spending improved to $93—up 4% Y/Y and up 7% sequentially, reversing a multi-year low
• Louis Vuitton was the No. 1 again for the second-consecutive survey at 18% share—up 200 bps Y/Y
• Tapestry was the most relevant portfolio company in our coverage capturing 27% of total vote, highest since Fall 2017
• Kate Spade moves up to No. 3 and Coach while No. 4, had 13% collective mindshare—up 100 bps Y/Y
• Capri Holdings (received votes for Michael Kors & Versace) held a collective vote of 16%; Michael Kors No. 2
• Gucci the No. 5 brand has seen stable share for three consecutive surveys; Chanel maintains No. 6 (up 100 bps Y/Y)
• Prada has had a notable acceleration in our data—moving from No. 10 (1% share) to No. 7 (4% share)
• Cross-border, eCom fast-fashion brand SHEIN rounds out the top-ten, making its debut in the list
• Telfar (private) while not in top-ten ranked No. 28—up handily from No. 78 (tied) last Fall
Executive Summary Teen Behavior & Habits Teen Brand Preferences Demographics & Appendices
Taking Stock With Teens Survey - Spring 2021 Results | 46Luxury Brands Continue To Gain Teen Mindshare
• We are seeing a leveling off of accessible luxury brand mindshare, collectively at 43% share unchanged from Fall
• Tapestry was the most relevant portfolio—27% of total vote, the highest level achieved since Fall 2017
• Capri Holdings (received votes for Michael Kors & Versace) held a collective vote of 16%
• In Spring 2021, 19 luxury brands were listed in our survey representing 37% mindshare
• Luxury mindshare moved up 100 bps from Fall but 600 bps from Spring; LV, Gucci, Chanel & Prada in top-ten
• Secondary platforms are increasingly a way for brands to access luxury brands including The RealReal, Poshmark,
Depop, StockX among others
Executive Summary Teen Behavior & Habits Teen Brand Preferences Demographics & Appendices
Taking Stock With Teens Survey - Spring 2021 Results | 47Favorite Watch Brand
Upper-Income Teens
FALL 2019 SPRING 2020 FALL 2020 SPRING 2021
42% 1 Rolex 42% 1 Rolex 39% 1 Rolex 36% 1 Rolex 35%
22% 2 Apple 25% 2 Apple 30% 2 Apple 35% 2 Apple 34%
5% 3 Fossil 3% 3 Fossil 3% 3 Fossil 3% 3 Casio 3%
4% 4 Michael Kors 3% 4 Fitbit 2% 4 Fitbit 2% 4 Fitbit 2%
2% 5 Casio 2% 5 Casio 2% 5 Casio 2% 5 Garmin 2%
2% 6 Gucci 2% Garmin 2% 6 Garmin 1% 6 Fossil 2%
2% 7 Richard Mille 2% 7 Michael Kors 2% 7 Gucci 1% 7 Tissot 1%
2% 8 Fitbit 1% 8 Gucci 1% 8 Patek Philippe 1% Michael Kors 1%
1% 9 Garmin 1% Patek Philippe 1% 9 Tissot 1% 9 Cartier 1%
1% 10 Nixon 1% 10 Seiko 1% 10 Michael Kors 1% 10 Swatch 1%
Patek Philippe 1% Tag Heuer 1%
• 89% of upper-income teens do not plan to purchase a watch in the next six months vs. 88% in Fall & 84% last year
• Rolex, still teens’ No. 1 watch brand, cedes share by 400 bps year-over-year and 700 bps over 2 years
• Apple, No. 2, lost 400 bps of share Y/Y (now 35%) in survey vs. 39% just one year ago
• Fitbit, after steadily increasing, has stalled at No. 4 with 2% share
• While Michael Kors maintained its No. 7 rank, it ceded 100 bps of share down to 1% overall share
Executive Summary Teen Behavior & Habits Teen Brand Preferences Demographics & Appendices
Taking Stock With Teens Survey - Spring 2021 Results | 48Beauty: Favorite Shopping Destinations
All Female Teens
FALL 2019 SPRING 2020 FALL 2020 SPRING 2021
1 Ulta 38% 1 Ulta 39% 1 Ulta 42% 1 Ulta 46%
2 Sephora 26% 2 Sephora 24% 2 Sephora 20% 2 Sephora 24%
3 Walmart 8% 3 Target 8% 3 Target 11% 3 Target 9%
4 Target 7% 4 Walmart 8% 4 Walmart 8% 4 Walmart 5%
5 Amazon 5% 5 Amazon 4% 5 Amazon 5% 5 Amazon 2%
6 CVS 2% 6 Walgreens 2% 6 CVS 1% 6 Glossier 2%
7 MAC 1% 7 Glossier 1% 7 Walgreens 1% 7 CVS 1%
8 Morphe 1% 8 CVS 1% 8 Glossier 1% 8 Walgreens 1%
9 Glossier 1% 9 Macy's 1% 9 Ipsy 1% 9 Morphe 1%
Walgreens 1% 10 Morphe 1% 10 Morphe 1% 10 MAC 1%
• Ulta strengthened its position as the No. 1 preferred beauty destination at 46% share vs. 39% LY (+700 bps Y/Y)
• Sephora, No. 2, moved up 400 bps sequentially but was flat in terms of share Y/Y at 24%
• Target remained No. 3 at 9% share vs. 8% last year and 11% share in Fall; Walmart continues to lose mindshare
• Amazon, while still No. 5, shed 200 bps of share Y/Y to 2%
• Digitally-native brand Glossier captured 2% mindshare among all teens to the No. 6 brand
• MAC popped back into the top-ten as a beauty destination
• Ipsy fell from No. 9 to No. 13 and while not in the top-ten, tied with SHEIN (very low price-point makeup online)
Executive Summary Teen Behavior & Habits Teen Brand Preferences Demographics & Appendices
Taking Stock With Teens Survey - Spring 2021 Results | 49Beauty: Favorite Skincare Brands
All Female Teens
FALL 2019 SPRING 2020 FALL 2020 SPRING 2021
1 Neutrogena 18% 1 Neutrogena 16% 1 CeraVe 28% 1 CeraVe 35%
2 Mario Badescu 8% 2 Mario Badescu 10% 2 Neutrogena 10% 2 Cetaphil 10%
3 Clean & Clear 8% 3 Cetaphil 7% 3 Cetaphil 10% 3 Neutrogena 9%
4 Cetaphil 6% 4 Clean & Clear 6% 4 The Ordinary 8% 4 The Ordinary 8%
5 Clinique 5% 5 Clinique 4% 5 Clean & Clear 3% 5 Clinique 3%
6 Proactiv 4% 6 Proactiv 3% 6 Clinique 3% 6 Curology 2%
7 Aveeno 2% 7 CeraVe 3% 7 Curology 2% 7 Proactiv 2%
Biore 2% 8 Curology 2% 8 Mario Badescu 2% 8 Rodan & Fields 1%
9 Burt's Bees 2% 9 Olay 2% 9 Proactiv 2% 9 Mario Badescu 1%
10 CeraVe 2% 10 Aveeno 2% 10 Rodan & Fields 1% 10 Aveeno 1%
Biore 2% Dove 1%
• Skincare spending for females was $107/year—up 6% Y/Y and sequentially, slightly exceeding the multi-year average
• CeraVe (L’Oreal-owned) furthered its lead as the No. 1 skincare brand with 35% mindshare (vs. 3% last year)
• Cetaphil (owned by subsidiary within Nestle portfolio) moved to No. 2 and Neutrogena continued to slip—now in No. 3
(vs. No. 1 last year) at 9% share
• The Ordinary (EL majority-owned) stayed in the No. 4 spot similar to Fall but was up from No. 14 last year; it tied for
No. 3 among upper-income females at 10% share
• TikTok (No. 2 preferred social media platform) has significantly reshaped these preferences with influencers like
@skincarebyhyram (6.8M followers) majorly shaping preferences
• Curology, a digitally-native, customized skincare brand, reached its highest level at No. 6, having broken into the top-
ten last year; Rodan & Fields (private) also saw its highest ranking in the survey at No. 8
• Mario Badescu slipped further to No. 9 as the days of VSCO Girls (which popularized facial mists) appear behind us
Executive Summary Teen Behavior & Habits Teen Brand Preferences Demographics & Appendices
Taking Stock With Teens Survey - Spring 2021 Results | 50You can also read