Sponsors Leave Workers on the Sidelines - FOUL PLAY - A Report by BASIC (Bureau for the Appraisal of Social Impacts and Costs) for COLLECTIF ...
←
→
Page content transcription
If your browser does not render page correctly, please read the page content below
FOUL PLAY
   Sponsors Leave Workers on the Sidelines

A Report by BASIC (Bureau for the Appraisal of Social Impacts
and Costs) for COLLECTIF ETHIQUE SUR L’ETIQUETTE

 May 2016
2
Summary

Next June when the UEFA European Championship kicks off in France, the world’s big sportswear brands will unveil
their new marketing campaigns, and their budgets are likely to break new records. For example, Nike’s last World Cup
campaign in Rio – “Risk Everything” – was budgeted at an estimated 68 million dollars, the highest in the brand’s
history.

In addition to their ubiquitous media presence, international football’s three main sponsors – Nike, Adidas and Puma –
have billed themselves as champions of decent working conditions in their factories. After a series of scandals made
headlines in the 1990s, they made socially responsible policies a priority and are regularly cited as examples in the
garment industry.

However, in light of persistent problems (accidents, fires, low wages), it is legitimate to wonder if the situation has
fundamentally changed for workers who eke out a meager living in the brands’ supply chains.

In order to begin to frame an answer, The Éthique sur l’étiquette Collective has launched a study to explore the
relationship between the sportswear brands’ business model and working conditions in their supply chains.

Here are the main results:

Endorsements are the growth engine…

Because of football’s media and social importance, it has become a major battleground for the world’s major
sportswear brands.
Dominated by the Big Three—Nike, Adidas and Puma—European football endorsements have reached
astronomical levels: deals made with the 10 biggest teams have risen from € 262 to more than € 405 million since
2013. The same goes for celebrity athletes. Annual contracts with Lionel Messi and Paul Pogba have reached sums
of between € 35 to € 40 million in 2015 compared with € 20 to € 25 million five years ago.
This spike also applies to national teams: according to the magazine Bild, Adidas was willing to quadruple its level
of endorsement to a billion euros over 10 years to avoid losing the team to Nike—an all-time record.
This “sneaker war” is fueled by a fight for dominance over soccer, and through it, the world athletic apparel
market.

…of a model based on the exponential increase of sales volume…

In the 1990s, the major sportswear brands laid the groundwork for a model based on the bottom line. Nike
became the industry leader, doubling its dividends since 2010 and achieving shareholder returns of 27.7% in 2015,
far above the Dow (13.9%) or the S&P 500 (19.7%). In an attempt to catch up, Adidas and Puma have reacted by
entering a race for profitability.

To increase profit margins, these brands are having to sell more products to more consumers than ever before –
Nike, the industry leader, has doubled its sales in less than 10 years. This constant growth requires large
investments in innovation and an ever-increasing media presence, notably through endorsements.

…and cost-cutting…

                                                                                                                      3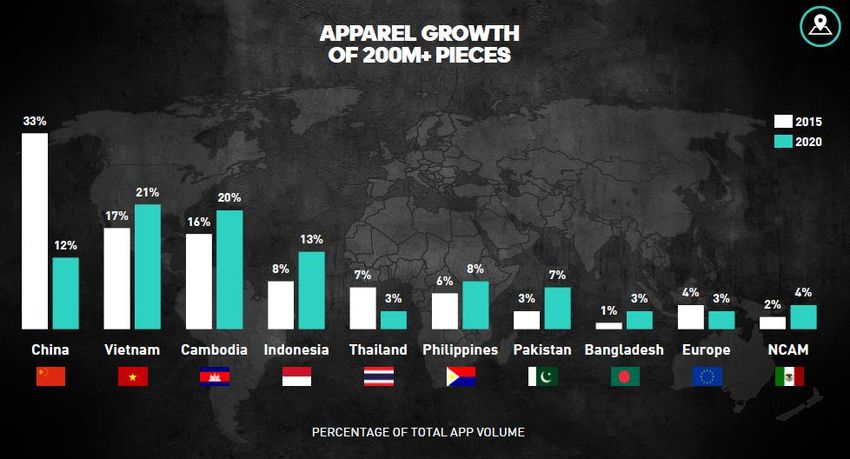
Starting in the 2000s, the big sportswear brands implemented a new system of supply chain management,
allowing them to diversify their product line while integrating technological innovations. In the footwear sector for
instance, an era of mass personalization has arrived, giving consumers the ability to customize their own shoe by
choosing materials and colors.
Nike, Adidas and Puma’s use of lean manufacturing among the majority of their suppliers allows them to remotely
manage all of their supply chains, which have become increasingly intricate and ramified (similar to what has
occurred in the auto industry).
These systems allow for optimized cost control: for each shoe model, the sportswear brands set their desired retail
price and profit margin, and from there calculate the maximum production cost for the item. They then sit down
with their supplier to determine which raw materials to use, their origin and price, as well as the exact number of
minutes allotted to manufacturing and how much workers are to be paid.
…which dictates sourcing choices…
Setting up systems of streamlined management allows sportswear brands to impact wages and working
conditions in their factories, contrary to what they have sometimes claimed to the media.
Lean explains the fact that, despite a drop in the number of supply chain partners, there are significant changes in
the list of partner factories from one year to the next.
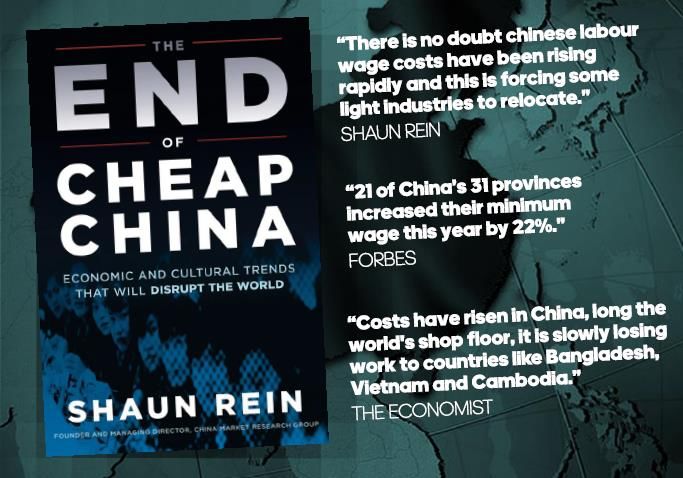
The study also shows that sportswear brands use lean to exit certain countries and invest in others. Nike, Adidas
and Puma are thus massively shifting their sourcing from China, where wages have seen significant increases, to
Vietnam, Indonesia, and soon Myanmar, India and Pakistan, where lower wages allow for significant labor cost
savings.
In this way, they expose themselves to significant breaches in labor standards (unpaid overtime, no paid vacation,
discrimination and impediments to organized labor), which they try to curb using an increasingly sophisticated and
costly system of labor audits with uncertain results.
…and doesn’t allow workers to live in dignity…
In 2015, the price breakdown of athletic apparel is clear: on average a mere 2% of the retail price of footwear ends
up in the pockets of workers, compared with 1% of consumer or professional jerseys.
For example, workers receive less than € 0.65 to manufacture the jersey of one the Euro 2016 stars, which is sold at
about € 85 to consumers.
In most of the manufacturing countries, workers aren’t paid enough to cover their families’ basic needs.
The long-term goal of sportswear brands is to drastically cut labor costs by automating the manufacturing of their
products. The recent opening of Adidas’ first fully automated shoe factory in Germany is a sign of this coming
trend.
...undermining the brands’ stated commitment to Corporate Social Responsibility (CSR)…
This methodical search for the lowest bidder casts doubt on the brands’ stated commitment to build long-term
partnerships with a more limited number of factories, and their resolve to give contract factories the means to
improve labor and working conditions.
For example, the industry-wide strategy of pulling out of China just as wages there have begun to allow workers to
make a decent living would seem to contradict their stated pledge to ensure a living wage within their supply chain
partners.
Contrary to the stated CSR goals of sportswear makers, labor remains an adjustable value to the Big Three.
Nevertheless, the Big Three could improve the situation if they so desired…
4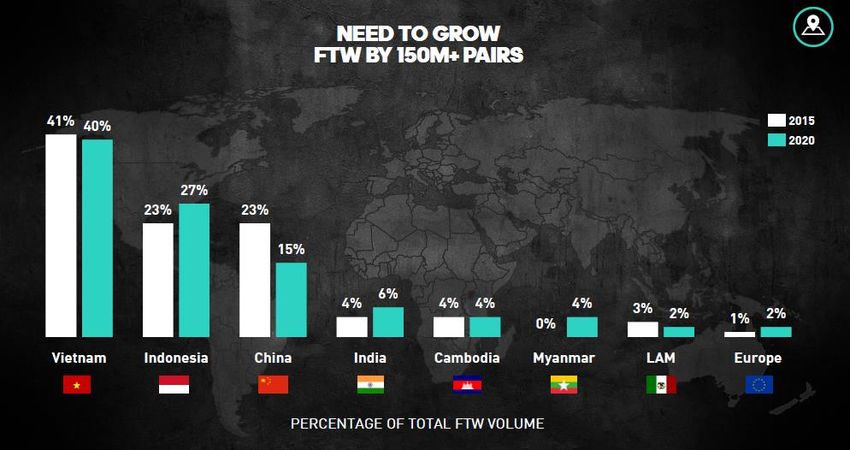
Estimates realized as part of the current study show that paying workers a living wage would cost Nike, Adidas and
Puma less than their current marketing and endorsement budgets, and the dividends they pay their shareholders
each year.
Paying a living wage would represent only a few dozen cents more in the final price tag of a pair of sneakers or a
sports jersey. But it’s thanks to these infinitesimal savings on millions of items that the Big Three can invest
lavishly in their constantly ballooning marketing budgets, and their “sneaker wars” on the sports field.
According to our calculations, endorsement costs of the 10 largest European football clubs since 2013 would have
been sufficient to pay living wages to 165,000 workers in Vietnam and 110,000 workers in Indonesia.

…or even change their business model…

Low wages result not from a lack of means, but from a global business model that should be reexamined. There is
an alternative to this massive investment in marketing and communication to the detriment of supply
subcontractors. In the past few years, other brands have begun to show this by building new models that allow
workers to make a decent livelihood, from raw material producers to assembly-line workers, while offering
consumers successful products.

                                                                                                                 5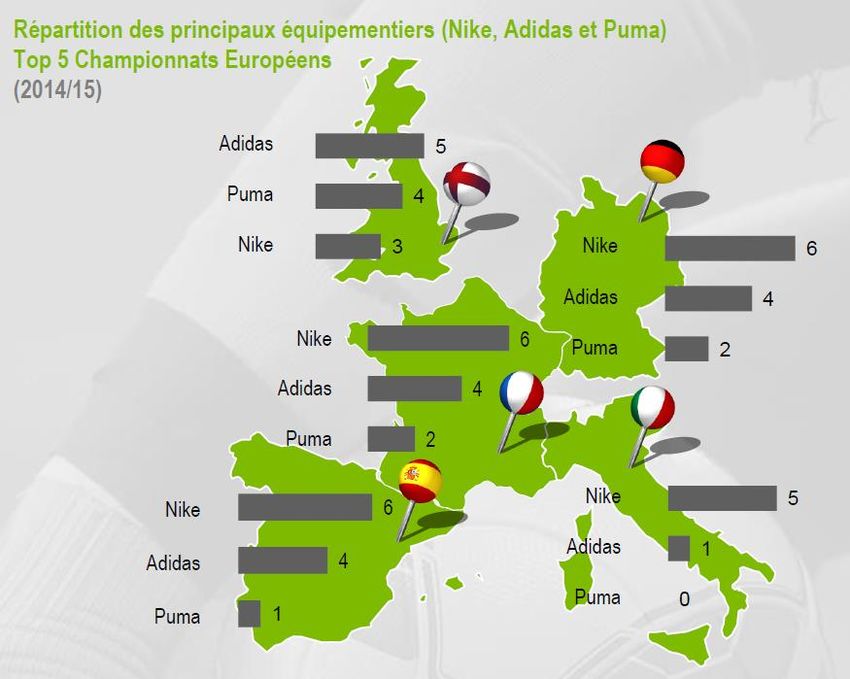
Summary ............................................................................................................................................. 3
 Graphs and tables ..................................................................................................................................
 List of abbreviations ..............................................................................................................................
 1. The athletic brand model: a volume-based strategy that hinges on technical innovation and
 investment in marketing and endorsements ......................................................................................10
1.1 The Big Three Sportswear Brands, a brief history .............................................................................. 10
  1.1.1     The Domination of Europeans Aidas and Puma supplanted by the emergence of Nike ........................ 10
  1.1.2      The sports apparel market .............................................................................Erreur ! Signet non défini.
1.2 A business model based on increasing volumes through technical innovation, marketing and
   endorsements...................................................................................................................................... 15
  1.2.1      Demand Creation through the profileration of products and marketing .............................................. 15
  1.2.2      Football endorsements, at the center of Nike and Addidas' war for the European market .................. 20

 2.    The impacts of this model on production countries .................................................................... 25
2.1 Outsourcing of production and the reorganization of the supply chain ............................................ 25
  2.1.1      Cost cutting through outsourcing: a 40 year old strategy .....................................................................25
  2.1.2      Faced with brand pressure on costs, the rise of Asian transnational suppliers based in the 1990s ........25
2.2 New brand strategies to control their supply chain and optimize costs ............................................ 26
2.3 Consequences of brand sourcing strategies: volatility of supply contracts, substandard wages, and
   social risks ….......................................................................................................................................31
  2.3.1      Toward a reduction in the number of factories, but with persistant volatility ....................................... 31
  2.3.2 The current shift in production out of China and into Vietnam and Indonesia: falling labor costs and
      substandard wages .................................................................................................................................... 32
  2.3.3      Toward countries with increased risk of labor violations ......................................................................38
  2.3.4      The Big Three's long-term vision: machines to replace workers ........................................................... 41
 3.    Conditions of a responsible supplier ........................................................................................... 44
3.1 From the emergence of sweatshops to the development of Social Responsability .......................... 44
  3.1.1     A public censure by NGOs with important repercussions .................................................................... 44
  3.1.2      Important progress and strong commitments from the Big Three .......................................................45
3.2 A business model in contradiction with the CSR commitments made by the brands ....................... 45
3.3 Workers who are paid a tiny share of the value of their products .................................................... 47
3.4 Yet the Big Three could be paying decent wages ............................................................................... 53
  3.4.1      In relation to their marketing budgets and their business model .......................................................... 53
  3.4.2      In relation to athlete and football team endorsements ........................................................................ 55
3.5… and other alternative models are possible ...................................................................................... 55

                                                                                                                                                             6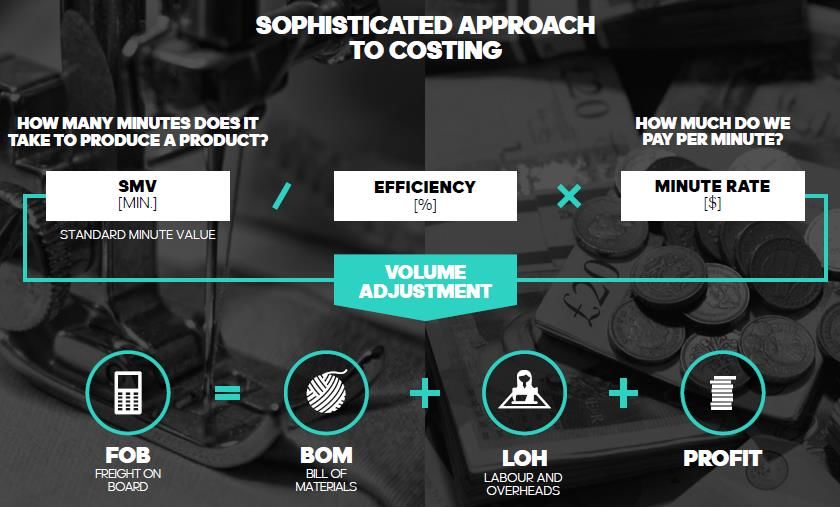
List of Illustrations
Figure 1. Market for sports apparel by region – global sales and estimated growth rates 2013-2017. ...................... 12
Figure 2. Shoe sales in the major European countries (in millions of euros). ........................................................... 13
Figure 3. Clothing sales in the European Union (in billions of euros). ...................................................................... 13
Figure 4. Major sports apparel market players ....................................................................................................... 14
Figure 5. Main players in the athletic footwear and apparel markets. ..................................................................... 15
Figure 6. Main football suppliers ............................................................................................................................ 15
Figure 7. Number of shoe models commercialized by Nike ....................................................................................16
Figure 8. Example of a customizable model offered by Nike ..................................................................................16
Figure 9. Financial profiles of Nike, Adidas and Puma ............................................................................................ 17
Figure 10. Evolution of Nike, Adidas and Puma’s Marketing and Sponsorship Expenses ........................................ 18
Figure 11. Incremental costs of endorsements for Nike and Adidas respectively .................................................... 18
Figure 12. Sales revenue gains for Nike, Adidas and Puma .....................................................................................19
Figure 13. Sales revenue for Nike, Adidas and Puma ............................................................................................ 20
Figure 14. Football spectatorship in France ............................................................................................................ 21
Figure 15. Main football sponsors cited by the French ............................................................................................ 21
Figure 16. Main partners for the Euro 2016 ............................................................................................................. 22
Figure 17. Main 10-year endorsement contracts for national football teams since 2008 ........................................... 22
Figure 18. Main sponsors of the national football championships .......................................................................... 23
Figure 19. Main endorsement contracts of the European football clubs in 2013 and 2015 .......................................... 24
Figure 20. Estimated endorsement contracts with top football stars ........................................................................ 24
Figure 21. Flow Chart Outlining the Principle of Target Costing ............................................................................ 28
Figure 22. Optimization strategy for labor costs developed by Adidas .................................................................. 28
Figure 23. Example of a technical Target Costing file for the production of sneakers ............................................ 29
Figure 24. Degree of lean implementation in Nike’s suppliers ................................................................................30
Figure 25. Degree of implementation of lean among Nike suppliers ......................................................................30
Figure 26. Number of suppliers to Nike, Adidas et Puma ....................................................................................... 31
Figure 27. Analysis of the list of factories supplying Adidas .................................................................................... 32
Figure 28. Shift in production countries for Nike and Adidas footwear (2005-2014) ............................................... 33
Figure 29. Shift in production countries for Nike and Adidas apparel (2005-2014) ..................................................34
Figure 30. Shift of production countries for Puma footwear and apparel (2012-2014) ............................................34
Figure 31. Average hourly wage in the garment industry in 2014............................................................................ 35
Figure 32. Excerpts from the internal Adidas presentation on sourcing 2015-2020 ................................................. 35
Figure 33. Evolution of Adidas’ sourcing countries 2015-2020 for the manufacture of shoes and clothes ................36
Figure 34. Studies of the living wage used in this report ............................................................................................ 37
Figure 35. Minimum wages, average wages in the sector, and living wages in the main garment-producing
countries ...............................................................................................................................................................38
Figure 36. Non-compliance with legal requirements concerning compensation in the factories audited by the
Better Work Program ............................................................................................................................................39
Figure 37. Non-compliance with labor requirements in factories audited by the Better Work Program ................. 40
Figure 38. Violation of legal health and safety requirements in factories audited by the Better Work Program ..... 40
Figure 39. First images of the robotic production line opened by Adidas in Bavaria ............................................... 42
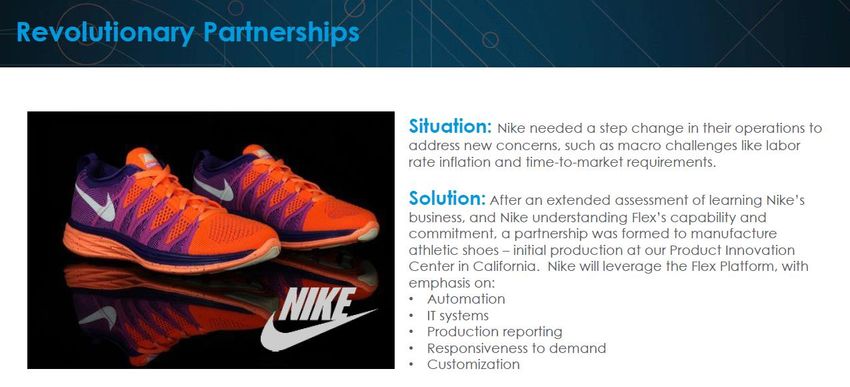
Figure 40. Partnership between Nike and Flex to automate footwear production and stymie rising labor costs .....43
Figure 41. Manufacturing Index set up by Nike ..................................................................................................... 46
Figure 42. Breakdown of the retail price of a Cortez/Roshe running shoe by Nike ................................................. 48
Figure 43. Estimated price breakdown for the Nike Air Jordan 1 ........................................................................... 49
7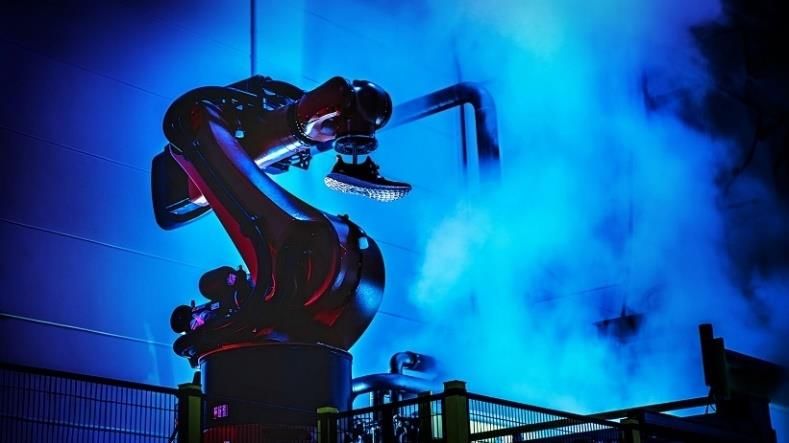
Figure 44. Estimate of the breakdown of Nike Cortez/Roshe running shoes sold on Nike’s online store .................50
Figure 45. Estimate of the price breakdown of a pair of Nike Air Jordan 1 sold online by Nike ................................50
Figure 46. Price breakdown for a technical T-Shirt technique like Techfit, made in Chine ...................................... 51
Figure 47. Estimated price breakdown for the technical T-Shirt like Adidas Techfit, made in Vietnam ................... 51
Figure 48. Estimated price breakdown for a National football jersey participating in the Euro 2016 .......................52
Figure 47. Average sector wages and living wages in the main garment-producing countries ................................ 53
Figure 48. Cost estimates for paying living wages for Nike, Adidas and Puma .......................................................54

                                                                                                                                    8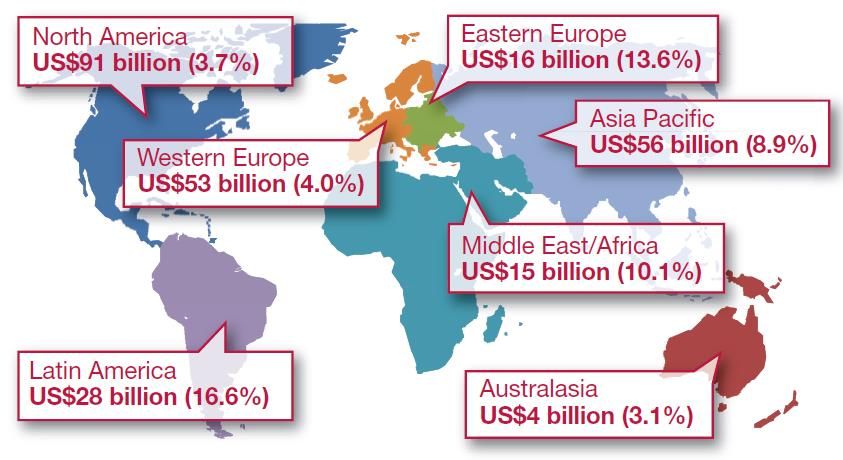
Abbreviation Key

FIFA          Fédération Internationale de Football Association
FOB           Free on board
INSEE         National Institute for Statistics and Economic Studies - France
MM            Million
Bn            Billion
ILO           International Labor Organization
NGO           Non-governmental Organization
GDP           Gross Domestic Product
CSR           Corporate Social Responsibility
UEFA          Union of European Football Association
UN Comtrade   UN International Trade Statistics Database
UNCTAD        United Nations Conference on Trade and Development
USD           US Dollars

                                                                                9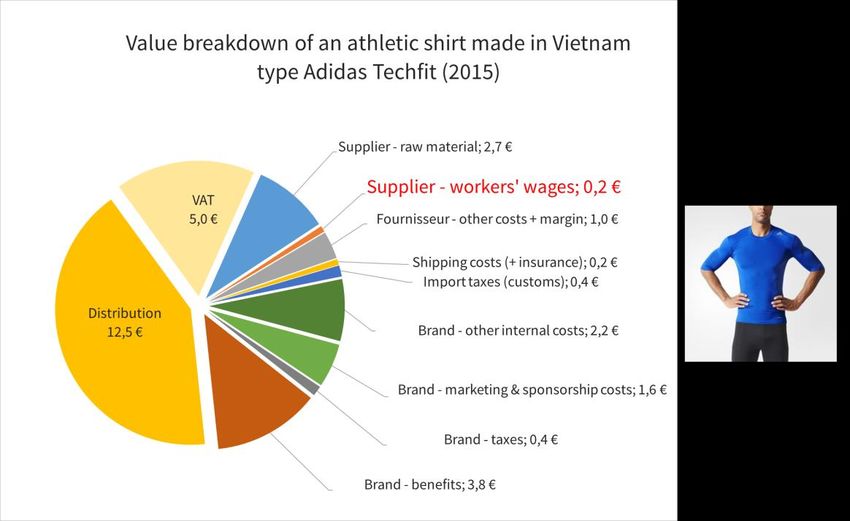
1.    Sportswear Brands: A High-volume Strategy Based on Technical Innovation and
           Branding and Endorsement Investment
     1.1 A Brief History of Athletic Apparel Brands

          1.1.1      The Dominance of European Giants Adidas and Puma Supplanted by the Emergence of Nike

Adidas and Puma: The Invention of Modern Sports

The idea of manufacturing sports-specific footwear was born in the late 1920s, and was developed by the brothers
Rudolf and Adolf Dassler who founded Adidas and Puma’s common ancestor. The brothers, sports enthusiasts
from a long line of Bavarian garment makers, sought to produce light footwear that was adapted to the various
sports they practiced. This revolutionary new initiative met with no uncertain success in Germany, in a period
when modern sports practice, and in particular English running and football, was in its infancy.1
The Dassler brothers owed much of their success to partnerships with the sports clubs that were cropping up in
Germany during the inter-war period, particularly football teams. They quickly attracted attention from national
sports federations, in particular track and field clubs, who asked them to supply the German Olympic team in
Amsterdam in 1928, an acknowledgment of the fledgling business’ savoir-faire. The crowning achievement came
at the Olympic Games in 1936 when Rudolf Dassler persuaded Jesse Owens to wear his shoes despite the Nazi
government’s likely retribution. Owens’ haul of four gold medals cemented the Dassler’s international reputation.2

Like many others businesses, the company was put under Nazi control during WWII, and was only spared thanks to
the Dassler brothers’ contacts with the Nazi party. After the liberation, the Americans, discovering the company
had sponsored Jesse Owens, allowed the company to resume production starting in 1946. Growing tensions
between Rudolf and Adolf eventually burst into public view. Their relationship, which had soured during the war,
led to a permanent rift and mutual finger pointing during the postwar denazification process by the Americans.3
Adolf, who had run the technical side of things left with his production team in 1949 and created the Adidas
company (using his nickname “Adi” Dassler). He invented the three parallel bars which would become the brand’s
logo and which made his products readily identifiable to consumers.
The same year, Rudolf and his former sales team mounted their own factory on the other side of the Aurach River,
recruited technicians and created Puma whose first logo he copyrighted.

Adidas’ business boomed after the 1952 Olympics in Helsinki, where Emile Zatopek took home three Gold medals
for track-and-field wearing footwear with the 3-bar logo.4
Meanwhile Puma saw substantial success in football, where design elements like the invention of the first cleats
set the brand apart. Its partnership with the Brazilian football team starting in the 1960s helped cement its
international renown.5

Adidas and Puma became locked in a fierce competition to win endorsements from the world’s best athletes, in
particular in the Olympics and football. The family rivalry was passed down to the next generation after Horst and
Armin Dassler, the sons of the respective founders of Adidas and Puma, took over as heads of the two companies.

1
  B. Smith, Pitch Invasion. Three stripes, two brothers, One feud: Adidas, Puma and the making of modern sport, Penguin books, 2007
2
  Ibid.
3
  Ibid.
4
  Ibid.
5
  Ibid.
                                                                                                                                      10
During the 60s and 70s, Adidas gained ascendency over its rival sibling thanks to partnerships with the Olympics
and Germany’s National Football Team, Mannschaft. Puma struck back by paying the star Pelé to wear its shoes,
giving the brand international exposure during the 1970 World Cup in Mexico.6
From football and track and field, their rivalry extended into popular new sports, in particular tennis.
In the late 1970s, Adidas took the lead in supplying athletic equipment to the Olympic Games (over 80% at the
Montreal Games in 1976) and continued to develop its branding by inventing the international football
endorsement.
Horst Dassler signed the first such agreement in 1977 with FIFA president Joao Havelange. The deal invested
private funds – in partnership with Coca Cola – to help bring the organization to developing countries. He created
an umbrella company dubbed ISL7 to help bring private investment to the 1978 World Cup in Argentina. After this
initial success, he and FIFA’s new General Secretary Sepp Blatter set up a complete branding and sponsorship
strategy for the following World Cup organized in Spain. This included exclusive commercialization rights for
partner companies, the creation of a mascot and merchandising, and later TV broadcast rights.
Based on the success of this model, ISL succeeded in branching out into the 1980 Olympic Games thanks to the
support of newly elected IOC President, Juan Antonio Samaranch. 8
The system has only gained momentum since then.
The Rise of Nike and the End of European Dominance
In the late 1960s, young Stanford student and sports enthusiast Philip Knight took a sabbatical to Japan to test his
masters thesis on the feasibility of producing quality European-style athletic apparel in Japan at a fraction of the
cost—something that had already taken place with cameras.
In stores there, he found Adidas knock-offs bearing the Tiger logo, and decided to cold call the head of the
company, Kihachiro Onitsuka. Posing as an American importer, he secured Tiger distribution rights for the United
States.9
Back in Oregon, he founded the company “Blue Ribbon” with his former sports coach Bill Bowerman and began
commercializing Tiger running shoes in the United States—a market that had been dominated by Adidas and
Puma. With a group of friends, he began to sell shoes in his free time at track meets. Phil Knight left his job as an
accountant in 1969 to devote himself to the company full-time.10
Faced with the difficulty of selling directly to consumers, they initially focused on selling sports shoes in bulk. They
decided to rename their brand Nike and registered the “swoosh” logo in 1972. After a failed attempt to
manufacture their shoes in Mexico, they traveled throughout Japan, Taiwan and Hong Kong to build a network of
suppliers which would make the first pairs of American-designed shoes.11
The company’s sales began to boom that same year after Bowerman was named trainer of the US Olympic track
team in Munich. Nike shoes were highly successful among athletes who saw the brand as very close to them and
their concerns.12
6
France 5, Les frères Dassler, de l’amour familial à la haine viscérale, April 2014.
7
Originally called SMPI, the company became ISL (International Sports and Leisure) starting in 1982
8
B. Smith, Pitch Invasion. 2007 op. cit.
9
J. Strasser and L. Becklund, Swoosh: the unauthorized story of Nike and the men who played there, Collins, 1993
10
J. Strasser and L. Becklund, Swoosh: the unauthorized story of Nike, 1993 op. cit.
11
Ibid.
12
Ibid.
11After developing partnerships with amateur track teams, Nike launched a similar program with basketball teams
starting in 1975. Sales doubled annually, finally reaching about 30 million dollars in 1977, and making Nike
America’s top brand of running shoes (but nonetheless lagging far behind Adidas in terms of overall US sales).13
While Adidas, Puma and Converse focused on procuring endorsements from big-name athletes, Nike built its
brand through partnerships with college track and basketball teams, and later baseball and soccer teams. Within
three years, the company had increased its sales tenfold thanks to technological innovations (the introduction of
light polyurethane souls and rigid vamps). Above all, the company benefitted from the jogging boom in the United
States. A major social phenomenon, it propelled Nike sales to 270 million dollars in 1980 and 460 millions the
following year. It was at this point that Nike decided to open its first European subsidiary and to reproduce its
American success with running shoes and later tennis shoes, thanks to endorsements by well-known athletes (like
English runner Sebastian Coe or tennis champion John McEnroe). 14
Nike’s growth stagnated in the 1980s due to problems organizing its vast production and distribution network, and
the strides made by British competitor Reebok, which had recently entered the US market, and which saw
dazzling success thanks to the step-aerobics boom, before going into running shoes. Reebok became the world’s
number one sports brand in the mid-1980s (before going into decline in the 1990s and finally being acquired by
Adidas 20 years later). To regain its edge, Nike invested heavily in athletic endorsements and scored a major
marketing success through their 1984 partnership with Michael Jordan. Air Jordan sneakers created a consumer
feeding frenzy catapulting sales to 100 million dollars in the first year. The launch of Nike Air Max in 1987 helped
Nike move ahead of its competitors, a position it holds to this day.15
1.1.2 The Sports Apparel Market
The global market for sports apparel is estimated at approximately 220 billion euros annually. It represents about
15% of total sales in the garment sector and it enjoys slightly higher growth (7.5% to 6%). North America is its
biggest market, followed by Europe and then Asia which is seeing rapid growth.16
Figure 1. Market for sports apparel by region – global sales and estimated growth rates 2013-2017.
Source : Euromonitor (2014)
13
Ibid.
14
Ibid.
15
Ibid.
16
Catalyst Corporate Finance, Global Sportswear Sector, 2014
12The European Market for Athletic Footwear
The growing popularity of athletic footwear as a substitute for traditional shoes is one of the sector’s main growth
engines in Europe. Sales have benefited from growing consumer interest in more active and healthier lifestyles.
Other growth factors are their fashionable image and the technological innovations which constantly improve the
comfort of these shoes.17
Sneakers represent about 20% of the European shoe market , which has started growing again since 2014, mainly
in Northern and Central Europe.
Figure 2. Shoe sales in the major European countries (in millions of euros).
Source : Eurostat, Market Line, Euromonitor (2014)
The European market for sports apparel
In Europe, sports apparel is a € 5 billion a year market and represents approximately 7% of overall garment sales.
Contrary to the sector at large, sales have held steady or even increased slightly during the economic crisis (see
diagram below)18.
Figure 3. Clothing sales in the European Union (in billions of euros).
Source : Eurostat (2015)
17
CBI, Mass market sports footwear in Europe, 2015
18
CBI, Apparel Trade Statistics, 2016
13The market shares of Nike, Adidas and Puma
The sportswear sector remains quite fragmented internationally. Nike and Adidas dominate the market with sales
revenues eight and five times higher, respectively, than their closest competitors, Puma and Asics. Their combined
sales represent about 20% of the sector (see below).
Figure 4. Major sports apparel market players
Source: BASIC, based on the Boston Globe (2015)
Analysis of the athletic shoe market (cf. below) shows that:
- Nike is by far the largest athletic footwear maker internationally, with a market share close to 23%,
followed by Adidas at almost 10%. The other direct competitors only represent a 1% to 5% market share
each.
- In the athletic apparel market, Adidas and Nike are tied for first place at about 10% of the market each. As
in the athletic footwear sector, the other makers have market shares between 1% and 5%.
14Figure 5. Main players in the athletic footwear and apparel markets.
Source : BASIC, Merryl Lynch, Forbes, Market Realist, NPD Group and the companies’ annual reports
Certain individual sports are dominated by only a few brands. Thus, more than 70 % of football-related sales –
including shoes, apparel and equipment (balls, gloves, etc.) – are realized by only 3 companies: the leader Adidas,
followed closely by Nike, and Puma in third position (see below).
Figure 6. Main football suppliers
Source : BASIC, according to the Boston Globe (2015)
The market in its entirety was estimated at € 7.9 billion in 2015.
1.2 A business model based on sales volume through innovation, marketing and endorsements
1.2.1 Creation of demand through product diversification and marketing
The importance of technical innovation: exponential growth of product lines and expanding consumption
These past few decades, the sector’s big brands have created and maintained an athletic footwear and apparel
market in constant expansion, reinforcing the development of sports activities with an ever-increasing choice of
products for consumers.
This is illustrated by exponential growth in the range of products offered by Nike. The number of Nike footwear
items on the market has increased more than tenfold since the 1980s.
15Figure 7. Number of shoe models commercialized by Nike
Source: BASIC, based on data by R. M. Locke (MIT, 2003) and the Nike website (2016)
This trend continues to accelerate today, ushering in an era of “mass customization.” The idea is to rethink the
mass production system to offer consumers an almost unlimited variety of customizable models at a cost that is as
close as possible to the standard models.
In practice, buyers can now design their own shoes online by choosing materials, colors and the shape and soul
type. No sooner has the consumer paid than the order is dispatched to the factory.
Figure 8. Example of a customizable model offered by Nike
Source : BASIC, according to Nike’s website (2016)
This increase in the number of models hinges on innovation, which has become the watchword of the Big Three’s
new products. It is central to their branding and market differentiation strategies.
For example, since the early 80s Nike has run its own in-house R&D lab to study the needs of athletes in
partnership with scientists in biomechanics, physics and kinesiology. Financial analysts estimate that Nike and
Adidas currently devote about 5% of their budgets to R&D, having registered 4,000 and 550 patents respectively.19
As marketing spending continues to grow so does its role in the business model
Nike, Adidas and Puma have built up a design and marketing-based business model using capital freed up by a
reduction in manufacturing costs.
From its beginnings, Nike has outsourced production to give itself financial wiggle room. In the early 80,
manufacturing costs represented only 60% of its sales revenue, compared to 75% for Adidas, whose production
lines were primarily located in Europe.20
These labor-cost savings allowed Nike to invest massively in marketing and sponsorship, spurring a sportswear
“fashion craze” that spread beyond traditional sports practitioners to a general public hungry for a new dress code.
19
S. Dong, Tech-wear: The technical aspects of Nike’s most innovative apparel, 2016
20
B. Smith, Pitch Invasion. 2007 op. cit.
16Nike has built nothing short of an international legend based on brand storytelling, technical innovation and
celebrity endorsements that feed consumer enthusiasm and sales growth.21
The resounding success of this business model has led the other sportswear leaders to try to imitate it. To match
Nike’s marketing and endorsement spending, Adidas has gradually closed its European factories and moved to
Asia since the 1980s, eventually outsourcing all its production.22
In doing so, Nike, Adidas and Puma have entered a race over the last 30 years to reduce supply costs, grow their
marketing and endorsement budgets, and ultimately sell more footwear and apparel than their competitors.
Today only 51% to 54% of the Big Three’s sales revenue is spent on manufacturing costs (compared with 75%
when production was based in Europe). As for marketing and endorsement investment, which has become
obligatory, it has reached 10% for Nike and 14% for Adidas. It has even peaked at 21% for Puma whose current
strategy is to reinvest massively in marketing and endorsement to improve its profitability and avoid being left in
the dust by its two competitors.
Figure 9. Financial profiles of Nike, Adidas and Puma
Source : BASIC, based on reports published by the 3 companies (2015)
Over the past 10 years, marketing and endorsement budgets have only grown (see attached diagrams): an 85%
increase for Nike and more than 140% for Puma. They are now considered a necessary evil to spur sales growth
and create consumer demand.
21
BP. Bouchet et D. Hillairet, Marques de Sport : approches stratégiques et marketing, Editions de boeck, 2009
22
B. Smith, Pitch Invasion. 2007 op. cit.
17Figure 10. Evolution of Nike, Adidas and Puma’s Marketing and Sponsorship Expenses
Source : BASIC, according to annual reports published by the 3 companies (2015)
Among these expenses, endorsement contracts have seen an even more significant rise (see below). According to
Nike, they have outpaced overall marketing expenses nearly 2 to 1 (+163% since 2005). As for Adidas, Deutsche
Bank estimates show a 60% increase in football endorsements in scarcely three years.
Figure 11. Incremental costs of endorsements for Nike and Adidas respectively
Source: BASIC, according to Nike’s Annual Report (2015) and Deutsche Bank estimates (2015)
These investments have allowed for increased sales revenue growth for Nike, Adidas and Puma in similar
proportions since 2005.
18Figure 12. Sales revenue gains for Nike, Adidas and Puma
Source : BASIC, according to annual reports published by the 3 companies (2015)
This growth is due to higher prices as well as an increase in items sold. For example, between 2013 and 2015, the
price of Nike shoes increased by 6% and the number of units sold by 7%.23
Ultimately, these big increases allow the Big Three to pass on large profits to shareholders (see below). This is
particularly true for Nike which is presented by financial analysts as the standard-bearer in the sector. The
company has doubled its profits in the last five years and offered annual returns of 27.7 % to investors in 2015, far
above the Dow Jones Industrial Average (13.9%) and the S&P 500 (19.7%). Adidas and Puma have entered into a
race for profitability to attempt to catch up.24
23
Market Realist, Nike Moves a Step Ahead with Innovation-Driven Growth, Marche 2016
http://marketrealist.com/2016/03/nike-moves-step-ahead-innovation-driven-growth/ consulted 05/15/2016
24
Market Realist, Nike: 5-Year Returns Targets for Shareholders, October 2015
http://marketrealist.com/2015/10/nikes-5-year-returns-targets-shareholders/ consulted 05/15/2016
19Figure 13. Sales revenue for Nike, Adidas and Puma
Source : BASIC, based on the annual reports published by the Big 3 (2015)
1.2.2 Football Endorsements, at the heart of the battle between Nike and Adidas for the European market
Football has gained undeniable social significance. It far outperforms other European sports in numbers of players,
both amateur and professional, in popularity and media attention, and in economic development and symbolic
power. It is thus a crucial battleground for the sportswear brands in their pursuit of expanding markets.25
Football, a key sector for dominance over the European market
Football has one of sports’ most storied histories in terms of endorsements. Created in England in the late 19th
century, the sport went professional in 1885, forcing early club owners to raise funds to pay players. This kicked off
the tradition of charging stadium admission, and forced owners to turn to private sponsors for liquidity.26
Meanwhile companies—first sportswear makers and later other consumer brands—quickly became interested by
this sport whose popularity was gradually spreading around the world. The sport’s value is embodied by the image
of the football star, the cornerstone of Nike, Adidas and Puma’s marketing strategies.27
Starting in the 1970s, football sponsors began to compete to put their logos on events, clubs and players. This
sport-company relationship played a major role in introducing football clubs to marketing culture and the possible
profits to be reaped from their image. Starting in the 1980s, clubs were no longer content to just sell branded
products (jerseys, bags, watches, perfume). As a result, revenue amassed by Ligue 1 French football for example
jumped from 500,000 francs in 1970-1971 to 260 millions francs in 1990-1991.28
For sportswear brands, international sports leadership plays out first and foremost on the football field. Until the
1980s, it was dominated by Adidas and Puma (sometimes indirectly like in England where Umbro was Adidas’
exclusive distributer and in France where Adidas acquired le Coq Sportif).
In 1982, Nike entered the arena after consolidating its position in Europe in running and tennis sneaker sales. It
outfitted Peter With who brought Aston Villa to victory against the Adidas-sponsored Bayern Munich team in the
European championship that year. From then on, the competition would only grow more fierce.29
25
W. Gasparini et J. F. Polo, L’espace européen du football : dynamiques institutionnelles et constructions sociales, l’Harmattan, 2012
26
J. F. Nys, La surenchère des sponsors dans le football, Géoéconomie, 2010
27
J. F. Nys, La surenchère des sponsors dans le football, 2010 op. cit.
28
A. Whal, P. Lanfranchi, Les Footballeurs professionnels des années 1930 à nos jours, Paris, Hachette, coll. “La vie quotidienne”, 1995
29
B. Smith, Pitch Invasion. 2007 op. cit.
20The stakes are enormous for the Big Three, pulling them into a merciless war to endorse the most prestigious
clubs, players and national teams. For example, in 2006, Adidas sold more than 10 million official World Cup balls,
and both Nike and Adidas saw their jersey sales jump by 33% in Europe on account of the event alone.30
The media coverage devoted to football is also testament of this: in France for example, more than 40% of the
population reported regularly following football matches on TV, radio, the printed press and online.
Figure 14. Football spectatorship in France
Source : Sportlab Consulting – Sponsorship Yearbook (2013)
In this context, the Big Three enjoy better name recognition than any other sponsor among football fans
(according to yearly European rankings by the firm Sport+Market).31 Likewise, French polls show that Adidas and
Nike are closely linked with football in the popular imagination.
Figure 15. Main football sponsors cited by the French
30
J. F. Nys, La surenchère des sponsors dans le football, 2010 op. cit.
31
J. F. Nys, La surenchère des sponsors dans le football, Géoéconomie, 2010 op. cit.
21Source : Sportlab Consulting – Sponsorship Yearbook (2011)
The fierce competition between Nike and Adidas for dominance over European football endorsements has spiraled out
of control
The Big Three sportswear makers have now become an integral part of European football. On the national level,
they sponsor almost all teams participating in the next UEFA European Championship.
SPONSORS NATIONAL TEAMS
Adidas* Germany; Belgium; Spain; Hungry; Northern Ireland; Wales; Sweden; Russia; Ukraine
Nike Great Britain; France; Poland ; Portugal; Turkey
Puma Austria; Switzerland; Italy; The Czech Republic; Slovakia
Joma Romania
Errea Iceland
Umbro Ireland
* Adidas is also the official sponsor of the UEFA as an organizer
Figure 16. Main partners for the Euro 2016
Source : BASIC
Figures show ballooning endorsement contracts with national football teams, which have doubled on average
over the last decade. This trend could very well continue with the next contract renewal in 2018.
NATIONAL TEAM ENDORSEMENTS
Country Sponsor Annual amount End of Contract
GERMANY Adidas/Nike ? 100 MM € ? 2028
FRANCE Nike 42.6 MM € 2018
GREAT BRITAIN Nike 34.5 MM € 2018
BRAZIL Nike 30.7 MM € 2018
GERMANY Adidas 25 MM € 2018
SPAIN Adidas 24 MM € 2018
ITALY Puma 18 MM € 2018
BRAZIL Nike 13 MM € 2008
FRANCE Adidas 10 MM € 2008
Figure 17. Main 10-year endorsement contracts for national football teams since 2008
Source: BASIC, according to Bild data (2015)
22The jockeying between the Big Three for control of the major teams is spiraling out of control, with no end in sight.
Thus Nike, which already sponsors Brazil to the tune of € 13 million per season, succeeded in baiting the French
team away from Adidas in 2008 with a € 42.7 million contract effective until 2017-2018. (Prior to that, Adidas had
been the French Football Federation’s partner for 37 years, paying about € 10 million per season for the privilege).
While Nike has so far failed to wrestle the German team away from Adidas on its home turf, it’s not for lack of
trying. A recent investigation in the September 2015 issue of Bild reports that Nike offered Mannschaft a 10-year
contract of more than € 1 billion, or € 100 million a year (compared with the € 25 million Adidas currently spends).
If signed, this would represent the largest contract in football history.
This all-out war for dominance is present to an even greater degree during Europe’s five major championships: in
Spain, Italy, Germany, the United Kingdom and France.
Figure 18. Main sponsors of the national football championships
PR Marketing, Repucom, 2014
Here too, Nike, Adidas and Puma are still fighting for supremacy. For the first time since 2009/2010 the American
giant outperformed its German rival in 2014, outfitting a quarter (26.5%) of the clubs participating in these five
championships, while Adidas held down 18.4% of the market and Puma 9%. The 2015/16 season was a turning
point since Adidas won over two of its rival’s biggest contracts: Manchester United, the English Premier League
giant, and the Juventus FC, Italy’s most recent champion. 32
This frenzied competition has bloated endorsement contracts with European clubs like never before, bringing the
top 10 to a total of € 406 million in 2015, as opposed to € 262 million two years earlier (cf. below).
32
Repucom, Les nouveaux contrats record d’Adidas avec Manchester United et la Juventus de Turin en passe de bouleverser le paysage
commercial du football européen, 2014
23Figure 19. Main endorsement contracts of the European football clubs in 2013 and 2015
Source : BASIC, from Brand Finance data – Football 500 (2013 & 2015)
This escalation also affects individual football player endorsement contracts which have risen astronomically these
last few years. While contracts signed from 2010-2013 by Lionel Messi and Christiano Ronaldo were on par with
the “historic” contract signed by Brazilian player Ronaldo in 1997 – reaching about € 15 to 20 million a year –
recent renegotiations have seen a 50% increase according to available information (see following).
Player Sponsor Annual Amount Year
Lionel Messi Adidas 38 MM € 2015
Paul Pogba Adidas 38 MM € 2015
Christiano Ronaldo Nike 25 MM € 2014
Lionel Messi Adidas 21 MM € 2011
Christiano Ronaldo Nike 15 MM € 2011
Ronaldo Nike ~18 MM € 1997
Figure 20. Estimated endorsement contracts with top football stars
Source : BASIC, based on Brand Finance, Karl Lusbec and Sportune data (2016)
242. Business model impact on production and manufacturing countries
2.1 Delocalization of production and reorganization of supply chains
2.1.1 Cost-cutting through sourcing: a more than 40-year-old strategy
As explained in the first chapter, from the dawning of the industry to the 1960s, sports apparel was exclusively
manufactured in Europe.33
The change occurred with the creation of Nike in the United States, whose business model from the outset was
based on sourcing production from Japan where European-quality shoes could be produced at a fraction of the
cost. This strategic choice allowed the American brand to focus on downstream activities (design, innovation) and
to invest massively in marketing and endorsement.34
Facing the oil crisis and rising costs in Japan, Nike began to shift production to South Korea and then Taiwan
starting in 1976. After only 5 years, these two countries came to represent 82% of its supply chain. That same year,
the company closed two factories it had built in the United States to manufacture high-end products, in Maine and
New Hampshire.35
As labor costs rose in South Korea and Taiwan in the following years, Nike incited its suppliers to delocalize
factories to China, Indonesia and then Vietnam, promising them a minimum volume of orders and expert technical
support in exchange. In this way, Nike has built a wide network of suppliers all over Asia, allowing it to reduce
minimum supply costs.36
In this context, Adidas was forced to phase out large-scale production in Europe. With profit margins half of Nike’s,
the company couldn’t keep pace with the marketing and advertising dollars spent by its direct competitors.
To remedy the situation, Adidas shifted its production to Eastern Europe and Asia. By 1985, half of its footwear (40
million pairs per year) was already being manufactured in Taiwan and China by the company Riu. The supply
partner accelerated this trend in the following years by opening its own factories first in South Korea, then in
Malaysia, Thailand and China.
The decision by Adidas to maintain control over its production sites ended in failure: the organizational structure
turned out to be complex and costly without achieving the desired results. This accelerated the movement toward
total outsourcing of Adidas’ production to Asia in the 1990s.37
2.1.2 Facing cost pressure from brands, Asian-based transnational suppliers grow in the 1990s
The movement toward outsourcing spearheaded in the 1980s by the Big Three sparked the emergence of large-
scale transnational suppliers which significantly modified supply chain organization.
33
B. Smith, Pitch Invasion. 2007 op. cit.
34
J. Strasser and L. Becklund, Swoosh, 1993 op. cit.
35
R. M. Locke, The Promise and Perils of Globalization: The Case of Nike, Massachusset Institute of Technology (MIT), 2003
36
R. M. Locke, The Promise and Perils of Globalization, 2003 op. cit.
37
B. Smith, Pitch Invasion. 2007 op. cit.
25Based in Asia, these companies manage manufacturing networks throughout the region to supply big brands, in
particular athletic ones. These suppliers positioned themselves as coordinators of transnational supply rather than
traditional manufacturers – meeting the brands’ need for cost efficiency, quality, and fast turnover.38
Based in South Korea, Taiwan, and Hong Kong, these large producers have inspired copy-cats in other Asian
countries (like Singapore, Malaysia, China, India and Sri Lanka) and in the Middle East.39
Companies like Li & Fung (Hong Kong), Esquel (Hong Kong), Ha-Meen (South Korea), Ramatex (Malaisia), Tri-Star
(Sri Lanka) and Pou Chen (Taiwan) are among the leading suppliers of Nike, Adidas and Puma. Pou Chen, for
example, employs more than 400,000 people in Asia and possesses factories in China, Indonesia and Vietnam. Its
subsidiary Yue Yuen employs 60,000 people in its Dongguan complex near Hong Kong and manufactures about
20% of sports footwear sold each year around the world.40
The emergence of these Asian corporations, unknown to the wider public, has given birth to a “triangular
structure” where intermediary suppliers, now of multinational size, are in direct contact with the brand, and
handle management of the supply chain through a network of subcontracting factories which produce individual
components which they then assemble.41
These intermediary suppliers are often also responsible for prototyping products in close collaboration with the
brand’s designers, effectively leaving the role of apparel manufacturers42 to become co-developers.43
Mainly organized in the footwear manufacturing sector, which is more concentrated, this business model is swiftly
developing in the sports apparel sector which had been much more fragmented.44
In this context, the big brands gradually lost their leverage, becoming but one of these transnational behemoths’
many clients. To contain their supply costs while controlling the quality of their products and conserving their
technical advances, Nike, Adidas, and more recently Puma, have developed new systems of management for their
network of suppliers.
2.2 New methods for sportswear brands to control suppliers and optimize costs
Starting in the 2000s, new methods of optimizing supply chain production and management have emerged in the
sportswear sector, first for footwear and gradually for apparel.45
These systems were invented at Toyota in the 1970s and grouped under the term lean manufacturing or just lean.
Highly adapted to assembly-line products with multiple components, lean management quickly spread through
the auto and electronic industries in Japan, before reaching the United States and Europe in the 1990s.
38
S. Azmeh and K. Nadvi, Asian firms and the restructuring of global value chains, London School of Economics 2014
C. Staritz, Apparel export – still a path for industrial development? Dynamics in apparel global value chains and implications for low-income
countries, OFSE, 2012 ;
R. Appelbaum, Giant Transnational Contractors in East Asia: Emergent Trends in Global Supply Chains, Competition & Change, 2008
39
Ibid.
40
Reuters, http://www.reuters.com/article/yue-yuen-ind-workers-idUSL3N0N02FX20140408 consulté le 10/05/2016
New York Times http://www.clb.org.hk/content/new-york-times-workers-strike-shoe-factory-over-benefits-dispute consulté le 10/05/2016
41
S. Azmeh and K. Nadvi (2014), C. Staritz (2012) and R. Appelbaum (2008) op. cit.
42
également appelé OEM : Original Equipment Manufacturer
43
également appelé ODM : Original Design Manufacturer
44
R. M. Locke, The Promise and Perils of Globalization, 2003 op. cit..
45
Man-Li Lin, Improving Product Development and Production with Target Cost Management: An empirical study of the Taiwanese-owned
sporting goods industry, Tunghai University, 2007
26Guided by demand, no longer by supply, it is founded on three main pillars:
- Just-in-time production.
- Quality at all levels of the chain of production.
- Cost reduction.
In practice, the process is based on actively troubleshooting production disruptions in order to reduce buffer
stocks, fight waste, reduce defects, cut waiting time, master lead times, manage employee skills and reduce
costs.46
Facing the emergence of major Asian manufacturers, Nike and Adidas saw an opportunity to control the quality of
their products, while reducing production costs and maintaining their technical advantage.
One of the main tools used by the sportswear companies in the context of lean is target costing.
This approach extends the “setting price by value” strategy which is the norm in the athletic apparel sector. First
introduced by Nike in the 1980s, it broke with the previous practice of setting prices by adding manufacturing
costs to the desired profit margin.47
46
Ibid.
47
A. Kasanagottuwar et al., Nike Marketing Strategies, NIIT Imperia Bangalore Center, 2011
Market Realist, Understanding NIKE’s Pricing Power and Premium Products Tilt, December 2014
http://marketrealist.com/2014/12/understanding-nikes-pricing-power-and-premium-products-tilt/ consulté le 15/05/2016
27Thanks to target costing (see the flow chart below), sportswear makers now set…
- The final retail price first.
- Then, the desired profit margin.
- To arrive at the maximum production cost of their product.
Thus, for each product they specify to their supplier the origin and price of the raw materials used, as well as the
cost allocated for workers’ salaries.48
Figure 21. Flow Chart Outlining the Principle of Target Costing
Source: Tunghai University (2007)
Today sportswear brands go even further by optimizing the number of minutes spent by workers on each shoe in
order to improve productivity and reduce associated costs, as this document from an internal Adidas presentation
illustrates.49
Figure 22. Optimization strategy for labor costs developed by Adidas
Source: Internal Adidas Presentation (2015)
48
Man-Li Lin, Improving Product Development and Production with Target Cost Management, Tunghai University, 2007 op. cit.
49
www.adidas-group.com/media/filer_public/86/a5/86a53df1-c795-4b consulté le 24/04/2016
28You can also read