Network controllability-based algorithm to target personalized driver genes for discovering combinatorial drugs of individual patients
←
→
Page content transcription
If your browser does not render page correctly, please read the page content below
Published online 12 January 2021                                                              Nucleic Acids Research, 2021, Vol. 49, No. 7 e37
                                                                                                                    doi: 10.1093/nar/gkaa1272

Network controllability-based algorithm to target
personalized driver genes for discovering
combinatorial drugs of individual patients
Wei-Feng Guo 1,2 , Shao-Wu Zhang1,* , Yue-Hua Feng1 , Jing Liang2 , Tao Zeng                                                            3,4,*
                                                                                                                                                and
Luonan Chen4,5,6,7,*
1
 Key Laboratory of Information Fusion Technology of Ministry of Education, School of Automation, Northwestern
Polytechnical University, Xian 710072, China, 2 School of Electrical Engineering, Zhengzhou University,
Zhengzhou 450001, China, 3 CAS Key Laboratory of Computational Biology, Bio-Med Big Data Center, Shanghai

                                                                                                                                                                  Downloaded from https://academic.oup.com/nar/article/49/7/e37/6090299 by guest on 18 April 2021
Institute of Nutrition and Health, University of Chinese Academy of Sciences, Chinese Academy of Sciences,
Shanghai 200031, China, 4 Shanghai Institute of Biochemistry and Cell Biology, Center for Excellence in Molecular
Cell Science, Chinese Academy Science, Shanghai 200031, China, 5 School of Life Science and Technology,
ShanghaiTech University, Shanghai 201210, China, 6 Center for Excellence in Animal Evolution and Genetics,
Chinese Academy of Sciences, Kunming 650223, China and 7 Key Laboratory of Systems Biology, Hangzhou Institute
for Advanced Study, University of Chinese Academy of Sciences, Chinese Academy of Sciences, Hangzhou 310024,
China

Received October 07, 2020; Revised December 02, 2020; Editorial Decision December 18, 2020; Accepted December 22, 2020

ABSTRACT                                                                          gies in identifying clinical efficacious paired combi-
                                                                                  natorial drugs. Furthermore, CPGD enhanced can-
Multiple driver genes in individual patient samples
                                                                                  cer subtyping by computationally providing person-
may cause resistance to individual drugs in precision
                                                                                  alized side effect signatures for individual patients.
medicine. However, current computational methods
                                                                                  In addition, CPGD identified 90 drug combinations
have not studied how to fill the gap between per-
                                                                                  candidates from SARS-COV2 dataset as potential
sonalized driver gene identification and combinato-
                                                                                  drug repurposing candidates for recently spreading
rial drug discovery for individual patients. Here, we
                                                                                  COVID-19.
developed a novel structural network controllability-
based personalized driver genes and combinatorial
drug identification algorithm (CPGD), aiming to iden-
                                                                                  INTRODUCTION
tify combinatorial drugs for an individual patient by
targeting personalized driver genes from network                                  The combination therapy has been widely used in the dis-
controllability perspective. On two benchmark dis-                                ease treatment, because it is difficult to achieve the desired
ease datasets (i.e. breast cancer and lung cancer                                 clinical effect for monotherapy and the multiple drugs has
datasets), performance of CPGD is superior to that                                demonstrated great advantages in overcoming drug resis-
of other state-of-the-art driver gene-focus methods                               tance and improving clinical outcomes in disease therapy
                                                                                  (1). As well known to us, many complex diseases such as
in terms of discovery rate among prior-known clin-
                                                                                  cancer are heterogeneous diseases, and the tumor genes co-
ical efficacious combinatorial drugs. Especially on                               operate as well as adapt and evolve to the changing condi-
breast cancer dataset, CPGD evaluated synergis-                                   tions for individual patients (2,3). Thus, it is essential to con-
tic effect of pairwise drug combinations by mea-                                  sider the individual heterogeneity during combination ther-
suring synergistic effect of their corresponding per-                             apy in the disease treatment. However, the number of po-
sonalized driver gene modules, which are affected                                 tential combinatorial drugs is astronomical, and these can-
by a given targeting personalized driver gene set                                 didate compound combinations cannot all be validated in a
of drugs. The results showed that CPGD performs                                   rational and rigorous manner for individual patients. There-
better than existing synergistic combinatorial strate-                            fore, it is quite challenging to predict the individual tar-
                                                                                  geted combinatorial drugs in the era of precision medicine,

* To
   whom correspondence should be addressed. Tel: +86 29 88431308; Fax: +86 29 88431306; Email: zhangsw@nwpu.edu.cn
Correspondence may also be addressed to Tao Zeng. Tel: +86 21 54920102; Fax: +86 21 54920120; Email: zengtao@sibs.ac.cn
Correspondence may also be addressed to Luonan Chen. Tel: +86 21 54920100; Fax: +86 21 54920120; Email: lnchen@sibs.ac.cn

C The Author(s) 2021. Published by Oxford University Press on behalf of Nucleic Acids Research.
This is an Open Access article distributed under the terms of the Creative Commons Attribution-NonCommercial License
(http://creativecommons.org/licenses/by-nc/4.0/), which permits non-commercial re-use, distribution, and reproduction in any medium, provided the original work
is properly cited. For commercial re-use, please contact journals.permissions@oup.com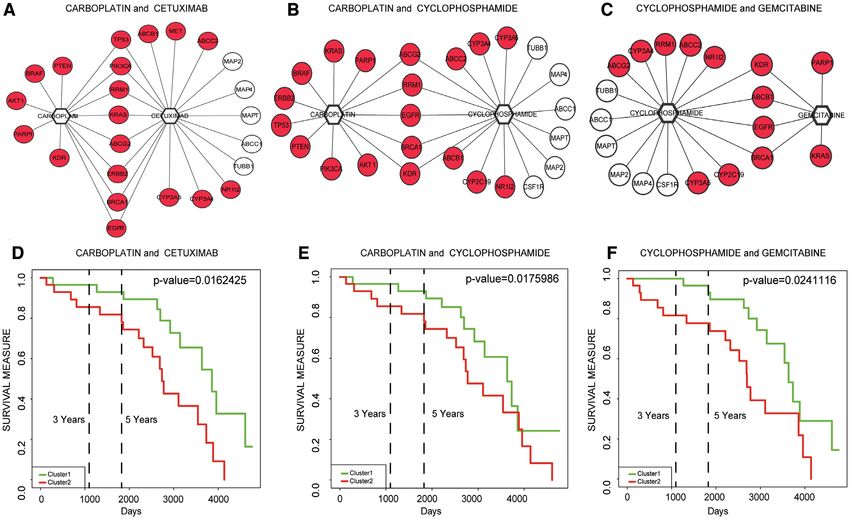
e37 Nucleic Acids Research, 2021, Vol. 49, No. 7                                                                 PAGE 2 OF 21

rather than conventional patient-cohort targeted combina-          (paired-SSN) (24) to construct the personalized gene inter-
torial drugs.                                                      action network (PGIN) whose interactions determine the
   Current methods of identifying combinatorial drugs have         state transition of an individual patient during disease de-
two main categories. (i) Machine learning-based methods            velopment. Instead of directly using paired-SSN method
extract the feature vector of the known synergistic drug           on gene expression data, we introduced a measurement
combinations on a large variety of cancer cell lines, then uti-    (i.e. network edge score) to score the edges of PGIN by in-
lize the machine learning to predict drug combinations (4–         tegrating the co-mutation score across cancer type-specific
6). However, because of the limited number of the personal-        data and the personalized co-expression score of each indi-
ized samples information (e.g. the personalized omics data),       vidual patient. Then, according to a FVS-based controlla-
it is difficult to select/find the effective individual patient-   bility perspective, we developed a novel nonlinear structural
specific synergistic drug combinations. (ii) Along with the        network controllability method (namely weight-NCUA) to
rapid development of high-throughput biological molecule           identify the PDGs for determining the state transition of
screening, the emergence of systems biology or network bi-         the individual biological system between disease state and
ology has raised the possibility of exploring multi-targets        normal state. In contrast with other structural network con-

                                                                                                                                   Downloaded from https://academic.oup.com/nar/article/49/7/e37/6090299 by guest on 18 April 2021
intervention methods with drug synergistic effects for dis-        trollability approaches, weight-NCUA considers the edge
ease treatment (7–9). From a network perspective, many             weight information (i.e. network edge score) for the driver
studies have demonstrated that targeting driver genes (i.e.        node optimization. Finally, the information of the drugs–
candidate drug targets) can provide the critical information       PDGs interactions and PDGs interactions were used for: (i)
for drug discovery and drug repurposing (10–13). Conse-            prioritizing the personalized combinatorial drugs to evalu-
quently, some methods have been developed for driver gene          ate the ability of predicting clinical efficacious combinato-
identification with multi-dimensional genomic data, such           rial drugs; (ii) exploring the risk assessment of individual
as DriverML (14), DriverNet (15), MutSigCV (16), Onco-             patients on the basis of paired combinatorial drugs and (iii)
DriveFM (17), SCS (18) and DawnRank (19). But those ex-            enhancing the cancer subtyping by side effect quantification
isting methods did not fill the gap between the anticancer         on PDGs.
combinatorial drugs discovery and the targeting personal-             We have evaluated the effectiveness of CPGD on the
ized driver genes (PDGs) identification, and new algorithms        breast and lung cancer datasets which were derived from
are urgently required to recommend the personalized com-           The Cancer Genome Atlas (TCGA). On one hand, CPGD
binatorial drugs in the disease treatment.                         can effectively predict clinical efficacious combinatorial
   In the past decade, some researches have studied the            drugs, compared with other state-of-the-art driver gene
structural network controllability principles, such as max-        methods. By simultaneously considering the disease related
imum matching set (MMS) (20), minimum dominating set               gene module information and multi-sources drug func-
(MDS) (21) and feedback vertex set (FVS) (22). Further-            tion information, CPGD can measure the synergistic ef-
more, a wealth of sample-specific network construction             fect of the corresponding personalized driver gene modules
methods in single samples has been proposed recently to            for evaluating the synergistic effect of pairwise drug com-
support the personalized driver genes analysis on individ-         binations. On the other hand, CPGD has detected three
ual patient-specific biological data (23). These methodolog-       novel pairwise drug combinations (i.e. CETUXIMAB and
ical advances have raised the possibility of exploring more        CARBOPLATIN, CARBOPLATIN and CYCLOPHOSP
precise mathematical models on high throughput personal-           HAMIDE, CYCLOPHOSPHAMIDE and GEMCITAB
ized multi-omics data for the discovery of efficacious per-        INE), and they can significantly divide the breast cancer
sonalized drug combinations. However, the existing struc-          patients into the discriminative risk groups with the per-
tural network controllability methods still face several lim-      sonalized co-targeting driver genes of paired combinatorial
itations. The first is that a proper network structure is not      drugs. Those results were also supported by TCGA-BRCA
available to characterize the gene regulatory mechanism of         cancer dataset and the independent GSE5327-BRCA can-
an individual patient, which is a rate-limiting step of struc-     cer dataset. By quantifying the side effect of the personal-
tural network controllability methods. The second is that          ized combinatorial drugs on the personalized driver genes
current structural network controllability methods focus on        for each individual patient, CPGD further identified two
the selection of minimum number of driver nodes but over-          new subtypes on breast cancer with significant differences
look the weight information of network edges/relations,            in survival. In addition, we have applied CPGD on severe
which may generate multiple configurations with same min-          acute respiratory syndrome coronavirus 2 (SARS-COV2)
imum number of driver nodes, resulting in a potential bot-         dataset, which consists of gene expression data of patients
tleneck for identifying the combinatorial drugs of individ-        with SARS (25) and 332 SARS-COV2 related proteins
ual patients. And the third is that gold standard evaluation       for identifying drug combination candidates (26). Con-
metrics are not available when evaluating the performance          sequently, CPGD identified 90 drug combination candi-
of identifying the personalized combinatorial drugs with           dates. Among these drug combination candidates, a pair-
different structural network controllability methods.              wise drug combination (i.e. DEXAMETHASONE and TH
   To overcome above problems, we developed a novel                ALIDOMIDE) is predicted as the potential promising drug
structural network controllability-based algorithm (namely         combination candidates, both of which are currently be-
CPGD) to detect PDGs and further identified the per-               ing tested in clinical trials for coronavirus disease 2019
sonalized combinatorial drugs for an individual patient.           (COVID-19) as a recent report (https://www.ncbi.nlm.nih.
We firstly used the paired single sample-network method            gov/pmc/articles/PMC7280907/).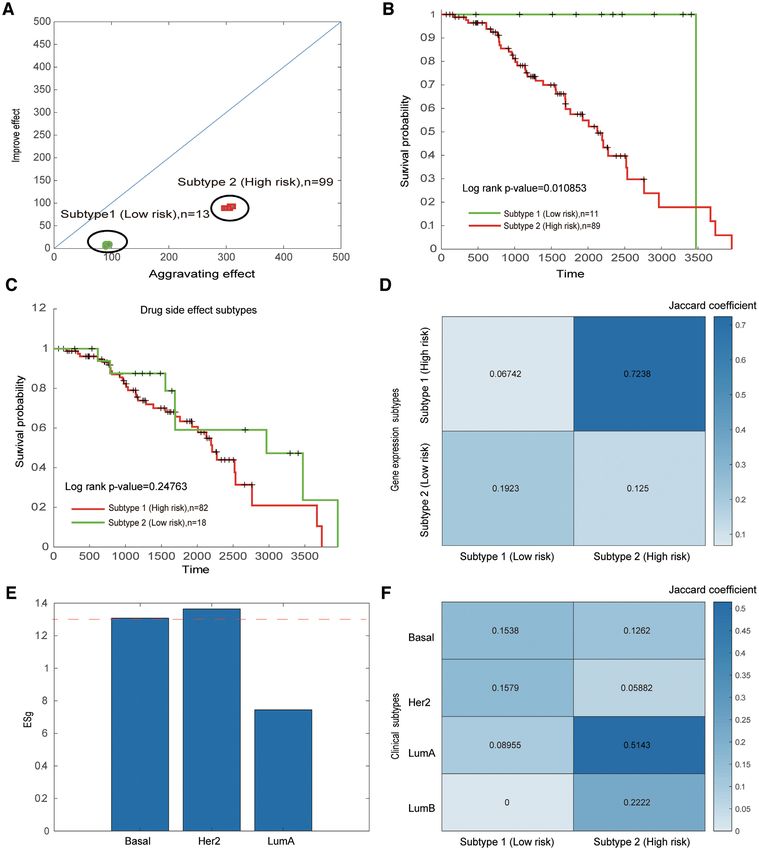
PAGE 3 OF 21                                                               Nucleic Acids Research, 2021, Vol. 49, No. 7 e37

MATERIALS AND METHODS                                           Human drug–target network with activation and inhibition
                                                                interactions
Gene expression datasets
                                                                To analyze the risk assessment of cancer patients, the hu-
Considering the sufficiently available gold-standard clini-
                                                                man drug–target network with activation and inhibition in-
cal combinatorial drug information, we considered breast
                                                                teraction information was further added into the network-
cancer and lung cancer datasets as two benchmark disease
                                                                based investigation of drug–target interactions (32).
datasets and the detailed information of cancer samples
used in this study was summarized in Supplementary note
4 of Supplementary file 1 and Supplementary file 2. Conse-      Construction of personalized gene interaction networks by us-
quently, we collected two cancer gene expression datasets       ing paired-SSN method
from breast and lung cancer patients. The breast cancer
dataset is breast invasive carcinoma (BRCA), and the lung       For paired-SSN method (24), the co-expression networks of
cancer dataset consists of lung adenocarcinoma (LUAD)           the tumor sample and normal sample for an individual pa-
and lung squamous cell carcinoma (LUSC). The paired (or         tient are separately built by using SSN method (33). Then,
                                                                the personalized gene interaction networks are constructed

                                                                                                                                    Downloaded from https://academic.oup.com/nar/article/49/7/e37/6090299 by guest on 18 April 2021
matched) samples for each individual patient (i.e. a normal
sample and a tumor sample from the same patient) were           by using the following criterion. When the P-value of edge
filtered, then obtaining them from the TCGA data portal.        between gene i and gene j is 0.05 in the tumor sample net-
related dataset which consists of gene expression data of pa-   work but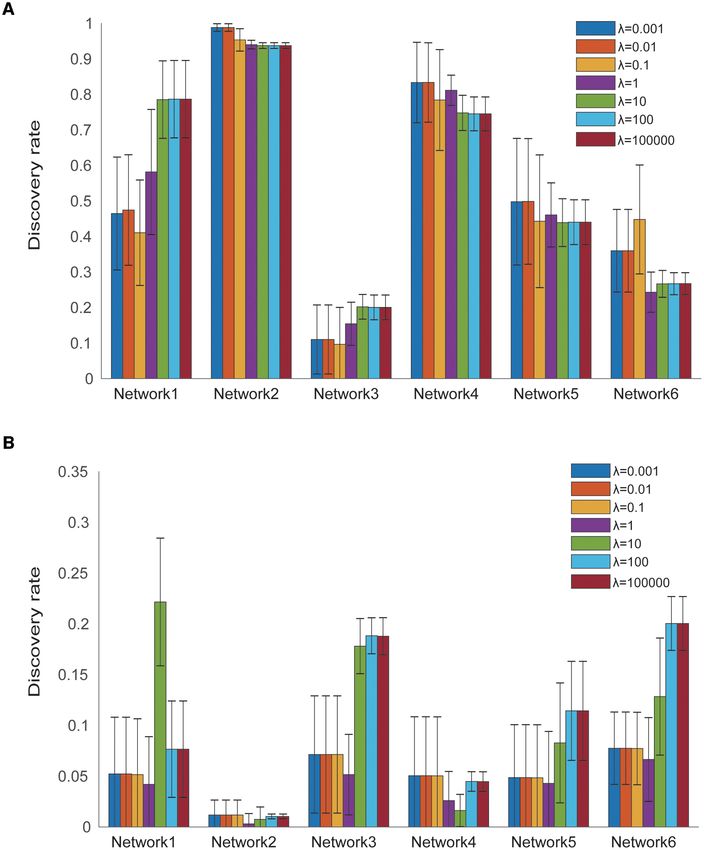
e37 Nucleic Acids Research, 2021, Vol. 49, No. 7                                                                                  PAGE 4 OF 21

sent the personalized state transition of an individual pa-       where wi denotes the network edge score related to gene
tient in cancer development, which integrates the gene so-        i; ri is an indicative variable,when
                                                                                                      gene i is selected as the
matic mutations, personalized gene expression and network         PDGs, ri = 1, otherwise, ri = 0;      wi ri
                                                                                                              denotes the net-
topology information in the prior-known human genetic in-         work edge scores of candidate gene sets;       ri denotes the
teraction network.                                                number of candidate PDGs; and λ is the balance parameter
   And based on the network edge scores related to each           to adjust the network edge scores and the number of candi-
gene in PGIN, the node weight wi was calculated with the          date PDGs.
following formula:                                                   For weight-NCUA, we expect that the PDGs not only
                                                                 contain the minimum number, but also have the maximum
                      wi =       ei j                   (5)       network edge scores. It is required to further measure the
                                j ∈N(i )                          quality of candidate set of PDGs. Thus, we select the PDGs
                                                                  by solving the following linear integer programming (LIP):
where N(i) represents the neighboring node set of node i
                                                                                         max W(M)= wi ri −λ ri
in PGIN. Therefore, the PGINs can reveal the significant                                 s.t.

                                                                                                ri ≥1 (∀u∈VL ),ri ={0,1}                           (8)
gene interactions between the normal and tumor samples

                                                                                                                                                         Downloaded from https://academic.oup.com/nar/article/49/7/e37/6090299 by guest on 18 April 2021
                                                                                            i ∈N(u)

for each patient during disease development, with weight
                                                                  where VL denotes the bottom side nodes in the bipartite
information on nodes and edges.
                                                                  graph andN(u)N(u) denotes the neighborhood nodes in the
                                                                  bipartite graph. This LIP objective function is to obtain
Weight-NCUA method                                                the PDGs with the minimum number and the maximum
                                                                  network edge scores. The restriction condition is to ensure
In network systems with adequate knowledge of the un-             that all the edges of PGIN in bipartite network can be cov-
derlying wiring diagram, disregarding specific functional         ered. Under the dynamic behavior, the state of all genes in a
forms, the FVS-based controllability (FC) methods can             PGIN can be regulated by the detected PDGs. Above op-
identify driver nodes to drive the system state into any          timization problem can be solved by using the LP-based
desired dynamical attractor. Under the FC framework,              classic branch and bound methods (35) or other objective
NCUA has been proposed to investigate the controllabil-           optimization algorithms (36–38).
ity of undirected structural networks, selecting a minimum
set of driver nodes to realize a undirected structural net-       Synergistic effect evaluation
work controllable (24). However, NCUA does not consider
potential multiple sets of driver nodes, which would cause        Because of the limited number of individual patient-specific
the underestimation of different drivers’ importance. Thus,       cancer samples, it is possible to select the effective syner-
here we proposed the weight-NCUA method to find opti-             gistic drug combinations with target network-based meth-
mal driver node set by using the network edge weight infor-       ods (10–13). The key point of target network-based meth-
mation (i.e. network edge score).                                 ods is to construct a reliable drug-target network by using
   Theoretically, weight-NCUA uses the following dynamic          data from various sources, then develop a network-based
equation to represent the dynamic behavior of a PGIN.             learning method to predict the drug synergy. For exam-
                                                                  ple, DrugComboRanker was proposed to rank the paired
                    d xik /dt = f (xik , xIki )             (6)   drug combinations by targeting their corresponding signal-
                                                                  ing modules in cancer-specific networks. However, Drug-
where xik denotes the expression state of gene i for the pa-      ComboRanker considers the combinatorial drug prediction
tient k, Ii represents the neighborhood gene set of gene          of conventional patient-cohort, but ignores the discovery of
i,and f f represents the dynamic behavior control law of          personalized combinatorial drugs.
PGIN for patient k, satisfying the continuous differentia-           Considering the above facts, CPGD evaluates the syn-
bility, dissipativity, and decay conditions (22). Equation        ergistic effect of paired drug combinations by combining
(6) represents the dynamic behavior of the gene expression        drug target related information with drug similarity from
level in PGIN. We assume that each edge in PGIN is bi-            the Connectivity Map (CMAP) database (39), as well as
directional, thus we can convert PGIN into a bipartite net-       the drug chemical structure similarity (40). The synergis-
work in which the the upside nodes and bottom side nodes          tic effect of CPGD consists of two parts, i.e. Drug Target
represent the nodes and the edges of the original network,        (DT) score, Drug Function and Drug Chemical structure
respectively. If the node vi in the up side is one of nodes for   (DFDC) score. The synergistic effect of paired drugs on in-
                                                                  dividual patient k is evaluated by using the following for-
edge vj in the bottom side, then vi and vj are linked in the      mulas:
bipartite network. Based on the FVS controllability theory,
weight-NCUA selects the dominated nodes set M in the up               Synergy scor e(drugA, drugB, Patientk) = DT scor e(dr ug A, dr ug B, k)

side that cover the nodes in the bottom side as the driver                                                      +DF DC scor e(dr ug A, dr ug B)    (9)
nodes, which determine the state of PGIN.
   It is known that different dominated nodes sets in the bi-       On one hand, the DT score is defined as,
partite network may generate multiple sets of PDGs, result-           DT scor e(drugA, drugB, k)=Di sease scor e(drugA, M, k)
ing in a potential bottleneck for identifying the combina-            ∗Di sease scor e(drugB, M, k) ∗ Jaccar d scor e(drugA, drugB, k)            (10)
                                                                      ∗G O scor e(drugA, drugB, k)+DF DC scor e(drugA, drugB)
torial drugs of the individual patients. Therefore, we intro-
duced an index W(M) to indicate the quality of the selected                                                             k
PDGs.                                                                  Di sease scor e(drugA, M, k)= − log10 (P−value(DMA , M))                   (11)

                 W(M) =        wi ri − λ    ri              (7)       Jaccar d scor e(drugA, drugB, k)=Jaccard(drug A, drugB, k)                  (12)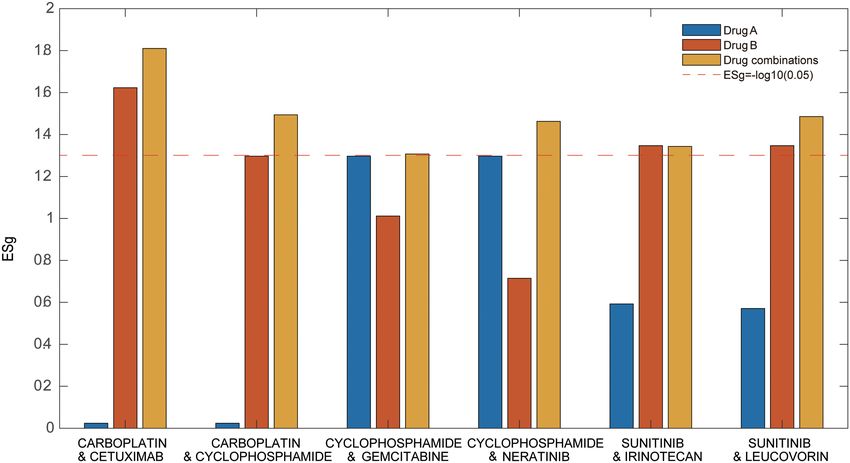
PAGE 5 OF 21                                                                   Nucleic Acids Research, 2021, Vol. 49, No. 7 e37

where P-value is calculated for evaluating the significance          file 3. The code for calculating above drug function similar-
level by hyper-geometric test.                                       ity was provided in supplementary note 5 of Supplementary
                                                                     file 1. Finally, the dissimilarity SG (A, B) between drug A and

                                     o
                                                                     drug B into the similarity score was converted as follows,
             P-value(DMAk , M) =              p(o, oi )       (13)
                                     oi =os                                    C map(drugA, drugB)=1 − SG (A,B)                 (18)
                                                                   To obtain the chemical structure similarity, we firstly
                              s    N−s                               collected the drug SMILES information from DrugBank
                              oi   o − oi                            (30), and then calculated the Extended Connectivity Finger-
                  P(o, oi )=                                (14)   prints (ECFP) (45) with a radius of six (ECFP 6) by RDKit
                                  N
                                  o                                  python package. Finally, the chemical structure similarity of
                                                                     each drug pairs was calculated by Tanimoto coefficient (40).
whereos os denotes the number of intersected genes between           The drug chemical structure similarity file was provided in
driver gene module DMAk and disease related gene module              Supplementary file 3.

                                                                                                                                        Downloaded from https://academic.oup.com/nar/article/49/7/e37/6090299 by guest on 18 April 2021
M; N denotes the total number of genes in PGIN; o and s
are the number of nodes in DMAk and M, respectively.
                                                                     Side effect evaluation

                                    DMk ∩ DMk                      To calculate the side effect score of a given drug pair, we
       Jaccard(drugA, drugB, k) =       A       B
                                                      (15)
                                    DMk ∪ DMk                      firstly collected the drug-target network with the informa-
                                                A         B
                                                                     tion of activation and inhibition interaction. Then we gave
where DMAk and DMBk denotes the driver gene                          the classification results of sharing targets of two drugs for
module of drug A and drug B, respectively,                           characterizing the effect of a given drug pair. The configu-
i.e. DMAk = {tAi
              k
                 },DMBk = {tBj
                            k
                               },i ∈ [1,n], j ∈ [1,m].               rations (+,+) and (−,−) of the sharing targets of two drugs
                                                                    are referred as coherent, where the action of one drug on
                                                  k
                                            si m(tAi , tBj
                                                        k
                                                           )         the sharing targets is reinforced by the presence of a second
                                         i, j                        drug. The configuration (+,−) of the sharing targets of two
   G O scor e(drugA, drugB, k)=                               (16)
                                     (m + n)(m + n − 1)              drugs is called incoherent, where the action of one drug on
                                                                     the sharing targets is mitigated by the presence of a second
where si m(tAik
                , tBj
                   k
                      ) is the semantic similarity of gene ontol-    drug. Finally, the side effect score (32) can be calculated by
                                 k        k                          using the following formula.
ogy (GO) annotations of tAi        and tBj   based on the Gene
                                           k k k
Ontology (GO) term profiles (41). tAi tBj tBj denotes the i-                        bi j = sign(si+−   ++     −−
                                                                                                  j − si j − si j )             (19)
th target of drug A and j-th target of drug B for individ-
ual patient k respectively. The semantic similarity is cal-          where sign denotes the signum function; si++      +− −−
                                                                                                                  j , si j , si j de-
culated with GOSemSim R package under the ‘measure’                  note the number of sharing targets with configurations (+,
parameter setting to ‘wang’ (42). The GO similarity was              +), (+, −) and (−, −) for drug pair (i, j), respectively. The
provided in the folder ‘Drug Targets GO similarity Data’
of https://github.com/NWPU-903PR/CPGD. On the other                  computational procedure is shown in Supplementary Fig-
hand, the DFDC score are defined as following,                       ure S2 (Supplementary file 1).

     DF DC scor e(drugA, drugB) = C map(drugA, drugB)
                                                                     Enrichment analysis of the PDGs in prior-known cancer
                                   +Chemical(drugA, drugB)    (17)   driver gene lists
where C map(drug A, drug B) denotes the drug function                To estimate the significance of overlap between the pre-
similarity between drug A and drug B based on genomic                dicted PDGs and the gold-standard cancer driver gene lists
profiling data of drugs, which are available in the CMAP             such as Cancer Census Genes (CCG) (46) and Network of
(39). CMAP dataset consists of 6100 gene expression pro-             Cancer Genes (NCG) (47), we computed the P-value by the
files of four cancer cell lines (i.e. MCF7, PC3, HL60                hyper geometric test (48) as follows.
and SKMEL5) treated by 1309 drugs at different doses.
Chemical(drug A, drug B) denotes the chemical structure                                                K    N−K
                                                                                                  ∞
                                                                                                 x
similarity between drug A and drug B.                                                                       n−x
                                                                               p = P (x ≥ k) =                          (20)
   In details, the drug similarity metric proposed by Iorio                                                 N
                                                                                                 x=k
et al. (43) is defined as the drug similarity in the CMAP                                                   n
dataset as follows. First, for each individual drug at each
dose, genes were ranked based on their fold changes (i.e.,           where N is the number of genes in PGIN, K is the num-
drug treatment versus control). Then, gene rank lists at dif-        ber of a given cancer driver gene lists (e.g. lists of the per-
ferent doses were merged into one gene rank list by using            sonalized Differential Expression Genes (DEG), CCG and
a hierarchical majority voting scheme. Consequently, gene            NCG), k is the number of the predicted PDGs overlapping
signatures for individual drugs were created by optimally se-        with the given gene lists, and n is number of the predicted
lecting the top- and bottom-ranked 250 genes and the gene            PDGs. The personalized DEGs are selected by calculat-
set enrichment analysis (44). The drug function similarity           ing the fold-change between the normal sample and tumor
file in the CMAP dataset was provided in Supplementary               sample (|log2 (fold-change)|>1). If the enrichment P-value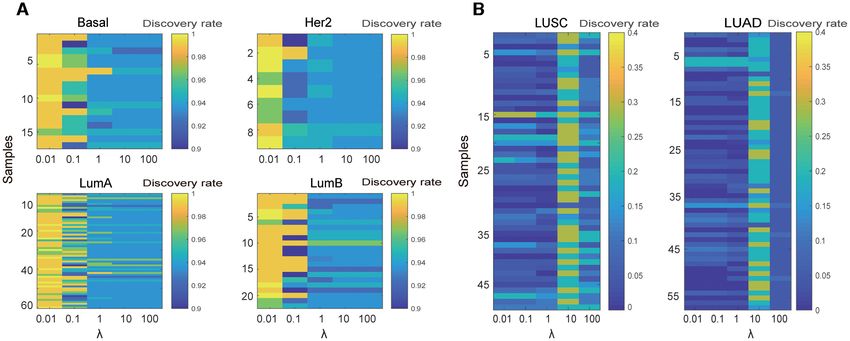
e37 Nucleic Acids Research, 2021, Vol. 49, No. 7                                                                    PAGE 6 OF 21

is 0), and the number of drug pairs with enhanc-
    level. Our recent work showed that traditional MMS-                 ing effect (i.e. side effect score < 0), which are two side
    based controllability methods (20) ignore the fundamen-             effect signatures of individual patients.
    tal nonlinear dynamics of system, which may lead to
    many false positive results. Thus, based on FVS con-
                                                                   Determination of the reference gene interaction networks and
    trol theory, a structural network controllability method
                                                                   parameters in CPGD
    (called NCUA), was developed in our previous work
    (24) which focus on how to choose proper subset nodes          To assess the effect of different sources of prior-known gene
    (i.e. driver nodes) for driving the network from initial       interaction networks on the performance of CPGD, we have
    state to desired stable state by proper input signals.         adopted six gene interaction networks from different litera-
    However, NCUA overlooks the weight information of              tures. The reference Network 1 was built by Hou et al. (19),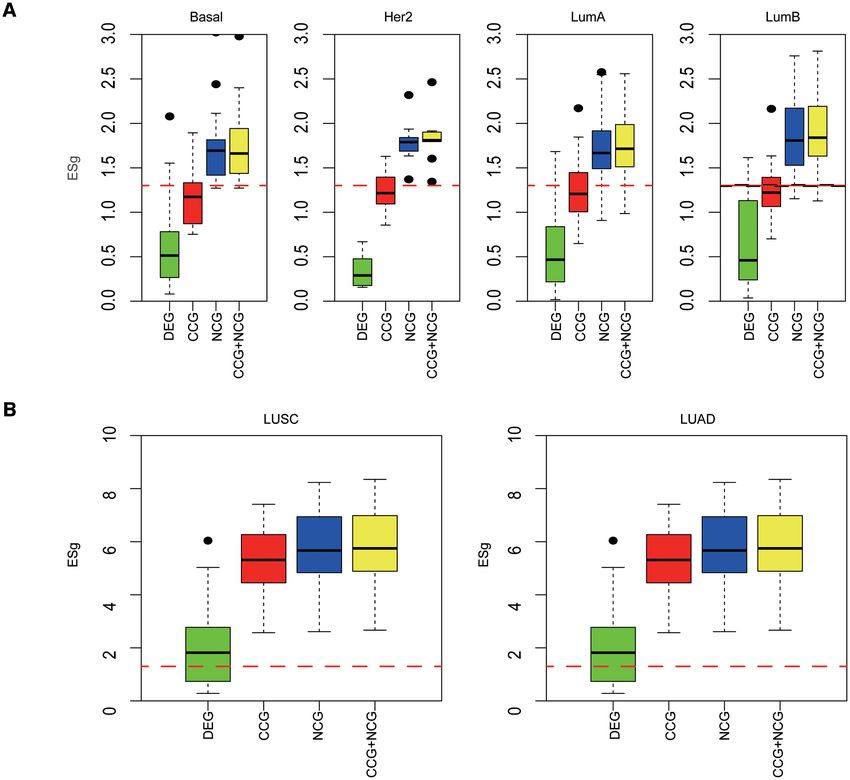
PAGE 7 OF 21 Nucleic Acids Research, 2021, Vol. 49, No. 7 e37
Downloaded from https://academic.oup.com/nar/article/49/7/e37/6090299 by guest on 18 April 2021
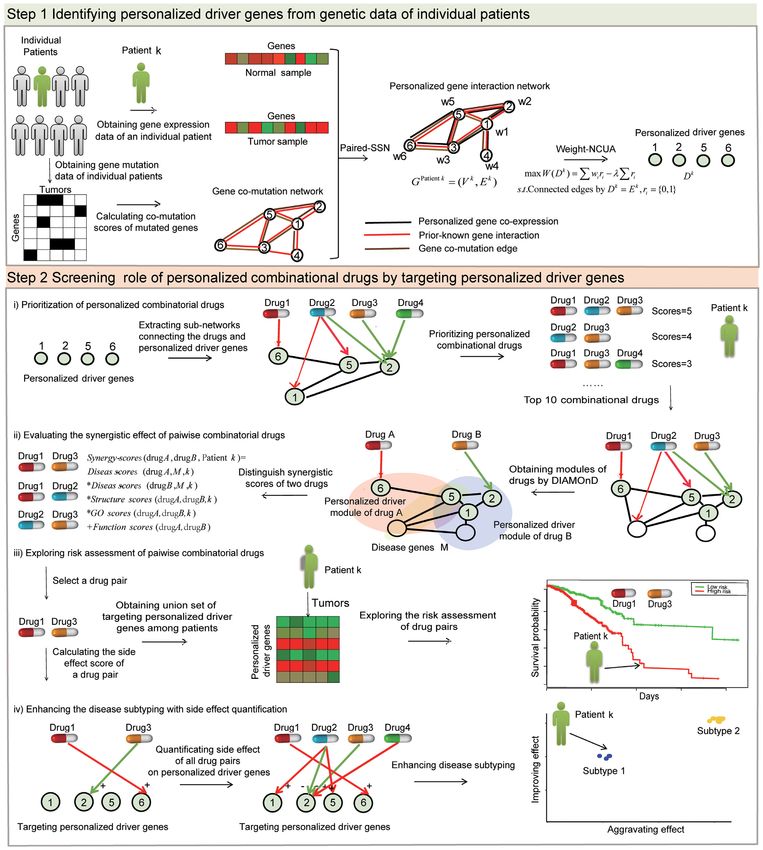
Figure 1. CPGD overview. Step 1: Paired-SSN is used to construct the PGIN for capturing the phenotypic transitions between normal and disease states.
Instead of using Paired-SSN method on gene expression data alone, we introduce network edge score for measuring the edges of PGIN by integrating cancer
type-specific somatic mutation data into PGIN. The edges of PGIN integrate co-mutation scores, personalized gene co-expression scores, and prior-known
interactions. Then, an improved structural network controllability method (called weight-NCUA) is developed to identify the PDGs, where the driver
genes are considered as candidate drug targets towards the desired control objective by drug activation. Step 2: CPGD screens the role of personalized
combinatorial drugs from several biomedical aspects. (i) At first, CPGD will prioritizes the personalized combinatorial drugs by measuring the number of
targeting PDGs. (ii) Second, it can explore synergistic effect of drug pairs by a few sub-steps: to select drug pairs from top 10 candidate combinatorial drugs
for each patient as candidate drug pairs; to evaluate the synergistic effect of these candidate pairwise drug combinations, which measures the synergistic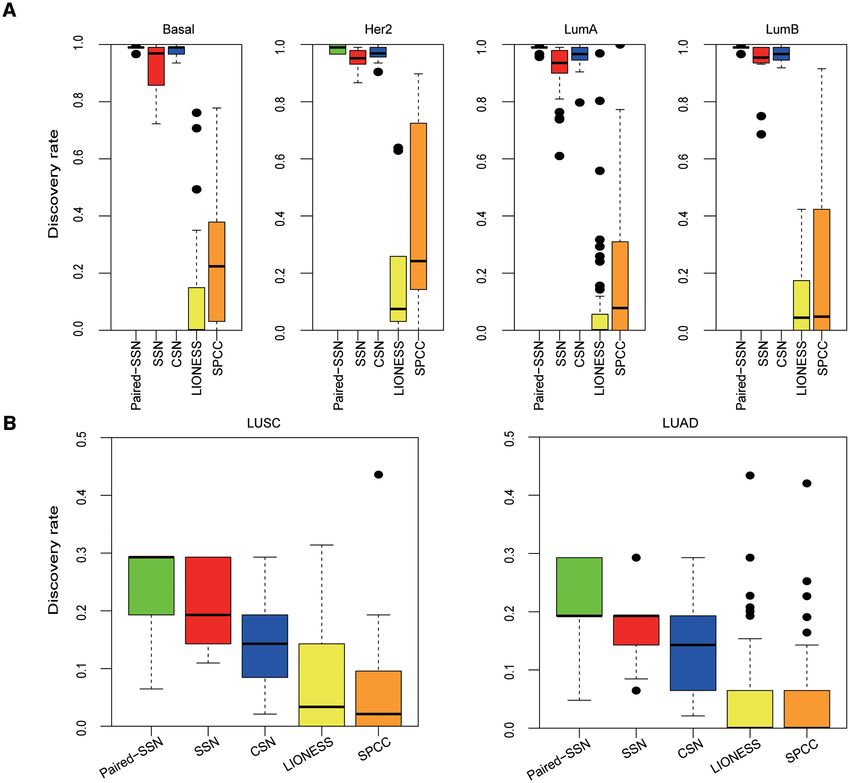
e37 Nucleic Acids Research, 2021, Vol. 49, No. 7                                                                                          PAGE 8 OF 21

which consists of 11 648 genes and 211 794 edges by inte-                        work with highest performance; (ii) when the gold-standard
grating a variety of data sources, such as MEMo (51), Reac-                      of anticancer drug combinations is not available, Network 1
tome (52), NCI-Nature Curated PID (53) and KEGG (54).                            with more stable performance could be considered as prior-
The reference Network 2 was built by Quan et al. (27) from                       known network.
the Synthetic Lethality genes interactions Database (Syn-                           Furthermore, the performances of CPGD in different
LethDB), which consists of 6513 genes and 19 955 synthetic                       subtypes on BRCA (Network 2) and LUNG (Network 1)
lethal gene pairs for humantumors. The reference Network                         cancer datasets were shown in Figure 3A and B, from which
3 was constructed by Vinayagam et al. (55), which consists                       we can see that the discovery rates of CPGD with λ= 0.01
of 6339 proteins and 34 813 edges, where the edge denotes                        and λ= 10 are the highest for BRCA and LUNG respec-
the hierarchy of signal flow between the interacting pro-                        tively, which are consistent in different cancer subtypes. The
teins.The reference Network 4 was constructed in reference                       common driver genes predicted by CPGD in different sub-
(56). The Network 5 was collected from STRING dataset                            types from BRCA and LUNG cancer datasets were listed in
(https://string-db.org/) whose edge scores are higher than                       Supplementary file 4. The comparisons of common driver
900. The Network 6 consists of gene interactions by remov-                       genes for various different subtypes in breast and lung can-

                                                                                                                                                               Downloaded from https://academic.oup.com/nar/article/49/7/e37/6090299 by guest on 18 April 2021
ing co-expression edges, the literature-derived interactions,                    cer datasets were shown in Supplementary Figure S3, from
and predicted interactions from Network 1 (24). Above                            which we found that the subtype-specific driver genes are
six networks were provided in the folder ‘All gene interac-                      different in different cancer datasets.
tion networks used CPGD’ of https://github.com/NWPU-                                  In addition, we also found that CPGD can obtain
903PR/CPGD.                                                                      novel predictions in the top-ranked drug combinations, be-
   By using each reference gene interaction network, CPGD                        sides those already in clinical trials (Supplementary Fig-
outputs the PDGs for each individual patient and ranks the                       ures S11 and S12). CPGD can identify at least one novel
candidate combinatorial drugs according to the number of                         drug combinations among top 10 predicted drug combi-
targeting PDGs. Based on the ranking of candidate combi-                         nations for Lum A, Lum B, HER2, and Basal subtypes
natorial drugs for each individual patient, we assessed the                      on BRCA cancer dataset, while CPGD can identify at
effect of different reference gene interaction networks on                       least nine novel drug combinations among top 10 pre-
CPGD in terms of discovery rate (DR) among prior-known                           dicted drug combinations for LUSC and LUAD subtype-
                                                    n
                                                                                 specific patients from LUNG cancer dataset. Based on the
clinical efficacious combinatorial drugs, DR =         pk /n,                    mean ranking of subtype-specific cancer patients, we also
                                                               k=1
where pk denotes the fraction of the top k predicted com-                        gave the full ranking list of drug combinations in differ-
binatorial drugs within the Clinical Anti-disease Combina-                       ent subtypes of BRCA and LUNG cancer datasets (Sup-
torial drugs for treating disease, and n is the number of top                    plementary file 5). We found that there are some novel
ranked anti-disease drug (here, n = 10).                                         predictions in BRCA and LUNG cancer datasets. For ex-
   The performance of CPGD with different reference gene                         ample, DC000222 (i.e. TRASTUZUMAB, DOCETAXEL,
interaction networks on BRCA and LUNG datasets were                              CARBOPLATIN, LETROZOLE and LAPATINIB) and
shown in Figure 2A and B. We can find that: (i) com-                             DC002977 (i.e. TRASTUZUMAB,DOCETAXEL, CARB
pared with other networks, Network 1 with more complete                          OPLATIN,DOXORUBICIN and CYCLOPHOSPHAMI
gene interactions have more stable performance in BRCA                           DE) are novel predicted drug combinations for breast and
and LUNG datasets, which may be a general suggestion as                          lung cancer patients, respectively.
prior-known network; (ii) Network 1 has the highest discov-
ery rate for LUNG, while Network 2 has the highest discov-                       Evaluation of detection robustness of PDGs on gene expres-
ery rate in BRCA; (iii) the balance parameter (λ) has differ-                    sion data
ent effects to CPGD on BRCA and LUSC cancer datasets,
and the reference networks. The discovery rate of CPGD                           We used the gene expression data of subtype-specific pa-
with λ= 0.01 in BRCA and with λ= 10 in LUNG is the                               tients to obtain the PDGs, and calculated the jaccard coeffi-
highest, which were selected for follow-up analysis.                             cient between the PDGs of subtype-specific gene expression
     The choice of proper prior-known network structure                          data and those of all gene expression data (Supplementary
is an important factor for CPGD. According to the re-                            Figure S4). We found that the jaccard coefficient is larger
sults in Figure 2A and B, several suggestions for choosing                       than 0.6 when the balance parameter λ varies from 0.6
more proper prior-known networks were concluded as fol-                          to 1, demonstrating that the prediction results of subtype-
lows: (i) when the gold-standard of anticancer drug com-                         specific gene expression data are similar or consistent with
binations is available, we can choose the prior-known net-                       those of all gene expression data. When λ increases, the jac-

←−−−−−−−−−−−−−−−−−−−−−−−−−−−−−−−−−−−−−−−−−−−−−−−−−−−−−−−−−−−−−−−−−−−−−−−−−−−−−−−−−−−−−−−−−−−
effect of their corresponding PDGMs by considering disease related gene module information and multi-sources drug function information. (iii) Third,
CPGD could explore risk assessment of drug pairs. For a given pairwise drug combinations among above candidate drug pairs, CPGD selects the union
set of targeting PDGs of individual patients as the gene features to explore the risk assessment. Based on gene expression data with selected gene features,
SNF is used for subtype identification and the survival outcomes for patients in these clusters are evaluated by Kaplan–Meier statistics. iv) Finally, CPGD
can enhance subtyping by side effect quantification on PDGs. When two drugs act simultaneously on the same target genes, there will be two kinds of
actions of two combinations, e.g. coherent action as (+, +) and (−, −), and incoherent action as (+, −). By attaching signs to the mechanisms of different
actions,the side effect score can be calculated in the drug-target network with activation and inhibition interactions for each patient. Based on the side
effect score of each drug pair, we can obtain the number of drug pairs with aggravating effect (i.e. side effect score>0), and the number of drug pairs with
enhancing effect (i.e. side effect score < 0), which are two side effect signatures of individual patients.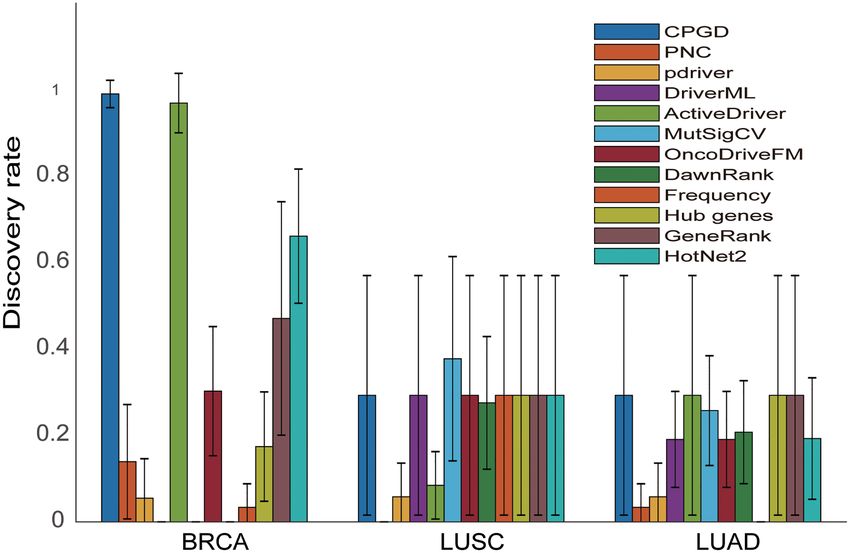
PAGE 9 OF 21                                                                           Nucleic Acids Research, 2021, Vol. 49, No. 7 e37

                                                                                                                                                     Downloaded from https://academic.oup.com/nar/article/49/7/e37/6090299 by guest on 18 April 2021

Figure 2. Effect of the reference gene interaction networks and parameters in CPGD. (A) Results on six prior-known networks with different balance
parameters for BRCA cancer dataset. (B) Results on six prior-known networks with different balance parameters for LUNG cancer dataset.

card coefficient becomes larger. These results suggested that              fectiveness of CPGD, we compared CPGD with other
CPGD can robustly identify PDGs from high-throughput                       state-of-the-artd river gene identification methods, such as
expression data.                                                           DriverML (14), MutSigCV (16), OncoDriveFM (17), SCS
                                                                           (18), DawnRank (19), PNC (24), pDriver (https://www.
                                                                           biorxiv.org/content/10.1101/2020.04.23.058727v1) and Ac-
Comparisons and evaluation of CPGD with existing driver
                                                                           tiveDriver (57) (Figure 4). We also compared CPGD with
gene-focus methods
                                                                           GeneRank (58,59), HotNet2 (60) and Hub genes-based
One key contribution of CPGD is to identify driver genes                   methods (Figure 4 and Supplementary Figure S5 in Sup-
for inferring combinatorial drugs. To evaluate the ef-                     plementary file 1). The number of PDGs for these methods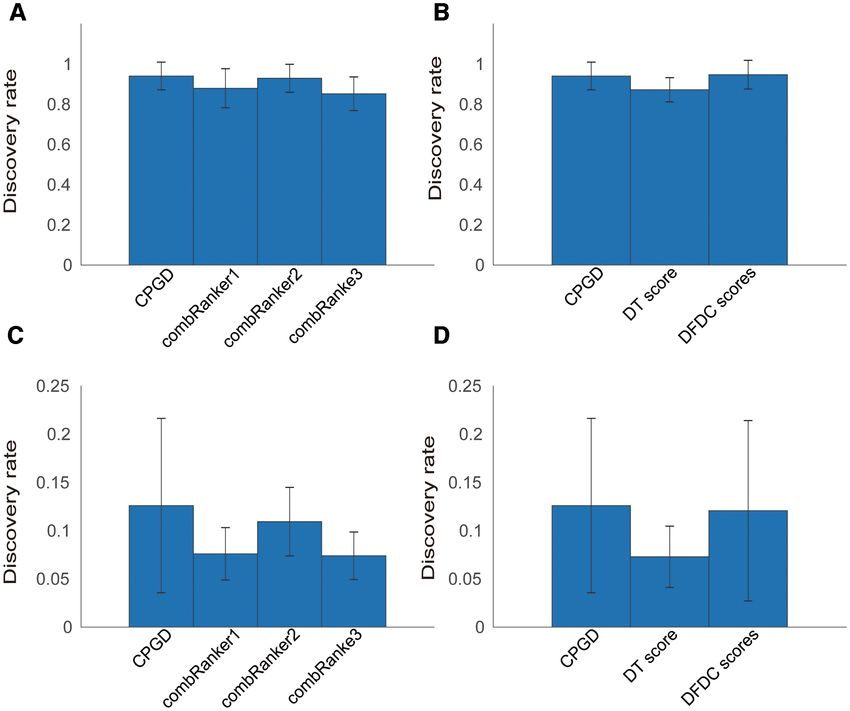
e37 Nucleic Acids Research, 2021, Vol. 49, No. 7                                                                                         PAGE 10 OF 21

                                                                                                                                                               Downloaded from https://academic.oup.com/nar/article/49/7/e37/6090299 by guest on 18 April 2021
Figure 3. Drug combination prediction results in a subtype-specific manner. (A) Results on BRCA cancer dataset. (B) Results on LUNG cancer datasets.

Figure 4. The comparison and evaluation of CPGD with other existing methods for predicting clinical efficacious combinatorial drugs on different cancer
datasets. The y-axis denotes the mean discovery rate of the top 10 predicted combinatorial drugs. The error bar denotes the standard derivation of discovery
rate among the top 10 predicted combinatorial drugs. The bar colors represent different algorithms.

is same as those of CPGD (Supplementary note 3 in Supple-                        Comparisons of CPGD with existing combinatorial drug pre-
mentary file 1). Based on the information of sub-networks                        diction methods for predicting synergistic drug pairs
between the drugs and PDGs, personalized combinatorial
                                                                                 To demonstrate the effectiveness of CPGD on combina-
drugs including the drug–PDG interactions and PDG inter-
                                                                                 torial drug prediction,by considering disease related gene
actions were prioritized to evaluate the ability of predicting
                                                                                 module information and multi-sources drug function in-
clinical efficacious combinatorial drugs. As shown in Fig-
                                                                                 formation, we evaluated the synergistic effect of drug pairs
ure 4, the discovery rate of CPGD has consistent higher per-
                                                                                 among top 10 candidate combinatorial drugs for each indi-
formance than those of other 11 driver gene identification
                                                                                 vidual cancer patient on BRCA dataset. The main function
methods on two benchmark cancer datasets, indicating that
                                                                                 of CPGD for measuring the synergistic effect of pairwise
the ability of CPGD is superior for predicting clinical effi-
                                                                                 drug combinations includes the drug-gene interactions and
cacious combinatorial drugs.
PAGE 11 OF 21 Nucleic Acids Research, 2021, Vol. 49, No. 7 e37
disease related gene module collection, driver gene module As comparison base, we used CombRanker on PDGMs of
construction and synergistic effect evaluation. pairwise drug combinations to obtain the synergistic scores
for each individual patient (Figure 5). Main conclusions
(i) For drug–gene interactions and disease related gene could be derived from Figure 5 as follows:
module collection, we collected the interactions be-
tween drugs and genes, as well as the disease related (i) Figure 5A showed the Discovery rate results of CPGD
gene module to identify anti-disease drug pairs for risk and three synergistic combinatorial strategies in Com-
assessment. On BRCA cancer dataset, the interactions bRanker (10). We can see that CPGD performs bet-
between drugs and targeted genes were extracted from ter than any of the existing synergistic combinatorial
the combinatorial drugs and gene interaction network strategies.
(Supplementary file 2). A list of 2341 breast cancer re- (ii) In fact, synergistic combinatorial strategy of CPGD
lated genes collected by Quan et al. (27) from the Uni- consists of two parts, i.e. DT score, Drug Function and
fied Medical Language System (UMLS) (61) was avail- DFDC score. To demonstrate the effeciency of these
able in folder ‘List of Breast cancer genes’ of https: two parts, we calculated the discovery rate of CPGD,
Downloaded from https://academic.oup.com/nar/article/49/7/e37/6090299 by guest on 18 April 2021
//github.com/NWPU-903PR/CPGD. DT score alone and DFDC score alone, respectively.
(ii) For driver gene module construction, PDGMs were Figure 5B showed that DFDC score has more contri-
identified by DIseAse MOdule Detection (DIA- butions on the overall synergistic effect than DT score.
MOnD) method (62). More computational details of (iii) To show the robustness of synergistic combinatorial
DIAMOnD were shown in supplementary note 3 of strategy of CPGD, we obtained all possible drug pairs
Supplementary file 1. The targeting driver gene num- and the corresponding targets (i.e. 452 drug pairs) from
ber, driver gene module number and driver gene mod- Supplementary file 2 and obtained synergistic scores of
ule scores of candidate drugs in BRCA dataset were these drug pairs by using CPGD. Based on synergis-
identified from top 10 combinatorial drugs for individ- tic scores of these 452 drug pairs, Figure 5C, D shows
ual patients, which were shown in Supplementary Fig- the Discovery rate results of CPGD and three synergis-
ures S6–S8, respectively. Different drugs have different tic combinatorial strategies in CombRanker (10), and
distributions in terms of the size of PDGMs in individ- CPGD performed better than any of the existing syn-
ual patients. These results demonstrated that individ- ergistic combinatorial strategies. Furthermore, DFDC
ual heterogeneity for combination therapy should be score has more contributions on the overall synergis-
considered in the disease treatment. The results in Sup- tic effect. These conclusions are consistent with those
plementary Figure S8 showed that the module scores from Figure 5A and B.
of identified PDGMs could be convergent within 10 in-
teraction times.
Influence of construction methods on single sample network
(iii) For synergistic effect evaluation, due to the rapid de-
during CPGD analysis
velopment of network biology, it raised the possibil-
ity of exploring individual samples based methods In order to investigate the effect of different network con-
with synergistic effects for disease treatment (33,63– struction methods on CPGD, we adopted different single
66). From the perspective of network-based methods, sample network construction methods, such as paired-SSN
CPGD measures, the synergistic effect of their corre- (24), SSN (33) CSN (63), SPCC (64,65) and LIONESS
sponding PDGMs by considering disease related gene (66). For SPCC and LIONESS methods, after obtaining the
module information and multi-sources drug informa- SPCC and LIONESS co-expression distribution (S) of all
tion, such as the drug target similarity, as well as gene pairs, we chose a threshold w to filter the edges with
drug similarity from the CMAP database (39) and low co-expression value, w = μ(S) + 2δ(S), where μ(S) and
drug chemical structure similarity (40) into their corre- δ(S) are the mean value and standard variance for co-
sponding PDGMs for evaluating the synergistic effect expression distribution (S) of all gene pairs. For all network
of pairwise drug combinations. construction methods, we chose Network 2 and Network
1 as the reference gene interaction network for BRCA and
To validate if the predicted or top-ranked drug combina- LUNG, respectively.
tions generate the synergistic effects, some synthetic lethal The results of CPGD on different subtypes of cancer
gene pairs and their corresponding targeted drug pairs were patients with single sample network construction methods
firstly extracted. Among these drug pairs, pairwise drug were shown in Figure 6, from which we can see that the
combinations with clinically validated anticancer activity discovery rate of paired-SSN and CSN is higher than that
were considered as the benchmark for verifying whether the of SPCC and LIONESS methods, and the discovery rate
drug combination is a synergistic drug combination (Sup- of paired-SSN and CSN is almost equal. Thus, consider-
plementary file 2) (27). Then, we ranked the drug pairs by ing the number of samples, here we selected the paired-SSN
calculating the mean synergistic scores among all BRCA method to construct the PGIN.
cancer patients, obtaining the clinical Discovery rate by cal- In addition, to demonstrate the effect of mutation data
culating the mean fraction of the top k (k = 1, 2, . . . , 10) on the results of CPGD, we calculated the Discovery rate of
pairwise drug pairs within the Clinical Anti-cancer Com- CPGD with the integrated (i.e. both mutation and expres-
binatorial drugs for treating breast cancer patients. Finally, sion) data and the expression (i.e. expression only) data on
we evaluated synergistic effect of drug pairs among top 10 BRCA and LUNG datasets respectively. As shown in Fig-
candidate combinatorial drugs for each individual patient. ure 7, among the top 10 predicted combinatorial drugs one37 Nucleic Acids Research, 2021, Vol. 49, No. 7 PAGE 12 OF 21
Downloaded from https://academic.oup.com/nar/article/49/7/e37/6090299 by guest on 18 April 2021
Figure 5. Comparison of CPGD and other synergistic combinatorial strategies for evaluating the synergistic effect of drug pairs. The error bar denotes
the standard derivation of discovery rate among the predicted drug pairs. (A) The discovery rate of CPGD and three existing synergistic combinatorial
strategies among top 10 candidate combinatorial drugs for each individual patient. (B) The discovery rate of CPGD, CPGD with DT score alone and
CPGD with DFDC score alone among top 10 candidate combinatorial drugs for each individual patient. (C) The discovery rate of CPGD and three
existing synergistic combinatorial strategies among all drug pairs. (D) The discovery rate of CPGD, CPGD with DT score alone and CPGD with DFDC
score alone among all drug pairs.
BRCA and LUNG datasets, the Discovery rate of CPGD other structural network controllability methods, such as
with the integrated data are higher than that with the MMS (20), MDS (21), DFVS (22) and NCUA (24) on above
expression data, demonstrating that the integrated multi- constructed PGIN (Figure 8). We also compared weight-
omics data can help improve the accuracy of driver gene NCUA method with another MMS-based critical nodes se-
identification. lection method (called MMS critical), which identified the
We also compared with the mean discovery rate of ran- critical nodes such that removing such a node will require
dom selected genes for individual patients. From the driver more nodes to control the network and is also a candidate
genes determined by CPGD, we randomly generated a gene method for predicting PDGs in PGIN (67,68). As shown in
set in which the number is same as the number of driver Figure 8, among the top 10 predicted combinatorial drugs
genes of CPGD. This random simulation was repeated 100 on BRCA and LUNG, weight-NCUA has higher perfor-
times to generate the distribution of mean discovery rate mance and robustness than most of other structural net-
among all patients. From Supplementary Figure S9, we can work controllability methods on different subtypes of can-
see that the discovery rate of PDGs predicted with CPGD is cer patients. The main reason is that weight-NCUA consid-
significantly higher than mean discovery rate of those genes ers the network edge scores for the optimization of driver
chose with random selection, which is consistent on two nodes, which are usually disregarded by other structural
benchmark cancer datasets. These results further supported network controllability methods.
that CPGD can effectively discover anticancer combinato- We note that Hu et al. recently introduced a network
rial drugs. controllability-based method, called OptiCon, to discover
synergistic driver genes as candidate targets for combina-
tion therapy (56). Although OptiCon is related to combina-
Influence of different network controllability methods to tion therapy research from network controllability perspec-
CPGD tive, OptiCon is to discover synergistic paired driver genes
To evaluate the influence of different network controllabil- on a population of patients and does not focus on evaluating
ity methods for CPGD, we compared weight-NCUA with the synergistic effect of paired drugs on individual patients.PAGE 13 OF 21 Nucleic Acids Research, 2021, Vol. 49, No. 7 e37
Downloaded from https://academic.oup.com/nar/article/49/7/e37/6090299 by guest on 18 April 2021
Figure 6. Influence of different single sample network construction methods on CPGD. To evaluate the usage efficiency of single sample network construc-
tion methods (i.e., Paired-SSN, CSN, SPCC and LIONESS) for personalized drug discovery, the combinatorial drugs annotated in the Clinical Anti-disease
Combinatorial drugs are applied to obtain the discovery rate of the top-ranked/predicted anti-disease combinatorial drugs for different subtypes of BRCA
(A) and LUNG (B).
Structural and functional property of personalized driver PDGs can be more completely characterized by CCG and
genes NCG lists than those by DEG lists, indicating the impor-
tance and relevance of PDGs on biological and disease
After determining the suitable reference network, single
functions.
sample network construction method and network control-
To further demonstrate the functional properties of per-
lability method, CPGD can be effectively applied to identify
sonalized driver genes, we performed the enrichment path-
PDGs. For analyzing the functional and structural proper-
way analysis for the personalized driver genes to deter-
ties of detected PDGs, the enrichment P-values of PDGs in
mine if the personalized driver genes are enriched in Kyoto
DEG, CCG and NCG lists were evaluated for CPGD (More
Encyclopedia of Genes and Genomes (KEGG) pathways.
computational details were shown in Materials and Meth-
To identify the significantly enriched pathways of PDGs,
ods). As shown in Figure 9, we obtained some new insight
we computed the P-value of PDG enriched pathways us-
on tumor heterogeneity. For the DEG list, not all of pa-
ing the hyper geometric test (48) as described in formula
tients have significant enrichment results. By contrast, the
(20), where N is the number of genes in the gene interac-
P-values of most patients aree37 Nucleic Acids Research, 2021, Vol. 49, No. 7 PAGE 14 OF 21
Downloaded from https://academic.oup.com/nar/article/49/7/e37/6090299 by guest on 18 April 2021
Figure 7. Results of CPGD method with the integrated multi-omics (both mutation and expression) data and the expression (expression only) data for
top-ranked/predicted anti-cancer combinatorial drugs on BRCA and LUNG, respectively. The error bar denotes the standard derivation of discovery rate
among all patients.
Figure 8. Comparison of weight-NCUA, MDS, MMS, DFVS and NCUA as well as the MMS critical methods for predicted anti-disease combinatorial
drugs. (A) Results on BRCA. (B) Results on LUNG.PAGE 15 OF 21 Nucleic Acids Research, 2021, Vol. 49, No. 7 e37
Downloaded from https://academic.oup.com/nar/article/49/7/e37/6090299 by guest on 18 April 2021
Figure 9. Functional and structural property of personalized driver genes. (A) Enrichment results of PDGs identified by CPGD in DEG, CCG and NCG
lists on different subtypes of BRCA cancer patients. (B) Enrichment results of PDGs identified by CPGD in DEG, CCG and NCG lists on different
subtypes of LUNG cancer patients. The enrichment score of driver gene is defined as ESg = –log10 (P-value). The red line denotes ESg = –log10 (0.05).
PDGs within a given pathway, and K is the gene number Risk assessment of drug pairs with co-targeting of personal-
in a given pathway. The enrichment results (including path- ized driver genes on breast cancer
way name, patient-occurred frequency and related combi-
To explore risk assessment of pairwise drug combinations,
natorial drugs) were shown in Supplementary file 6, from
the main outcome of CPGD includes the gene signature se-
which we can find that 63.64% of these identified biological
lection, subtype identification, and survival evaluation. For
pathways are related with breast cancer, 51.61% related with
gene signature selection, we selected top 10 candidate com-
lung cancer. These results indicated that CPGD can effec-
binatorial drugs for all patients (#112 samples) on TCGA-
tively identify the cancer-related pathways which are poten-
BRCA cancer dataset, and further selected the union set of
tially targeted by drugs. We also found that 81.25% of the
targeted PDGs of individual patients as the signatures to ex-
reported breast cancer-related pathways in previous stud-
plore the risk assessment of a given pairwise drug combina-
ies are enriched in many patients’ data with high frequency
tion on patients. For subtype identification, we re-collected
(>0.6), while 50% of the reported lung cancer-related path-
the gene expression data of all the tumors on TCGA-BRCA
ways in previous studies are enriched in many patients’ data
cancer dataset (#1006 samples). Based on targeted PDGs
with high frequency (>0.6), indicating patient heterogeneity
of drug pairs, the SNF (50) was applied on the gene expres-
varies in different cancer datasets.
sion data to select the gene signatures for identifying cancere37 Nucleic Acids Research, 2021, Vol. 49, No. 7 PAGE 16 OF 21
subtypes/clusters. For survival evaluation, the survival out- To further demonstrate the efficiency of CPGD on pa-
comes of patients in the identified clusters were evaluated by tient subtype recognition, SNF (50) was applied on the gene
Kaplan–Meier statistics. We chose the efficacious drug pairs expression data for separating cancer patients into two sub-
with significant survival analysis results (P-value < 0.05) for types as comparisons. We explored the differences between
risk assessment. patient subtype results of using our CPGD and those of
The results of risk assessment of pairwise drug combina- using all the gene expression data with SNF directly (Fig-
tions on TCGA-BRCA cancer dataset were shown in Figure ure 12A–D). For subtypes identified by CPGD, the survival
10 and Supplementary file 7. We found that the P-value of time of patients in high risk subtype are significantly shorter
6 pairwise drug combinations is less than that of each sin- than that of patients in low risk subtype (P-value = 0.0108,
gle drug, indicating that the combined therapeutic effect of Figure 12A and B). For subtypes identified by SNF directly
these drug pairs are better than monotherapy effect of single on all gene expression data, there are no significant differ-
drug. ences in survival curves among patients in high and low risk
To further evaluate 6 anti-disease drug pairs for risk as- subtypes (P-value = 0.2476, Figure 12C). Therefore, com-
sessment of BRCA cancer on independent data, we car- pared with SNF of using all gene expression data directly,
Downloaded from https://academic.oup.com/nar/article/49/7/e37/6090299 by guest on 18 April 2021
ried out the risk assessment of these drug pairs using the CPGD can more significantly partition cancer patients into
SurvExpress tool (69) on TCGA BRCA data (Supplemen- subtypes with different survival time. These results indi-
tary file 7), and the PROGgeneV2 tool (70) on GSE5327- cated that CPGD can simultaneously distinguish high and
BRCA cancer dataset (Figure 11 and Supplementary Fig- low risk subtypes with different survival time well.We also
ure S10). We found that (i) six drug pairs can actually di- calculated the jaccard coefficient between patient subtypes
vide all patients into discriminative two clusters (P-value < of CPGD and those of SNF using all the gene expression
0.05) on TCGA BRCA data; (ii) among these six drug pairs, data directly (Figure 12D) to explore the difference between
three drug pairs (i.e. CETUXIMAB and CARBOPLATIN, these two subtyping results, finding that the patients in high
CARBOPLATIN and CYCLOPHOSPHAMIDE, CYCL risk subtype are similar with those of using SNF (jaccard
OPHOSPHAMIDE and GEMCITABINE) can actually coefficient = 0.7238). These results indicated that CPGD
divide all patients into discriminative two groups (P-value can obtain some similar subtyping results compared with
< 0.05) on GSE5327-BRCA cancer dataset; (iii) a few tar- SNF using all the gene expression data.
geting driver genes (also the drug targets) of six paired drugs In addition, we divided the patients of four prior-known
combination (#PAGE 17 OF 21 Nucleic Acids Research, 2021, Vol. 49, No. 7 e37
Downloaded from https://academic.oup.com/nar/article/49/7/e37/6090299 by guest on 18 April 2021
Figure 10. The P-value of combined drugs therapy and single drug therapy on BRCA cancer dataset. ESg = –log10 (P-value).
Figure 11. The risk assessment of three predicted anti-disease drug pairs on independent GSE5327-BRCA cancer dataset. (A–C) The interaction network
between drug pairs and targeting driver genes for three predicted anti-disease drug pairs. The nodes with red color denote the breast-related genes and
hexagon nodes denote the drugs. (D–F) Results of survival analysis of three predicted anti-disease drug pairs on independent dataset.e37 Nucleic Acids Research, 2021, Vol. 49, No. 7 PAGE 18 OF 21
Downloaded from https://academic.oup.com/nar/article/49/7/e37/6090299 by guest on 18 April 2021
Figure 12. Cancer subtypes generated by quantifying side effect of drug pairs on the personalized driver genes. (A) The subtype classification of patients in
the breast cancer dataset based on the number of drug pairs with an aggravating effect and an enhancing effect. (B) The survival analysis of two subtypes
identified by CPGD. (C) The survival analysis of two subtypes identified by SNF using all the gene expression data. (D) The jaccard coefficient between
subtypes identified by CPGD and SNF. (E) The P-value of survival curves among two groups of patients in four prior-known subtypes (Basal, Her2, Lum
A and Lum B). (F) The jaccard coefficient between molecular subtypes of CPGD and four clinical subtypes (Basal, Her2, Lum A and Lum B).You can also read