Dynamic Patterns of N6-Methyladenosine Profiles of Messenger RNA Correlated with the Cardiomyocyte Regenerability during the Early Heart ...
←
→
Page content transcription
If your browser does not render page correctly, please read the page content below
Hindawi
Oxidative Medicine and Cellular Longevity
Volume 2021, Article ID 5537804, 15 pages
https://doi.org/10.1155/2021/5537804

Research Article
Dynamic Patterns of N6-Methyladenosine Profiles of Messenger
RNA Correlated with the Cardiomyocyte Regenerability during
the Early Heart Development in Mice

          Yuhui Yang ,1,2 Siman Shen,1,2 Yin Cai,3,4 Kejun Zeng,1,2 Keyu Liu,1,2 Simeng Li,1,2
          Lanfen Zeng,1,2 Linming Chen,1,2 Jing Tang,1,2 Zhe Hu,1,2 Zhengyuan Xia ,1,2,3
          and Liangqing Zhang 1,2
          1
            Department of Anesthesiology, Affiliated Hospital of Guangdong Medical University, Zhanjiang, China
          2
            Key Laboratory of Organ Functional Injury and Protection and Department of Translational Medicine of Zhanjiang,
            Zhanjiang, China
          3
            State Key Laboratory of Pharmaceutical Biotechnology and Department of Medicine, University of Hong Kong,
            Hong Kong SAR, China
          4
            Department of Health Technology and Informatics, The Hong Kong Polytechnic University, Hong Kong SAR, China

          Correspondence should be addressed to Zhengyuan Xia; zyxia@hku.hk and Liangqing Zhang; zhanglq1970@163.com

          Received 15 February 2021; Accepted 13 July 2021; Published 9 August 2021

          Academic Editor: Gaetano Santulli

          Copyright © 2021 Yuhui Yang et al. This is an open access article distributed under the Creative Commons Attribution License,
          which permits unrestricted use, distribution, and reproduction in any medium, provided the original work is properly cited.

          N6-Methyladenosine (m6A) plays important roles in regulating mRNA processing. Despite rapid progress in this field, little is
          known about the role and mechanism of m6A modification in myocardial development and cardiomyocyte regeneration.
          Existing studies have shown that the heart tissues of newborn mice have the capability of proliferation and regeneration, but its
          mechanism, particularly its relation to m6A methylation, remains unknown. Methods. To systematically profile the mRNA m6A
          modification pattern in the heart tissues of mice at different developmental stages, we jointly performed methylated RNA
          immunoprecipitation sequencing (MeRIP-seq) and RNA sequencing (RNA-seq) of heart tissues of mice, respectively, aged 1 day
          old, 7 days old, and 28 days old. Results. We identified the linkages and association between differentially expressed mRNA
          transcripts and hyper or hypomethylated m6A peaks in C57BL/6J mice at different heart developmental stages. Results showed
          that the amount of m6A peaks and the level of m6A modification were the lowest in the heart of mice at 1 day old. By contrast,
          heart tissues from 7-day-old mice tended to possess the most m6A peaks and the highest global m6A level. However, the m6A
          characteristics of myocardial tissue changed little after 7 days old as compared to that of 1 day old. Specifically, we found 1269
          downmethylated genes of 1434 methylated genes in 7-day-old mouse heart tissues as compared to those in 1-day-old mice.
          Hypermethylation of some specific genes may correlate with the heart’s strong proliferative and regenerative capability at the
          first day after birth. In terms of m6A density, the tendency shifted from coding sequences (CDS) to 3 ′ -untranslated regions (3 ′
          UTR) and stop codon with the progression of heart development. In addition, some genes demonstrated remarkable changes
          both in methylation and expression, like kiss1, plekha6, and megf6, which may play important roles in proliferation.
          Furthermore, signaling pathways highly related to proliferation such as “Wnt signaling pathway,” “ECM-receptor interaction,”
          and “cardiac chamber formation” were significantly enriched in 1-day-old methylated genes. Conclusions. Our results reveal a
          pattern that different m6A modifications are distributed in C57BL/6J heart tissue at different developmental stages, which
          provides new insights into a novel function of m6A methylation of mRNA in myocardial development and regeneration.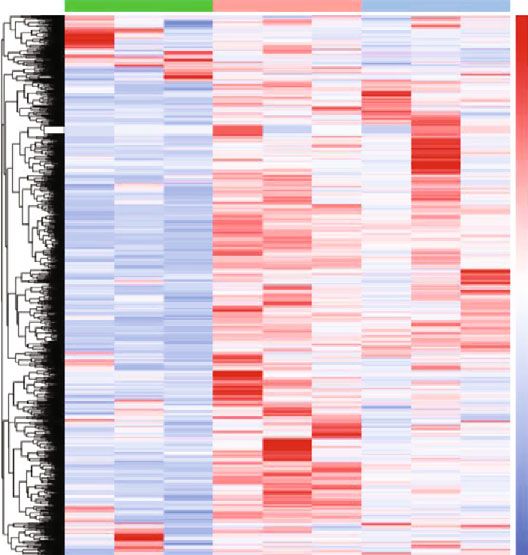
2                                                                                   Oxidative Medicine and Cellular Longevity

1. Background                                                      m6A modification on embryonic neural stem cells (NSCs)
                                                                   have been demonstrated during early brain development in
The adult human heart does not have sufficient ability to ren-       newborn mice [26]. It follows that the function and correlation
ovate the damaged cardiac cardiomyocytes (CMs), which is           of m6A modifications in biological physiology and disease
the critical factor leading to the high mortality of cardiovas-    progression have become of great interest [25, 26]. Technical
cular diseases [1]. Although many approaches are designed          advances in mammalian studies, such as transcriptome-wide
to repopulate the damaged CMs, like transplanting various          analysis, open up a novel method for revealing the distribu-
sources of exogenous stem cells with differential potential         tion and function of this modification through the biotech-
[2, 3], these therapies have various limitations in treating       nologies of RNA-seq, RIP-seq, and m6A-seq. To date,
myocardial infarction (MI) or heart failure efficaciously, such      however, study about the m6A modification of mRNAs in
as immune response [4] and epigenetic influence [5, 6].             mammals’ myocardial proliferation is rare. And researches
Interestingly, extensive recent studies show that targeting        focusing on the development of therapies that may stimulate
mechanisms that govern endogenous repair and proliferation         myocardial regeneration by mining and interfering related
to cardiomyocytes may prove to be a valid therapy for heart        regulating molecules with different m6A modification during
disease [7–9]. The adult mammalian heart has been tradi-           cardiac development are lacking.
tionally regarded as an organ of terminal differentiation               The proliferative ability of mouse cardiomyocytes can
capability. Recent studies, however, discovered that several       only be maintained for a short period after birth. The abil-
species, including neonatal mice, 1-day-old pigs, and adult        ity of DNA synthesis is an intuitive index to reflect prolif-
zebrafish, could stimulate a robust regenerative response           eration ability, and the activity of the enzymes needed for
during cardiac injury [10, 11]. Unlike the adult zebrafish,         DNA synthesis in mice decreases significantly to the level
the CMs of neonatal mice possess the proliferative capability      of adult at about one week after birth [27, 28]. Current
and maintain the competence to renovate their damaged car-         researches indicated that the heart of mice aged up to 7
diac muscle tissue during the first 7 days of life [11, 12]. Con-   days old has the ability to proliferate and regenerate, while
vincing evidence shows that heart regeneration in neonatal         hearts from 28-day-old mice could hardly proliferate and
mice is achieved by cardiomyocyte proliferation and the car-       regenerate which is similar to that seen in adult hearts
diac developmental program for self-renewal [12–14]. The           [12, 29]. So most researchers usually choose 1-day-old, 7-
underlying mechanisms of neonatal cardiac proliferation            day-old, and 28-day-old mice (hereafter referred to as P1,
remain largely unclear, but the related research is of crucial     P7, and P28) to study the phenomenon and mechanisms
significance for discovering therapeutic targets for cardio-        of myocardial regeneration [30, 31]. We hypothesized that
myocyte regeneration and cardiac repair.                           m6A might play a significant role in regulating and affect-
    N6-Methyladenosine (m6A), the most common internal             ing the development and regeneration of rodent hearts.
modification of messenger RNA (mRNA) and noncoding                  Thus, in the present study, we conducted an m6A-specific
RNAs (ncRNA) in eukaryotes identified in the 1970s, is              analysis and bioinformatics analysis in mRNAs of mouse
dynamically regulated by a set of enzymes classified into           hearts at the three stages, including P1, P7, and P28, in
methyltransferases (“writers”), demethylases (“erasers”),          an effort to provide clinical and therapeutic insights and
and m6A binding proteins (“readers”) [15]. Over the last           reveal the role and mechanism of m6A in myocardial
decade, several studies have characterized the m6A mRNA            development.
landscape in multiple organisms, such as mammals [16],
yeast [17], and plants [18], and these studies have identified
the consensus sequence RRACH (in which R represents A              2. Materials and Methods
or G and H represents A, C, or U), which suggests the signif-
icance of m6A modification in multispecies conservatism.            2.1. Animal Studies. The study protocol was reviewed and
Thus, imbalance in m6A modification may impact on vari-             approved by the animal care committees of both Southern
ous diseases and biochemical progress, like regulating plant       Medical University and Guangdong Medical University.
embryonic development [19], immune cell homeostasis and            Male C57BL/6J mice were randomly assigned to three groups
function [20], and cancer in various organs [21], and contrib-     according to different ages (P1, P7, and P28). Groups P1 and
ute to human disease heritability [22]. Transcriptome-wide         P7 consisted of 12 animals, respectively, and group P28 con-
analyses have shown that m6A modified over one-third of             sisted of 3, providing 3 biological replicates to be analyzed.
the mRNA in humans and mice [16]. The m6A possesses                Given that the heart sizes for animals in groups P1 and P7
1-3 modification sites in each particular mRNA that enrich          were small, the samples from every 4 hearts were pooled for
in near stop codons, 3 ′ UTRs, and RRACH sequence of               analyses. All mice in each group were deep anesthetized with
mRNA. These studies also suggested that m6A modification            ketamine (80 mg/kg, IP.) + xylazine (10 mg/kg, IP.) and were
has a crucial effect on various cellular pathways and pro-          executed by cervical dislocation. Subsequently, the cardiac
cesses, including developmental regulation, the cell cycle, fate   tissues were collected and frozen in liquid nitrogen at -80°C
determination, and the heat-shock stress response by regulat-      for further RNA extraction. Animals were obtained from
ing the splicing, expression, stability, and translation effi-       the Animal Research Center of Southern Medical University.
ciency of mRNAs [23, 24].                                          The Guide for the Care and Use of Laboratory Animals and
    Recently, the regulatory role of m6A in heart diseases has     Animal Welfare Act are followed to guide 3M’s animal
been increasingly recognized [25]. In addition, the effects of      research program.
Oxidative Medicine and Cellular Longevity                                                                                  3

2.2. Total RNA Preparation. RNA isolation was performed          tion (MF). In the meantime, Kyoto Encyclopedia of Genes
with Trizol Reagent (Thermo Fisher Scientific, Waltham,           and Genomes (KEGG; http://www.kegg.jp/) analysis was
MA, USA) according to the manufacturer’s instructions.           also conducted and the major terms of signal transduction
The ratio of OD260/280 to OD260/230 of the product was           pathways and biochemical metabolic pathways were iden-
detected by NanoDrop (Thermo Fisher Scientific, Waltham,          tified that participated for the DEGs. When the corrected
MA, USA) as the sample purity index. And the degree of           P value was less than 0.05, the GO terms and KEGG anal-
RNA degradation was detected by agarose gel electrophoresis      ysis were regarded as significantly enriched, as previously
and Agilent 2100 Bioanalyzer (Agilent, Santa Clara, CA,          described [36, 37].
USA). If the OD260/280 value was between 1.8 and 2.2, OD
260/230 ≥ 2:0, and RIN ≥ 7, the RNA purity and integrity         2.7. Quantitative Real-Time PCR. Q-PCR was performed on
were qualified and marked as “Pass”.                              Roche LightCycler 480 system (Roche Applied Science, IN,
                                                                 USA). Relative expressions of genes were compared by the
2.3. RNA Purification and Fragmentation. The rRNA probe           2-ΔΔCt method, and GAPDH served as the internal house-
with specific species (mouse) was incubated with total            keeping gene. The sequences of all the specific primers were
RNA, and then, the captured rRNA probe was modified with          designed to span extron-intron to prevent the improper
biotin (Thermo Fisher Scientific, Waltham, MA, USA). The          amplification of mRNA. The primer sequences were as fol-
magnetic beads (Thermo Fisher Scientific, Waltham, MA,            lows: IGF2BP1, 5 ′ -GGCGACTCATTGGCAAGGAAGG-3 ′
USA) coated with streptavidin were combined with the             (forward) and 5 ′ -TGAGGTCCTGGAGCGATGAGATG-3 ′
probe-rRNA complex to remove rRNA. After another purifi-          (reverse); IGF2BP3, 5 ′ -CATCTGTTTATTCCCGCCCTGT
cation of AMPure XP magnetic beads (Beckman Coulter,
                                                                 CC-3 ′ (forward) and 5 ′ -TCACCATCCGCACTTTAGCAT
Brea, CA), the RNA without rRNA was extracted. The puri-
fied RNA was diluted in fragmentation buffer for elution,          CTG-3 ′ (reverse); ALKBH5, 5 ′ -TTCTTCAGCGACTCGG
fragmentation, and random primers; then, the product was         CACTTTG-3 ′ (forward) and 5 ′ -CGGCAGAGAAAGCA
incubated at 94°C for thermal fracture and lysed into frag-      CAGGTTCC-3 ′ (reverse); Hist1h2ao, 5 ′ -GCTCCGCAAGG
ments between 100 and 300 bp.                                    GCAACTACTC-3 ′ (forward) and 5 ′ -CCCGCCAGCTC
                                                                 CAGGATCTC-3 ′ (reverse); Tet2, 5 ′ -CTGCTGTTTGGGT
2.4. cDNA Library Construction and Sequencing. The frag-
                                                                 CTGAAGGAAGG-3 ′ (forward) and 5 ′ -GTTCTGCTGGTC
mented RNA was divided into two parts. One part was added
with premixed m6A antibody immunomagnetic beads to               TCTGTGGGAATG-3 ′ (reverse); GATA4, 5 ′ -CGAGATGG
enrich the m6A methylated mRNA fragments. Then, the              GACGGGACACTACC-3 ′ (forward) and 5 ′ -TGGCAGTT
enriched m6A antibody immunomagnetic beads and the               GGCACAGGAGAGG-3 ′ (reverse); and MEGF6, 5 ′ -TGCG
recovered m6A-containing mRNA fragment were used to              ACCCTGAGACTGGAACC-3 ′ (forward) and 5 ′ -TTGGCA
construct a conventional sequencing library according to         CAAGCACACCTCATCTG-3 ′ (reverse).
the transcriptome library construction process. The other
part was used as a control to construct a conventional tran-     2.8. Western Blot. Proteins were harvested and dissolved in
scriptome sequencing library directly. These two sequenced       RIPA lysis buffer, and protein concentrations were detected
libraries, m6A-seq library and RNA-seq library, were             by enhanced Bicinchoninic Acid (BCA) protein assay kit
sequenced with high throughput, respectively.                    (Beyotime, China). And the equivalent amounts of protein
                                                                 were separated by SDS-PAGE on 10% acrylamide gels at
2.5. Sequencing Data Analysis. Libraries were sequenced and      60 v for 2.5 h and transferred to PVDF membranes under a
visualized on Illumina NovaSeq™ 6000 (Illumina, San Diego,       constant current of 340 mA for 1.5 h. Quantitative analysis
CA). First, the software Cutadapt and local Perl scripts         was performed by ImageJ. The primary antibodies were anti-
removed the low-quality, contaminated, and sequencer con-        ALKBH5 (ab195377, Abcam, MA, USA), anti-METTL3
nector sequences to obtain clean data [32]. Next, Fastp was      (86132S, CST, MA, USA), anti-YTHDF1 (ab252346, Abcam,
used to perform quality control on clean data. Then, the         MA, USA), anti-IGF2BP3 (ab179807, Abcam, MA, USA),
reads were aligned to the referential genome using the default   anti-FTO (31687S, CST, MA, USA), and anti-GAPDH
parameters of HISAT2 [33] and peak calling analysis and          (ab8227, Abcam, MA, USA). The secondary antibodies were
peak annotation were performed by ExomePeak and ChIP-            goat polyclonal anti-Rabbit-IgG (14708S, CST, MA, USA).
seeker [34]. After that, Homer (or MEME) was applied to
perform motif analysis on enriched sites and StringTie to        2.9. Statistical Analysis. One-way ANOVA with Tukey’s post
perform transcriptome analysis and gene quantification.           hoc tests was carried out for comparison of multiple groups.
Finally, the R package “Edge R” was used for genetic differ-      All experiments were performed at least three times indepen-
ence analysis [35].                                              dently. Data are shown as mean ± S:D: A P value less than
                                                                 0.05 was considered statistically significantly different.
2.6. GO and KEGG Pathway Database Analysis. We used
Gene Ontology (GO; http://www.geneontology.org/) to per-         3. Results
form functional enrichment and applied GO annotation to
describe the functions of the differentially methylated genes,    3.1. General Features of Cardiac m6A Methylation in Mouse
which were classified into three major categories: biological     during Heart Development. In order to investigate the poten-
process (BP), cellular component (CC), and molecular func-       tial targets contributing to heart development in C57BL/6J
4 Oxidative Medicine and Cellular Longevity
13(17/17) 6(7/7)
Peak P7 Peak P28
Peak P1 Peak P1
19372 4944 19372 4944
(a) (b)
Peak P7
Peak P28
Peak P1 8913 Peak P28
10126
3(3/3)
(11165/10457)
8920 10137(10469/11176) 2025 4944 10(12/16/14) 2024
Peak P7
(c) (d)
50
100
50
P1 P7 P28
0
150
150
0
100
0
50
2
50
chrY chr1
0
0
50
10
X
chr
0
15
ch
0
50 19 r2 0
hr
c
0 50
8
r1
ch
50 100
chr
1
17
150
3
0
chr
0
50
chr16
50
chr4
0 100
100
chr1 5
150
50 0
0
0
chr 5
50
chr1 4
100 100
50 15
0 0
0
r6
chr
ch
50
100
1
–1
3
50 100
r1
ch
0 2 r7
ch
0
0
ch
10
r 11
50
8
50
ch r1 0 chr
10
chr9
0
0
100
0
50
–2
50
0
100
100
0
50
50
100
0
A B C A B C A B C Log2FE
(e) (f)
Figure 1: Continued.
Oxidative Medicine and Cellular Longevity 5
2500 2000
2000
1500
Methylation peaks
Methylated genes
183 165
1500
1000
1000
1610 1269
500
500 543 450
190 174
0 0
P7 vs. P1 P28 vs. P1 P7 vs. P1 P28 vs. P1
Hypermethylation peaks Hyper-methylated genes
Hypomethylation peaks Hypo-methylated genes
(g) (h)
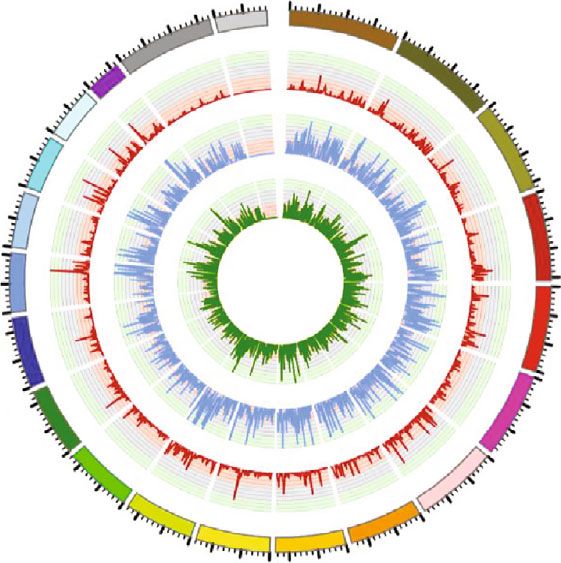
Figure 1: General features of m6A methylation in mouse heart development. (a) Venn diagram of m6A peaks in P7 and P1 heart tissues. (b)
Venn diagram of m6A peaks in P28 and P1 heart tissues. (c) Venn diagram of m6A peaks in P28 and P7 heart tissues. (d) Venn diagram of
m6A peaks in all 3 groups. (e) Distribution of m6A methylation sites on chromosome by Circos plot. Red represents P1, blue represents P7,
and green represents P28. (f) Cluster analysis of m6A in P1, P7, and P28 heart tissues. The color represents the degree of the log fold
enrichment (FE) value: the larger the LogFE value, the closer the color is to red (P < 0:05). (g) Histogram showing the methylation peaks.
P7 possessed more peaks, but the levels of methylation were mostly decreased. (h) Histogram showing the methylation peaks’
corresponding genes. Same as the methylation peaks, P7 genes were mostly hypomethylated as compared to P1.
mice, we performed m6A sequencing to compare the gene medium levels at P28. Furthermore, the autosomes in the
methylation profile grouped by P1, P7, and P28. We mapped mouse heart of each age group were more profoundly meth-
up to 4961 methylation peaks in 3062 annotated genes of P1 ylated compared with the sex chromosomes. Interestingly,
heart tissues, 19389 peaks in 7404 annotated genes of P7, and the methylation degree of sex chromosome Y was barely
13201 peaks in 5712 annotated genes of P28, respectively (all noticeable.
P < 0:05, Log2 FC > 1). Then, we calculated their pairwise
intersection by using Venn diagram. Some redundancy data 3.2. Cluster Analysis. The analysis of the methylation cluster
would be merged in statistical mapping. For instance, suppose and heat map showed that the methylation differences could
group A was compared with group B and one peak in A may obviously be distinguished from each group: there were
overlap with two or more peaks in B, which was called redun- marked differences among the groups but there existed rela-
dancy, so the number inside the parentheses in the overlap of tive consistencies within the groups (Figure 1(f)). To sum up,
the Venn diagram is the total amount of intersections that the peaks of methylation in the P1 heart tissues were the low-
actually occurred, while the number outside the parentheses est, while those in the P7 heart tissues were the highest and
indicates the amount of intersections after duplicates are reduced over time. By P28, the peaks of methylation were
excluded. Of the 4961 methylation peaks in P1, only 13 reap- reduced as compared to P7 but they remained high as com-
peared in P7, and still fewer peaks (6 peaks) reappeared in pared to P1. In total, 1610 of 1793 methylation peaks in P7
P28. However, up to 10137 methylation peaks overlapped were detected as hypomethylation, and 543 hypermethyla-
between P7 and P28 methylation peaks (Figures 1(a)–1(c)). tion peaks of 733 methylation peaks in P28 were identified
In general, we found that 10 specific methylation peaks simul- (Figures 1(g) and 1(h), all P < 0:05, Log2 FE > 1). By compar-
taneously appeared among P1, P7, and P28 mouse heart tissue ison, more hypomethylation peaks were seen in P7 heart tis-
(Figure 1(d)). There were noticeable differences in the number sues. However, 1793 methylation peaks with significant
of m6A peaks in either P7 or P28 as compared to P1, while this differences accounted for only approximately 8% of the
characteristic difference was inconspicuous between P7 and methylation peaks in P7. The rest of the peaks were unique
P28; thus, we could presume that the m6A modification was to P7, but not in P1. This interesting trend of methylation
significantly altered in early heart development, but tended over time suggests that specific methylation sites may have
to stabilize after day 7. an underlying network with the strong proliferative and
When using Circos software to analyze the distribution of regenerative capability of the heart at the very first day after
mRNA m6A peaks on the chromosomes, it was found that birth, and subsequent studies are needed to investigate the
the distribution and number of m6A peaks on each chromo- mechanism.
some were diverse among P1, P7, and P28’ s mouse heart tis-
sue, with the diversity on chromosome 3 being the most 3.3. Motif Analysis. While mapping the m6A methylome
apparent (Figure 1(e)). The results revealed that the methyl- motif by scanning the peaks, we found that RRACH was a
ation level of whole genome was significantly upregulated conserved sequence motif for m6A-containing regions among
when cardiomyocytes developed to P7 and then dropped to all the 3 groups, which is consistent with previous studies
6 Oxidative Medicine and Cellular Longevity
(a) (b) (c)
5UTR (19.9%) 3UTR (32.9%) 3UTR (39.6%)
5UTR (16%)
3UTR (16.7%)
5UTR (13.9%)
Stop C (2.5%)
Stop C (2.6%)
Stop C (3.2%) Start C (5.3%)
Start C (4.6%)
Start C (7.3%)
CDS (52.9%) CDS (43.3%)
CDS (39.2%)
3UTR Start C
5UTR Stop C 3UTR Start C
3UTR Start C
CDS 5UTR Stop C
5UTR Stop C
CDS
CDS
(d) (e) (f)
0.15
50
40
0.10
Percentage of genes (%)
Density
30
0.05 20
10
0.00
0
0 500 1000 1500 2000
5′UTR CDS 3′UTR 1 2 3 >3
Numbers of peak per gene
Group
P1 Diff group
P7 P1
P28 P7
P28
(g) (h)
Figure 2: The profiles of m6A peaks and the joint analysis of m6A-seq and RNA-seq. (a–c) Motif with maximum P value of m6a in the P1, P7,
and P28 heart tissues. (d–f) Pie chart of m6A peaks in different regions of P1, P7, and P28 heart tissues mRNA. (g) The m6A density
distribution of P1, P7, and P28 heart tissues. All groups appeared at 3 ′ UTR mostly. (h) The number of m6A peaks in P1, P7, and P28
heart tissues on each mRNA. Only one methylation peak appears among most mRNAs in each of the three groups.
[11, 24]. GGACU (P = 1e − 93), AAAGU (P = 1e − 87), and We observed that m6A was mostly distributed at the CDS
GUAAA (P = 1e − 63) were the most common and reliable region and 3 ′ UTR near the stop codon in each group, which
among the motifs in P1, P7, and P28 heart tissues, respec- is suggestive of the direction of translational regulation, as
tively (Figures 2(a)–2(c)). We, thus, speculated that differ- previously described [16, 38]. Furthermore, we found that
ence in motifs might be one of the factors that caused with the progression of heart development, the distribution
m6A differences. of m6A in 5 ′ UTR (P1: 19.9%, P7: 16%, and P28: 13.9%),
CDS (P1: 52.9%, P7: 43.3%, and P28: 39.2%), and start codon
3.4. Analysis of Regions of mRNA Methylation in Different (P1: 7.3%, P7: 5.3%, and P28: 4.6%) decreased gradually, but
Developmental Stages of Heart Tissues. The analysis of the increased at 3 ′ UTR (P1: 16.7%, P7: 32.9%, and P28: 39.6%).
regions of mRNA methylation peaks showed that m6A was Nevertheless, the stop codon remained the lowest distribution
distributed in all regions of the mRNA (Figures 2(d)–2(f)). in each group of heart tissues (P1: 3.2%, P7: 2.5%, and P28:Oxidative Medicine and Cellular Longevity 7
2.6%) (all P < 0:05, Log2 FC > 1:5). As shown in Figure 2(g), 3.7. Bioinformatics Analysis of Functional Genomics. Given
the m6A density shifted to 3 ′ UTR and stop codon regions that the 7th day of heart development is being considered a
from P1 to P28. These findings are consistent with previous watershed in myocardial regeneration and proliferation, we
research in Homo sapiens’ mRNA methylation characteristic divided the results into two parts for bioinformatics analysis
between neonate and adult [39], indicating that the m6A land- as follows.
scape of humans and mice was highly homologous.
3.7.1. P7 Compared to P1. For the GO terms of BP category,
3.5. Density Distribution of m6A Peaks across mRNA genes with hypermethylated m6A sites were significantly
Transcripts. In each of the three groups, most of the m6A- enriched in the “intracellular protein transmembrane trans-
modified mRNAs contained only one m6A peak, whereas a port,” “negative regulation of cytosolic calcium ion concentra-
small number of them contained two or more peaks tion,” and “vesicle-mediated transmembrane transport,” while
(Figure 2(h)), which was in accordance with previous studies hypomethylated genes were highly enriched in “glyceropho-
[38]. And this characteristic in the P7 heart tissues was par- spholipid metabolic process” and “phospholipid biosynthetic
ticularly high (~50%, P < 0:05). Likewise, the quantities of process.” For the CC part, genes with hypermethylated m6A
mRNAs with two or more m6A peaks were the largest in sites were mainly related to “Golgi stack” and “nuclear tran-
day 7 heart tissues. scriptional repressor complex,” while hypomethylated genes
were primarily enriched in “trans-Golgi network” and “extra-
3.6. Effect of RNA m6A Modifications on Gene cellular matrix.” As for the analysis of MF, it revealed that the
Transcriptional Expression. We performed a joint analysis “transmembrane receptor protein tyrosine kinase activity,”
of the gene transcriptome and methylation (all P < 0:05, Lo “ATP-dependent helicase activity,” and “ligand-gated cation
g2 FC > 1). The result demonstrated that there were more channel activity” were mostly enriched in genes with hyper-
upregulated methylated mRNAs in the P28 heart tissues than methylated m6A sites, while the hypomethylated genes were
in P1 and more downregulated methylated mRNAs in P7 primarily enriched in “guanyl-nucleotide exchange factor
than in P1 heart tissues (Figures 3(a) and 3(b)). Among the activity” and “active transmembrane transporter activity”
450 P28 heart tissue genes that were upmethylated, 162 (Figures 4(a) and 4(b), all P < 0:05).
genes were upregulated and 50 genes were downregulated KEGG pathway analysis revealed that the most sig-
as compared to P1. Among the 1269 genes that were down- nificantly overrepresented pathways among upmethylated
methylated in P7 heart tissues, a total of 246 genes were transcripts were the “AMPK signaling pathway,” “longevity
upregulated and 194 genes were downregulated as compared regulation pathway,” and “insulin signaling pathway”
to P1. However, barely any methylation difference appeared in (Figure 4(e), P < 0:05), while the downmethylated mRNAs
DEGs between P7 and P28 (Figure 3(c)). The differences in the were significantly enriched in “glycerophospholipid metabo-
transcription level of hyper- and hypomethylation peaks and lism,” “ECM-receptor interaction,” and “microRNAs in can-
their corresponding genes are shown in Tables 1–4. Moreover, cer” (Figure 4(f), P < 0:05).
we noticed that some genes that were highly expressed, respec-
tively, in both the P1 and the P7 heart tissues were rarely 3.7.2. P28 Compared to P1. The GO analysis of BP showed
expressed in the P28 heart tissues, such as plekaha6 and that the genes with hypermethylated m6A sites were signifi-
megf6. Taken together, it may indicate that m6A-modified cantly enriched in “regulation of protein exit from endoplas-
genes tended to have a positive regulation of expression in mic reticulum,” “macromolecule methylation,” and “protein
developing heart tissues, but further validation is required to methylation,” while the hypomethylated genes were signifi-
verify this hypothesis. cantly detected in “cell surface receptor signaling pathway
Furthermore, we performed a heat map by Z-score involved in cell-cell signaling,” “Wnt signaling pathway,”
analysis (P < 0:05) on the expression of various methylases and “cardiac chamber formation.” The CC part indicated that
in different developmental stages of mouse hearts. The result the genes with hypermethylated m6A sites were mainly related
showed that there was no significant difference in the expres- to “intercellular canaliculus” and “integral component of
sion of “writers” at different developmental stages. By con- endoplasmic reticulum membrane,” and the hypomethylated
trast, in “erasers,” the expression of ALKBH5 was more genes were mostly related to “lamellipodium” and “contractile
abundant than that of FTO, the expression of ALKBH5 actin filament bundle.” The analysis of MF revealed that the
was higher at P1 than at P7 and P28, and IGF2BP3 was genes with hypermethylated m6A sites were mostly enriched
the most highly differentially expressed “reader” protein in the “active transmembrane transporter activity,” “transcrip-
and it decreased gradually from P1 to P28. These findings tion factor activity,” and “direct ligand-regulated sequence-
implied that “eraser” and “reader” seem to play a more specific DNA binding,” whereas the hypomethylated genes
important regulatory role as compared to “writers” in the were primarily related to “proximal promoter DNA-binding
development of mouse heart, especially when some methyl- transcription activator activity,” “RNA polymerase II-spe-
ases are highly expressed at P1. According to previous cific,” and “transmembrane receptor protein tyrosine kinase
reports, the mouse heart at P1 has the strongest proliferative activity” (Figures 4(c) and 4(d), all P < 0:05).
and regenerative capability [12], but whether these methyl- Pathway analysis revealed that upmethylated transcripts
ases highly expressed in P1 mouse heart tissues could regu- were involved in “ABC transporter,” “cell motility,” and
late the proliferation and regeneration of mouse heart needs “cell adhesion molecules” (Figure 4(g), P < 0:05), whereas
further work to explore. downregulated transcripts included “Wnt signaling pathway,”8 Oxidative Medicine and Cellular Longevity
m6A level of P7 vs. P1 differentially expressed genes m6A level of P28 vs. P1 differentially expressed genes
4 4
3 3
–Log10(P value)
–Log10(P value)
2 2
1 1
0 0
–10 –5 0 5 10 –10 –5 0 5 10
P7 vs. P1 DEG Log2FC P28 vs. P1 DEG Log2FC
m6A level m6A level
High High
Low Low
No No
(a) (b)
m6A level of P28 vs. P7 differentially expressed genes 2
METTL3
4 METTL14
WTAP
VIRMA
1
3 ZC3H13
METTL16
–Log10(P value)
FTO
ALKBH5 0
2
YTHDF1
YTHDF2
YTHDF3
–1
1 YTHDC1
YTHDC2
IGF2BP1
0 IGF2BP3 –2
Z-score
P1A
P1B
P1C
P7A
P7B
P7C
P28A
P28B
P28C
–10 –5 0 5 10
P28 vs. P7 DEG Log2FC
m6A level
High
Low
No
(c) (d)
Figure 3: Joint analysis of gene transcriptome and methylation. (a) Different gene expressions combining with methylation level in P7 and P1
heart tissues. (b) Different gene expressions combining with methylation level in P28 and P1 heart tissues. (c) Different gene expressions
combining with methylation level in P28 and P7 heart tissues. (d) Heat map of a series of methylase expression (P < 0:05, −2 ≤ Z‐score ≤ 2).Oxidative Medicine and Cellular Longevity 9
Table 1: Top ten upmethylation peaks and their corresponding genes (P7 vs. P1).
Chromosome TxStart TxEnd Gene name Fold change
4 88760543 88760643 Gm13283 ↑ 349.8
13 21810736 21810849 Gm19658 ↑ 38.3
16 17209752 17209927 Rimbp3 15.3
13 21810739 21810864 Hist1h2ao 13.9
3 96240117 96240167 Gm20632 9.1
3 96240098 96240173 H2ac19 8.5
17 47468660 47468760 AI661453 ↑ 7.9
7 83935631 83935681 Cemip ↓ 7.1
7 109752344 109752444 4930431P19Rik ↑ 6.9
7 131341694 131341794 2310057M21Rik 5.5
Top ten upmethylation peaks and their corresponding genes (P7 vs. P1). Fold change represents methylation peak’s degree. Arrow represents up or down
regulation of gene expression, Log2 FC > 1:5, P < 0:05 (no arrow means no statistically significant change).
Table 2: Top ten downmethylation peaks and their corresponding Table 4: Top ten downmethylation peaks and their corresponding
genes (P7 vs. P1). genes (P28 vs. P1).
Chromosome TxStart TxEnd Gene name Fold change Chromosome TxStart TxEnd Gene name Fold change
7 131391143 131391193 Pstk ↑ 81.6 12 27342363 27342463 Sox11 ↓ 48.5
2 53218067 53218117 Arl6ip6 60.7 3 96240098 96240173 H2ac19 17.7
X 71315056 71315181 Mtm1 ↓ 58.0 3 96240092 96240192 Gm20632 16.7
12 69963717 69963767 Atl1 27.7 3 96268599 96268899 Gm20628 13.3
2 122447916 122452011 Slc28a2 20.6 11 62648384 62648484 Lrrc75a 13.1
4 139962219 139962419 Klhdc7a ↑ 20.0 7 143460986 143461050 Cdkn1c ↓ 12.8
2 122452036 122452531 Slc28a2 19.70 4 109666053 109666103 Cdkn2c 11.9
2 23507969 23508019 Spopl 18.1 3 96268653 96268903 H3c13 ↓ 11.4
5 149186468 149186518 Uspl1 ↓ 17.4 13 23533930 23534005 H2ac10 ↓ 11.1
17 84184705 84184805 Zfp36l2 15 13 23574380 23574680 H2ac7 ↓ 10.8
Top ten downmethylation peaks and their corresponding genes (P7 vs. P1). Top ten downmethylation peaks and their corresponding genes (P28 vs. P1).
Fold change represents methylation peak’s degree. Arrow represents up or Fold change represents methylation peak’s degree. Arrow represents up or
down regulation of gene expression, Log2 FC > 1:5, P < 0:05 (no arrow down regulation of gene expression, Log2 FC > 1:5, P < 0:05 (no arrow
means no statistically significant change). means no statistically significant change).
“gastric cancer,” and “alcoholism” mostly (Figure 4(h), P <
Table 3: Top ten upmethylation peaks and their corresponding 0:05).
gene (P28 vs. P1). To sum up, there were differences between the results of
these two parts. What mainly be methylated in the P7 heart
Chromosome TxStart TxEnd Gene name Fold change
tissues were genes governing cell-to-cell transport and signal
2 86042835 86043035 Olfr1033 59.9 transduction, while in the P28 heart tissues were genes more
7 74359749 74359849 Slco3a1 ↑ 28.3 related to the function of macromolecules such as organelle
4 139962244 139962419 Klhdc7a ↑ 26.1 formation. However, the overlaps that were identified in both
11 55179387 55180723 Slc36a2 24.5 parts, such as the “ABC transporters” and “ECM-receptor
19 10450168 10450218 Syt7 ↑ 21.8 interaction pathway” of KEGG, most likely play significant
roles in myocardial development process.
8 83572497 83572547 Tecr ↓ 20.2
6 24570892 24571067 Asb15 ↓ 19.5 3.8. Verification of Significant Genes and Proteins. On the
14 101442734 101442859 Tbc1d4 ↑ 19.4 basis of the m6A methylation analysis results described
12 91633008 91633133 Ston2 ↑ 19.3 above, we further validated at the gene or protein levels of
8 83572397 83572472 Nr1d2 16.4 the major m6A methylases and genes with noteworthy differ-
ences both in methylation and expression using qPCR and
Top ten upmethylation peaks and their corresponding genes (P28 vs. P1).
Fold change represents methylation peak’s degree. Arrow represents up or western blot analysis. The qPCR results showed significant
down regulation of gene expression, Log2 FC > 1:5, P < 0:05 (no arrow increases of GAT4and Tet2, but decreases of IGF2BP3and
means no statistically significant change). MEGF6 (Figure 5(a)), which were in general in agreement
with the findings obtained using gene profiling. Similarly,
western blot results showed that the expression of “writer”10 Oxidative Medicine and Cellular Longevity
GO term –Log10(P value)
Intracellular protein transmembrance transport
Negative regulation of cytosolic calcium ion concentration
Vesicle–mediated transport to the plasma membrane
Protein transmembrane transport
3.0
Positive regulation of fatty acid beta–oxidation
BP
Peptidyl–L–cysteine S–palmitoylation
Peptidyl–S–diacylglycerol–L–cysteine biosynthetic process from peptidyl–cysteine
Negative regulation of transcription by RNA polymerase I
Liver morphogenesis
Protein lipidation
Golgi stack
Golgi cis cisterna
Intrinsic component of Golgi membrane
Neuromuscular junction
Palmitoyltransferase complex
CC
Recycling endosome 2.5
Postsynaptic membrane
Apical dendrite
Phagophore assembly site
Nuclear transcriptional repressor complex
Transmembrane receptor protein tyrosine kinase activity
Phosphatidylinositol 3–kinase binding
Transmembrane receptor protein kinase activity
Ephrin receptor activity
Diacylglycerol kinase activity
MF
Phosphatidylinositol 3–kinase regulatory subunit binding
ATP–dependent RNA helicase activity
RNA helicase activity 2.0
RNA–dependent ATPase activity
Ligand–gated cation channel activity
0 1 2 3 4 5
Num of genes
(a)
GO term –Log10(P value)
Glycerophospholipid metabolic process
Glycerolipid biosynthetic process
Glycerophospholipid biosynthetic process 7
Phospholipid biosynthetic process
Carbohydrate derivative transport
BP
Phosphatidylinositol metabolic process
Cyclic nucleotide catabolic process
Nucleoside transmembrane transport
Nucleoside transport 6
Phosphatidylinositol biosynthetic process
Trans-Golgi network
Collagen trimer
CCR4–NOT complex
Integral component of endoplasmic reticulum membrane
Basolateral plasma membrane
CC
Complex of collagen trimers 5
Intrinsic component of endoplasmic reticulum membrane
Extracellular matrix
Actomyosin
Vacuolar membrane
Guanyl–nucleotide exchange factor activity
3′,5′–cyclic–AMP phosphodiesterase activity 4
Ras guanyl–nucleotide exchange factor activity
3′,5′–cyclic–nucleotide phosphodiesterase activity
Cyclic–nucleotide phosphodiesterase activity
MF
Active transmembrane transporter activity
ATPase activity coupled to movement of substances
Poly(A)–specific ribonuclease activity
Nucleoside transmembrane transporter activity 3
Carbohydrate derivative transmembrane transporter activity
0 10 20 30 40
Num of genes
(b)
GO term –Log10(P value)
Regulation of protein exit from endoplasmic reticulum
Xenobiotic transport
Macromolecule methylation 4.5
Zinc ion transport
Protein methylation
BP
Protein alkylation
Negative regulation of response to endoplasmic reticulum stress
Histone lysine methylation
Protein demannosylation
Protein alpha–1,2–demannosylation 4.0
Intercellular canaliculus
Integral component of endoplasmic reticulum membrane
Axon terminus
Intrinsic component of endoplasmic reticulum membrane
Neuron projection terminus
CC
Sarcolemma
Transmembrane transporter complex 3.5
Trans–Golgi network
Endosomal part
Cystoplasmic side of plasma membrane
Xenobiotic transmembrane transporter activity
Active transmembrane transporter activity
Guanyl–nucleotide exchange factor activity 3.0
Phosphoprotein phosphatase activity
Oligopeptide transmembrane transporter activity
MF
Sphingolipid transporter activity
Protein serine/threonine phosphatase activity
Zinc ion transmembrane transporter activity
Transcription factor activity, direct ligand regulated sequence–specific DNA binding
Solute:proton symporter activity 2.5
0 5 10 15
Num of genes
(c)
Figure 4: Continued.Oxidative Medicine and Cellular Longevity 11
GO term –Log10(P value)
Cell surface receptor signaling pathway involved in cell–cell signaling
Wnt signaling pathway 6
Cell–cell signaling by wnt
Canonical Wnt signaling pathway
Cardiac chamber formation
BP
Paraxial mesoderm formation
Mesenchyme morphogenesis
Morphogenesis of a polarized epithelium
Establishment of planar polarity 5
Establishment of tissue polarity
Lamellipodium
Stress fiber
Contractile actin filament bundle
Actomyosin
Spindle
CC
Presynaptic membrane 4
Kinetochore
Apical dendrite
Actin filament bundle
Growth cone
Proximal promoter DNA–binding transcription activator acitivity, RNA polymerase II-specific
Transmembrane receptor protein tyrosine kinase activity 3
Phosphatidylinositol 3–kinase binding
Transmembrane receptor protein kinase activity
Gamma–catenin binding
MF
Transcription factor activity, RNA polymerase II distal enhancer sequence–specific binding
Phosphoprotein phosphatase activity
PDZ domain binding
Protein tyrosine kinase activity 2
Insulin receptor binding
0.0 2.5 5.0 7.5 10.0 12.5
Num of genes
(d)
KEGG pathway –Log10(P value) KEGG pathway –Log10(P value)
5.5
AMPK signaling pathway 4.5 Glycerophospholipid metabolism
Longevity regulating pathway ECM–receptor interaction
5.0
Sphingolipid metabolism Purine metabolism
4.0
Progesterone–mediated oocyte maturation ABC transporters
4.5
Sphingolipid signaling pathway Other types of O–glycan biosynthesis
3.5
Glycosaminoglycan biosynthesis – heparan sulfate/heparin MicroRNAs in cancer
4.0
Longevity regulating pathway – worm Glycerolipid metabolism
Insulin signaling pathway 3.0 Morphine addiction
3.5
TNF signaling pathway Aldosterone synthesis and secretion
Phospholipase D signaling pathway 2.5 cGMP–PKG signaling pathway
3.0
0.02 0.03 0.04 0.05 0.010 0.015
Gene ratio Gene ratio
Count Count
2 5 5.0 12.5
3 6 7.5 15.0
4 10.0
(e) (f)
KEGG pathway –Log10(P value) KEGG pathway –Log10(P value)
ABC transporters 5 Wnt signaling pathway 6
Cell motility Gastric cancer
Glycerophospholipid metabolism Breast cancer
5
Vitamin digestion and absorption 4 Basal cell carcinoma
Protein processing in endoplasmic reticulum Glycosaminoglycan biosynthesis – heparan sulfate/heparin
4
Cell adhesion molecules Glycosaminoglycan biosynthesis – chondroitin sulfate/dermatan sulfate
Longevity regulating pathway – worm 3 Alcoholism
ECM–receptor interaction Systemic lupus erythematosus 3
MicroRNAs in cancer Cushing syndrome
B cell receptor signaling pathway 2 Melanogenesis
2
0.010 0.015 0.020 0.02 0.03 0.04 0.05 0.06
Gene ratio Gene ratio
Count Count
2 5 2 6
3 6 3 7
4 4 8
5
(g) (h)
Figure 4: Gene Ontology and KEGG analysis of comparing C57B/L different day-old heart tissues. (a, b) Biological processes (BP), cell
component (CC), and molecular functions (MF) of hyper- and hypomethylated genes in P7 as compared to P1. (c, d) Biological processes
(BP), cell component (CC), and molecular functions (MF) of hyper- and hypomethylated genes in P28 as compared to P1. (e, f) KEGG
pathway analysis of hyper- and hypomethylated genes in P7 as compared to P1. (g, h) KEGG pathway analysis of hyper- and
hypomethylated genes in P28 as compared to P1.
METTL 3 was upregulated in the P7 heart tissues and then P1. However, YTHDC1 and IGF2BP3, as the representative
dropped down in the P28 heart tissue, but still higher than of “YTH” and “IGF” family of “reader,” changed differently
that in the P1 heart tissue, which was consistent with the dis- over time from P1 to P28, with increased YTHDC1 and
tribution of m6A methylation sites on the chromosome decreased IGF2BP3 (Figures 5(b) and 5(c)), which may be
(Figures 5(b), 5(c), and 1(e)). The high expression of “eraser” related to the regulation of different downstream target pro-
FTO may exert synergistic action on the hypomethylation in teins at different times.12 Oxidative Medicine and Cellular Longevity
METTL 3 –64 kDa
⁎⁎⁎
⁎⁎
⁎⁎⁎
6 5 ⁎⁎
FTO –60 kDa ⁎
4 ⁎
Relative protein levels
Relative expression
4 YTHDF1 –70 kDa ns
(fold change)
ns
⁎⁎⁎ 3 ⁎ ⁎⁎
⁎⁎ ⁎⁎
⁎⁎⁎ ns
⁎⁎⁎ ns
⁎⁎
⁎⁎⁎ ⁎⁎⁎ ⁎ ⁎⁎
⁎⁎⁎ ⁎⁎ IGF2BP3 –63 kDa 2 ⁎⁎⁎ ns
2 ⁎⁎ ns
⁎⁎ ⁎⁎ ⁎ ⁎⁎
⁎⁎ ⁎⁎ ⁎ ns
1
GAPDH –34 kDa
0 0
P1 P7 P28
METTL3
FTO
YTHDF1
IGF2BP3
GAPDH
IGF2BP1
IGF2BP3
ALKBH5
Hist1h2ao
Tet2
GATA4
MEGF6
P1 P1
P7 P7
P28 P28
(a) (b) (c)
Figure 5: Verification of significant genes. (a) qPCR result of noteworthy methylases and genes in mouse heart tissues. (b, c) Western blot
showing the representative methylases in mouse heart tissues, quantitated by ImageJ. Values are the mean ± S:D: of n = 3 independent
experiments. ∗ P < 0:05; ∗∗ P < 0:01; ∗∗∗ P < 001; ns: not significant.
4. Discussion the heart tissues from mice at different days during their early
life stage.
m6A, a dynamic and reversible modification among different Previous studies have shown that the proliferation and
species, is one of the most common and functional RNA regeneration ability of heart tissue basically disappears
modifications [16–18, 40, 41]. More and more studies around the 7th day of development, and the cell cycle of car-
showed that m6A RNA methylation plays a critical role in diomyocytes no longer exists, with only a very small prolifer-
regulating RNA metabolic processes, which was increasingly ation rate remaining [12–14]. The underlying mechanism is
found in mammalian failing hearts and hypoxic cardiomyo- still unclear. It is the terminal differentiation and nonrenew-
cytes [31, 42, 43]. In the current study, we reported the ability of myocardial tissue in adulthood that prevent the
m6A distribution and differences of mRNA in C57BL/6J heart from proliferating and repairing itself after the heart
hearts over time during the early development stages by illus- injuries, such as ischemia reperfusion injury (IRI) and MI
trating global m6A modification patterns and analyzing gene [10–14]. The response of the mammalian heart to MI and
expression, function, and related pathways. the concomitant cell death is the substitution of fibroblasts,
We revealed that the pattern of m6A modification in the extracellular matrix reticulum, and proliferating cells for
neonatal mouse heart tissue was distinct from that of the the damaged myocardium, thereby the scar-forming, called
adult mice. Interestingly, in the P1 heart tissues, the amount ventricular remodeling [46, 47]. Extensive cell therapy stud-
and level of global m6A peaks detected were the lowest. But ies have used embryonic stem cells (ESC) and induced plu-
when compared with the P7 heart tissues in which it pos- ripotent stem cells (iPSC) as exogenous sources of new
sessed the largest amount and highest level of m6A peaks, it cardiomyocytes for treatment [9, 48]. After being trans-
was found that most of the peaks in P1 were hypermethy- planted into the infarcted heart, they can play a beneficial role
lated. These specific and critical genes with aberrant hyper- in the repair of local and global cardiac regeneration function
methylation against the globally low m6A modification [49]. However, before being used clinically, some potential
tendency in P1 may be the key why neonates possess the effi- adverse effects need to be resolved, such as unstable pheno-
cient proliferative and regenerative capability. Thus, we pre- types [50], low efficient cardiomyocyte transformation rate
sumed that some hypermethylated genes functioned at P1 [51], tumorigenic potential [52], and arrhythmia and rejec-
and then misfunctioned after demethylation over time. By tion [53]. Therefore, reactivation of the cell cycle of cardio-
analyzing different methylated transcripts and peaks, various myocytes and stimulation of their proliferation capacity
biological processes and pathways that control cardiomyo- seem to be the most direct approach. Available data and
cyte proliferation, such as the Wnt signaling pathway [44], results provide various strategies to trigger this process and
were found to be significantly enriched, suggesting that there generate new cardiomyocytes, such as the direct transdiffer-
exists a relationship between abnormal m6A modification entiation mediated by small molecules, transcription factors,
and cardiac tissue regeneration and proliferation. The global and ncRNAs. The modification of m6A has been found to be
change of m6A modification spectrum may be caused by the extremely important for sperm development in existing stud-
abnormal expression of m6A key enzymes [40, 45]. Accord- ies [54]. When the “reader” protein is inactivated, the level of
ing to the result of the RNA-seq, differences in the expression m6A RNA modification mediated by it decreases significantly,
levels of “writers,” “erasers,” and “readers” of m6A do exist in leading to a significant imbalance in the posttranscriptionalOxidative Medicine and Cellular Longevity 13
translation efficiency of related genes that regulate the fate tional studies are necessary not only to understand the
determination of spermatogonial stem cells and sperm forma- underlying mechanism of m6A in the myocardial regenera-
tion. It has also been shown that “writer” METTL14 plays a tion but also for the therapeutic implication for cardiovascu-
major role in endothelial cell inflammation induced by tumor lar problems.
necrosis factor-α [55]. METTL14 induces endothelial cell
inflammation and atherosclerotic plaque by enhancing the Abbreviations
m6A modification of FOXO1 and promoting its expression.
Meanwhile, the latest studies have shown that m6A can regu- BP: Biological process
late cardiomyocyte renewal [31] and the “eraser” ALKBH5 CC: Cellular component
can regulate the proliferation of cardiomyocytes by demethy- CDS: Coding sequences
lating YTHDF1 [56]. The findings of these studies strongly 3 ′ UTR: 3 ′ -Untranslated regions
indicate that m6A is important for heart development and CMs: Cardiac cardiomyocytes
can promote the proliferation and differentiation of stem cells DEGs: Differentially expressed genes
in heart disease. In our current study, in addition to explore FC: Fold change
the regulatory role of m6A modification on gene expression FE: Fold enrichment
during heart development, a more important purpose is to IRI: Ischemia reperfusion injury
find a potential therapeutic target for IRI or MI. We thus MI: Myocardial infarction
focused on analyzing and identifying the key genes related to MF: Molecular function
proliferation regulated by m6A modification by comparing RIN: RNA integrity number.
heart tissues at different day-ages during development with
the potential to stimulate them to arousing myocardium pro- Data Availability
liferation after IRI and MI injury to achieve the therapeutic
purpose. Our results show that, from the peaks and clusters The data used to support the findings of this study are avail-
of the three groups of samples, m6A modification tends to able from the corresponding author upon request.
be positively correlated with mRNA expression, consistent
with some previous observations [57, 58], but differed from Conflicts of Interest
other studies [24, 59]. This discrepancy may be due to the dif-
ferences in animal tissue sources and sample collection, but it The authors have declared that no competing interest exists.
still has significant implications. In addition, the specific role
of m6A modification in gene expression depends to a large Authors’ Contributions
extent on the downstream function of the m6A “readers”
[60–62], which have been reported to affect multiple aspects Yuhui Yang and Siman Shen contributed equally to this
of target RNA metabolism by recognizing different m6A work.
regions, including RNA localization, splicing, transport, trans-
lation, and stability [63]. Knocking down or overexpressing Acknowledgments
key methylases may be a good strategy for studying m6A
methylation-mediated cellular responses. Furthermore, the This work was supported by the Science and Technology
m6A-seq and mRNA-seq data collectively show that there Planning Project of Guangdong Province of China
are genes regulated by m6A in a positive or negative manner (2014A020212301) and the National Natural Science Fund
(Tables 1–4, Log2 FC > 1, P < 0:05). Besides the methylases, of China (81870222).
we found that there were remarkable changes in Tet2,
GATA4, and MEGF6 in our sequencing results, which were References
associated with proliferation in other tissues such as the lung
and colorectum as shown in other studies [64, 65]. We specu- [1] M. Li and J. C. Izpisua Belmonte, “Mending a faltering heart,”
late that these genes with specific m6A modification may also Circulation Research, vol. 118, no. 2, pp. 344–351, 2016.
be capable of promoting myocardial proliferation and regen- [2] C. Mummery, D. Ward-van Oostwaard, P. Doevendans et al.,
“Differentiation of human embryonic stem cells to cardiomyo-
eration which deserve further study. By integrating the latest
cytes: role of coculture with visceral endoderm-like cells,” Cir-
nanotechnology, m6A modification may provide a new direc-
culation, vol. 107, no. 21, pp. 2733–2740, 2003.
tion for treating heart diseases [66, 67].
[3] X. Sun, J. Wu, B. Qiang et al., “Transplanted microvessels
improve pluripotent stem cell-derived cardiomyocyte engraft-
5. Conclusions ment and cardiac function after infarction in rats,” Science
Translational Medicine, vol. 12, no. 562, 2020.
In summary, our research reveals differences in m6A of [4] P. Nigro, B. Bassetti, L. Cavallotti, V. Catto, C. Carbucicchio,
mRNA of C57BL/6J heart tissue at different developmental and G. Pompilio, “Cell therapy for heart disease after 15 years:
stages and shows the distribution and possible function of unmet expectations,” Pharmacological Research, vol. 127,
m6A through statistical analysis and thorough bioinformat- pp. 77–91, 2018.
ics analysis. Our studies have provided a fundamental contri- [5] T. Wongtawan, J. E. Taylor, K. A. Lawson, I. Wilmut,
bution for further researches aimed at identifying novel and S. Pennings, “Histone H4K20me3 and HP1α are late
therapeutic strategy for heart IRI and MI. However, addi- heterochromatin markers in development, but present in14 Oxidative Medicine and Cellular Longevity
undifferentiated embryonic stem cells,” Journal of Cell Sci- [22] Z. Zhang, K. Luo, Z. Zou et al., “Genetic analyses support the
ence, vol. 124, no. 11, pp. 1878–1890, 2011. contribution of mRNA N6-methyladenosine (m6A) modifica-
[6] C. E. Nestor, R. Ottaviano, D. Reinhardt et al., “Rapid repro- tion to human disease heritability,” Nature Genetics, vol. 52,
gramming of epigenetic and transcriptional profiles in mam- no. 9, pp. 939–949, 2020.
malian culture systems,” Genome Biology, vol. 16, no. 1, 2015. [23] R. Wu, D. Jiang, Y. Wang, and X. Wang, “N (6)-Methyladeno-
[7] M. Ponnusamy, F. Liu, Y. H. Zhang et al., “Long noncoding sine (m(6)a) methylation in mRNA with a dynamic and
RNA CPR (cardiomyocyte proliferation regulator) regulates reversible epigenetic modification,” Molecular Biotechnology,
cardiomyocyte proliferation and cardiac repair,” Circulation, vol. 58, no. 7, pp. 450–459, 2016.
vol. 139, no. 23, pp. 2668–2684, 2019. [24] X. Wang, Z. Lu, A. Gomez et al., “N6-methyladenosine-depen-
[8] M. Xin, Y. Kim, L. B. Sutherland et al., “Hippo pathway effec- dent regulation of messenger RNA stability,” Nature, vol. 505,
tor Yap promotes cardiac regeneration,” Proceedings of the no. 7481, pp. 117–120, 2014.
National Academy of Sciences of the United States of America, [25] P. Mathiyalagan, M. Adamiak, J. Mayourian et al., “FTO-
vol. 110, no. 34, pp. 13839–13844, 2013. dependent N6-methyladenosine regulates cardiac function
[9] T. R. Heallen, Z. A. Kadow, J. H. Kim, J. Wang, and J. F. during remodeling and repair,” Circulation, vol. 139, no. 4,
Martin, “Stimulating cardiogenesis as a treatment for heart pp. 518–532, 2019.
failure,” Circulation Research, vol. 124, no. 11, pp. 1647– [26] Y. Wang, Y. Li, M. Yue et al., “N6-methyladenosine RNA mod-
1657, 2019. ification regulates embryonic neural stem cell self-renewal
[10] Y. Li, J. Feng, S. Song et al., “gp130 controls cardiomyocyte through histone modifications,” Nature Neuroscience, vol. 21,
proliferation and heart regeneration,” Circulation, vol. 142, no. 2, pp. 195–206, 2018.
no. 10, pp. 967–982, 2020. [27] F. Xiong, T. Lin, M. Song et al., “Antenatal hypoxia induces epi-
[11] K. Kikuchi, “Dedifferentiation, transdifferentiation, and prolif- genetic repression of glucocorticoid receptor and promotes
eration: mechanisms underlying cardiac muscle regeneration ischemic-sensitive phenotype in the developing heart,” Journal
in zebrafish,” Current Pathobiology Reports, vol. 3, no. 1, of Molecular and Cellular Cardiology, vol. 91, pp. 160–171, 2016.
pp. 81–88, 2015. [28] M. Takeda, L. E. Briggs, H. Wakimoto et al., “Slow progressive
[12] E. R. Porrello, A. I. Mahmoud, E. Simpson et al., “Transient conduction and contraction defects in loss of Nkx2-5 mice
regenerative potential of the neonatal mouse heart,” Science, after cardiomyocyte terminal differentiation,” Laboratory
vol. 331, no. 6020, pp. 1078–1080, 2011. Investigation, vol. 89, no. 9, pp. 983–993, 2009.
[13] E. Lázár, H. A. Sadek, and O. Bergmann, “Cardiomyocyte [29] P. D. Nguyen, D. E. M. de Bakker, and J. Bakkers, “Cardiac
renewal in the human heart: insights from the fall-out,” Euro- regenerative capacity: an evolutionary afterthought?,” Cellular
pean Heart Journal, vol. 38, no. 30, pp. 2333–2342, 2017. and Molecular Life Sciences, vol. 78, no. 12, pp. 5107–5122,
[14] Y. Fan, Y. Cheng, Y. Li et al., “Phosphoproteomic analysis of 2021.
neonatal regenerative myocardium revealed important roles [30] X. Sun, Q. Han, H. Luo et al., “Profiling analysis of long non-
of checkpoint kinase 1 via activating mammalian target of coding RNAs in early postnatal mouse hearts,” Scientific
rapamycin C1/ribosomal protein S6 kinase b-1 pathway,” Cir- Reports, vol. 7, no. 1, 2017.
culation, vol. 141, no. 19, pp. 1554–1569, 2020. [31] B. Li, Y. Hu, X. Li et al., “Sirt1 antisense long noncoding RNA
[15] S. Schwartz, D. A. Bernstein, M. R. Mumbach et al., “Tran- promotes cardiomyocyte proliferation by enhancing the stabil-
scriptome-wide mapping reveals widespread dynamic- ity of Sirt1,” Journal of the American Heart Association, vol. 7,
regulated pseudouridylation of ncRNA and mRNA,” Cell, no. 21, article e009700, 2018.
vol. 159, no. 1, pp. 148–162, 2014. [32] A. Kechin, U. Boyarskikh, A. Kel, and M. Filipenko, “cutPri-
[16] D. Dominissini, S. Moshitch-Moshkovitz, S. Schwartz et al., mers: a new tool for accurate cutting of primers from reads
“Topology of the human and mouse m6A RNA methylomes of targeted next generation sequencing,” Journal of Computa-
revealed by m6A-seq,” Nature, vol. 485, no. 7397, pp. 201– tional Biology, vol. 24, no. 11, pp. 1138–1143, 2017.
206, 2012. [33] D. Kim, B. Langmead, and S. L. Salzberg, “HISAT: a fast
[17] Z. Bodi, A. Bottley, N. Archer, S. T. May, and R. G. Fray, “Yeast spliced aligner with low memory requirements,” Nature
m6A methylated mRNAs are enriched on translating ribo- Methods, vol. 12, no. 4, pp. 357–360, 2015.
somes during meiosis, and under rapamycin treatment,” PLoS [34] Y. Zhang, T. Liu, C. A. Meyer et al., “Model-based analysis of
One, vol. 10, no. 7, article e0132090, 2015. ChIP-Seq (MACS),” Genome Biology, vol. 9, no. 9, p. R137,
[18] Y. Wan, K. Tang, D. Zhang et al., “Transcriptome-wide high- 2008.
throughput deep m6A-seq reveals unique differential m6A [35] L. Shen, N. Y. Shao, X. Liu, I. Maze, J. Feng, and E. J. Nestler,
methylation patterns between three organs in Arabidopsis “diffReps: detecting differential chromatin modification sites
thaliana,” Genome Biology, vol. 16, no. 1, 2015. from ChIP-seq data with biological replicates,” PLoS One,
[19] H. Yue, X. Nie, Z. Yan, and S. Weining, “N6-Methyladenosine vol. 8, no. 6, 2013.
regulatory machinery in plants: composition, function and [36] M. Ashburner, C. A. Ball, J. A. Blake et al., “Gene ontology: tool
evolution,” Plant Biotechnology Journal, vol. 17, no. 7, for the unification of biology,” Nature Genetics, vol. 25, no. 1,
pp. 1194–1208, 2019. pp. 25–29, 2000.
[20] H. B. Li, J. Tong, S. Zhu et al., “m6A mRNA methylation con- [37] D. W. Huang, B. T. Sherman, and R. A. Lempicki, “Bioinfor-
trols T cell homeostasis by targeting the IL-7/STAT5/SOCS matics enrichment tools: paths toward the comprehensive
pathways,” Nature, vol. 548, no. 7667, pp. 338–342, 2017. functional analysis of large gene lists,” Nucleic Acids Research,
[21] T. Sun, R. Wu, and L. Ming, “The role of m6A RNA methyla- vol. 37, no. 1, pp. 1–13, 2009.
tion in cancer,” Biomedicine & Pharmacotherapy, vol. 112, [38] K. D. Meyer, Y. Saletore, P. Zumbo, O. Elemento, C. E. Mason,
p. 108613, 2019. and S. R. Jaffrey, “Comprehensive analysis of mRNAYou can also read