Superficial Layers Suppress the Deep Layers to Fine-tune Cortical Coding
←
→
Page content transcription
If your browser does not render page correctly, please read the page content below
2052 • The Journal of Neuroscience, March 13, 2019 • 39(11):2052–2064

Systems/Circuits

Superficial Layers Suppress the Deep Layers to Fine-tune
Cortical Coding
X Scott R. Pluta,1,2 X Greg I. Telian,2 X Alexander Naka,2 and X Hillel Adesnik2
1   Department of Molecular and Cell Biology and the Helen Wills Neuroscience Institute, University of California, Berkeley, California 94720, and
2   Department of Biology, Purdue University, West Lafayette, Indiana 47907

The descending microcircuit from layer 2/3 (L2/3) to layer 5 (L5) is one of the strongest excitatory pathways in the cortex, presumably
forming a core component of its feedforward hierarchy. To date, however, no experiments have selectively tested the impact of L2/3
activity on L5 during active sensation. We used optogenetic, cell-type-specific manipulation of L2/3 neurons in the barrel cortex of
actively sensing mice (of either sex) to elucidate the significance of this pathway to sensory coding in L5. Contrary to standard models,
activating L2/3 predominantly suppressed spontaneous activity in L5, whereas deactivating L2/3 mainly facilitated touch responses in L5.
Somatostatin interneurons are likely important to this suppression because their optogenetic deactivation significantly altered the functional
impact of L2/3 onto L5. The net effect of L2/3 was to enhance the stimulus selectivity and expand the range of L5 output. These data imply that the
core cortical pathway increases the selectivity and expands the range of cortical output through feedforward inhibition.
Key words: active sensing; circuits; cortex; receptive fields; sensory coding; translaminar

       Significance Statement
       The primary sensory cortex contains six distinct layers that interact to form the basis of our perception. While rudimentary
       patterns of connectivity between the layers have been outlined quite extensively in vitro, functional relationships in vivo, partic-
       ularly during active sensation, remain poorly understood. We used cell-type-specific optogenetics to test the functional relation-
       ship between layer 2/3 and layer 5. Surprisingly, we discovered that L2/3 primarily suppresses cortical output from L5. The
       recruitment of somatostatin-positive interneurons is likely fundamental to this relationship. The net effect of this translaminar
       suppression is to enhance the selectivity and expand the range of receptive fields, therefore potentially sharpening the perception
       of space.

Introduction                                                                                                         2011; Feldmeyer, 2012). A common assumption from these data
Identifying the circuits that contribute to the activity of L5 corti-                                                is that L2/3 provides a critical component of sensory facilitation
cal projection neurons is essential for understanding cortical                                                       to L5, and response latencies in these two layers to whisker de-
computation and its role in sensation and behavior. Extensive                                                        flection are partly consistent with this notion (Armstrong-James
research has identified a descending connection from pyramidal                                                       et al., 1992). Nonetheless, pharmacological or cryogenic deacti-
cells (PCs) in L2/3 as a prominent source of intracortical excita-                                                   vation experiments in vivo argue that L2/3 has no effect on sen-
tion to L5 (Lefort et al., 2009; Otsuka and Kawaguchi, 2009; Pe-                                                     sory responses in L5 (Schwark et al., 1986; Constantinople and
treanu et al., 2009; Adesnik and Scanziani, 2010; Hooks et al.,                                                      Bruno, 2013). However, these prior techniques had limited tem-
                                                                                                                     poral precision and were performed in anesthetized or sedated
Received June 8, 2018; revised Dec. 17, 2018; accepted Dec. 20, 2018.
                                                                                                                     animals, where spontaneous and interneuron activity is substan-
   Author contributions: S.R.P. and H.A. edited the paper; S.R.P. and H.A. designed research; S.R.P. and A.N. per-   tially altered (de Kock and Sakmann, 2008; Constantinople and
formed research; G.I.T. contributed unpublished reagents/analytic tools; S.R.P. and A.N. analyzed data; S.R.P. and   Bruno, 2011; Adesnik et al., 2012; Sellers et al., 2013; McGinley et
H.A. wrote the paper.                                                                                                al., 2015). To overcome these technical limitations, L2/3-specific
   This work was supported by New York Stem Cell Foundation and National Institute of Neurological Disorders and
Stroke Grant DP2NS087725-01. A.N. was supported by National Institutes of Health National Research Service Award
                                                                                                                     optogenetic manipulations in awake, behaving animals are
F31NS093925. G.I.T. was supported by the Howard Hughes Medical Institute Gilliam Fellowship. H.A. is a New York      needed. Previously, L2/3 photoactivation in brain slices sug-
Stem Cell Robertson Investigator. We thank Dan Feldman, members of the H.A. laboratory, and Alex Chubykin for        gested that L2/3 could modulate spiking in L5 neurons either up
comments on the manuscript.                                                                                          or down (Adesnik and Scanziani, 2010). This study also found
   The authors declare no competing financial interests.
   Correspondence should be addressed to Hillel Adesnik at hadesnik@berkeley.edu.
                                                                                                                     that the ratio between excitation and inhibition that each L5 tar-
   https://doi.org/10.1523/JNEUROSCI.1459-18.2018                                                                    get neuron received during L2/3 photoactivation correlated well
Copyright © 2019 the authors 0270-6474/19/392052-13$15.00/0                                                          with the impact on its firing rate. Despite this and other work, the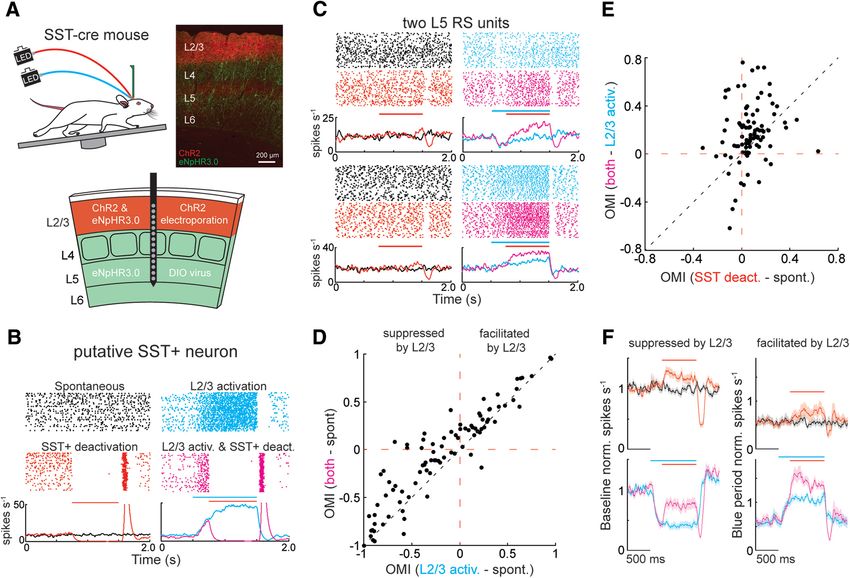
Pluta et al. • Translaminar Suppression Enhances Sensory Coding J. Neurosci., March 13, 2019 • 39(11):2052–2064 • 2053
functional impact of L2/3 activity to sensory responses in L5, sensory cortices were removed with surgical instruments. Following ap-
particularly in the awake, actively sensing animal, remains plication of Vetbond (3M) to the skull surface and wound margins, a
uncertain. custom stainless-steel headplate was fixed to the skull with dental cement
We used L2/3-specific optogenetic manipulations in head- (Metabond, Parkell). The headplate was mounted on an angle (⬃40
fixed, whisking mice to address this question. When we optoge- degrees), to allow a vertical insertion of the electrode to enter the barrel
netically activated L2/3, many L5 units showed significant cortex perpendicular to the surface. Two days after surgery, mice were ha-
suppression, whereas only half as many showed facilitation. Con- bituated for 4 – 8 d to head fixation on a free-spinning circular treadmill,
versely, when we optogenetically deactivated L2/3 during active until they freely ran at a fast and steady pace (⬎40 cm/s). In preparation for
electrophysiology, mice were briefly (10 –15 min) anesthetized with isoflu-
touch, L5 units were 2 times more likely to be significantly facil-
rane, the skull over S1 was thinned with a dental drill (Foredom), and a small
itated than suppressed. Intracellular recordings in brain slices
(⬍200 m) craniotomy was made with a 27 gauge needle. In most cases,
revealed that L2/3 potently recruited L5 somatostatin (SST ⫹)
intrinsic signal imaging was used to localize the C2 or C1 barrel column. In
interneurons, raising the notion that feedforward, dendritic in- all other cases, stereotaxic coordinates were used to localize the macrovibris-
hibition may contribute to these effects. Indeed, optogenetically sae region. Using this approach, sometimes a second craniotomy was made,
deactivating SST ⫹ neurons in vivo significantly altered the func- if an appropriate macrovibrissal column (C2, C1, B2, B1) was not localized
tional impact of L2/3 onto L5. Importantly, the net impact of with the first penetration. The small size of the craniotomy minimized mo-
L2/3 activity during active touch was to sharpen the representa- tion of the brain during electrode penetration and animal movement. A 16-
tion of space in individual L5 neurons, both by sparsening their or 32-channel linear silicon probe (NeuroNexus) was guided into the brain
receptive fields and by steepening the slope of activity across tac- using a micromanipulator (Sutter Instruments or Sensapex) and a stereomi-
tile space. These experiments demonstrate that the core, descend- croscope (Leica MZ6).
ing pathway in the intracortical microcircuit enhances stimulus Spike sorting. Sixteen to 32 channels of electrodes spaced in a linear
selectivity and expands the range of cortical output by augment- array were amplified (AM Systems) and digitized at 30 kHz (National
ing the representation of space in the main cortical projection Instruments) using custom acquisition software (MATLAB, The Math-
layer. Works). Spike detection was performed using the UltraMegaSort 2000
package in MATLAB (Hill et al., 2011). After detection, spikes were au-
Materials and Methods tomatically sorted into clusters of units. Units were then further sorted
Experimental model and subject details manually to meet inclusion criteria and prevent pseudo-replication.
Mice between 6 and 9 weeks of age and of either gender were used for all Quality metrics included analysis of spike amplitude, spike rate, auto-
in vivo experiments. All procedures were approved by the Animal Care and cross-correlation, interspike interval, outlier removal, distance from
and Use Committee of University of California Berkeley. Animals were threshold, and cortical depth of largest waveform. With the exception of
maintained on a 12:12 reversed light/dark cycle. All DRD3 mice a small subset of fast-spiking (FS) or bursting units, included units had
(Tg(Drd3-cre)KI196Gsat/Mmucd) were heterozygous for Cre recombi- no more than 1% of their individual waveforms violating a refractory
nase and F1 outcrossed with a WT albino mouse line (CD-1, Charles period of 2.5 ms.
River) to facilitate wheel-running behavior and prevent genetic instabil- Spike waveform classification. FS units were separated from regular
ity associated with homozygosity in the line. Nine mice with a single spiking (RS) units using a k-means cluster analysis of two waveform
recording session each were used for the L2/3 (DRD3) deactivation ex- components, as previously published (Pluta et al., 2015, 2017). One com-
periments. Previous in vitro measurements of inhibitory currents indi- ponent was the normalized amplitude asymmetry between the two
cate that Cre-mediated viral expression of opsins is exclusive to positive-going peaks. Positive values indicate that the second peak is
excitatory cortical neurons in this mouse line (Pluta et al., 2015). Three larger, whereas negative values indicate the opposite. The other compo-
mice with a single recording session each were used for the L2/3 (DRD3) nent was the trough-to-peak duration of the large negative-going deflec-
activation experiments. Four mice with a single recording session each
tion. FS units were categorized by a larger second positive-going peak
were used for the SST ⫹ deactivation alone experiments. Three mice with
(positive amplitude asymmetry), and a short (⬍0.33 ms) trough-to-peak
two recording sessions each (⬎200 m separation between electrode
duration, following previously established approaches (Reyes-Puerta et
sites) were used for the two-color SST ⫹ deactivation and L2/3 activation
experiments. SST-cre mice were F1 outcrossed to facilitate wheel- al., 2015). Units falling into a time bin containing both RS and FS classi-
running and increase fecundity, and therefore were heterozygous for fication were excluded from analysis, as previously published (Pluta et
Cre-recombinase. al., 2015, 2017).
In vitro electrophysiology. Brain slices from Drd3-Cre;GIN-GFP 2.5- to
Methods details 4-week-old mice were prepared and recorded as previously published
Neonatal viral injection and in utero electroporation. After the induction of (Pluta et al., 2015). ChR2 was expressed in L2/3 using neonatal viral
cryogenic anesthesia, neonatal mice (P0-P4) were injected with flexed ha- injections, as described above. PCs and GFP ⫹ cells in L5 were patched in
lorhodopsin 3.0 (AAV9.EF1a.DlO.eNPHR3.0-EYFp.WPRE.hGH) or flexed the whole-cell configuration. L2/3 was stimulated with a ramp of blue
channelrhodopsin 2 (AAV9.CAGGS.Flex.ChR2-tdTomato.WPRE.SV40). light targeted at an area with a height of 300 m and a width of 600 m
The injection site was targeted to the barrel cortex, at three locations, and at (⬃3 barrel columns) using a digital micromirror device. The spike rate
two depths (300 and 150 m) for each location. At each location and depth, and total synaptic excitatory charge were measuring during the illumi-
18.4 nl of virus was injected (Nanoject II) through a beveled glass pipette
nation period. Excitatory charge was calculated as the cumulative sum of
(WPI, 4878), for a total of 110.4 nl per neonate. In the two-color optogenetic
inward current.
experiments (see Fig. 3), DIO.eNpHR3.0-YFP was injected in SST-Cre mice
Whisker tracking. A high-speed camera (Basler, acA2000-340kc) was
in the same fashion. For in utero electroporation, pCAG-ChR2-mRuby3
plasmids were injected into the lateral ventricle of E15 embryos, thereby only placed below the running wheel, and the full whisker pad was imaged
transfecting L2/3 excitatory neurons (Hakim et al., 2018). The procedure from below using a mirror angled at 45 degrees. A strong infrared light
was performed as previously described (Adesnik and Scanziani, 2010). source was hung from above and diffused with thin tissue paper (Kim-
Preparation for in vivo electrophysiology. Anesthesia was induced with wipes). High-speed videos were acquired at 500 fps with a 100 s expo-
5% isoflurane and then maintained at 1.5%–3% during surgery. Respi- sure and synchronized via external triggers. The whiskers were traced in
ratory rate and response to toe/tail pinching were monitored throughout MATLAB using custom tracking software (Clack et al., 2012). The mean
surgery to ensure adequate anesthetic depth; 0.05 mg/kg of buprenor- angle trace of the traced whisker pad was used to calculate the kinematic
phine was administered for postoperative analgesia. After disinfecting features during touch: set-point (median angle of envelope) and ampli-
the scalp with 70% alcohol and 5% iodine, the skin and fascia above the tude (half-width of envelope).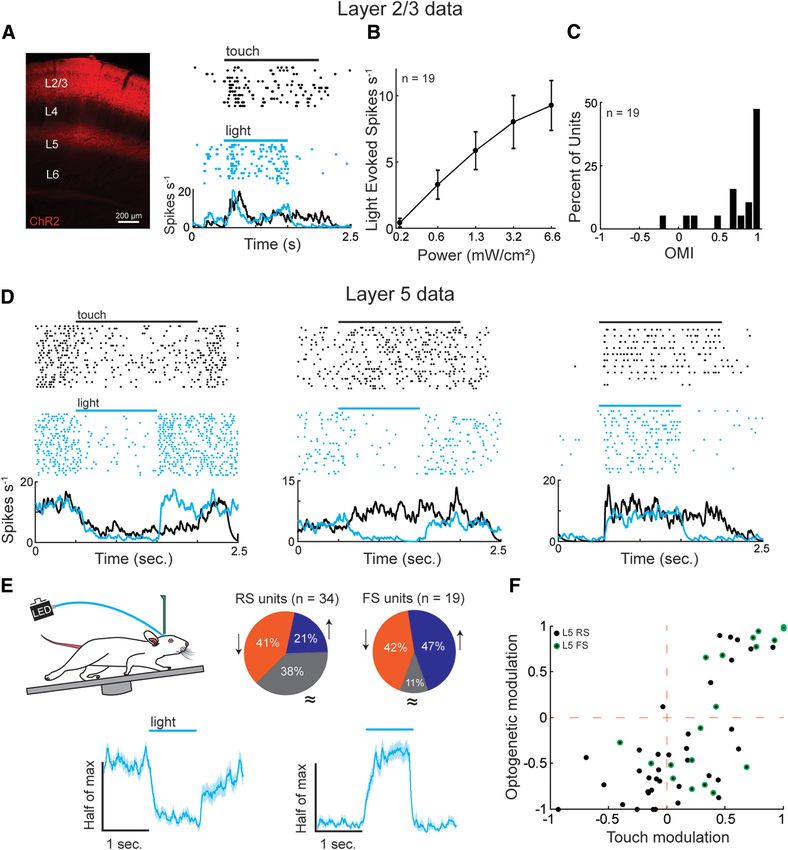
2054 • J. Neurosci., March 13, 2019 • 39(11):2052–2064 Pluta et al. • Translaminar Suppression Enhances Sensory Coding
Experimental design and statistical analysis condition were included from each mouse with a minimum treadmill
Tactile and optical stimulation. During electrophysiological recording, a speed of 33.7 ⫾ 3.2 cm/s (n ⫽ 9 animals, eNpHR3.0 dataset). The depth
vertical 0.7 mm Hex key (McMaster-Carr) was presented pseudo- of each unit was assigned based on the calculated depth of the electrode
randomly at one of eight locations (2.2 mm separation) along the hori- on the linear array that exhibited its largest waveform. Layer boundaries
zontal axis of the whisking field, perpendicular to whisking motion and were confirmed post hoc by labeling of the electrode track with a dye.
⬃1 cm away from the mouse’s face. For each trial, the Hex key quickly
(⬍50 ms) entered the whisking field and was held still for 1.5 s before
quickly retracting from the whisking field via a stepper motor (Oriental Results
Motor) under digital control (National Instruments). Between trials, the Optogenetic activation of layer 2/3 primarily suppresses L5
stepper motor and stimulus pole were automatically moved to the posi- A multielectrode linear array was inserted into the barrel cortex
tion of the next trial using a motorized linear stage (Zaber). An optical of mice that were habituated to run on a circular treadmill. With
fiber (1 mm core) coupled to an electronically controlled LED (Thorlabs) their full whisker pad intact, continuously locomoting mice
was positioned directly above the barrel cortex and immersed in saline rhythmically and repeatedly touched an object that was momen-
using a micromanipulator. The thinned region of the skull became invis- tarily (1.5 s) placed near the center of the multiunit spatial recep-
ible/transparent to the eye under saline immersion. Upon hitting the tive field, generating reproducible activity trial to trial (Sofroniew
surface of the brain, the light scattered, covering the entire macrovibrissal
et al., 2014; Pluta et al., 2015, 2017). Neural activity was semiau-
region. Red (617 nm, 8 mW/cm 2) and blue (470 nm) light was triggered
to activate eNpHR3.0 or ChR2, respectively. Red light was delivered as a
tomatically sorted into individual units and classified as pyrami-
square pulse, and blue light was delivered as a linear ramp to minimize dal/RS or putative FS interneurons as previously published (Pluta
synchronized activation and prevent the blockage of spiking that can be et al., 2015, 2017; Reyes-Puerta et al., 2015). To test the functional
caused by strong, prolonged membrane depolarization. impact of L2/3 onto L5, we first selectively expressed an optoge-
Analysis of spiking data. Among all conditions, firing rates were calcu- netic activator, ChR2, in L2/3 excitatory neurons using a Cre-
lated from the window of time corresponding to the optogenetic manip- dependent AAV vector in a L2/3-excitatory neuron-specific
ulation period (750 ms for experiments with red light for eNpHR3.0). Cre-specific driver line (DRD3-Cre; Fig. 1) (Pluta et al., 2015). By
Evoked firing rates were determined by subtracting the firing rate during systematically varying the intensity of light emitted from an op-
the baseline period from the stimulation period, on a trial-by-trial basis. tical fiber (1 mm core) placed directly above (⬍1.5 mm) the
The optogenetic modulation index (OMI) was computed from the
barrel cortex, we were able to generate mean firing rates in L2/3
difference in raw firing rates between the light and control conditions,
divided by their sum as follows:
similar to those generated by active touch (Fig. 1 A, B). Nearly all
(18 of 19) recorded L2/3 excitatory neurons increased their firing
spikes per s 共 light 兲 ⫺ spikes per s 共 control 兲 rate above baseline during the light period (positive OMI; see
OMI ⫽ (1) Materials and Methods), confirming the efficacy of the optoge-
spikes per s 共 light 兲 ⫹ spikes per s 共 control 兲
netic manipulation (Fig. 1C; p ⬍ 0.001, Wilcoxon signed-rank
The sign of optogenetic modulation was computed similarly as the OMI, test, ⫽ 5.9 ⫾ 1.4 spikes s ⫺1). During photostimulation, the
but based on the number of object positions with an OMI increase ⬎ 0.1 trial-to-trial variability of L2/3 firing rate was not consistently
minus the number of object positions with an OMI decrease ⬍ ⫺0.1, different from that evoked by sensory stimulation, as quantified
divided by total number of modulated positions (OMI ⬎ 0.1 or ⬍ ⫺0.1).
by the Fano factor for each isolated unit ( p ⫽ 0.47, n ⫽ 19,
The depth of modulation was calculated as the difference between the
largest and smallest sensory responses, divided by their sums. Wilcoxon signed-rank test).
Spatial selectivity was calculated using a previously published metric Next, we asked whether direct optogenetic drive of L2/3 would
referred to as lifetime sparseness (Rolls and Tovee, 1995; Vinje and Gal- enhance, suppress, or have no impact on the spontaneous activity
lant, 2000), where the responses, r, are the raw firing rate of each neuron of L5. Optogenetically activating L2/3 significantly modulated
divided by the number of stimulus positions, n as follows: the spontaneous firing rate in the majority of L5 units (62%,
Wilcoxon signed-rank test, ␣ ⫽ 0.05). Three example units illus-
冉冘 冊 冘
2
selectivity ⫽ 1 ⫺ r i /n Ⲑ 共 r i2 /n 兲 (2) trate the effects of touch and L2/3 activation on L5 RS units (Fig.
i ⫽ 1, n i ⫽ 1, n
1D). In two of these units, the impact of touch and the impact of
L2/3 activation onto L5 activity were remarkably similar. Overall,
Statistical differences between the control and light groups were deter- 41% of L5 RS units had their spontaneous activity significantly
mined using standard parametric and nonparametric tests. An ␣ level of suppressed by activating L2/3, whereas only half as many (21%)
0.05 was used to determine whether a unit significantly changed its firing were significantly facilitated (Wilcoxon signed-rank test, ␣ ⬍
rate during the optogenetic manipulation period. A two-way ANOVA 0.05; Fig. 1E, pie charts). Notably, practically all of the L5 neurons
was used to test for a change in the firing rates between the control and
that were suppressed by touch were also suppressed by activating
L2/3 deactivation spatial tuning curves, on a unit-by-unit basis. To test
for a significant effect during ChR2 activation, a Wilcoxon signed-rank L2/3, implying that intracortical processing is integral for touch
test was performed on the firing rates between the light and spontaneous suppression in L5. A minority of L5 RS units were touch-
activity periods of each neuron, on a unit-by-unit basis. Population facilitated at their receptive field center but suppressed by L2/3
changes to spatial selectivity indices were tested with a Wilcoxon signed- activation (Fig. 1D, middle, F, bottom right). Across the popula-
rank test. The surround region of the spatial tuning curves refers to tion, the impact of touch and the impact of L2/3 activation were
neighboring positions on both sides of the peak, except in the rare in- significantly correlated (Fig. 1F; p ⬍ 0.001, R 2 ⫽ 0.53, multiple
stance when the peak was at the first or last position. All statistical mea- linear regression).
sures were performed in MATLAB, using the Statistics toolbox.
Trial inclusion criteria and layer boundaries. Trials containing stimula- Optogenetic deactivation of L2/3 primarily facilitates L5
tion periods where the animal’s mean run speed dropped ⬍1.3 SDs of its
Optogenetic activation with ChR2 demonstrates that L2/3 is suf-
population mean were excluded, to ensure consistency in whisking be-
havior across trials. In addition, trials where the SD of an animal’s run ficient to significantly modulate L5, primarily through suppres-
speed during stimulation was ⬎0.8 SDs from the population mean were sion. However, it is critical to test whether endogenous L2/3
excluded. Trials where the animal was simply not running, thresholded activity would have a similar effect by optogenetically deacti-
by the animal’s run speed being ⬍10 cm/s, were completely excluded vating L2/3 activation during sensory stimulation. We deacti-
from the analysis of run speed distributions. On average, 16 ⫾ 1 trials/ vated L2/3 excitatory neurons using the optogenetic silencer,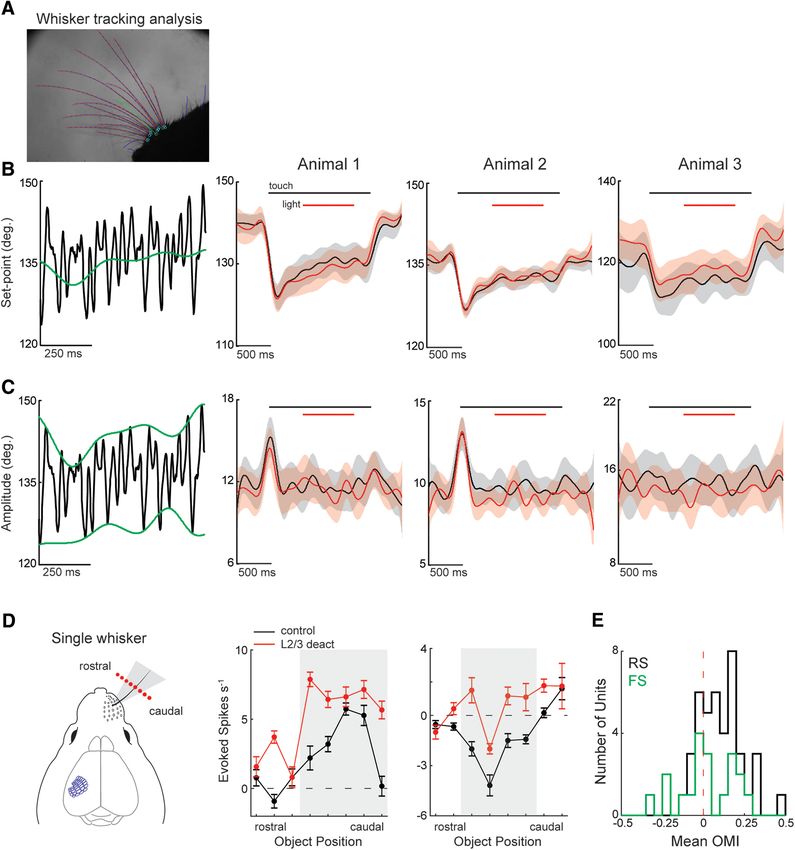
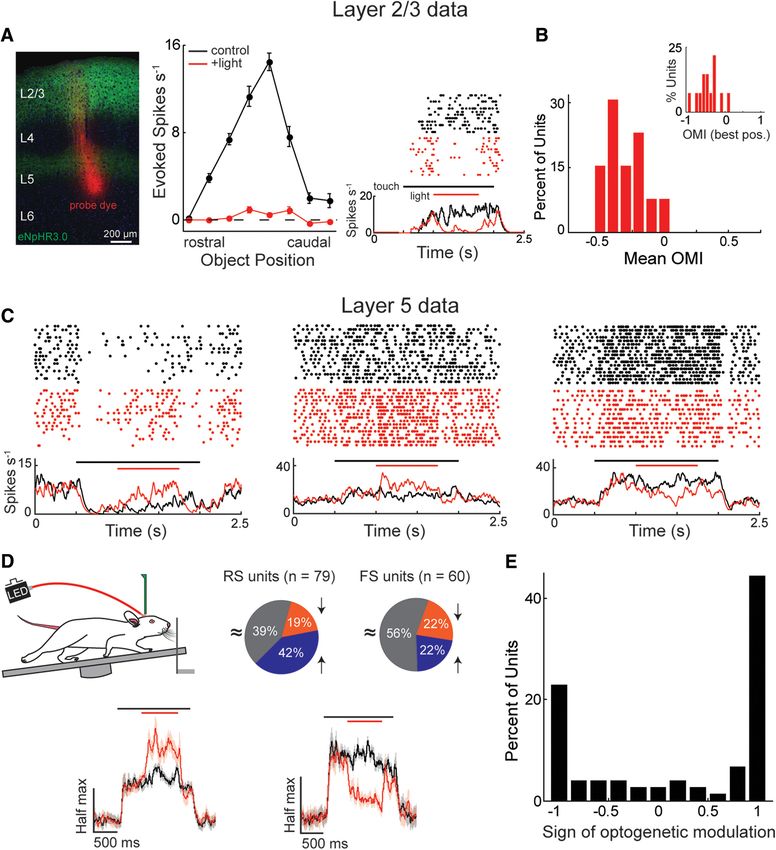
Pluta et al. • Translaminar Suppression Enhances Sensory Coding                                                                                J. Neurosci., March 13, 2019 • 39(11):2052–2064 • 2055

Figure 1. Optogenetic activation of L2/3 predominantly suppresses L5. A, A histological transverse section through the barrel cortex showing L2/3 ChR2 expression with the tdTomato
fluorophore. A putative ChR2-expressing layer 2/3 RS neuron that is driven during active touch and activated by a linear ramp of blue light alone. B, ChR2 activation dose–response curve showing
the relationship between peak light power and firing rate. L5 data were analyzed using 1.3 mW/cm 2 power. C, OMI for the population of L2/3 RS neurons ( p ⬍ 0.001, Wilcoxon signed-rank test,
n ⫽ 19). D, Three example L5 RS neurons that were suppressed by touch or light (left), facilitated by touch but suppressed by light (middle), or facilitated by touch or light (right). E, Top, The
percentage of L5 units that were significantly facilitated (blue), suppressed (orange), or unchanged (gray) by L2/3 activation (Wilcoxon signed-rank test, ␣ ⫽ 0.05). Bottom, Normalized population
firing rates of L5 (RS and FS) units grouped by the sign of the significant effect. Neurons suppressed by light were normalized to the baseline period (left), whereas neurons facilitated by light were
normalized to the light period (right). F, Relationship between touch modulation and optogenetic modulation in L5 units ( p ⬍ 0.001, R 2 ⫽ 0.53, n ⫽ 55, multiple linear regression). Error bars are
the standard error of the mean.

eNpHR3.0, in the same L2/3 Cre-driver line (Fig. 2). We mapped                                        whiskers. We deliberately chose to keep all whiskers intact, even
neuronal receptive fields by placing a vertical bar pseudo-                                           though this makes identifying individual whisker contacts im-
randomly in eight different horizontal locations inside the whisk-                                    practical because it better resembles natural conditions where
ing field, identical to our previous approaches (Pluta et al., 2015,                                  mice typically contact objects with multiple whiskers on each
2017). As we have described previously, in each pole position, the                                    whisk cycle. Our prior experiments in this paradigm demon-
mouse actively contacts the stimulus bar with 2– 4 neighboring                                        strated that the sensory responses of S1 neurons for each pole
2056 • J. Neurosci., March 13, 2019 • 39(11):2052–2064                                                                                   Pluta et al. • Translaminar Suppression Enhances Sensory Coding

Figure 2. L2/3 primarily suppresses touch responses in L5. A, A histological transverse section through the barrel cortex showing L2/3 expression of eNpHR3.0 with a green fluorophore. Example
receptive field, raster, and peristimulus time histogram showing the effect of red light on a L2/3 neuron putatively expressing eNpHR3.0. B, Mean OMI averaged across the 8 object positions for the
L2/3 RS population. Inset, Histogram of OMI for the best stimulus position. C, The impact of L2/3 deactivation on touch-evoked activity in three different L5 units (right). D, Top, The percentage of
L5 units where the response to active touch significantly increased (blue), decreased (orange), or did not change (gray) during L2/3 deactivation (two-way ANOVA, ␣ ⫽ 0.05). Bottom, Normalized
population histograms of L5 (RS and FS) firing rates grouped by the sign of the significant effect. The firing rates of each neuron were normalized to their largest control touch response. E, Histogram
of the sign of optogenetic modulation in L5. Error bars are the standard error of the mean.

position strongly depend on the summed activation of multiple                                          for understanding the receptive field properties of L5. Nonethe-
whiskers (Pluta et al., 2017). Numerous studies in the anesthe-                                        less, information on the exact pattern of contacts across the whis-
tized rodent have demonstrated that multiple different whiskers                                        ker field could enable an understanding of cortical dynamics that
drive L5 neurons (Ito, 1992; Ghazanfar and Nicolelis, 1999;                                            is unfeasible using the current approach.
Shimegi et al., 1999; Manns et al., 2004; Ego-Stengel et al., 2005;                                        Red light illumination (617 nm, 1 mm fiber, 8 mw/cm 2) of the
Ramirez et al., 2014). Therefore, multiwhisker touch is necessary                                      entire barrel cortex produced robust suppression of touch re-
Pluta et al. • Translaminar Suppression Enhances Sensory Coding                                      J. Neurosci., March 13, 2019 • 39(11):2052–2064 • 2057

sponses in nearly all recorded L2/3 RS units across their entire       innervate both parvalbumin (PV ⫹) neurons and SST ⫹ neurons
receptive fields, confirming the efficacy of L2/3 optogenetic sup-     in L2/3 and L5, which themselves can synapse onto L5 somata
pression (Fig. 2 A, B; ⫺63 ⫾ 10% change in mean firing rate, n ⫽       and dendrites, respectively (Reyes et al., 1998; Xiang et al., 2002;
13, p ⬍ 0.01, Wilcoxon signed-rank test). Three example L5 RS          Markram et al., 2004; Otsuka and Kawaguchi, 2009; Apicella et
units (Fig. 2C) illustrate the impact of L2/3 deactivation on touch    al., 2012; Jiang et al., 2015; Naka and Adesnik, 2016). Because
suppression (left) and touch facilitation (middle, right). Overall,    GABAergic PV ⫹ neurons can often be putatively identified in
the touch response in a small fraction (19 ⫾ 7%, 15 of 79 overall,     vivo by their short, FS waveform, we first determined the impact
9 mice) of L5 RS units significantly decreased, whereas in double      of optogenetic manipulations of L2/3 on L5 FS units in vivo (Ce-
the fraction of L5 RS units (40 ⫾ 8%, 33 of 79 overall, 9 mice), it    lio, 1986; Kawaguchi et al., 1987). It is important to note that
significantly increased (two-way ANOVA, ␣ ⫽ 0.05; Fig. 2D, top         ⬃77% of units identified as FS using extracellular waveforms are
row). Overall, L2/3 significantly modulated touch responses in a       PV ⫹, with the remaining probably corresponding to FS PCs or
substantial fraction (61%, 48 of 79) of L5 output neurons.             other types of GABAergic neurons (Moore and Wehr, 2013; Mu-
    Next, we sought to determine the strength of translaminar          ñoz et al., 2014). If FS units are the sole contributors of translami-
modulation in the subset of L5 units that significantly changed        nar inhibition from L2/3 to L5, then one would expect that most
their firing rate during L2/3 deactivation (two-way ANOVA, ␣ ⫽         of the FS units to be facilitated by L2/3, as is the case when opto-
0.05). Averaging firing rates independently for significantly facil-   genetically manipulating L4 (Pluta et al., 2015). However, opto-
itated/suppressed units demonstrates that their optogenetic            genetic manipulation of L2/3 was equally likely to suppress or
modulation was confined to the light period (Fig. 2D, bottom           facilitate L5 FS unit activity (Figs. 1E, 2D). In addition, the me-
row, red line). Among all L5 units displaying a significant increase   dian number of spikes added to or subtracted from an FS neu-
in spiking (n ⫽ 45), firing rates changed by 30 ⫾ 10% at the           ron’s touch response during L2/3 deactivation was equivalent for
receptive field center (Fig. 2D). Among all L5 units showing a         both groups ( p ⫽ 0.33, n ⫽ 13 for both, Wilcoxon ranked-sum
significant decrease in spiking (n ⫽ 28), firing rates changed by      test). Therefore, we next asked whether SST ⫹ neurons might
⫺36 ⫾ 3.5% at the receptive field center (Fig. 2D). Therefore,         mediate feedforward inhibition onto L5 PCs, as has been shown
L2/3 has a substantial impact on touch responses in L5.                in brain slices from the motor cortex (Apicella et al., 2012). Be-
    To describe the consistency of L2/3’s impact on each L5 unit,      cause SST ⫹ neurons cannot be readily identified by their spike
we calculated an index that describes the sign of optogenetic          waveforms in vivo, we asked, in vitro, where they can be positively
modulation across their receptive field (see Materials and Meth-       identified in a specific reporter line, GIN (Oliva et al., 2000) and
ods). A positive index indicates that the firing rate increased dur-   what the impact of L2/3 activation would be on their firing rates.
ing L2/3 deactivation at more object positions than it decreased,      We made intracellular recordings from L5 GIN ⫹ cells while pho-
whereas a negative index indicates the opposite. Most (50 of 73,       toactivating L2/3 with blue light. We found that these SST ⫹ neu-
68%) L5 units had an index of either ⫺1 or 1, indicating that, in      rons were consistently driven to high firing rates, which was
these units, the sign of L2/3’s effect onto L5 was consistent across   explained by strong net synaptic excitatory input (Fig. 4). On the
tactile space (Fig. 2E).                                               other hand, L5 PCs were never driven by photoactivation of L2/3,
    Because optogenetic manipulation of L2/3 could alter the           and approximately half (9 of 16) of putative FS interneurons were
whisking pattern of mice, we tracked the whiskers with a high-         well driven. Together with the well-established fact that L2/3 can
speed camera in a subset of mice and found that optogenetic            also recruit SST ⫹ neurons in L2/3, which may synapse directly
manipulations of L2/3 had no impact on the amplitude or set-           onto L5 PC dendrites (Kapfer et al., 2007), these data suggest that
point of the whisking envelope (Fig. 3A–C). In addition, the vari-     SST ⫹ neurons, in vivo, could influence the functional relation-
ation in whisker kinematics was similar between the control and        ship between L2/3 and L5 PCs.
light conditions, indicating that the reliability of whisking was          To test whether SST ⫹ neurons are critical to the response
unaffected by L2/3 deactivation. We have previously shown that         properties of L5 during active sensation, we deactivated them in
illuminating the brain of mice under identical experimental con-       vivo using eNpHR3.0 in SST-Cre mice. Deactivating SST ⫹ cells
ditions while expressing a fluorescent protein without an opto-        significantly enhanced the firing rates of many L5 RS units during
genetic actuator has no effect on the activity of the somatosensory    active touch (18 of 45, 40%, two-way ANOVA, ␣ ⫽ 0.05), both by
cortex, indicating that light alone does not impact cortical re-       reducing/eliminating touch suppression and by enhancing touch
sponses in S1 (Pluta et al., 2015). To understand whether multi-       facilitation, consistent with a key role in contributing to the sign
whisker touch was necessary for the effects we observed, in 3          and gain of touch responses in L5 (Fig. 5). Nevertheless, this
separate mice, we optogenetically deactivated L2/3 (DRD3-              experiment does not directly test the role of SST ⫹ neurons in the
eNpHR3.0) during touch with only the principal whisker intact          L2/3 to L5 circuit and potentially has off-target effects related to
(Fig. 3 D, E). Similar to our main dataset with the full whisker pad   the disinhibition of touch responses in layers 2– 4. To address
intact, the optogenetic modulation of L5 RS units was primarily        these issues, we asked whether optogenetically deactivating SST ⫹
positive ( p ⬍ 0.001, n ⫽ 41, Wilcoxon signed-rank test), whereas      cells would reduce the ability of L2/3 photostimulation to sup-
activity changes across the L5 FS population were evenly mixed         press L5 and enhance the ability of L2/3 photostimulation to
with no consistent effect ( p ⫽ 0.81, n ⫽ 19, Wilcoxon signed-         facilitate L5. To gain independent optogenetic control of L2/3
rank test).                                                            neurons in SST ⫹ Cre-driver mice, we expressed ChR2 selectively
                                                                       in L2/3 PCs using in utero electroporation (Hakim et al., 2018),
L2/3 recruits SST interneurons to suppress L5 output                   and eNpHR3.0 in SST ⫹ cells by neonatally injecting DIO virus as
What circuits enable L2/3 to suppress touch responses in L5? One       above (Fig. 6A). As a control for this alternative method of ex-
possibility is that feedforward inhibition from L2/3 onto L5 plays     pressing ChR2 in L2/3, we found that optogenetic activation of
a crucial role. Previous work in brain slices demonstrated that        L2/3 primarily suppressed L5 RS unit activity below baseline
activation of L2/3 generates a mixture of excitation and inhibi-       when their firing rates were averaged across the entire photo-
tion in L5 PCs, yet the source of this inhibition remains unknown      stimulation period (49% suppressed and 26% facilitated, Wil-
(Adesnik and Scanziani, 2010). L2/3 neurons monosynaptically           coxon signed-rank test, ␣ ⫽ 0.05), largely agreeing with our viral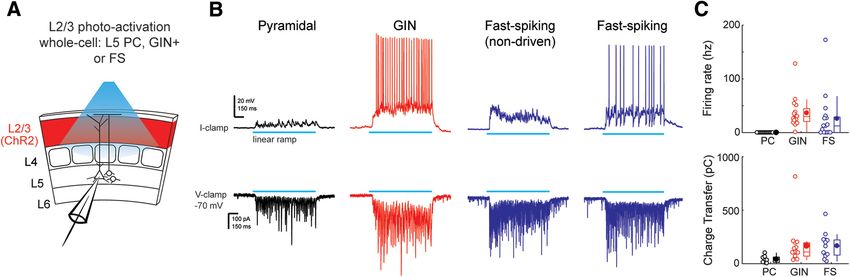
2058 • J. Neurosci., March 13, 2019 • 39(11):2052–2064                                                                                       Pluta et al. • Translaminar Suppression Enhances Sensory Coding

Figure 3. L2/3 deactivationdoesnotchangetheset-pointoramplitudeofwhiskingduringtouch.A,Animagefromtheprocessedwhiskertrackingvideoshowingthetracingofthewhiskers(magenta)and
theirmeanposition(green).B,Left,Diagramillustratinghowwhiskerset-pointwascalculated,whichwasdefinedasthemedianangleofthewhiskingenvelope.Right,Comparisonofwhiskerset-pointduring
touch alone (black) and touch combined with L2/3 deactivation (red) across 3 mice. C, Left, Diagram illustrating how the amplitude of whisker motion was calculated, which was defined as the half-distance
betweenthetopandbottomofthewhiskingenvelope.Right,Comparisonofwhiskamplitudeduringtouchalone(black)andtouchcombinedwithL2/3deactivation(red)acrossthesame3mice.Insomemice,
a brief (⬃200 ms) increase in whisk amplitude occurred at the onset of object presentation but ended before L2/3 deactivation. L2/3 deactivation had no effect on the amplitude or set-point of whisking in any
ofthemice.Alllineplotsindicatemean⫾95%CI.D,Diagramoftheexperimentwithonlytheprincipalwhiskerintact.Withtheprincipalwhiskeralone,touchoccurredonlyatasubsetofobjectpositions(gray).
TwoexampleL5RSneuronsshowthefacilitationoftouchresponsesduringL2/3deactivation(DRD3-NpHR3.0).E,Meanoptogeneticmodulationofactivityintheprincipalwhiskercontactzoneforthepopulation
of RS (n ⫽ 41) and FS (n ⫽ 19) cells from 3 mice. Error in the tuning curves are the standard error of the mean.

expression results using the L2/3 Cre-driver mice. In the sup-                                                An example putative SST ⫹ neuron, identified by its complete
pressed units, we asked whether there was an initial period of                                            suppression during red light, was potently activated during L2/3
facilitation at the very onset of photostimulation, possibly con-                                         photostimulation, implying that L2/3 is capable of strongly facil-
sistent with the reported slow onset of SST ⫹ recruitment; how-                                           itating L5 SST ⫹ neurons in vivo (Fig. 6B). If SST ⫹ neurons are
ever, there was no such effect.                                                                           critical to the connection between L2/3 and L5, then SST ⫹ deac-
Pluta et al. • Translaminar Suppression Enhances Sensory Coding J. Neurosci., March 13, 2019 • 39(11):2052–2064 • 2059
Figure 4. L2/3 drives L5 SST ⫹ interneurons. A, Diagram of the experimental setup. Intracellular recordings were performed on L5 PCs, genetically labeled (GIN ⫹) L5 SST ⫹, or FS interneurons,
whereas L2/3 was activated using ChR2 that was virally expressed using the DRD3-Cre driver. B, Top row, Membrane potential from an example L5 PC (black), a L5 SST ⫹ cell (red), and two L5 FS cells
(blue) during L2/3 activation with a linear ramp of light (blue bar, 1 s duration). Bottom row, Excitatory currents from these same neurons during L2/3 activation with a linear ramp of light. Voltage
was held at ⫺70 mV. C, Comparison of firing rate distributions for these groups of cell types. Bottom, Comparison of excitatory charge transfer between these groups.
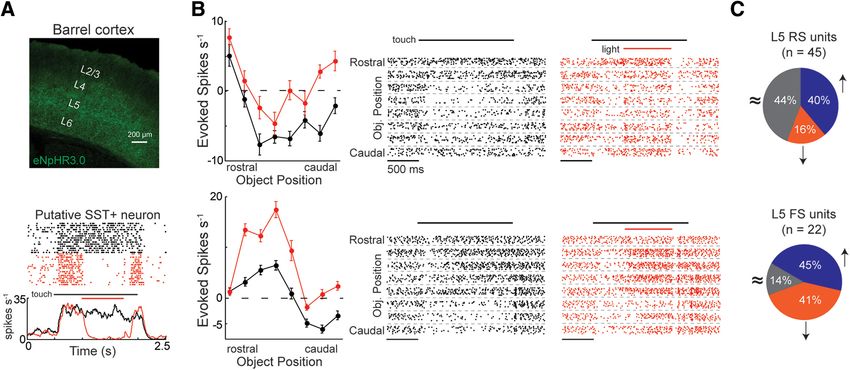
Figure 5. SST ⫹ deactivation facilitates touch responses in L5 RS units. A, Top, Histological transverse section from an SST-cre mouse expressing eNpHR3.0 tagged with a green fluorophore (YFP).
Bottom, Putative SST ⫹ neuron from this mouse that had its activity nearly abolished during the light period. B, Tuning curves and raster plots from two example L5 RS neurons that significantly
increase their firing rate during SST ⫹ deactivation (two-way ANOVA, ␣ ⫽ 0.05). In the raster plots, only the first 10 trials are shown for each condition to simplify visualization. C, The fraction of
L5 neurons that significantly go up (blue), go down (orange), or do not change (gray) during SST ⫹ deactivation (two-way ANOVA, ␣ ⫽ 0.05). Error bars are the standard error of the mean.
tivation combined with L2/3 activation should disinhibit L5 SST ⫹ deactivation when combined with L2/3 activation (Fig.
more than SST ⫹ deactivation does alone. Indeed, as shown in 6F ). This greater disinhibitory effect was also apparent on raw
two example L5 RS units, SST ⫹ inactivation alone (no touch, no firing rates ( p ⬍ 0.001, n ⫽ 91, Wilcoxon signed-rank test). Fur-
blue light) had no significant effect, whereas activating L2/3 alone thermore, this increase in firing rate from SST ⫹ deactivation
caused suppression (top) or facilitation (bottom) (Fig. 6C). combined with L2/3 photoactivation was significantly greater
However, when we superimposed SST ⫹ deactivation onto L2/3 than the linear sum of each component optogenetic response
activation, we observed a prominent disinhibitory effect; and in ( p ⫽ 0.007, n ⫽ 91, Wilcoxon signed-rank test). Together, these
some cases, L2/3-mediated suppression was converted into facil- data argue that L2/3 recruits SST ⫹ inhibition to augment trans-
itation (Fig. 6C, top, D, top left). laminar suppression and moderate translaminar facilitation in
Across the population of L5 putative PCs, SST ⫹ deactivation L5 PCs.
significantly reduced the suppressive effect and enhanced the fa-
cilitative effect of L2/3 activation ( p ⬍ 0.001, n ⫽ 91, Wilcoxon L2/3 enhances the selectivity and range of L5 output
signed-rank test; Fig. 6D). Furthermore, the disinhibitory effects We next sought to address the net impact of L2/3 activity on
(positive OMI) of SST ⫹ deactivation were significantly enhanced sensory coding in L5. To address this question, we analyzed how
by photoactivating L2/3 ( p ⬍ 0.001, n ⫽ 91, Wilcoxon signed- L5 encodes actively scanned space (Fig. 7A). Previous work in the
rank test; Fig. 6E). A population-averaged histogram of normal- barrel cortex and other sensory areas has shown that sensory
ized firing rates demonstrates the greater disinhibitory effect of responses in L5 neurons are heterogeneous, and show a mix of2060 • J. Neurosci., March 13, 2019 • 39(11):2052–2064 Pluta et al. • Translaminar Suppression Enhances Sensory Coding
Figure 6. L2/3’s functional impact onto L5 is partially mediated by SST ⫹ interneurons. A, A histological transverse section through the barrel cortex showing ChR2 expression in tdTomato and eNpHR3.0
expressioninYFP.DIO-eNpHR3.0wasvirallyexpressedinalllayers,whereasChR2wasexpressedonlyinL2/3usinginuteroelectroporation.B,SpikerasterofaputativeSST ⫹ L5interneuronduringspontaneous
periods (black), during L2/3 photoactivation (blue), during SST ⫹ photodeactivation (red), and during both presented simultaneously (magenta). C, As in B, but for two example L5 RS units where optogenetic
deactivation of SST ⫹ neurons removed L2/3-mediated suppression (top) or enhanced L2/3-mediated facilitation (bottom). D, OMI illustrating the effect of L2/3 activation on spontaneous activity versus the
effect of L2/3 activation combined with SST ⫹ deactivation on spontaneous activity. E, OMI scatter plot illustrating the greater disinhibitory effect of SST ⫹ deactivation, whereas L2/3 is photoactivated (p ⬍
0.001, n ⫽ 91, Wilcoxon signed-rank test). F, peristimulus time histograms of mean ⫾ SEM of L5 RS unit firing rates during spontaneous activity and the three forms of optogenetic stimulation. Neurons were
grouped by the sign of the effect of L2/3 activation and normalized as indicated. Error bars are the standard error of the mean.
facilitation and suppression (Krupa et al., 2004; Curtis and Klein- Gallant, 2000; Rolls, 2016). Across the population, spatial selec-
feld, 2009; de Kock and Sakmann, 2009; O’Connor et al., 2010; tivity significantly decreased during L-2/3 deactivation ( p ⫽
Sofroniew et al., 2015; Qi et al., 2016; Takahashi et al., 2016). 0.001, Wilcoxon signed-rank test, n ⫽ 58; Fig. 7C, top). The
Because spontaneous activity in L5 is uniquely high for cortical majority of decreases in spatial selectivity were related to an in-
neurons, it is able to encode sensory stimuli with a decrease in crease in firing rate (Fig. 7C, bottom), with a significantly greater
activity (de Kock and Sakmann, 2009). Consistent with these increase in the surround than at the peak of the tuning curve ( p ⫽
data, we found that the L5 RS unit population displayed a heter- 0.004, n ⫽ 41, Wilcoxon signed-rank test, 1.24 ⫾ 0.44 more
ogeneous mixture of touch facilitation and suppression across spikes s ⫺1). In a small minority of units, spatial selectivity de-
their receptive fields. While some L5 RS units increased their creased due to a decrease in touch facilitation. Thus, descending
firing rate for all object locations in their whisking field, most intracortical input increases stimulus selectivity in L5 primarily
units exhibited rate increases for some object locations and de- by providing net lateral inhibition. Overall, these data argue that
creases for others, which putatively sharpen their representation L2/3 activity functions to accentuate the center of L5 receptive
of space. Because our optogenetic data above show that L2/3 fields.
primarily suppresses L5, we hypothesized that L2/3 sharpens spa- Many L5 neurons possess high baseline firing rates (de Kock
tial tuning in L5. and Sakmann, 2008). To better assess stimulus selectivity in these
Most L5 RS units were significantly tuned to object position neurons, we calculated their slope of activity across tactile space
(73%, 58 of 79, one-way ANOVA), whether they were predomi- (Bala et al., 2003; Seriès et al., 2004; Butts and Goldman, 2006). In
nantly touch-facilitated or touch-suppressed. In most units, an example L5 neuron (Fig. 7D), activity at the trough of the
demonstrated in two example neurons, L2/3 deactivation ele- receptive field preferentially increased during L2/3 deactivation.
vated firing rates, often reducing touch suppression (Fig. 7B). To To calculate the slope of activity during control stimulation, fir-
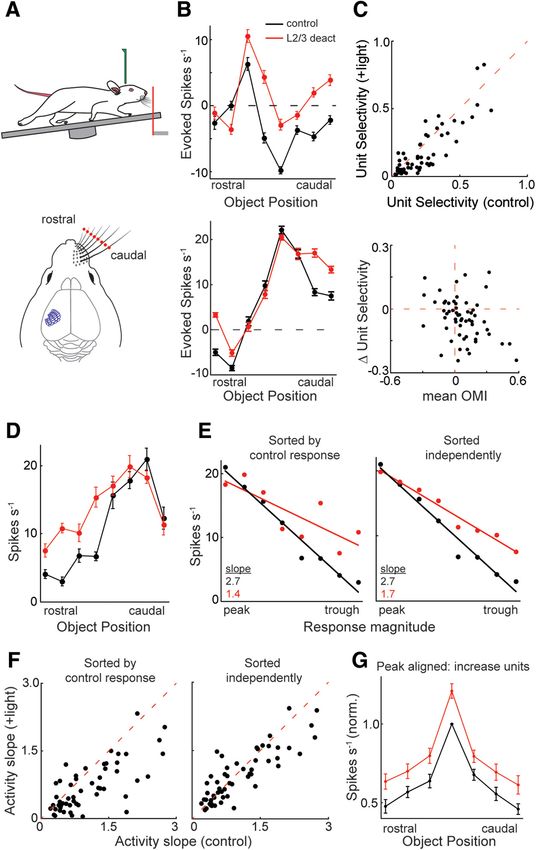
determine the effect of L2/3 deactivation on the spatial selectivity ing rates for each unit were sorted into descending order and fit
of each unit, we used a metric that quantifies the uniqueness of with a simple linear regression (Fig. 7E). Activity slopes during
the peak in a tuning curve (Rolls and Tovee, 1995; Vinje and L2/3 deactivation were evaluated using two methods of sorting:Pluta et al. • Translaminar Suppression Enhances Sensory Coding J. Neurosci., March 13, 2019 • 39(11):2052–2064 • 2061
duced during L2/3 deactivation when
sorted according to the control response
(Fig. 7F; p ⬍ 0.001, n ⫽ 58, Wilcoxon
signed-rank test) and was more moder-
ately reduced when sorted independently
(Fig. 7F; p ⫽ 0.02, n ⫽ 58, Wilcoxon
signed-rank test). In addition, the depth
of modulation between the peak and
trough of the receptive field significantly
decreased during L2/3 deactivation ( p ⬍
0.001, n ⫽ 58, Wilcoxon signed-rank
test). Therefore, L2/3 deactivation dra-
matically disrupts the shape of receptive
fields in L5 and contracts their relative
range of activity. However, the absolute
range of firing rate (max ⫺ min) did not
significantly change as a population ( p ⫽
0.27, n ⫽ 58, Wilcoxon signed-rank test),
indicating that selectivity changes in many
units were additive across space, as visual-
ized by the population averaged and peak-
aligned tuning curves (Fig. 7G). The
decrease in spatial selectivity seems un-
likely to be explained by a complementary
change in the spatial tuning of L5 FS neu-
rons, as is true when optogenetically sup-
pressing L4 (Pluta et al., 2015), because
there was no consistent effect on their
stimulus selectivity (Fig. 8; p ⫽ 1.0, n ⫽
40, Wilcoxon signed-rank test).
Discussion
The data presented here demonstrate that
L2/3 has a significant impact on neural
activity in L5. Contrary to the conven-
tional notion, the net impact of L2/3 ac-
tivity on the plurality of L5 neurons was
suppression. During optogenetic stimula-
tion of L2/3, nearly twice as many L5
units were suppressed as were facilitated.
Conversely, during natural sensory stim-
ulation, optogenetic suppression of L2/3
facilitated twice as many L5 neurons as
it suppressed. Optogenetic activation ex-
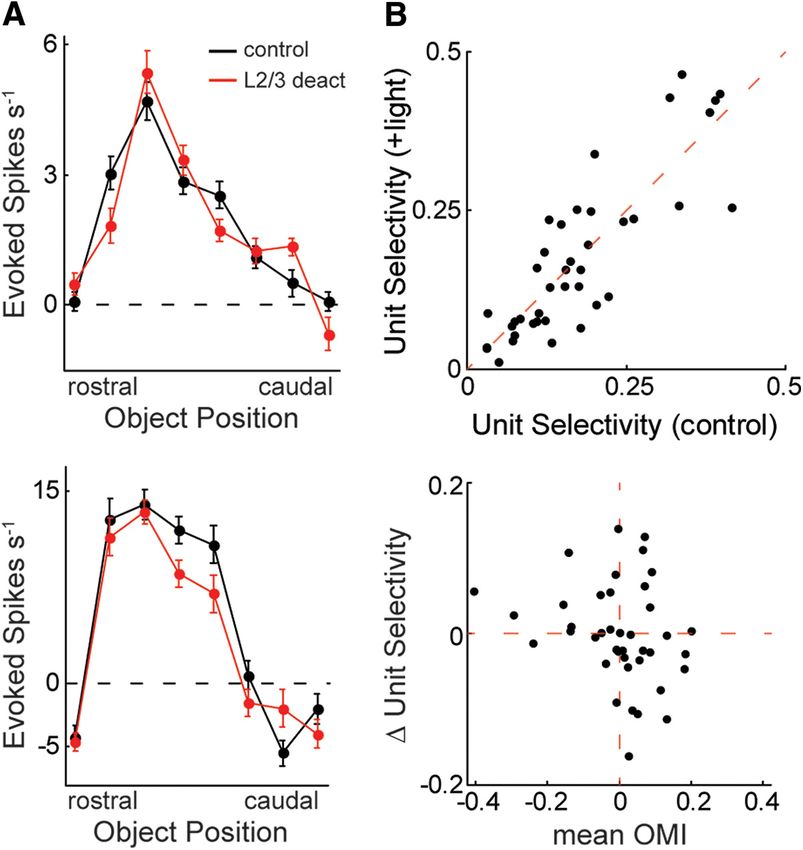
Figure 7. L2/3 increases the selectivity and range of L5 RS receptive fields. A, Experimental set-up: head-fixed, running mice periments must be interpreted with
with their whisker pad intact palpated an object that was placed at eight different locations within their whisking field. B, Spatial caution, as ChR2-mediated photostimu-
tuning curves and rasters of two L5 RS neurons. Note the loss of touch suppression and the greater increase in spike rate in the lation inherently generates nonphysi-
surround regions of their receptive fields. C, Scatter plot comparing the stimulus selectivity of L5 RS units during control stimulation ological patterns of activity in the
versus L2/3 deactivation (top, ⫹light). L2/3 deactivation significantly reduces stimulus selectivity ( p ⫽ 0.001, n ⫽ 58, Wilcoxon stimulated population. However, our data
signed-rank test). Scatter plot of the L5 RS population comparing the mean OMI to the change in unit selectivity (bottom). D, with optogenetic suppression of L2/3 sen-
Example L5 RS neuron with a tuning peak at the caudal region of the whisker field and a trough at the rostral region. E, The activity sory responses, which show nearly the op-
slopes of the example unit in D. Slopeswerecalculatedaftersortingindescendingorderrelativetothemagnitudeofthecontrolresponse posite effects of activation, support this
(left) or sorting independently for both control and L2/3 deactivation conditions (right). F, Scatter plots of the L5 RS population comparing conclusion. Moreover, in our ChR2 ex-
the activity slopes during control stimulation versus L2/3 deactivation. L2/3 deactivation significantly reduced the steepness of the slope
periments, we attempted to generate fir-
(p ⬍ 0.0001: left; p ⫽ 0.02: right, Wilcoxon signed-rank test, n ⫽ 58). G, Mean ⫾ SEM tuning curves of the population of L5 RS neurons
that displayed an increase in activity during L2/3 deactivation (n ⫽ 41). Firing rates in each condition were aligned to their own peak and ing rates in L2/3 neurons that were
normalized to the largest control response. Error bars are the standard error of the mean. comparable with those observed during
active touch, and we stress that our ramp-
light stimuli avoided the extreme levels of
(1) same order as the control firing rates and (2) independent hyper-synchronization of ChR2-expressing
descending order (Fig. 7E). Sorting both conditions by the con- neurons one may obtain during brief, high intensity pulses of light.
trol firing rates evaluates changes to receptive field shape, Importantly, the translaminar suppression from L2/3 to L5
whereas independent sorting evaluates the total range of activity. sharpened the representation of space in L5 pyramidal neurons
Across the population, the activity slope was dramatically re- by preferentially acting at nonpreferred spatial locations. SST ⫹2062 • J. Neurosci., March 13, 2019 • 39(11):2052–2064 Pluta et al. • Translaminar Suppression Enhances Sensory Coding
interneurons likely play an important role
in mediating these effects. It should be
noted that the extracellular recording
methods used in this study may bias the
detection of units with firing rates higher
than the mean of the true underlying dis-
tribution. However, because higher firing
rate neurons are the most effective at re-
cruiting polysynaptic inhibition through
SST ⫹ neurons (Kapfer et al., 2007; Silber-
berg and Markram, 2007; Berger et al.,
2010), the units we did observe are likely
to be among the most impactful in the
circuit.
Our data also support the notion that
much of the activating drive to L5 during
touch must come from sources beyond
L2/3 PCs. Many of the L5 neurons that
were suppressed by L2/3 were facilitated
by touch in a restricted portion of tactile
space. These neurons may broadly
integrate translaminar suppression in
combination with a different source of fa-
cilitating input, possibly directly from the
thalamus (Constantinople and Bruno,
2013). The relative strength and breadth
of these opposing inputs (e.g., thalamus vs
L2/3) may determine the size and shape of
spatial receptive fields, which are consid-
erably diverse in the cortex (Gilbert, 1977; Figure 8. L2/3 does not consistently alter the spatial selectivity of L5 FS units. A, Spatial tuning curves from two L5 FS neurons
Manns et al., 2004; Runyan et al., 2010; during control stimulation and L2/3 deactivation. B, Scatter plot comparing the selectivity of L5 FS neurons during control stimu-
Pluta et al., 2017). By using intracortical lation and L2/3 deactivation ( p ⫽ 1.0, Wilcoxon signed-rank test, n ⫽ 40, top). Scatter plot relating the change in mean OMI to the
change in unit selectivity during L2/3 deactivation (bottom). Error bars are the standard error of the mean.
inhibition to balance ascending thalamic
and descending intracortical excitation,
PV ⫹ interneurons as the primary mediator of L2/3’s suppression
L5 receptive fields can be dynamically shaped, possibly based on
of L5. In our previous publication, using identical techniques, we
behavioral demands (Polack et al., 2013).
Multiple circuit models could explain our data. First, much of showed that L4 suppresses L5 by facilitating the vast majority of
the effects could depend on horizontally arborizing axons of L2/3 FS/PV ⫹ interneurons (Pluta et al., 2015). In contrast, the current
within L5 (Feldmeyer, 2012), which may recruit lateral inhibition study reveals that L2/3 suppresses as many FS units as it facili-
⫹ ⫹
via SST neurons. SST neurons can also integrate recurrent tates, with no net change in activity across the population. Nota-
input directly from L5 neurons (Silberberg and Markram, 2007). bly, not all FS units are PV ⫹, with a small minority corresponding
Horizontal circuits within L2/3, such as local recruitment of to excitatory neurons and others possibly thin-spiking SST ⫹
⫹
SST neurons that synapse onto L5 dendrites, could also con- neurons (Moore and Wehr, 2013; Muñoz et al., 2014). Future
tribute to the suppression of L5. Finally, circuits residing within research identifying functionally connected translaminar neuro-
the same column as the recorded L5 neurons could be vital. Dis- nal ensembles could help clarify the heterogeneous effects we
tinguishing among these possibilities will require future work observed.
that uses techniques, such as spatially precise two-photon opto- In some L5 units (⬃40%), we observed no significant change
genetics, to activate or inactivate identified cortical neurons in in firing rate while manipulating L2/3. This result is expected
discrete sets of whisker columns (Mardinly et al., 2018). given that different subtypes of L5 neurons integrate divergent
Both our in vivo and in vitro data in the barrel cortex indicate streams of input, sometimes preferentially from either subcorti-
⫹ cal or long-range cortical areas (Wright and Fox, 2010; Mao et al.,
that L2/3 recruits inhibition via SST interneurons to suppress
L5, conceptually consistent with in vitro brain slice data from the 2011; Joshi et al., 2015; Kim et al., 2015; Kinnischtzke et al., 2016).
motor and visual cortices (Apicella et al., 2012; Jiang et al., 2015). Technological innovations that combine trans-synaptic labeling
Although we do not provide direct evidence that L2/3 pyramidal of projection neurons, multiphoton imaging of deep tissue, and
⫹ layer-specific optogenetic manipulations could determine whether
neurons monosynaptically recruit L5 SST neurons to suppress
L5 pyramidal neurons in the barrel cortex, the synaptic connec- long-range connectivity patterns predict functional relationships
tions making this possible have been observed in brain slices of within the intracortical microcircuit.
the frontal cortex (Otsuka and Kawaguchi, 2009). Although these Layer 5 PCs fire action potentials at high rates in the absence of
data implicate SST ⫹ in translaminar integration, their functional external stimuli, distinct from the sparse activity patterns found
role of enhancing translaminar suppression and moderating in layers 2– 4 (Simons and Carvell, 1989; Brecht and Sakmann,
translaminar facilitation was previously unknown. Future re- 2002; Kerr et al., 2007; Jadhav et al., 2009; Crochet et al., 2011;
search is needed to delineate the laminar distribution of L2/3- Barth and Poulet, 2012; Hires et al., 2015). While the precise
mediated SST ⫹ inhibition onto L5. Our data argue against FS/ advantage of maintaining such high ongoing firing rates remainsPluta et al. • Translaminar Suppression Enhances Sensory Coding J. Neurosci., March 13, 2019 • 39(11):2052–2064 • 2063
a mystery, this feature is essential for enabling sensory suppres- Crochet S, Poulet JF, Kremer Y, Petersen CC (2011) Synaptic mechanisms
sion to enhance stimulus selectivity and expand dynamic range, underlying sparse coding of active touch. Neuron 69:1160 –1175.
Curtis JC, Kleinfeld D (2009) Phase-to-rate transformations encode touch
both within single units and across a sensory map (Tantirigama et
in cortical neurons of a scanning sensorimotor system. Nat Neurosci
al., 2017). Our results are the first to demonstrate that L2/3 activ- 12:492–501.
ity is important for this unique form of sensory coding in L5. de Kock CP, Sakmann B (2008) High frequency action potential bursts
Experimental manipulations testing the causal relationship (⬎ or ⫽ 100 Hz) in L2/3 and L5B thick tufted neurons in anaesthetized
between cortical layers have traditionally been very challenging and awake rat primary somatosensory cortex. J Physiol 586:3353–3364.
and have only recently become tenable with modern optogenetic de Kock CP, Sakmann B (2009) Spiking in primary somatosensory cortex
techniques (Olsen et al., 2012; Pluta et al., 2015; Guo et al., 2017). during natural whisking in awake head-restrained rats is cell-type specific.
Proc Natl Acad Sci U S A 106:16446 –16450.
The previous study to causally test the impact of L2/3 on sensory
Ego-Stengel V, Mello e Souza T, Jacob V, Shulz DE (2005) Spatiotemporal
responses L5, albeit using cryogenic deactivation, found little to characteristics of neuronal sensory integration in the barrel cortex of the
no effect on the firing rate or temporal pattern of activity rat. J Neurophysiol 93:1450 –1467.
(Schwark et al., 1986), although this was conducted in the anes- Feldmeyer D (2012) Excitatory neuronal connectivity in the barrel cortex.
thetized cat. In the present study, we focused on activity during Front. Neuroanat 6:24.
alert, actively sensing conditions, where many neurons in L2/3 of Ghazanfar AA, Nicolelis MA (1999) Spatiotemporal properties of layer V
the somatosensory cortex are highly responsive to touch (Pluta et neurons of the rat primary somatosensory cortex. Cereb Cortex
9:348 –361.
al., 2017). The disinhibitory effects we observed during L2/3 de-
Gilbert CD (1977) Laminar differences in receptive field properties of cells
activation could be obscured by anesthesia, which greatly alters in cat primary visual cortex. J Physiol 268:391– 421.
interneuron and spontaneous activity (Armstrong-James and Guo W, Clause AR, Barth-Maron A, Polley DB (2017) A corticothalamic
George, 1988; de Kock and Sakmann, 2008; Adesnik et al., 2012; circuit for dynamic switching between feature detection and discrimina-
Sellers et al., 2013; McGinley et al., 2015; Muñoz et al., 2017). tion. Neuron 95:180 –194.e5.
Overall, our data support what emerges as a surprising prin- Hakim R, Shamardani K, Adesnik H (2018) A neural circuit for gamma-
ciple of cortical dynamics: the net impact of both superficial lay- band coherence across the retinotopic map in mouse visual cortex. Elife
7:e29569.
ers on L5 is primarily suppression, rather than facilitation. This
Hill DN, Mehta SB, Kleinfeld D (2011) Quality metrics to accompany spike
translaminar suppression sharpens stimulus representations in sorting of extracellular signals. J Neurosci 31:8699 – 8705.
L5, but through different translaminar inhibitory mechanisms: Hires SA, Gutnisky DA, Yu J, O’Connor DH, Svoboda K (2015) Low-noise
L4 relies primarily on L5 FS/PV ⫹ neurons, whereas L2/3, at least encoding of active touch by layer 4 in the somatosensory cortex. Elife 4.
in part, depends on SST ⫹ neurons. Together, these data highlight Hooks BM, Hires SA, Zhang YX, Huber D, Petreanu L, Svoboda K, Shepherd
the importance of translaminar inhibitory circuits in dynamically GM (2011) Laminar analysis of excitatory local circuits in vibrissal mo-
controlling the sign and spread of cortical activity in the primary tor and sensory cortical areas. PLoS Biol. 9:e1000572.
Ito M (1992) Simultaneous visualization of cortical barrels and horseradish
output layer.
peroxidase-injected layer 5b vibrissa neurones in the rat. J Physiol 454:
247–265.
Jadhav SP, Wolfe J, Feldman DE (2009) Sparse temporal coding of elemen-
References tary tactile features during active whisker sensation. Nat Neurosci 12:792–
Adesnik H, Scanziani M (2010) Lateral competition for cortical space
by layer-specific horizontal circuits. Nature 464:1155–1160. 800.
Adesnik H, Bruns W, Taniguchi H, Huang ZJ, Scanziani M (2012) A neural Jiang X, Shen S, Cadwell CR, Berens P, Sinz F, Ecker AS, Patel S, Tolias AS
circuit for spatial summation in visual cortex. Nature 490:226 –231. (2015) Principles of connectivity among morphologically defined cell
Apicella AJ, Wickersham IR, Seung HS, Shepherd GM (2012) Laminarly types in adult neocortex. Science 350:aac9462.
orthogonal excitation of fast-spiking and low-threshold-spiking in- Joshi A, Middleton JW, Anderson CT, Borges K, Suter BA, Shepherd GM,
terneurons in mouse motor cortex. J Neurosci 32:7021–7033. Tzounopoulos T (2015) Cell-specific activity-dependent fractionation
Armstrong-James M, George MJ (1988) Influence of anesthesia on sponta- of layer 2/3¡5B excitatory signaling in mouse auditory cortex. J Neurosci
neous activity and receptive field size of single units in rat Sm1 neocortex. 35:3112–3123.
Exp Neurol 99:369 –387. Kapfer C, Glickfeld LL, Atallah BV, Scanziani M (2007) Supralinear increase
Armstrong-James M, Fox K, Das-Gupta A (1992) Flow of excitation within of recurrent inhibition during sparse activity in the somatosensory cortex.
rat barrel cortex on striking a single vibrissa. J Neurophysiol 68:1345– Nat Neurosci 10:743–753.
1358. Kawaguchi Y, Katsumaru H, Kosaka T, Heizmann CW, Hama K (1987) Fast
Bala AD, Spitzer MW, Takahashi TT (2003) Prediction of auditory spatial spiking cells in rat hippocampus (CA1 region) contain the calcium-
acuity from neural images on the owl’s auditory space map. Nature 424: binding protein parvalbumin. Brain Res 416:369 –374.
771–774. Kerr JN, de Kock CP, Greenberg DS, Bruno RM, Sakmann B, Helmchen F
Barth AL, Poulet JF (2012) Experimental evidence for sparse firing in the (2007) Spatial organization of neuronal population responses in layer
neocortex. Trends Neurosci 35:345–355. 2/3 of rat barrel cortex. J Neurosci 27:13316 –13328.
Berger TK, Silberberg G, Perin R, Markram H (2010) Brief bursts self- Kim EJ, Juavinett AL, Kyubwa EM, Jacobs MW, Callaway EM (2015) Three
inhibit and correlate the pyramidal network. PLoS Biol 8:e1000473. types of cortical layer 5 neurons that differ in brain-wide connectivity and
Brecht M, Sakmann B (2002) Dynamic representation of whisker deflection function. Neuron 88:1253–1267.
by synaptic potentials in spiny stellate and pyramidal cells in the barrels Kinnischtzke AK, Fanselow EE, Simons DJ (2016) Target-specific M1 in-
and septa of layer 4 rat somatosensory cortex. J Physiol 543:49 –70. puts to infragranular S1 pyramidal neurons. J Neurophysiol 116:1261–
Butts DA, Goldman MS (2006) Tuning curves, neuronal variability, and 1274.
sensory coding. PLoS Biol 4:639 – 646. Krupa DJ, Wiest MC, Shuler MG, Laubach M, Nicolelis MA (2004) Layer-
Celio MR (1986) Parvalbumin in most gamma-aminobutyric acid- specific somatosensory cortical activation during active tactile discrimi-
containing neurons of the rat cerebral cortex. Science 231:995–997. nation. Science 304:1989 –1992.
Clack NG, O’Connor DH, Huber D, Petreanu L, Hires A, Peron S, Svoboda K, Lefort S, Tomm C, Floyd Sarria JC, Petersen CC (2009) The excitatory neu-
Myers EW (2012) Automated tracking of whiskers in videos of head ronal network of the C2 barrel column in mouse primary somatosensory
fixed rodents. PLoS Comput Biol 8:e1002591. cortex. Neuron 61:301–316.
Constantinople CM, Bruno RM (2011) Effects and mechanisms of wakeful- Manns ID, Sakmann B, Brecht M (2004) Sub- and suprathreshold receptive
ness on local cortical networks. Neuron 69:1061–1068. field properties of pyramidal neurones in layers 5A and 5B of rat somato-
Constantinople CM, Bruno RM (2013) Deep cortical layers are activated sensory barrel cortex. J Physiol 556:601– 622.
directly by thalamus. Science 340:1591–1594. Mao T, Kusefoglu D, Hooks BM, Huber D, Petreanu L, Svoboda K (2011)You can also read