Dynamic Reconfiguration, Fragmentation, and Integration of Whole-Brain Modular Structure across Depths of Unconsciousness
←
→
Page content transcription
If your browser does not render page correctly, please read the page content below
Cerebral Cortex, October 2020;30: 5229–5241

                                                                              doi: 10.1093/cercor/bhaa085
                                                                              Advance Access Publication Date: 29 May 2020
                                                                              Original Article

ORIGINAL ARTICLE

Dynamic Reconfiguration, Fragmentation, and

                                                                                                                                                  Downloaded from https://academic.oup.com/cercor/article/30/10/5229/5848434 by guest on 28 October 2020
Integration of Whole-Brain Modular Structure across
Depths of Unconsciousness
Dominic Standage 1 , Corson N. Areshenkoff2,3 , Joseph Y. Nashed2 ,
R. Matthew Hutchison4 , Melina Hutchison5 , Dietmar Heinke1 ,
Ravi S. Menon6 , Stefan Everling6,7 and Jason P. Gallivan 2,3,8
1 Schoolof Psychology, University of Birmingham, B15 2TT, Birmingham, UK, 2 Centre for Neuroscience Studies,
Queen’s University, Kingston, K7L 3N6, Ontario, Canada, 3 Department of Psychology, Queen’s University,
Kingston, K7L 3N6, Ontario, Canada, 4 Biogen, Cambridge, 02142, MA, USA, 5 Massachusetts Eye and Ear
Infirmary, Boston, 02114, MA, USA, 6 Robarts Research Institute, University of Western Ontario, London, N6G
2V4, Ontario, Canada, 7 Department of Physiology and Pharmacology, University of Western Ontario, N6A 5C1,
London, Ontario, Canada and 8 Department of Biomedical and Molecular Sciences, Queen’s University, K7L
3N6, Kingston, Ontario, Canada
Address correspondence to Dominic Standage, School of Psychology, University of Birmingham, Birmingham, UK. Email: d.standage@bham.ac.uk and
Jason Gallivan, Centre for Neuroscience Studies, Queen’s University, Kingston, Ontario, Canada. Email: gallivan@queensu.ca.

Abstract
General anesthetics are routinely used to induce unconsciousness, and much is known about their effects on receptor
function and single neuron activity. Much less is known about how these local effects are manifest at the whole-brain level
nor how they inf luence network dynamics, especially past the point of induced unconsciousness. Using resting-state
functional magnetic resonance imaging (fMRI) with nonhuman primates, we investigated the dose-dependent effects of
anesthesia on whole-brain temporal modular structure, following loss of consciousness. We found that higher isof lurane
dose was associated with an increase in both the number and isolation of whole-brain modules, as well as an increase in
the uncoordinated movement of brain regions between those modules. Conversely, we found that higher dose was
associated with a decrease in the cohesive movement of brain regions between modules, as well as a decrease in the
proportion of modules in which brain regions participated. Moreover, higher dose was associated with a decrease in the
overall integrity of networks derived from the temporal modules, with the exception of a single, sensory-motor network.
Together, these findings suggest that anesthesia-induced unconsciousness results from the hierarchical fragmentation of
dynamic whole-brain network structure, leading to the discoordination of temporal interactions between cortical modules.
Key words: anesthesia, connectivity, consciousness, isof lurane, resting-state functional MRI, unconsciousnesswhole-brain
dynamics

Introduction                                                                  chologists, and clinicians alike. This fascination not only stems
Consciousness is the state of wakefulness and awareness char-                 from the broad implications of consciousness for understanding
acterized by the ability to receive and respond to sensory stimuli,           human conscious experience but also because disruptions in
and its biological basis has long fascinated neuroscientists, psy-            consciousness are a hallmark of both pathological (neurology)

© The Author(s) 2020. Published by Oxford University Press. All rights reserved. For permissions, please e-mail: journals.permissions@oup.com
5230      Cerebral Cortex, 2020, Vol. 30, No. 10

and naturally occurring physiological states (sleep) and are often    whole-brain computation requires time-resolved methods for
purposefully induced in clinical treatment (anesthesiology). In       network analysis (Medaglia et al. 2015; Bassett and Sporns 2017).
this regard, the neuroscientific investigation of consciousness           In the study of unconsciousness, changes in the repertoire
has been greatly advanced in recent decades by the study of the       of whole-brain states derived from functional networks
unconscious state. Considerable work now focuses on changes           constructed over short timescales (e.g., 30 s—1.5 min) have
in brain states that accompany normal and pathological                been shown to correlate with anesthetic dose (Hutchison
conditions like sleep and coma, respectively (Mashour and             et al. 2014; Barttfeld et al. 2015; Hudetz et al. 2015; Uhrig
Hudetz 2018). Likewise, the pharmacological induction and             et al. 2018). Specifically, it has been reported that the number
reversible manipulation of consciousness by general anesthesia        of discriminable brain states decreases at deeper levels of
has proven to be a highly productive line of investigation. While     unconsciousness, consistent with predictions by integrated
much of this latter work has focused on the cellular effects of       information theory (Tononi et al. 2016). Together with static
anesthetics (Anis et al. 1983; Peduto et al. 1991; Wu et al. 1996),   FC analyses demonstrating the fragmentation of networks
it remains poorly understood how these local effects manifest         during unconsciousness (Achard et al. 2012; Boly et al. 2012;
as unconsciousness at the large-scale, global level (Franks 2006;     Spoormaker et al. 2012; Monti et al. 2013; Hutchison et al.

                                                                                                                                           Downloaded from https://academic.oup.com/cercor/article/30/10/5229/5848434 by guest on 28 October 2020
Alkire et al. 2008; Brown et al. 2011).                               2014), this finding implies that the temporal dynamics of
    According to integrated information theory (Tononi 2004),         network modularity may be highly informative. Modularity
consciousness is linked to the ability to integrate information       refers to the degree to which networks can be decomposed
both locally and between widely distributed brain areas. Infor-       into groups of nodes (brain regions), with dense connectivity
mation integration is also a fundamental principle of global neu-     within these groups and sparse connectivity between them
ronal workspace theory (Dehaene et al. 2014), which posits criti-     (formally quantifying fragmentation) (Sporns and Betzel 2016).
cal roles for long-distance interactions between brain regions in     Modular structure has long been recognized as a crucial
prefrontal, parietal, and cingulate cortex during general aware-      property of complex biological systems, conferring functional
ness. These theories suggest that general anesthetics impair          specialization and robustness to change (including damage)
functional interactions across remote brain areas, causing the        (Kirschner and Gerhart 1998; Kashtan and Alon 2005; Wagner
fragmentation of whole-brain networks (Mashour and Hudetz             2005). Analyses of task-based changes to modular structure
2018). Integrated information theory further posits that con-         have been highly productive in recent studies of the whole-
sciousness is not a fixed state per se but is graded in nature,       brain bases of motor skill acquisition (Bassett et al. 2011, 2015)
decreasing proportionately with the number of discriminable           and cognitive performance (Braun et al. 2015), but to the best of
brain states (Tononi et al. 2016). This gradient further suggests     our knowledge, no studies have leveraged these methods in the
that interactions between brain networks (and consequently            study of unconsciousness (see the Discussion for a summary of
information integration) diminish beyond the initial threshold        earlier studies using static measures of modularity).
of unconsciousness (light sedation), with greater fragmentation           We examined the dose-dependent effects of isoflurane on
occurring at deeper levels of sedation. Thus, investigation of the    the temporal modular structure of whole-brain networks in
dose-dependent effects of anesthesia on whole-brain networks          nonhuman primates, following induction of unconsciousness.
not only quantifies the effects of sedation on the global proper-     We tested three principal hypotheses. First, we sought to deter-
ties of neural processing but also serves to characterize the very    mine whether, under our time-resolved approach, there would
nature of unconsciousness.                                            be greater fragmentation of whole-brain networks at increased
    In recent years, resting-state functional MRI (rs-fMRI) has       levels of isoflurane dose. Thus, we tested the hypothesis that the
provided tremendous insight into the large-scale, network-level       number of temporal modules, and their degree of modularity,
effects of anesthesia. rs-fMRI measures statistical dependen-         will increase with isoflurane dose. Second, we reasoned that if
cies between the slow-wave blood oxygenation level-dependent          the strength of connectivity within brain networks decreases
(BOLD) signal in distinct brain regions in the absence of any task    with increasing dose (e.g. Boveroux et al. 2010; Guldenmund et al.
paradigm (Biswal et al. 1995). These spontaneous, low-frequency       2013), then smaller perturbations (e.g., background noise) may
fluctuations (0.01–0.1 Hz) of the BOLD signal have been shown         be sufficient to drive small, random network reconfigurations,
to reflect underlying changes in neural activity, where correla-      leading to uncoordinated changes in modular membership. We
tions in the BOLD signal between areas (i.e., FC) correspond to       therefore quantified the degree to which brain regions move
known patterns of whole-brain connectivity in multiple species        between modules in a coordinated (and uncoordinated) manner
(Fox and Raichle 2007; Vincent et al. 2007; Shmuel and Leopold        at different levels of dose. Third, we sought to determine the
2008; Hutchison and Everling 2012; Hutchison et al. 2012, 2015;       extent to which dynamic whole-brain structure would break
Leopold and Maier 2012). Initially, the effects of anesthesia on      down in a spatially uniform versus selective manner at deeper
FC were largely focused on activity within selected networks          levels of unconsciousness. Thus, we derived networks from
of areas and were assessed by constructing static functional          the temporal modules and tested the null hypothesis that the
networks from full scans (Vincent et al. 2007; Boveroux et al.        strength of interactions within and between those networks
2010; Deshpande et al. 2010; Liu et al. 2011, 2013). Over these       would decrease in a uniform fashion across networks with
longer timescales (i.e., a full-length resting-state scan), func-     increasing isoflurane dose.
tional networks may appear similar during levels of wakefulness
and anesthesia (Barttfeld et al. 2015), since static measurements
of FC may largely recapitulate the underlying anatomical map
                                                                      Materials and Methods
(Honey et al. 2009; Hermundstad et al. 2013). There is a growing      To examine the effects of general anesthesia on whole-brain
appreciation, however, that functional networks are temporally        temporal modular structure following the induction of uncon-
dynamic (Chang and Glover 2010; Bassett et al. 2011; Hutchison,       sciousness, we collected rs-fMRI data from five nonhuman pri-
Womelsdorf, Allen, et al. 2013a; Hutchison, Womelsdorf, Gati,         mates at increasing levels of isoflurane dose at 7-T MRI. To
et al. 2013b; Allen et al. 2014) and that an understanding of         examine the incremental, dose-dependent effects of isoflurane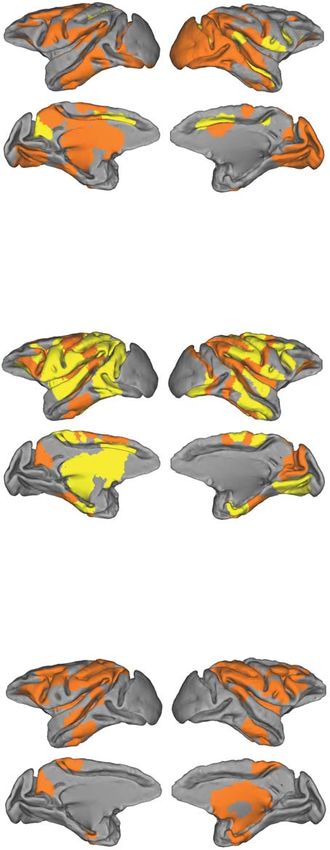
Brain Dynamics Across Depths of Unconsciousness         Standage et al.        5231

on temporal module dynamics, we administered isoflurane in           respiration, and end-tidal CO2 ) to ensure that values were within
six stepwise increments: 1.00%, 1.25%, 1.50%, 1.75%, 2.00%, and      normal limits (see Supplementary Figure 1 in Hutchison et al.,
2.75% (see Fig. 1A for an overview of our approach). We ter-         2014). The acquisitions of two anatomical images occurred
minated the session for one monkey that experienced abnor-           during the stabilization periods between isoflurane dose levels.
mal breathing patterns when the isoflurane concentration was
increased to 2.75%, so no data were acquired from that monkey
                                                                     Data Acquisition
at that particular dose.
    Following the parcellation of each animal’s cerebrum into        The monkeys were scanned on an actively shielded 7-Tesla 68-
discrete brain regions, the time series correlation was computed     cm horizontal bore scanner with a DirectDrive console (Agilent,
between each pair of regions in sliding, half-overlapping win-       Santa Clara, California) with a Siemens AC84 gradient subsystem
dows, resulting in FC matrices for each window. We then con-         (Erlangen, Germany). We used a custom in-house conformal
structed mutlislice networks from these FC matrices and parti-       five-channel transceive primate-head Radio Frequency (RF) coil.
tioned them into temporal modules that maximized a quality           Each functional run consisted of 150 continuous EPI functional
function Q (Mucha et al. 2010) (see Fig. 1C). [The same measure      volumes (repetition time [TR] = 2000 ms; echo time [TE] = 16 ms;

                                                                                                                                          Downloaded from https://academic.oup.com/cercor/article/30/10/5229/5848434 by guest on 28 October 2020
was calculated for three established classes of null networks        flip angle = 700 ; slices = 36; matrix = 96 × 96; Field of view
(Mucha et al. 2010; Bassett et al. 2011), verifying that subjects’   [FOV] = 96 × 96 mm2 ; acquisition voxel size = 1 × 1 × 1 mm3 ),
whole-brain networks exhibited significant modularity (Sup-          acquired with GRAPPA = 2. A high-resolution gradient-echo
plementary Figure 2)]. We then characterized various features        T2 anatomical image was acquired along the same orien-
of modular reconfiguration across dose levels, as well as a          tation as the functional images (TR = 1100 ms, TE = 8 ms,
summary measure of the modules themselves.                           matrix = 256 × 256, FOV = 96 × 96 mm2 , acquisition voxel size =
                                                                     375 × 375 × 1000 mm3 ). We also acquired a T1-weighted anatom-
                                                                     ical image (TE = 2.5 ms, TR = 2300 ms, FOV = 96 × 96 mm2 ,
Animal Preparation
                                                                     acquisition voxel size = 750 × 750 × 750 mm3 ).
Five macaque monkeys (Macaca fascicularis; four females,
weights ranging from 3.6 to 5.3 kg [mean ± standard deviation
                                                                     Image Preprocessing and Analysis
(SD) = 4.26 ± 0.76 kg] and ages ranging from 7.71 to 8.22 years
[mean ± SD = 7.83 ± 0.22 years]), were involved in the experi-       Functional image preprocessing was implemented in the FMRIB
ment. All surgical and experimental procedures were carried          Software Library toolbox (FSL; http://www.fmrib.ox.ac.uk). This
out in accordance with the Canadian Council of Animal Care           consisted of motion correction (six-parameter affine transfor-
policy on the use of laboratory animals and approved by              mation), brain extraction, spatial smoothing (Gaussian kernel of
the Animal Use Subcommittee of the University of Western             full width at half maximum 3 mm applied to each volume sep-
Ontario Council on Animal Care. Note that the use of an animal       arately), high-pass temporal filtering (Gaussian-weighted least
model for investigating the effects of anesthesia on brain           squares straight line fitting with sigma = 100 s), and low-pass
activity offers greater standardization between subjects and         temporal filtering (half width at half maximum = 2.8 s, Gaus-
circumvents concerns of potentially inducing a lethal collapse       sian filter). Functional data were nonlinearly registered to the
of the cardiovascular or respiratory system at high dosage           T2 anatomical (FNIRT; http://www.fmrib.ox.ac.uk/fsl/fslwiki/FNI
in humans. The complete methods for this experiment have             RT), then registered to the T1 anatomical (six degrees of freedom
previously been described in detail (Hutchison et al. 2014). We      rigid transformation), and finally normalized (12 degrees of free-
therefore provide a more concise description of the methods          dom linear affine transformation) to the F99 atlas template (Van
relevant to our temporal analyses.                                   Essen 2004) (see http://sumsdb.wustl.edu/sums/macaquemore.
    Prior to image acquisition, monkeys were injected intramus-      do).
cularly with atropine (0.4 mg/kg), ipratropium (0.025 mg/kg), and        The F99 template-normalized Lewis and van Essen (Lewis
ketamine hydrochloride (7.5 mg/kg), followed by intravenous          and Van Essen 2000a, 2000b) divisions were used to define 174
administration of 3 mL propofol (10 mg/mL) via the saphenous         (87 per hemisphere) cortical regions (see Supplementary Figure
vein. Animals were then intubated and switched to 1.5%               1 for an overview of these regions). Following regression of the
isoflurane mixed with medical air. Each monkey was then              average white matter (WM), cerebrospinal fluid (CSF), and six
placed in a custom-built monkey chair and inserted into the          motion parameters from the regional time series, we calculated
magnet bore, at which time the isoflurane level was lowered to       the mean time series for each region by averaging the time
1.00%. Prior to image localization, shimming, and echo-planar        series across all voxels contained within it and then z-scored
imaging (EPI), at least 30 min was allowed for the isoflurane        the time series within each scan (statistics of the non-z-scored
level and global hemodynamics to stabilize at this 1.00%             time series are shown in Supplementary Figure 3). Note that we
concentration. [Given the rapid recovery properties of propofol      did not use regions from subcortical structures, due to concerns
(e.g. Flaishon et al. 1997), it is unlikely that any isoflurane-     about anatomically based parcellation of small substructures
dependent effects are attributable to the initial propofol           and decreased signal-to-noise ratio.
induction]. We then acquired two functional EPI scans at each            There is mounting evidence that variation in FC between
of six increasing isoflurane levels: 1.00%, 1.25%, 1.50%, 1.75%,     regions and networks that occurs during the resting state
2.00%, and 2.75% (0.78, 0.98, 1.17, 1.37, 1.56, and 2.15 minimum     reflects real neural processes that are ignored in standard
alveolar concentration [MAC], respectively). We interleaved a 10-    resting-state investigations that examine FC over the entire
min period between each increase in isoflurane dose to allow         resting-state time window (Chang and Glover 2010; Hutchison,
for the concentration to stabilize (during this 10-min period, we    Womelsdorf, Allen, et al. 2013a; Hutchison, Womelsdorf, Gati,
did not collect data). Throughout the duration of scanning, the      et al. 2013b; Allen et al. 2014). To explore the potential effects
monkeys spontaneously ventilated, and we monitored physio-           of isoflurane dose on time-varying network dynamics, each of
logical parameters (temperature, oxygen saturation, heart rate,      the 174 regional time series was divided into windows of 60 s
5232 Cerebral Cortex, 2020, Vol. 30, No. 10
Downloaded from https://academic.oup.com/cercor/article/30/10/5229/5848434 by guest on 28 October 2020
Figure 1. Overview of experiment and analysis approach. (A) For each animal, two 5-min resting-state scans were collected at each of the six isof lurane dose levels.
(B) Each animal’s cerebrum was parcellated into 174 discrete brain regions, and the average BOLD time series was extracted from each region (three example regions
shown). (C) The Pearson correlation coefficient was calculated for each pair of regions in sliding, half-overlapping windows (shown in B), resulting in whole-brain
functional connectivity (FC) matrices for each window (w1—wN). Together, these FC matrices can be used to construct a multislice (temporal) network for each subject
and scan (see D). (D) Time-resolved clustering was then used to detect temporally dynamic modules in these networks (e.g., four modules in this schematic).
(30 imaging volumes) where contiguous windows overlapped by that did not pass false discovery rate correction (Benjamini
50%. We constructed functional networks in each time window and Yekutieli 2001) were set to zero (q = 0.05), as were all
by calculating the Pearson correlation coefficient between negative correlations, a requirement of the module detection
each pair of brain regions (Fig. 1C). To mitigate against the approach used (histograms and related statistics of positive
possibility of spurious correlations (P < 0.05), all correlations and negative FC are shown in Supplementary Figure 4). WeBrain Dynamics Across Depths of Unconsciousness Standage et al. 5233
determined the modular structure of the resulting multilayer
(a.k.a. multislice) networks with a generalized Louvain method
for time-resolved clustering (Jeub et al, http://netwiki.amath.u
nc.edu/GenLouvain, 2011–2017). This algorithm was repeated
100 times with random initialization, resulting in 100 clustering
solutions (a.k.a. partitions). On each repetition, the algorithm
was iterated until a stable partition was found, that is, the
output on iteration n served as the input on iteration n + 1 until
the output matched the input (Mucha et al. 2010; Bassett et al.
2011). In this work, we used the standard spatial and temporal
resolution parameters γ = 1 and ω = 1, respectively (see the
Supplementary Material for demonstrations of robustness).
Note that our choice of window length served a balance
between temporal resolution and mitigation against the effects
Downloaded from https://academic.oup.com/cercor/article/30/10/5229/5848434 by guest on 28 October 2020
of noise on network construction (Sakoğlu et al. 2010; Hutchison,
Womelsdorf, Allen, et al. 2013a; Leonardi and Van De Ville
2015), while the overlap between windows served to increase
the number of layers in the multilayer networks. Neither
parameter was crucial to our results (see the Supplementary
Material).
Statistical Analyses
Statistical analysis of these data is limited by the small num-
ber of subjects (N = 5) and the nonindependence of the data
within each subject (Lazic 2010). Hierarchical modeling is an
ideal solution to this problem, but models allowing for subject-
specific effects are not easily fit to data sets as small as this one.
We therefore used simple linear regression to model network
statistics as a function of dose, which can be interpreted as
assuming that all subjects respond identically to isoflurane. As
shown in our Results, these models provided good fits overall,
as intersubject variability was generally small relative to dose
effects.
Results
Temporal Networks Become More Fragmented with
Increasing Anesthetic Dose
To test the hypothesis that time-resolved modular structure
becomes more fragmented with increasing levels of isoflurane
dose, we calculated the mean number of modules over all
partitions for each subject and scan (two scans per dose).
The fit of a linear regression model to these data revealed Figure 2. Isof lurane dose affects key properties of whole-brain temporal mod-
a positive linear relationship between dose and number ules. (A) Mean number of temporal modules plotted as a function of isof lurane
dose. In the plots, means were first taken over both scans for each dose and
(β dose = 0.988, t(56) = 5.096, R2 = 0.317, P = 4.236e − 6; see Fig. 2A).
then taken over subjects. Error bars show ±1 standard error of the mean (SEM).
The SD of the number of modules across time windows showed Line shows the fit of a linear regression model to the across-subject means.
a weak, negative linear relationship with dose (β dose = −0.05, (B) Mean Q, (C) mean disjointedness, (D) mean cohesion strength, and (E) mean
t(56) = −2.129, R2 = 0.075, P = 0.038), suggesting that modular promiscuity, calculated as in A. Right-side brain plots in panels C,–E show brain
structure becomes more stable as it becomes more fragmented regions for which the relationship (Pearson correlation coefficient) between
and explicitly demonstrating that the increased fragmentation dose and the statistic on the left had a corresponding P < 0.05 (orange regions).
Regions in yellow indicate those brain regions at P < 0.05 that further passed a
does not reflect an increase in variability (Supplementary Figure
false discovery rate correction (Benjamini and Hochberg 1995). The above linear
5). We also examined the relationship between dose and the fits were reproduced when both scans for each level of dose were concatenated
quality function Q, capturing the degree to which whole-brain (Supplementary Figure 6).
structure exhibits strong intramodule connectivity and sparse
intermodule connectivity, i.e., higher Q corresponds to more
Whole-Brain Reconfiguration Becomes More
isolated modules. A linear regression model revealed a similar
Uncoordinated with Increasing Anesthetic Dose
relationship with dose as the number of modules (β dose = 0.039,
R2 = 0.231, t(56) = 4.107, P = 1.32e − 4; Fig. 2B). Together, these To test our hypothesis that brain regions change modules in a
findings suggest that deeper levels of sedation partition more uncoordinated manner with increasing levels of isoflu-
the brain into a larger number of more isolated functional rane dose, we calculated the disjointed flexibility (disjointed-
networks. ness) of each brain region on each partition, defined as the5234 Cerebral Cortex, 2020, Vol. 30, No. 10
number of times the region changes modules independently clustering (Supplementary Figure 7). Because the across-subject
(i.e., without other brain regions) relative to the total number means in Figure 2B suggest that the relationship between dose
of possible changes (Telesford et al. 2017). More formally, if and Q may be nonmonotonic (see Q values for dose levels of
Nslice is the number of time slices in a multislice network, 1% and 1.5%), we fit a quadratic regression model to these
K(s) and M(s + 1) are the respective memberships of modules data. The superior fit of the quadratic model was slightly
k and m at slices s < Nslice and s + 1, G is the set of regions nonmonotonic and compared favorably to the linear model
moving from k to m at this time, and then region i moves according to information statistics (e.g., Akaike Information
disjointedly if and only if i ∈ K(s), i ∈ M(s + 1) and G = {i}. Criterion, corrected for small sample sizes). These results are
Defining such disjointed movements by di (s,s + 1) = 1 [0 oth- shown in Supplementary Figure 8 and Supplementary Table 1.
erwise], then disjointedness is defined for each region i by The respective fits of a quadratic model to dose and the number
Di = s,s + 1 di /(Nslice − 1). We calculated the mean disjointedness of modules, disjointedness, cohesion strength, and promiscuity
by taking the average over all regions on each partition, before were all monotonic (not shown).
taking the mean over these partition means (this procedure
was also performed for all other region-specific measures; see
Downloaded from https://academic.oup.com/cercor/article/30/10/5229/5848434 by guest on 28 October 2020
Dynamic Network Architecture is Altered by Increasing
below). The fit of a linear regression model revealed a posi-
Anesthetic Dose
tive linear relationship between dose and mean disjointedness
(β dose = 0.016, t(56) = 5.422, R2 = 0.344, P = 1.295e − 6; Fig. 2C). Based To investigate whether isoflurane dose influences the degree to
on this finding, we hypothesized that the opposite arrangement which groups of brain regions preferentially interact with one
would also be true, that is, that brain regions would change another, we determined the proportion of modular partitions
modules in a more coordinated manner at lower levels of dose. (across all time windows of all scans for all subjects) in which
To test this hypothesis, we calculated the strength of cohesive each pair of brain regions was placed in the same module,
flexibility (cohesion strength) of each region on each parti- referred to as a module allegiance matrix (Bassett et al. 2015).
tion, an independent measure from disjointedness (Telesford More specifically, we constructed a matrix T, where the elements
et al. 2017). We calculated this measure by first determining Ti,j refer to the number of times regions i and j were assigned
the number of times each region changes modules together to the same module over all time slices of all partitions for all
with each other region and then summing over all other regions subjects and scans. We then constructed the module allegiance
(Telesford et al. 2017). Following the above definitions, regions matrix MA = (1/C)T, where C is the total number of time slices
i and j move cohesively between modules k and m if and only in all of these partitions. This matrix provides a summary of the
if {i,j} ⊆ K(s) and {i,j} ⊆ M(s + 1). Defining such cohesive move- brain network architecture associated with our isoflurane proto-
ments by csi,j (s,s + 1) = 1 [0 otherwise], then cohesion strength col. We then clustered the module allegiance matrix using sym-
is defined for each region i by CSi = s,s + 1 j = i csi,j . The fit metric nonnegative matrix factorization (see the Supplementary
of a linear regression model revealed a negative linear relation- Methods and Supplementary Figure 9), identifying four clusters
ship between dose and mean cohesion strength (β dose = −3.276, of regions corresponding to whole-brain networks. Because of
t(56) = −5.648, R2 = 0.363, P = 5.644e − 7; Fig. 2D). These comple- the known degeneracy of the generalized Louvain algorithm
mentary findings suggest that coordinated modular reconfigu- [very different partitions can have nearly identical quality func-
ration is a property of whole-brain dynamics under light seda- tion scores (Bassett et al. 2011)], this clustering approach effec-
tion and that this property breaks down at deeper levels of seda- tively identifies a consensus modularity partition (Bassett et al.
tion, such that smaller perturbations (e.g., noise) are sufficient 2013). In other words, it identifies a set of static brain networks
to drive haphazard modular changes. summarizing the structure of the temporally dynamic modules
from all partitions.
This summary network architecture and the module
Modular Reconfiguration Becomes More Constrained
allegiance matrix from which it was derived are shown in
with Increasing Anesthetic Dose
Figure 3A,B. For comparison, Figure 3C shows the module
To further characterize modular changes as a function of dose, allegiance matrix calculated for each level of isoflurane dose
we calculated the promiscuity of each brain region, defined (across all time windows of both scans for all subjects, for
by the number of modules in which the region participates at each dose), labeled according to the four summary networks.
least once, relative to the total number of modules (Sizemore Network 2, composed of regions in the visual, dorsal, parietal,
and Bassett 2018). The fit of a linear regression model revealed and primary somatomotor cortex (yellow in Fig. 3B), appears to
a negative linear relationship between dose and promiscuity remain present across all six levels of dose (Fig. 3C), while the
(β dose = −0.062, t(56) = −5.294, R2 = 0.334, P = 2.068e − 6; Fig. 2E). other networks (1, 3, and 4) appear to dissipate with increasing
This finding suggests that despite the fragmentation of whole- dose. Additionally, whereas the other networks appear to lose
brain networks at deeper levels of sedation (Fig. 2A,B), brain their distinctiveness from one another with increasing dose,
regions do not participate in a broader repertoire of these Network 2 becomes increasingly isolated and even appears to
modules. fracture along hemispheric lines at the highest levels of dose
Taken together, the above findings provide strong evidence (e.g., 2.00% and 2.75% isoflurane, see Fig. 3D).
that at deeper levels of sedation, 1) whole-brain networks
become more fragmented and isolated, 2) individual brain
Within- and Between-Network Integration Is
regions move between modules in a more haphazard, unco-
Modulated by Anesthetic Dose
ordinated manner, and 3) this haphazard movement between
a larger number of modules does not entail more diverse To quantify our observations of the module allegiance matrix,
modular participation by individual brain regions. Importantly, we estimated the integration of the four summary networks,
these results were highly robust across window sizes, the within each network and between networks. With each brain
overlap between windows, and the resolution of time-resolved region assigned to a network, the interaction between anyBrain Dynamics Across Depths of Unconsciousness Standage et al. 5235
Downloaded from https://academic.oup.com/cercor/article/30/10/5229/5848434 by guest on 28 October 2020
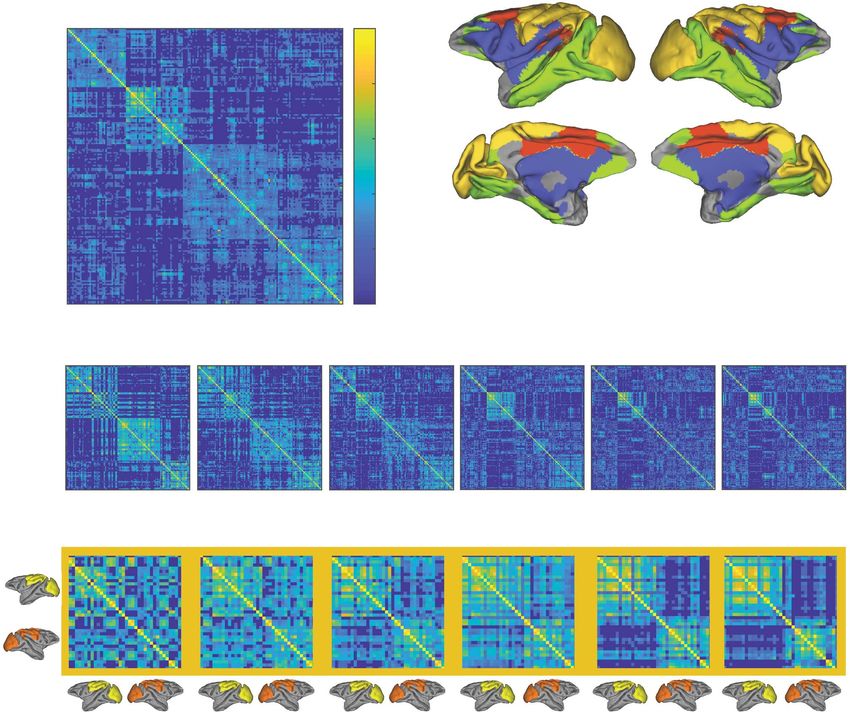
Figure 3. Summary architecture across levels of isof lurane dose. (A) Module allegiance matrix showing the probability of any two brain regions being part of the same
temporal module across all subjects, scans and time windows. (B) Clustering of the module allegiance matrix in A identified a summary network architecture from the
temporal modules, consisting of a cingulate–temporal–parietal–frontal network of regions (Network 1, red), a visual-somatomotor network (Network 2, yellow/orange),
a temporal–parietal–prefrontal network (Network 3, green), and a lateral parietal–frontal cingulate temporal network (Network 4, blue). (C) The module allegiance matrix
for each dose level, labeled according the summary network architecture in A. Note the relatively stable strength of allegiance in Network 2 across doses, compared
to the decrease in allegiance in Networks 1, 3, and 4. (D) Magnified views of the visual-somatomotor network (Network 2) from C, which highlights a fracturing of this
network along hemispheric lines at the highest dose levels (e.g., 2.00% and 2.75% isof lurane). The brain insets with yellow and orange regions denote the labelling of
the module allegiance matrix with respect to the left and right hemispheric components of Network 2, respectively.
two networks can be measured by Ik1,k2 = ( i ∈ Ck1 , j ∈ To quantify our observation that the majority of networks
Ck2 Pi,j )/(|Ck1 Ck2 |) (Bassett et al. 2015), where Ck∈1,2 are modules, (all except the visual-somatomotor network) dissipated at
| Ck | is the number of regions they contain, and Pi,j is higher levels of isoflurane dose, we fit a linear regression
the proportion of the time region i and j are in the same model to within-network integration as a function of dose for
module. The interaction of a module with itself is calculated all subjects and scans. The model revealed a negative linear
by allowing k1 = k2. The integration between two modules relationship between dose and within-network integration
k1 = k2 is the normalized interaction between them k1,k2 = (Fig. 4A) for Network 1 (β dose = −2.368, t(56) = −6.3, R2 = 0.415,
P = 4.92e − 8), Network 3 (β dose = −4.238, t(56) = −6.078, R2 = 0.397,
Ik1,k2 / Ik1,k1 Ik2,k2 . We refer to the interaction of a network
P = 1.135e − 7), and Network 4 (β dose = −1.964, t(56) = −4.52,
with itself as within-network integration and to the integration R2 = 0.267, P = 3.252e − 5). Network 2, the visual-somatomotor
between different networks as between-network integration. network, did not show this relationship (β dose = −0.217, t(56) =
[Note that “within-network integration” was referred to as −0.533, R2 = −0.013, P = 0.596). These findings confirm our
“recruitment” in the task-based analysis from which we observation that three of the four networks dissipated at deeper
borrowed this method (Bassett et al. 2015).] levels of sedation.5236 Cerebral Cortex, 2020, Vol. 30, No. 10
Network-Specific Effects on Region-Based Measures
of Modular Reconfiguration
Lastly, having found network-specific differences for within-
network and between-network integration, we sought to deter-
mine whether the movement of brain regions between temporal
modules would also show differences according to network
membership. We therefore calculated the mean disjointedness,
cohesion strength, and promiscuity of each summary network,
taking the same approach as above (Fig. 2C–E) but averaging
these measures within each network, rather than across all
brain regions. For each network, we fit a linear regression model
to each measure of modular adaptability as a function of dose,
finding that mean disjointedness increased with dose for all
Downloaded from https://academic.oup.com/cercor/article/30/10/5229/5848434 by guest on 28 October 2020
networks (Fig. 5A, left) and that mean cohesion strength (Fig. 5B,
left) and promiscuity (Fig. 5C, left) decreased with dose for all
networks. Across the 12 fits, R2 values ranged from 0.173 to
0.384, and P values ranged from 0.01e − 3 to 2.13e − 7. Averaging
across dose levels for each subject, the respective magnitudes
of disjointedness (Fig. 5A, right) and promiscuity (Fig. 5C, right)
were notably smaller in the visual-somatomotor network, while
the magnitude of cohesion strength did not obviously differ
between networks (Fig. 5B, right). Together, these findings sug-
gest that the increase in uncoordinated modular reconfiguration
at higher levels of sedation occurs globally throughout the brain
but that the magnitude of the effect is smaller in primary sen-
sory and motor areas (which make up the visual-somatomotor
network).
Discussion
We investigated the dose-dependent effects of isoflurane on
temporal modular structure in nonhuman primates following
the induction of unconsciousness. Our analyses revealed that
whole-brain structure became more fragmented at deeper
Figure 4. Within- and between-network integration is modified by isof lurane levels of sedation, where the number and isolation of temporal
dose for all networks except for the visual-somatomotor network. (A) Within- modules increased with dose (Fig. 2A,B). When we characterized
network integration and (B) mean between-network integration of each network this modular reconfiguration at the level of brain regions, we
for each level of isof lurane dose. In the plots, means were taken over both scans
found that deeper levels of sedation were associated with more
for each dose and then over all subjects. Error bars show ±1 SEM. Lines show fits
uncoordinated movement of brain regions between modules, as
of a linear regression model to the across-subject means.
revealed by an increase in disjointed flexibility (Fig. 2C) and a
decrease in cohesive flexibility (Fig. 2D). Notably, this uncoordi-
nated reconfiguration coincided with a proportional decrease
To quantify our observation that the majority of brain in the number of modules in which brain regions participated,
networks became less distinct with increasing isoflurane dose, as measured by their promiscuity (Fig. 2E). Next, by determining
we calculated the mean integration between each network the probability that each pair of brain regions was assigned to
and the other three networks. The fit of a linear regression the same module over time, we identified four whole-brain
model revealed a positive linear relationship between dose networks that summarized subjects’ dynamic whole-brain
and mean between-network integration (Fig. 4B) for Network architecture across levels of sedation (Fig. 3A,B). Three out of
1 (β dose = 0.168, t(56) = 7.559, R2 = 0.505, P = 4.118e − 10), Network four of these networks dissipated at deeper levels of sedation,
3 (β dose = 0.196, t(56) = 7.151, R2 = 0.477, P = 1.951e − 9), and as measured by their within-network (Fig. 4A) and between-
Network 4 (β dose = 0.166, t(56) = 6.64, R2 = 0.441, P = 1.357e − 8). network (Fig. 4B) integration. Interestingly, a lone network
Again, Network 2 was the exception, showing no such dose- comprised of visual and somatomotor regions was impervious
dependent relationship with the other networks (β dose = −0.02, to these dose-dependent effects on integration. Together, our
t(56) = −0.743, R2 = 0.01, P = 0.46). Furthermore, the integration findings indicate that higher anesthetic dose results in the
between each pair of networks precisely tracked these mean uncoordinated reconfiguration of modular structure across
interactions, that is, the integration between Networks 1, 3, the cortex but that the breakdown in network structure is
and 4 showed a positive linear relationship with dose, whereas relatively spared in primary visual, somatosensory, and motor
the integration between Network 2 (the visual-somatomotor regions. These dose-dependent effects on whole-brain modular
network) and each of the other networks failed to show a structure are consistent with the view that unconsciousness
dependence on dose (Supplementary Figure 10). Together, these is graded in nature, selectively driven by disordered commu-
findings confirm our observation that three out of four networks nication between circuits within the association cortex and
became less distinct with increasing isoflurane dose. other brain areas involved in integrative processes (Tononi et al.Brain Dynamics Across Depths of Unconsciousness Standage et al. 5237
windowed time series (e.g., Tagliazucchi et al. 2013), there is
no formal relationship between a module in one time window
and the modules in any other time window (Mucha et al. 2010;
Bassett et al. 2011). Consequently, summary statistics (e.g., Q and
the number of modules) can be computed over multiple time
windows, but modular reconfiguration cannot be measured. Our
temporal module analysis was in large part motivated by these
earlier studies, which provided evidence for the increased frag-
mentation of whole-brain networks according to the number of
static modules during isoflurane- (Monti et al. 2013; Hutchison
et al. 2014) and propofol-induced (Monti et al. 2013) uncon-
sciousness, as well as the magnitude of static modularity during
propofol-induced unconsciousness (Monti et al. 2013) and sleep
(Boly et al. 2012; Spoormaker et al. 2012; Tagliazucchi et al. 2013).
Downloaded from https://academic.oup.com/cercor/article/30/10/5229/5848434 by guest on 28 October 2020
Our finding that both Q (the magnitude of modularity, Fig. 2B)
and the number of temporal modules (Fig. 2A) increased with
dose offers novel support for the hypothesis that network frag-
mentation occurs in a graded fashion across levels of sedation.
In this regard, it is important to note how these two measures
are distinct. Q captures the degree to which modules are iso-
lated from one another, but does not imply that more (or less)
modules exist in a given partition. An increase in the number of
modules with dose indicates a different kind of fragmentation
altogether. Concurrently, these two findings further characterize
a large body of evidence from static FC analyses that shows
the breakdown of distributed networks, whereby brain networks
decompose into a larger number of more isolated subnetworks
during unconsciousness (MacDonald et al. 2015; Cavanna et al.
2018).
It is also important to note that maximal modularity does
not equate to optimal modularity. While modules confer func-
tional specialization and robustness, excessive modularity fore-
goes the advantages of integration over specialized subsystems
(Kirschner and Gerhart 1998; Kashtan and Alon 2005; Wagner
2005). Thus, optimal modularity can be defined as a balance
Figure 5. Mean disjointedness, cohesion strength, and promiscuity of each
between these competing requirements. Our results imply that
network. (A) Mean disjointedness for each level of isof lurane dose (left), where
this balance is increasingly skewed toward specialization at
means were taken over both scans for each dose and then over all subjects. Error
bars show ±1 SEM. Lines show fits from a linear regression model to the across- deeper levels of unconsciousness, and we envision a continuum
subject means. Distribution of subject means, taken over all doses, is shown on of optimal balance that peaks at higher levels of alertness during
the right for each network. (B) Mean cohesion strength. (C) Mean promiscuity. conscious processing. From this viewpoint, it is intuitive that
connectivity between association cortical areas breaks down
at lower levels of sedation than connectivity between sensory
2016). As such, our results not only characterize changes in the and motor systems. Integration over specialized subsystems is
dynamics of whole-brain network structure across depths of widely believed to be the role of the association cortex in the cor-
unconsciousness, but they characterize the global, network- tical hierarchy (Jones and Powell 1970; Kaas 1989), supporting the
level effects of different anesthetic doses in clinical treatment. analytic and creative processing associated with awareness and
Consequently, the neural measures of coordinated versus higher cognitive function. Here, it is worth noting the intriguing
uncoordinated network reconfiguration reported here may offer similarity between the notion of optimal modularity and the
potential diagnostic tools for identifying minimally conscious foundational principles of integrated information theory, which
states or residual consciousness in vegetative state patients posit that consciousness emerges from a balance between differ-
(Owen et al. 2006; Sitt et al. 2014). entiation and integration of distributed computational compo-
Several earlier studies have used static module detection nents (Tononi et al. 2016). This balance is hypothesized to max-
methods to characterize network fragmentation during uncon- imize systemic complexity, resulting in a large number of more
sciousness (Achard et al. 2012; Boly et al. 2012; Spoormaker et al. diverse brain states, required to account for a large, diverse set
2012; Monti et al. 2013; Tagliazucchi et al. 2013; Hutchison et al. of conscious experiences (Cavanna et al. 2018). Our finding that
2014), so it is important to differentiate the present method- fragmentation (corresponding to differentiation) increased with
ology from those of these earlier investigations. Static module dose appears to support this hypothesis. Future work should
detection methods operate according to the same general prin- systematically explore the relationship between measurements
ciple as temporal module detection methods (i.e., they partition of modularity and complexity in whole-brain networks and the
a network into modules that typically maximize the ratio of dependence of this relationship on anesthetic dose.
within-module to between module connectivity), but they do The dose-dependent decrease in within-network integra-
so for single-layer networks. Thus, even if these methods are tion in three out of four summary networks derived from tem-
used in each layer of a multilayer network constructed from poral modules (Fig. 4A) accords with earlier evidence for the5238 Cerebral Cortex, 2020, Vol. 30, No. 10
breakdown of static networks at deeper levels of sedation (Mac- 2017) and problem solving to creative thinking. Our finding that
Donald et al. 2015), while the imperviousness of the visual- promiscuity was greater at lower isoflurane dose is consistent
somatomotor network to this effect provides further evidence with this possibility, assuming that the exploration of a larger
that the breakdown of network structure under suprathreshold number of diverse brain states entails a broader range of
anesthetic dose is spatially nonuniform, with primary sensory modular reconfigurations and, correspondingly, a proportionally
and motor cortical areas less affected than higher-order associ- larger repertoire of modules in which brain regions participate.
ation cortical areas (He et al. 2008; Boveroux et al. 2010; Martuzzi Future work should address these possibilities. Finally, it is
et al. 2010; Liu et al. 2013; Hudetz et al. 2016). This general worth noting that earlier work has shown correlations between
pattern of observations supports the view that unconsciousness modular flexibility in general (the relative frequency of changes
results not from a breakdown in sensory processing per se but in modular affiliation) and the performance of cognitive tasks
rather from a breakdown in integrative processing by higher- (Braun et al. 2015) and it would be informative to subcharacterize
order brain networks involved in integrating and interpreting flexibility as disjointed or cohesive in these data.
that sensory information (Hudetz 2006; Alkire et al. 2008). Our findings should be interpreted in light of several method-
At first glance, our finding that between-network integration ological considerations. Firstly, our study did not measure sub-
Downloaded from https://academic.oup.com/cercor/article/30/10/5229/5848434 by guest on 28 October 2020
across the majority of networks increased with dose (Fig. 4B) jects’ FC during the awake state, restricting our discussion to
appears to conflict with earlier evidence showing a “decrease” in changes in network architecture during unconsciousness and
the integration between networks under anesthesia (MacDonald at deepening levels of sedation. Secondly, because our study
et al. 2015). However, we measured network integration relative was focused on anesthetic-related changes in cortical brain
to a module allegiance matrix, which describes the probability networks, our current findings do not address the role of the
that regional pairs were assigned to the same module over time thalamus, a site of suppression for many anesthetic agents
(Fig. 3A), not the magnitude of coactivation of their constituent (Alkire et al. 2000), in contributing to these cortical changes.
regions (as is typical in static FC investigations). To reconcile Thirdly, because we used isoflurane in our study, we are unable
these observations, we calculated the mean FC of our summary to distinguish the extent to which our results reflect whole-brain
networks and found that it decreased with dose, both within and properties of general anesthesia or the specific mechanisms of
between networks (Supplementary Figure 11). Thus, the increase action of isoflurane. Fourthly, isoflurane has effects on cerebral
in between-network integration among three of four summary blood flow and volume (Masamoto and Kanno 2012), leading to
networks reflects a general weakening of network structure at concerns that its neurovascular effects could obscure potential
higher levels of dose, rather than an increase in functional inter- neural changes. We believe this effect is unlikely to explain our
actions. A thorough characterization of the dose dependence results, as studies using fMRI with electrophysiological record-
of FC is provided by Supplementary Figure 4. In addition, the ings have indicated a close coupling between neural activity
preservation of the integrity of the visual-somatomotor network and hemodynamics under anesthesia (Vincent et al. 2007; Liu
across levels of dose may reflect the overall reduction in FC, et al. 2013). Finally, we also recognize the inherent limits of fMRI
which tends toward the underlying structural connectivity (Mac- in characterizing the dose-dependent effects of anesthesia, not
Donald et al. 2015). Our finding that the variability in the number only because of the limits of its spatial and temporal resolution
of modules decreased with increasing dose (Supplementary Fig- but also because it provides an indirect assay (via hemody-
ure 5) is consistent with this possibility, which may account for namics) of underlying neural changes. We address these, and
earlier evidence that functional brain states become more stable other considerations, in the Supplementary Material. Overall, we
at higher anesthetic dose (Hutchison et al. 2014; Barttfeld et al. believe it is unlikely that our findings reflect the specific mecha-
2015). nisms of isoflurane or purely neurovascular effects, rather than
Our finding that disjointed flexibility increased with neural effects.
isoflurane dose (Fig. 2B) supports our hypothesis that weaker Unconsciousness has been extensively characterized as a
network structure should lead to more haphazard, unco- decrease in the integration of regional activity in whole-brain
ordinated changes in the affiliation of brain regions with networks, both theoretically (Dehaene et al. 2014; Tononi et al.
modules. Likewise, our finding that cohesion strength decreased 2016) and experimentally (MacDonald et al. 2015; Cavanna et al.
with increased isoflurane dose (Fig. 2C) is consistent with 2018). Two general mechanisms have been suggested to under-
the decrease in whole-brain state transitions at higher dose lie this decrease (Hudetz 2006; Alkire et al. 2008). On the one
(Hutchison et al. 2014; Barttfeld et al. 2015), assuming that hand, FC breaks down nonuniformly at suprathreshold levels of
such state transitions are more readily driven by groups of anesthesia, suggesting an overall decrease in correlated activ-
brain regions acting in concert than by individual brain regions. ity between brain regions (Peltier et al. 2005; Lu et al. 2007;
The inverse relationship between disjointedness and cohesion Deshpande et al. 2010). On the other hand, a global decrease in
strength, which serve as two independent measures of regional functional segregation suggests a decrease in the specificity of
flexibility (Telesford et al. 2017), suggests that these measures connectivity (Liu et al. 2011, 2013; Kalthoff et al. 2013). Our results
may also provide a useful marker for tracking levels of conscious take an important step toward reconciling these observations,
processing. Prior work using dynamic connectivity methods offering evidence in support of both views within a common
has shown that the awake state is characterized by a rich framework. With respect to the first view, our finding that the
and flexible repertoire of whole-brain states (Barttfeld et al. integrity of three out of four summary networks diminished
2015; Uhrig et al. 2018) and that these states are expressed at deeper levels of sedation provides compelling evidence for
more frequently at lighter (compared to deeper) levels of the spatially nonuniform breakdown of network structure. With
sedation (Hutchison et al. 2014; Barttfeld et al. 2015). From this respect to the second view, our finding that both the strength
perspective, coordinated changes in modular structure may of modularity and the number of modules increased at deeper
provide a neural signature of an engaged mind, suggesting levels of sedation implies an increase in functional segrega-
that cohesive flexibility should correlate with the performance tion, rather than a decrease; however, our finding that the
of demanding cognitive tasks, from learning (Telesford et al. strength of FC decreased both within and between networks atBrain Dynamics Across Depths of Unconsciousness Standage et al. 5239
deeper levels of sedation (Supplementary Figure 11) is consis- Bassett DS, Porter MA, Wymbs NF, Grafton ST, Carlson JM, Mucha
tent with a general breakdown of network connectivity. More- PJ. 2013. Robust detection of dynamic community structure in
over, the dose-dependent increase in disjointedness, decrease in networks. Chaos. 23:013142.
cohesion strength, and decrease in promiscuity occurred in all Bassett DS, Sporns O. 2017. Network neuroscience. Nat Neurosci.
networks (Fig. 5A), further demonstrating global network-level 20:353–364.
effects. Indeed, we hypothesized that the global weakening of Bassett DS, Wymbs NF, Porter MA, Mucha PJ, Carlson JM, Grafton
FC would render small background perturbations sufficient to ST. 2011. Dynamic reconfiguration of human brain networks
drive uncoordinated modular changes (Fig. 2B). This weakening during learning. Proc Natl Acad Sci USA. 108:7641–7646.
of FC and its effects on modular reconfiguration may underlie Bassett DS, Yang M, Wymbs NF, Grafton ST. 2015. Learning-
the dissipation of three out of four summary networks, since our induced autonomy of sensorimotor systems. Nat Neurosci.
module allegiance matrix quantified the probability that brain 18:744–751.
regions were grouped together in dynamic modules. Thus, in so Benjamini Y, Hochberg Y. 1995. Controlling the false discovery
far as our temporal modular approach addresses each of the core rate: a practical and powerful approach to multiple testing. J
aspects of the two views, our findings suggest that they account R Stat Soc B Methodol. 57:289–300.
Downloaded from https://academic.oup.com/cercor/article/30/10/5229/5848434 by guest on 28 October 2020
for quantifiable expressions of the same underlying mechanism. Benjamini Y, Yekutieli D. 2001. The control of the false dis-
covery rate in multiple testing under dependency. Ann Stat.
29:1165–1188.
Supplementary Material Biswal B, Yetkin FZ, Haughton VM, Hyde JS. 1995. Functional
Supplementary material can be found at Cerebral Cortex online. connectivity in the motor cortex of resting human brain
using echo-planar MRI. Magn Reson Med. 34:537–541.
Boly M, Perlbarg V, Marrelec G, Schabus M, Laureys S, Doyon
Funding J, Pélégrini-Issac M, Maquet P, Benali H. 2012. Hierarchi-
cal clustering of brain activity during human nonrapid eye
Canadian Institutes of Health Research (CIHR) (MOP126158 to
movement sleep. Proc Natl Acad Sci USA. 109:5856–5861.
J.P.G., MOP89785 to S.E., and PRG-165679 to R.M.); This research
Boveroux P, Vanhaudenhuyse A, Bruno M-A, Noirhomme Q,
has been funded by the European Union’s Horizon 2020 Research
Lauwick S, Luxen A, Degueldre C, Plenevaux A, Schnakers C,
and Innovation Programme under the Marie Sklodowska-Curie
Phillips C, et al. 2010. Breakdown of within- and between-
grant agreement No 798255. Natural Sciences and Engineering
network resting state functional magnetic resonance imag-
Research Council (NSERC) graduate award (to C.N.A.). NSERC Dis-
ing connectivity during propofol-induced loss of conscious-
covery Grant, as well as funding from the Canadian Foundation
ness. Anesthesiology. 113:1038–1053.
for Innovation (to J.P.G.).
Braun U, Schäfer A, Walter H, Erk S, Romanczuk-Seiferth N,
Haddad L, Schweiger JI, Grimm O, Heinz A, Tost H, et al.
Notes 2015. Dynamic reconfiguration of frontal brain networks dur-
ing executive cognition in humans. Proc Natl Acad Sci USA.
We thank Peter Mucha for the helpful advice on the generalized
112:11678–11683.
Louvain algorithm and Sarah Hughes for technical assistance.
Brown EN, Purdon PL, Van Dort CJ. 2011. General anesthesia and
altered states of arousal: a systems neuroscience analysis.
Annu Rev Neurosci. 34:601–628.
Conflict of Interest
Cavanna F, Vilas MG, Palmucci M, Tagliazucchi E. 2018.
None declared. Dynamic functional connectivity and brain metastability
during altered states of consciousness. Neuroimage. 180:
383–395.
References Chang C, Glover GH. 2010. Time-frequency dynamics of resting-
Achard S, Delon-Martin C, Vértes PE, Renard F, Schenck M, state brain connectivity measured with fMRI. Neuroimage.
Schneider F, Heinrich C, Kremer S, Bullmore ET. 2012. Hubs 50:81–98.
of brain functional networks are radically reorganized in Dehaene S, Charles L, King J-R, Marti S. 2014. Toward a compu-
comatose patients. Proc Natl Acad Sci USA. 109:20608–20613. tational theory of conscious processing. Curr Opin Neurobiol.
Alkire MT, Haier RJ, Fallon JH. 2000. Toward a unified theory 25:76–84.
of narcosis: brain imaging evidence for a thalamocortical Deshpande G, Kerssens C, Sebel PS, Hu X. 2010. Altered local
switch as the neurophysiologic basis of anesthetic-induced coherence in the default mode network due to sevoflurane
unconsciousness. Conscious Cogn. 9:370–386. anesthesia. Brain Res. 1318:110–121.
Alkire MT, Hudetz AG, Tononi G. 2008. Consciousness and anes- Flaishon R, Windsor A, Sigl J, Sebel PS. 1997. Recovery of Con-
thesia. Science. 322:876–880. sciousness after Thiopental or Propofol. Bispectral Index and
Allen EA, Damaraju E, Plis SM, Erhardt EB, Eichele T, Calhoun Isolated Forearm Technique. Anesthesiology. 86:613–19.
VD. 2014. Tracking whole-brain connectivity dynamics in the Fox MD, Raichle ME. 2007. Spontaneous fluctuations in brain
resting state. Cereb Cortex. 24:663–676. activity observed with functional magnetic resonance imag-
Anis NA, Berry SC, Burton NR, Lodge D. 1983. The dissociative ing. Nat Rev Neurosci. 8:700–711.
anaesthetics, ketamine and phencyclidine, selectively reduce Franks NP. 2006. Molecular targets underlying general anaesthe-
excitation of central mammalian neurones by N-methyl- sia. Br J Pharmacol. 147(Suppl 1):S72–S81.
aspartate. Br J Pharmacol. 79:565–575. Guldenmund P, Demertzi A, Boveroux P, Boly M, Vanhau-
Barttfeld P, Uhrig L, Sitt JD, Sigman M, Jarraya B, Dehaene S. 2015. denhuyse A, Bruno M-A, Gosseries O, Noirhomme Q,
Signature of consciousness in the dynamics of resting-state Brichant J-F, Bonhomme V, et al. 2013. Thalamus, brain-
brain activity. Proc Natl Acad Sci USA. 112:887–892. stem and salience network connectivity changes duringYou can also read