Prediction of brain age and cognitive age: quantifying brain and cognitive maintenance in aging
←
→
Page content transcription
If your browser does not render page correctly, please read the page content below
Prediction of brain age and cognitive age: quantifying brain and
                 cognitive maintenance in aging
   Melis Anatürk∗a,b , Tobias Kaufmannc , James H. Coled,e , Sana Suria,b , Ludovica
   Griffantia,b , Enikő Zsoldosa,b , Nicola Filippinia,b , Archana Singh-Manouxf,g , Mika
    Kivimäkig , Lars T. Westlyec,h , Klaus P. Ebmeiera , Ann-Marie G. de Langea,c,h
                     a
                       Department of Psychiatry, University of Oxford, Oxford, UK
           b
             Wellcome Centre for Integrative Neuroimaging, University of Oxford, Oxford, UK
   c
     NORMENT, Institute of Clinical Medicine, University of Oslo, & Division of Mental Health and
                           Addiction, Oslo University Hospital, Oslo, Norway
d
  Centre for Medical Image Computing, Department of Computer Science, University College London,
                                              London, UK
      e
        Dementia Research Centre, Institute of Neurology, University College London, London, UK
f
  Epidemiology of Ageing and Neurodegenerative diseases, Université de Paris, INSERM U1153, Paris
                                                France.
        g
          Department of Epidemiology and Public Health, University College London, London, UK
                     h
                       Department of Psychology, University of Oslo, Oslo, Norway

Abstract
The concept of brain maintenance refers to the preservation of brain integrity in older
age, while cognitive reserve refers to the capacity to maintain cognition in the presence of
neurodegeneration or aging-related brain changes. While both mechanisms are thought
to contribute to individual differences in cognitive function among older adults, there is
currently no ‘gold standard’ for measuring these constructs. Using machine-learning, we
estimated brain and cognitive maintenance based on deviations from normative aging
patterns in the Whitehall II MRI sub-study cohort, and tested the degree of corre-
spondence between these constructs, as well as their associations with premorbid IQ,
education, and lifestyle trajectories. In line with established literature highlighting IQ
as a proxy for cognitive reserve, higher premorbid IQ was linked to cognitive mainte-
nance independent of the degree of brain maintenance. No strong evidence was found for
associations between lifestyle trajectories and brain or cognitive maintenance. In con-
clusion, we present a novel method to characterize brain and cognitive maintenance in
aging, which may be useful for future studies seeking to identify factors that contribute
to brain preservation and cognitive reserve mechanisms in older age.

Keywords:     Aging, Neuroimaging, Cognitive reserve, Brain maintenance, Machine learning,
Trajectories, Lifestyle

   ∗
       correspondence: melis.anaturk@sjc.ox.ac.uk
1. Introduction
Most cognitive abilities are well established to decline with age [1], and cognitive de-
terioration can to some extent be attributed to concurrent changes in brain structure
[2, 3, 4, 5, 6]. Age-related structural changes typically manifest as reductions in brain
volume, cortical thinning, and decline in white matter microstructure [7], which can
lead to poorer cognitive performance in domains such as executive function, memory,
and processing speed [1, 8, 9]. However, the aging population is characterized by con-
siderable variation between individuals, and while some develop cognitive impairment,
Alzheimer’s disease, and other types of dementia, others may to a large extent maintain
their cognitive function well into late life [8]).
1.1. Brain maintenance and cognitive reserve
Inter-individual differences within older adult populations have led to a large number of
studies focusing on risk and protective factors for cognitive decline in aging [10, 11, 12, 13,
14], as well as factors that characterize successful aging or ‘SuperAgers’ [15, 16, 17, 18].
The maintenance of a ‘younger’ brain, or the relative lack of aging-related changes
including pathology, has been suggested as a main mechanism to preserve cognitive
function into older age [8]. For example, while decline in cortical thickness is commonly
observed between midlife and late life, a unique group of older adults (i.e. ‘SuperAgers’)
do not exhibit this typical pattern of cortical atrophy. SuperAgers also appear to possess
higher cortical thickness in some brain regions relative to younger individuals [18], and
perform comparably to young adults on assessments of memory [16, 19]. However, a
number of studies have reported weak associations between degree of brain pathology
and relevant clinical symptoms [20], and as a consequence, reserve theories have gained
prominence in the aging field [21, 22, 23, 24].
The cognitive reserve theory seeks to explain why some individuals are able to main-
tain cognitive function in the presence of pathology or aging-related brain changes. It
has been suggested that individuals with higher cognitive reserve process information
more efficiently, enabling them to functionally adapt to brain aging and sustain greater
pathology before cognitive impairments manifest [23]. Education has been suggested to
2promote cognitive reserve by enhancing cognitive flexibility, and factors such as lifestyle
behaviors may moderate the beneficial effect of education on cognition in older age [9].
As there is no established method to directly measure cognitive reserve, the majority of
reserve studies have used measures such as IQ or education as proxies of reserve [25, 26],
and focused on how cognitive function and brain metrics differ between individuals with
high or low levels of this proxy measure [9].
In summary, preservation of brain structure and cognitive reserve mechanisms can
both potentially contribute to a higher degree of maintained cognitive function in older
age. Brain maintenance and cognitive reserve can thus be viewed as complementary
constructs that may be malleable over the lifespan [9], potentially serving as targets
for lifestyle interventions. However, despite their centrality to studies of aging [27],
there remains no consistent approach to measuring and comparing these constructs. In
this paper, we refer to maintained brain structure and cognitive function relative to
normative age trajectories as brain maintenance and cognitive maintenance. A strong
association between the two would imply correspondence between degrees of brain and
cognitive maintenance, while a weak association could reflect a lack of one-to-one rela-
tionships between these trajectories - potentially providing evidence for cognitive reserve
mechanisms.
Definition of key concepts
Brain maintenance
Preserved brain structure in older age relative to normative age trajectories
Cognitive maintenance
Preserved cognitive function in older age relative to normative age trajectories
Cognitive reserve
Preserved cognitive function in the presence of aging-related brain changes
1.2. Prediction of brain age and cognitive age
The application of machine learning to neuroimaging data has provided an avenue for
estimating the apparent age of an individual’s brain, and determining deviations from
normative brain aging patterns [28]. Studies in this area suggest that the difference
3between estimated ‘brain age’ and chronological age (i.e. brain age gap; BAG) varies
between individuals, with positive BAG values (older brain age relative to chronological
age) relating to poorer cognitive function [29, 30, 31]. A recent multi-cohort study of
45,615 individuals further highlighted that BAG may be a sensitive marker of disease,
with accelerated brain aging observed in a range of conditions including mild cognitive
impairments, Alzheimer’s Disease, and depression [32]. Mapping this metric onto the
concepts introduced in Section 1.1, BAG estimated from structural MRI may reflect de-
gree of brain maintenance [33], with negative values suggesting preserved brain structure
relative to what is expected based on normative trajectories (as illustrated in Figure 1).
Based on this rationale, machine learning algorithms can also be applied to cognitive
data to provide an estimate of cognitive age, with the difference between cognitive and
chronological age (i.e. cognitive age gap; CAG) reflecting degree of cognitive maintenance
(see Figure 1). The correlation between BAG and CAG would indicate the degree of
correspondence between brain and cognitive maintenance or decline relative to norma-
tive aging patterns, as illustrated in Figure 1. A novel method to measure maintenance
and reserve is timely, particularly as there is a growing demand for lifestyle-based inter-
ventions that may help prevent or delay age- and disease-related cognitive decline [34].
80 80
Normal aging Normal aging
75 Maintenance 75 Maintenance
Decline Decline
Cognitive age [years]
70 70
Brain age [years]
65 65
60 60
BAG CAG
55 55
50 50
45 45
40 40
40 50 60 70 80 40 50 60 70 80
Age [years] Age [years]
Figure 1: Conceptual illustration of brain age (left) and cognitive age (right), where the distance between
estimated brain age / cognitive age (colored dots) and the expected brain age / cognitive age (black
line) represents BAG and CAG.
41.3. Lifestyle predictors of cognitive/neural integrity
The extent to which BAG and CAG relate to known predictors of healthy aging may
shed light on the associations between lifestyle factors and maintenance / reserve mecha-
nisms. For example, educational level may relate to cognitive maintenance independent
of brain maintenance, potentially suggesting that education facilitates preserved cogni-
tion via cognitive reserve mechanisms. Health behaviors such as abstaining from smok-
ing [35], limiting the amount of alcohol consumed [36], and achieving a sufficient amount
of physical activity (PA, [37]) could promote maintained cognitive function [38, 39, 40]
and decreased dementia risk [41] through brain preservation, as indicated by studies
showing a link between these factors and estimates of BAG [42, 43, 33, 44]. How-
ever, a significant proportion of studies on lifestyle factors and brain/cognitive aging
are based on cross-sectional measurements [12, 20] or on self-reported history, which
is highly susceptible to recall biases [45]. As prolonged or cumulative exposure to a
healthy lifestyle has been suggested to play an important role in individual variation
in health outcomes [46, 47], a lifespan perspective may be critical for understanding
how lifestyle factors relate to cognitive/neural aging and dementia onset. For example,
lower average alcohol consumption over 30 years is linked to higher regional grey matter
density and white matter integrity in older adults [48]. While examining cumulative
exposure is a useful approach, it provides limited insight into the specific lifestyle tra-
jectories conducive to cognitive and brain aging. Recent data-driven approaches have
began to characterize the different lifestyle patterns that co-occur between midlife and
late life. For instance, a coordinated analysis of data from six cohorts (based in the
United States, England, Europe, Japan, Korea, and China) suggested that there may be
three major ‘clusters’ of middle-aged and older adults, including a) those who engaged
in multiple healthy behaviors, b) those who were socially and physically inactive but did
not engage in risky behaviors, and c) ex-smokers engaging in other risk behaviors [49].
Other studies report between 2 to 9 sub-groups (reviewed in [50]). The majority of this
evidence, however, is based on cross-sectional survey data, and the ways in which brain
preservation or cognitive reserve mechanisms may serve as potential pathways between
lifestyle trajectories and late-life cognition are not well understood.
51.4. Study aims
In the current study, we used machine learning models to estimate i) brain age based
on MRI-derived measures, and ii) cognitive age based on performance scores on several
cognitive tests. For each participant, we calculated an estimate of BAG (predicted brain
age minus chronological age, indicating degree of brain maintenance [33]), and CAG
(predicted cognitive age minus chronological age, i.e. degree of cognitive maintenance).
We first correlated BAG with CAG to investigate the degree of correspondence between
brain and cognitive maintenance. Secondly, we tested the association of CAG and BAG
with premorbid IQ and education, which are known as proxies of cognitive reserve [9].
Finally, we employed a latent class growth analysis to characterize lifestyle trajectory
classes based on five repeated measures of healthy lifestyle behaviors (physical activity,
smoking status, and alcohol intake) between midlife to late life, and tested the associ-
ations between trajectory class and BAG/CAG. In addition, we calculated an index of
cumulative healthy (lifestyle) behaviors based on a composite measure of lifestyle scores
across measurement timepoints, and tested the association of this index with BAG and
CAG.
2. Materials and Methods
2.1. Sample
Data from participants enrolled in the Whitehall II imaging sub-study were examined.
A detailed description of this cohort has been published previously [51]. In brief, these
individuals were originally recruited in 1985 as part of a cohort of 10,308 civil servants
based in London [52], and have since been regularly assessed (at ∼ 5 year intervals) on a
range of lifestyle, biological, and cognitive variables. Between 2012 and 2016, a random
sample of 800 individuals were invited to undergo an MRI brain scan and comprehensive
cognitive battery, as part of the Whitehall II imaging sub-study [51].
The current sample was drawn from the Imaging Sub-study cohort, and included
537 participants who had provided lifestyle information for at least four previous study
phases. Additional criteria for inclusion were complete MRI, cognitive and demographic
6data at the MRI Phase, no artefacts or substantial motion in the MRI images, no struc-
tural abnormalities detected in the MRI scans (e.g. strokes or tumors) and no self-report
neurological diagnoses (e.g. Parkinson’s disease) or a current SCID diagnosis of depres-
sion, anxiety, psychosis, or cognitive disorder. A description of sample characteristics
is provided in Table 1, and an overview of the study timeline is available in Figure 2.
The study received ethical approval from the University of Oxford Central University
Research Ethics Committee, as well as the University College London Medical School
Committee on the Ethics of Human Research. All participants enrolled in this study
gave their informed and written consent.
Table 1: Sample characteristics.
Variables Mean ± SD
N. 537
Age (years) 69.75 ± 5.08
Sex
Female (%) 94 (17.50%)
Education (years) 16.75 ± 4.44
Ethnicity
White (%) 508 (94.60%)
MoCA (score) 27.31 ± 2.16
Healthy Lifestyle Score*
Phase 5 1.11 ± 0.85
Phase 7 1.16 ± 0.84
Phase 9 1.24 ± 0.84
Phase 11 1.27 ± 0.87
MRI 2.05 ± 0.66
Cumulative Lifestyle Score 4.86 ± 2.92
*
Scale is n. of self-reported health behaviors. While raw
values are reported here, these variables were standard-
ized for the analyses.
2.2. Demographics
All demographic variables were assessed at the time of scan. Education was measured as
total years of full time and part time education. Ethnicity was defined as White/Non-
white. Body mass index (BMI) was calculated using information on height and weight:
weight [kilograms]/(height [metres])2 .
72.3. MRI data acquisition and processing
The participants underwent a 3T MRI scan at the Centre for Functional Magnetic Res-
onance Imaging of the Brain (FMRIB), Wellcome Centre for Integrative Neuroimaging,
at the University of Oxford. Between April 2012 and December 2014, scanning was
conducted with a Siemens Magnetom Verio with a 32-channel receive head coil (n. of
participants = 390). Following a scanner upgrade in early 2015, further scanning was
conducted on a Siemens Magnetom Prisma with a 64-channel head-neck coil (n. of par-
ticipants = 147). T1-weighted (gray matter (GM) volume), diffusion-weighted (white
matter (WM) microstructure), and Fluid Attenuated Inversion Recovery (FLAIR, WM
lesions) images were examined in this study. For details of the MRI acquisition param-
eters for each modality, please see Fillipini et al. [51] and Zsoldos et al. [11].
2.3.1. MRI features
In line with recent studies [44, 53, 54], GM features were derived using a fine-grained
cortical parcellation scheme [55] including global and region-specific measures of sur-
face area, volume, and cortical thickness, in addition to the classic set of subcortical
volume parcellations and summary statistics based on the automatic segmentation in
FreeSurfer [56]. The GM variables were residualized with respect to scanner, relative
head motion measured during the acquisition of resting state fMRI images [57, 58],
intracranial volume (ICV [59]), sex, and ethnic background using linear models. WM
features including global and tract-specific estimates of fractional anisotropy (FA), mean
diffusivity (MD), axial diffusivity (AD), radial diffusivity (RD), and mode of anisotropy
(MO) were derived using 48 standard-space masks available from the ICBM-DTI-81
White-Matter Labels Atlas [60, 61]. Global WM hyperintensity volumes were automat-
ically extracted from FLAIR images with Brain Intensity AbNormality Classification
Algorithm (BIANCA) [62]. WM variables were residualized with respect to scanner,
relative head motion, sex, and ethnic background using linear models. A total of 1118
GM features and 245 WM features were included in the brain age prediction model.
82.4. Cognitive features
A cognitive battery was administered on the day of the MRI scan by either a trained
research assistant or psychiatrist. The tests included measures of premorbid IQ (Test of
premorbid functioning; TOPF [63]), global cognition (Montreal Cognitive Assessment;
MoCA; [64]), working memory (Digit Span: forward, backward, ascending sequence [65]),
visual attention and task-switching (Trail Making Test; TMT A & B; [66]), visuospatial
memory (Rey-Osterrieth Complex Figure; RCF: immediate and delayed recall, recog-
nition [67]), verbal memory (Hopkins Verbal Learning Test; HVLT-R: immediate and
delayed recall, recognition [68]), semantic memory (Boston Naming Test [69]); verbal
fluency (adapted from the Addenbrookes Cognitive Examination Revised (ACE-III) [70]:
Semantic and Letter Fluency); processing speed (Digit Coding [65]), and simple and
complex reaction time (CANTAB RTI; CANTABeclipse 5.0; Cambridge Cognition Ltd.
Measures: Simple Reaction time; Choice Reaction time; Simple Movement time and
Choice Movement time). For a detailed description of these tests, please see Fillipini et
al. [51].
P5 P7 P9 P11 OX
1997-1999 2002-2004 2007 - 2009 2012 - 2013 2012 - 2016
Lifestyle Index Score MRI
Cognitive battery
Demographics
Figure 2: An overview of the variables of interest provided at each phase of the WHII
study (for a full description of data available at all study phases, please see https:
//www.ucl.ac.uk/epidemiology-health-care/research/epidemiology-and-public-health/
research/whitehall-ii/data-collection). Phases were selected based on the availability of
measures of alcohol consumption, smoking habits, and physical activity. Composite measures of
healthy lifestyle scores were derived from five phases (average length of time (mean ± SD) = 16.3 years
± 1.4), with an MRI scan administered at the fifth timepoint.
92.5. Lifestyle index
Scores to reflect a lifestyle index were calculated separately for each of the five study
phases shown in Figure 2. The index was derived based on an individual’s position
on three behavioral variables: alcohol intake, smoking status, and physical activity. In
general, participants received a point of 1 for each behavior if they met governmental
guidelines and/or recommendations outlined in the literature, with the lifestyle index
scores ranging from 0 (reporting no healthy behaviors) to 3 (reporting three healthy
behaviors).
For alcohol consumption, the measurement was based on self-reported total units
consumed on a weekly basis (over the last year). Individuals who self-reported as ab-
stinent from alcohol ( 3,
assignments were coded as 1 based on previous findings [71], with all other individuals
scoring 0. The measurement and computation of these variables are described in greater
detail in Sabia et al. (2017) [71]. At the time of scan, the Community Healthy Ac-
tivities Model Program for Seniors (CHAMPS [72]) questionnaire was used to measure
engagement (frequency and duration) in a range of 41 activities per week, including 20
moderate to vigorous intensity activities (e.g. playing tennis, aerobics exercises, strength
training).
102.6. Statistical Analyses
2.7. Brain age and cognitive age
A regressor model from XGBoost (https://xgboost.readthedocs.io/en/latest/#)
was used to predict brain age based on the MRI measures described in section 2.3.1,
and cognitive age based on the cognitive tests described in section 2.4 (excluding pre-
morbid IQ). All MRI and cognitive variables were standardized before being entered
as features into these analyses. To optimize hyper-parameters, randomized search was
performed with ten folds and ten iterations, with scanned parameter ranges set to max-
imum depth: [2, 10, 1], number of estimators: [60, 220, 40], and learning rate: [0.1, 0.01,
0.05]. The optimized parameters were maximum depth = 2, number of estimators =
180, and learning rate = 0.1 for the brain age model, and maximum depth = 2, number
of estimators = 140, and learning rate = 0.05 for the cognitive age model.
Ten-fold cross validations produced an estimate of each measure for every individual
in the sample. To investigate the prediction accuracy, correlation analyses were run for
predicted brain age versus chronological age and predicted cognitive age versus chrono-
logical age. R2 , root mean square error (RMSE), and mean absolute error (MAE) were
calculated for each model using the Scikit-learn library with Python version 3.7.0. An
overview of how BAG and CAG estimates were calculated is available in Table 2. To
investigate the associations between BAG and CAG, we first corrected the estimations
for chronological age using linear regression [73] before correlating the BAG and CAG
residuals.
Table 2: A summary of the main dependent variables of the study.
Variable Calculation Negative values = Concept
BAG (brain age – chron. age) younger brain age brain maintenance
relative to chron. age
CAG (cognitive age – chron. age) younger cognitive age cognitive maintenance
relative to chron. age
2.7.1. Associations with known predictors of cognitive reserve
Linear regressions were performed to evaluate whether CAG and BAG associated with
education or premorbid IQ, which are known predictors of cognitive reserve [74]. These
11associations were first adjusted for age only, and if an association was found, sex, edu-
cation, ethnicity, BMI, as well as CAG/BAG were included as co-variates in a follow-up
analysis to adjust for potential confounders. If education or premorbid IQ were signif-
icantly associated with either BAG or CAG (at an alpha (α) level of 0.05) ,we directly
compared these co-variate adjusted associations using Z-tests for correlated samples [75]
with:
√
Z = (βm1 − βm2 )/ σm1
2 2
+ σm2 − 2ρσm1 σm2 , (1)
where m1 = model 1 (CAG); m2 = model 2 (BAG); β = beta coefficients from the
co-variate adjusted linear regressions between variables of interest and BAG/CAG; σ =
standard errors of the beta coefficients; ρ = age-adjusted correlation between BAG and
CAG.
2.7.2. Associations with lifestyle trajectories
Latent class growth analysis (LCGA) was employed to evaluate whether the sample could
be sub-divided into trajectory classes based on repeated measures of healthy lifestyle
scores (Section 2.5). This is a widely used method that has previously been applied to
identify trajectories of sleep [76] and BMI [77] in the Whitehall II cohort. LCGA was
run with the following specifications: n. of random sets of starting values: 500, opti-
mizations: 20, and iterations: 20. Time metric: Mean age at each assessment was used
as the metric of time, with each time score centered by 53 (mean baseline age) and
divided by 10 to aid model convergence: [0, 0.3, 1.1, 1.5, 1.7]. Estimator: Restricted
Maximum Likelihood with robust standard errors was used. Full information Maxi-
mum likelihood was also employed to estimate parameters in the presence of missing
data [78]. All lifestyle index scores were standardized prior to the LCGA to minimize
biases introduced by variation in the questionnaire between the prior phases and MRI
scan.
The model with best fit was identified based on achieving the lowest Akaike Informa-
tion Criterion (AIC), Bayesian Information Criterion (BIC), and Sample-Size Adjusted
BIC (aBIC), with an entropy value ≥ 0.8 and a p-value < 0.05 for the Vuong-Lo-Mendel-
12Rubin (VLMR) likelihood ratio and Bootstrap likelihood ratio (BLRT) tests [79]. A
minimum of 5% of participants within each class was also required to minimize the
likelihood that a class captured outliers only [80]. These analyses were conducted with
MPlusAutomation (version 0.7-3 [81]).
To test for relationships between lifestyle trajectories and estimates of brain and cog-
nitive maintenance, BAG and CAG were used as dependent variables in separate linear
regressions. Lifestyle trajectory classes (described in 2.6) were entered as independent
variables and as dummy coding was used, the class with the least favorable lifestyle
served as the reference category. In addition, a cumulative lifestyle score based on an
average of lifestyle scores across all phases was examined as a potential predictor of BAG
and CAG in separate regression analyses. An average was selected over a summary score
due to being less biased in the presence of missing data (as individuals with either 4 or 5
phases of lifestyle data were included in the analyses). In order to derive comparable β
estimates, all variables were standardized prior to the linear regression analyses. The as-
sociations were first examined adjusting for chronological age only (Model 1), and if the
associations were significantly different from zero (α level of 0.05), they were followed up
by analyses adjusting for age, sex, education, ethnicity and BMI, as well as CAG/BAG
(Model 2). If the relationships remained significant (prior to multiple comparisons), the
associations were directly compared using the z-test for correlated samples as described
in Equation 1.
2.7.3. Multiple comparison corrections and sensitivity analyses
All hypothesis tests were two-sided. We report unadjusted p-value (p) and p-values
corrected for multiple comparisons using false discovery rate (FDR) correction [82].
(pcorr ). As linear regression and z-tests for correlated samples were performed multiple
times, we report the associations that showed a p-value < 0.05 but did not survive FDR-
correction as trends, and associations that showed pcorr < 0.05 as significant. The linear
regression analyses and z-tests for correlated samples were rerun after outliers on any of
the variables of interest were excluded (i.e. individuals with values < Q1 - 3 * IQR or
values > Q3 + 3 * IQR).
133. Results
3.1. Brain age and cognitive age
The accuracy of the brain age and cognitive age prediction measured by R2 , RMSE,
MAE, and Pearson’s correlations are shown in Table 3. The brain age model explained
a greater proportion of variance in chronological age (R2 = 0.40) compared to the cogni-
tive age model (R2 = 0.09). To test whether the relative difference in prediction accuracy
depended on number of features included, the models were rerun using Principal Com-
ponent Analysis (PCA) transformed variables with the top 20 components as input for
each model. The relative accuracy of the two models were consistent with the main
results, as showed in Table 4.
Predicted brain age correlated positively with predicted cognitive age (Pearson’s r =
0.24, 95% CI = [0.16, 0.31], p < 0.001), indicating a moderate correspondence between
cross-sectional estimates of normative brain and cognitive age trajectories. The age-
adjusted association between BAG and CAG was not significant (Pearson’s r = 0.06,
95% CI = [-0.03, 0.14], p = 0.17). As a cross-check, we tested whether BAG was
associated with global and domain-specific cognition [31, 29, 30]. A subset of tests were
used to define domains of executive function, memory and processing speed, in line with
prior studies [83, 84]. The results showed that BAG did not correlate with measures of
global (MoCA scores) or domain-specific cognitive function, as shown in Supplementary
Information (SI) Table 2.
Table 3: R2 , root mean square error (RMSE), and mean absolute error (MAE) for each of
the models, and correlations (r) between predicted brain/cognitive age and chronological age.
95% confidence intervals are indicated in square brackets. RMSE and MAE are reported in
years.
Model R2 RMSE MAE r [95% CI] p
Brain age 0.40 3.87 3.11 0.63 [0.58, 0.68]Table 4: Prediction accuracy using the top 20 PCA components as input for each of the models,
explaining 43.63% of the variance in the MRI data, and 100% of the variance in the cognitive
data. 95% confidence intervals are indicated in square brackets. RMSE and MAE are reported
in years.
Model R2 RMSE MAE r [95% CI] p
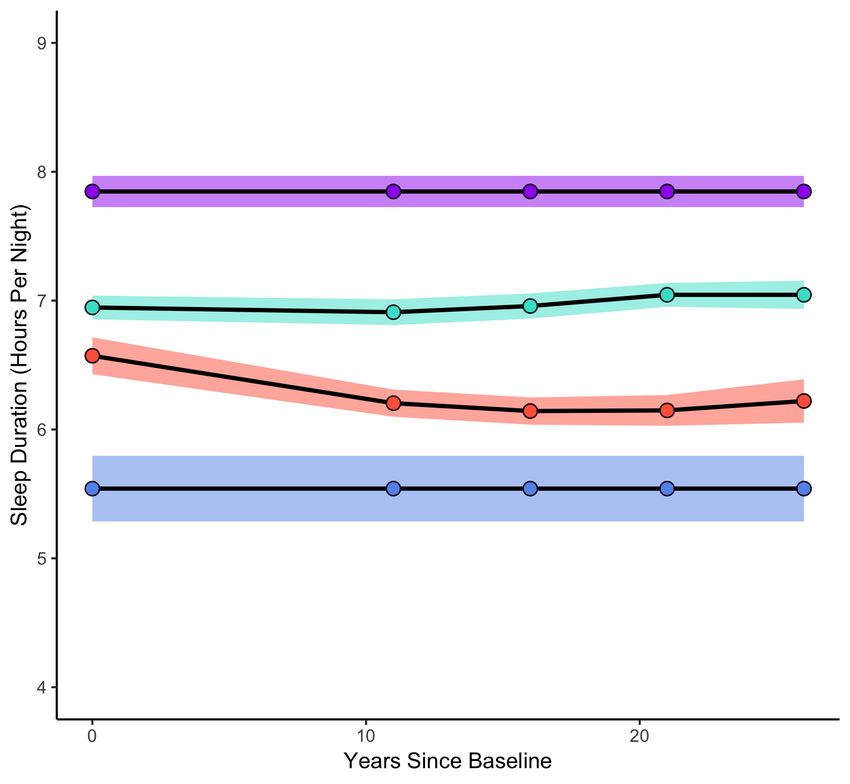
Brain age 0.31 4.16 3.31 0.55 [0.49, 0.61]Figure 3: Trajectories of the 3-class solution that was identified as the best fit, which are described
in 3.4. Shaded areas reflect 95% confidence intervals.
1.0
Standardized healthy lifestyle score
0.5
High and decreasing (24.2 %)
0.0 Moderate and consistent (34.6 %)
Low and increasing (41.2 %)
−0.5
−1.0
−1.5
55 60 65 70
Age
3.4. Associations with cumulative lifestyle scores
At an α level of 0.05, cumulative lifestyle scores associated negatively with BAG (β = -0.06,
95% CI = [-0.12, -0.01], p = 0.01). However, this association did not survive corrections for
multiple comparisons, as shown in Table 5. No relationship was observed between cumulative
lifestyles and CAG (β = -0.01, 95% CI = [-0.05, 0.02], p = 0.473, pcorr = 0.526). The results
showed no difference between the BAG and CAG associations with cumulative lifestyle scores
(Z = 0.23, p = 0.234, pcorr = 0.234), as shown in Table 6.
3.5. Sensitivity analyses
After the exclusion of extreme outliers (n of remaining sample = 532), the age-adjusted as-
sociations between CAG and premorbid IQ (β = -0.07, 95% CI = [-0.10, -0.03], p < 0.001,
pcorr = 0.004) and education (β = -0.06, 95% CI = [-0.09, -0.03], p = 0.001, pcorr = 0.001)
were replicated. The trend between cumulative lifestyles and BAG was also detected (β =
-0.06, 95% CI = [-0.12, -0.01], p = 0.019, pcorr = 0.155). The relationship between high and
decreasing lifestyles and BAG was reduced to non-significant (β = -0.14, 95% CI = [-0.28,
0.00], p = 0.054, pcorr = 0.135).
16Adjusting for age and other co-variates (model 2), the negative association between pre-
morbid IQ and CAG remained significant (β = -0.06, 95% CI = [-0.10, -0.01], p = 0.029, pcorr =
0.045), while the association between education and CAG was no longer detected (β = -0.03,
95% CI = [-0.07, 0.02], p = 0.233, pcorr = 0.233). The trend between cumulative lifestyles
and BAG (model 1) was significant after further co-variate adjustments (β = -0.06, 95% CI
= [-0.12, -0.01], p = 0.030, pcorr = 0.045). Premorbid IQ was more strongly associated with
CAG, than compared to BAG (Z = -3.03, p = 0.234, pcorr = 0.002). There was no difference
in the associations between cumulative lifestyles and CAG/BAG (Z = 1.15, p = 0.234, pcorr
= 0.252).
Table 5: Associations between CAG / BAG estimates and education, premorbid IQ, and cumulative
healthy lifestyle scores. 95% confidence intervals are indicated in square brackets. Model 1 was adjusted
for chronological age only. Associations that were significant (before multiple comparison corrections)
were submitted to linear regression with additional co-variates (i.e. model 2). Model 2 was adjusted
for age, sex, education, ethnicity, BMI and mutual adjustments between BAG and CAG. Note, where
education and premorbid IQ were the independent variables of interest, mutual adjustments were also
included in Model 2 (with BMI excluded from the list of co-variates). Confidence intervals are indicated
in square brackets. P-values are provided before and after FDR-correction.
Model 1 Model 2
DV IV β [95% CI] p pcorr β [95% CI] p pcorr
CAG Education -0.06 [-0.09, -0.02] 0.001 0.005 -0.01 [-0.06, 0.03] 0.559 0.559
Premorbid IQ -0.08 [-0.11, -0.04]4. Discussion
The present study is the first to demonstrate that by combining machine learning, MRI, and
cognitive data, it is possible to quantify the concepts of brain maintenance (i.e. BAG) and
cognitive maintenance (i.e. CAG) in parallel. Overall, we found no significant association be-
tween BAG and CAG, which suggests that there is limited correspondence between brain and
cognitive maintenance in older age. This lack of association was also replicated when BAG
was tested against measures of global and domain-specific cognitive function. These findings
support the idea that there is no one-to-one relationship between brain preservation and cog-
nitive preservation in aging. This is in line with the cognitive reserve hypothesis and evidence
showing disjunctions between the degree of brain pathology and cognitive outcome [23]. More-
over, premorbid IQ was related to CAG independent of BAG, in line with established literature
highlighting IQ as a potential proxy for cognitive reserve [85]. Our results are, however, in con-
tradiction with other studies showing consistent links between BAG and cognitive performance
(e.g. [31, 29, 30]. This discrepancy could potentially be attributed to disparities between the
cognitive tests administered, or differences in sample characteristics.
4.1. Brain maintenance versus cognitive reserve: potential utility of machine learning
While brain age prediction is frequently used as a metric of brain preservation in aging [86],
there is currently no established method for capturing preserved cognitive function relative to
degree of brain decline in cross-sectional studies. Measures of cognitive reserve have tradition-
ally consisted of either a stand-alone measure of education or premorbid IQ, or a combination of
these indices (alongside occupational complexity and engagement in leisure activities [25, 26]).
To date, the measurement of cognitive reserve remains a controversial topic [87, 88], partic-
ularly given the lack of inter-study agreement in the type or number of indices used. The
most commonly used index of reserve is education, with the rationale being that education
may contribute to reserve by promoting cognitive flexibility [23] or accumulation of neural
resources [9]. Despite evidence to suggest that education is consistently linked to a lower risk
of dementia [89], and may moderate the relationship between neuropathology and cognitive
performance [90, 91], the use of education as a ‘proxy’ of cognitive reserve is conceptually
problematic. Although cognitive reserve may be promoted by cognitive activity, reserve mech-
anisms are unlikely to represent the only pathway between education and late-life cognition.
18Genetics and early life factors such as birth weight, childhood IQ, and parental education have
been shown to influence brain and cognition continuously across the lifespan [92, 93, 94], and
associations between education and cognitive function may be further mediated by socioeco-
nomic status, risk of disease (e.g. heart disease, stroke and diabetes [95, 87]), lifestyle factors,
as well as potential for neural compensation and plasticity [9, 7]. Educational attainment may
therefore be better regarded as one of several predictors of cognitive maintenance in aging.
Another important consideration is that cognitive reserve refers to the deviation between
observed cognitive function and what is expected based on the degree of age- or disease related
brain changes [23]. Therefore, any measure of cognitive reserve needs to take into account the
disparity between observed cognitive performance and underlying brain structure. In line with
this, some efforts to improve measurements of this construct have defined cognitive reserve
as the residual variance in episodic memory, after adjusting for demographic variables and
structural MRI abnormalities [95]. This approach to characterizing cognitive reserve as model
‘residuals’ appears promising [96, 95]. For example, the residual term has been linked to risk
of conversion from mild cognitive impairment to dementia, and has been shown to modify the
relationship between brain atrophy and cognitive decline [95]. However, this body of evidence
has focused exclusively on a single cognitive domain (memory), and considered only a handful
of MRI markers of brain integrity, including global and hippocampal GM and WM hyperin-
tensities. While the present study proposes an approach that also takes into account model
residuals, the use of machine learning provides the advantage of integrating a substantially
greater number of MRI variables (1118 GM and 245 WM features), as well as a large body
of tests measuring performance across multiple cognitive domains. Brain-age prediction fur-
ther adds a dimension to cross-sectional MRI studies by capturing deviations from normative
aging trajectories identified by machine learning. By generating separate measures of brain
and cognitive maintenance, we are able to shed light on cognitive reserve mechanisms by (i)
examining the relationship between brain and cognitive maintenance, (ii) identifying discrep-
ancies between their associations with variables of interest, and (iii) mutually adjusting for
these variables in the same model. In this way, our approach may contribute to addressing
crucial questions in the aging field, including whether lifestyle factors predominately contribute
to brain maintenance or cognitive reserve in late life.
194.2. Favorable lifestyles are linked to higher brain maintenance
The extent to which brain maintenance and cognitive reserve form pathways between favor-
able lifestyles and cognitive maintenance in aging is currently unclear. More favorable lifestyles
between midlife and late life were weakly associated with higher brain maintenance in older
age. While this could suggest that prolonged engagement in protective health behaviors may
contribute to preserving the brain’s structure, the effect was small (β = -0.09) and decreased
after additional co-variates were entered, and it did not statistically differ from the (insignif-
icant) association between lifestyles and cognitive maintenance. While it is possible that a
larger data sample could help to better detect small effects of lifestyle trajectories on brain
and cognitive maintenance, the lack of significant findings could also be partly attributable to
the cross-sectional nature of the BAG and CAG estimates, which may not adequately capture
individual variation in cognitive and brain trajectories. Longitudinal assessments of BAG and
CAG may therefore potentially serve as more sensitive correlates of lifestyle factors. As the
present findings report only weak or minimal associations between lifestyle trajectories and
brain and cognitive maintenance, it is also likely that mediating factors may explain a larger
proportion of the individual variation in reserve and maintenance mechanisms, including ge-
netic variability [97], and the interactions between genes and environment. This perspective
is well demonstrated in Lourida et al. (2019, [41]), who found that favorable lifestyles were
linked to reduced dementia risk, specifically in individuals with a genetic risk of dementia. IQ
is also known as a heritable trait [98], and a possible genetic correlation between this trait
and cognitive reserve could indicate that the phenotypic relationship observed between these
factors could reflect common underlying genetic architecture [99]. Future studies may there-
fore consider integrating polygenic risk scores and genetic pleiotropy to further capture the
variance in CAG and BAG [99].
4.3. Strengths and Limitations
The multimodal MRI and detailed cognitive battery administered to most participants allowed
us to generate a large number of MRI and cognitive features to be used in the estimation of
brain/cognitive age. While it is possible that measurement error introduced by cognitive tests
may account for the reduced prediction accuracy of our cognitive model when compared to
the MRI-based predictions, re-running these analyses with latent factors did not substantially
modify the prediction accuracy of cognitive age. Although the brain age prediction model
20included a larger number of input features than the cognitive model, the accuracy measures of
the two models were similar when 20 PCA-transformed components were used as input for each
model. This discrepancy in prediction accuracy may thus reflect that the cognitive measures
were less related to chronological age compared to the MRI measures.
One main strength of this study is the longitudinal and repeat data available on lifestyle
indices (over a mean of 17 years), which was provided by a large and highly characterized
sample. However, only smoker status, alcohol intake, and physical activity were included in
the lifestyle indices, and a several other factors, including diet [41] and sleep patterns [100], may
form part of a healthy lifestyle. A more comprehensive characterization of lifestyle trajectories
could thus potentially increase their explanatory value. Furthermore, only 17.5% of the sample
were female, limiting the generalizability of the reported results. The generalizability of our
findings may also be restricted by a ’healthy volunteer effect’, as previously reported in the
WHII imaging sub-sample [83, 84]. Lastly, no causal conclusions can be drawn due to the
observational nature of the study.
5. Conclusion
In conclusion, this study describes a novel method for characterizing brain and cognitive main-
tenance relative to normative trajectories in aging. Using these dissociable metrics as outcomes
enables a direct measure of whether lifestyle behaviors contribute to brain maintenance or
cognitive reserve in late life. While we did not find strong evidence for associations between
lifestyle trajectories and brain and cognitive maintenance, the presented approach provides
a novel method for quantifying central concepts, which may be valuable for future studies
seeking to investigate factors underlying maintenance and reserve mechanisms in older age.
Acknowledgements
We thank all Whitehall II participants for their time. Work on the Whitehall II MRI sub-
study was funded by the “Lifelong Health and Wellbeing” Programme Grant: “Predicting
MRI abnormalities with longitudinal data of the Whitehall II Substudy” (UK Medical Research
Council: G1001354, PI: K.P.E), and the HDH Wills 1965 Charitable Trust (Nr: 1117747,
PI: K.P.E). While working on this study, the authors received funding from the Research
Council of Norway (AM.G.dL.; 286838, T.K.; 276082, L.T.W.; 273345, 249795, 223273), the
21South-East Norway Regional Health Authority (L.T.W.; 2015073, 2019107), the European Re-
search Council under the European Union’s Horizon 2020 research and innovation programme
(L.T.W.; 802998, E.Zs. and S.S.; 732592), UK Medical Research Council (M.K.; R024227,
S011676), the US National Institute on Aging (M.K.; R01AG062553) the Academy of Finland
(M.K.; 311492), the NIHR Oxford Health Biomedical Research Centre (N.F), UK Research
and Innovation (J.H.C.; MR/R024790/1), the Alzheimer’s Society (S.S.; Grant Number 441),
the Monument Trust Discovery Award from Parkinson’s UK (L.G.; J-1403), and the MRC
Dementias Platform UK (L.G.; MR/L023784/2).
22References
[1] C. Grady, The cognitive neuroscience of ageing, Nature Reviews Neuroscience 13 (2012)
491.
[2] I. J. Bennett, D. J. Madden, Disconnected aging: cerebral white matter integrity and
age-related differences in cognition, Neuroscience 276 (2014) 187–205.
[3] A. M. Fjell, M. H. Sneve, H. Grydeland, A. B. Storsve, K. B. Walhovd, The disconnected
brain and executive function decline in aging, Cerebral cortex 27 (2017) 2303–2317.
[4] A. M. Fjell, M. H. Sneve, A. B. Storsve, H. Grydeland, A. Yendiki, K. B. Walhovd,
Brain events underlying episodic memory changes in aging: a longitudinal investigation
of structural and functional connectivity, Cerebral cortex 26 (2016) 1272–1286.
[5] L. Nyberg, E. Dahlin, A. Stigsdotter Neely, L. Bäckman, Neural correlates of variable
working memory load across adult age and skill: Dissociative patterns within the fronto-
parietal network, Scandinavian journal of psychology 50 (2009) 41–46.
[6] A. M. Fjell, K. B. Walhovd, Structural brain changes in aging: courses, causes and
cognitive consequences, Reviews in the Neurosciences 21 (2010) 187–222.
[7] A. M. Fjell, L. McEvoy, D. Holland, A. M. Dale, K. B. Walhovd, A. D. N. Initiative,
et al., What is normal in normal aging? effects of aging, amyloid and alzheimer’s disease
on the cerebral cortex and the hippocampus, Progress in neurobiology 117 (2014) 20–40.
[8] L. Nyberg, M. Lövdén, K. Riklund, U. Lindenberger, L. Bäckman, Memory aging and
brain maintenance, Trends in cognitive sciences 16 (2012) 292–305.
[9] R. Cabeza, M. Albert, S. Belleville, F. I. Craik, A. Duarte, C. L. Grady, U. Lindenberger,
L. Nyberg, D. C. Park, P. A. Reuter-Lorenz, et al., Maintenance, reserve and compen-
sation: the cognitive neuroscience of healthy ageing, Nature Reviews Neuroscience 19
(2018) 701–710.
[10] A. C. S. Bråthen, A.-M. G. D. Lange, A. M. Fjell, K. B. Walhovd, Risk- and protective
factors for memory plasticity in aging, Aging, Neuropsychology, and Cognition 0 (2020)
1–17.
[11] E. Zsoldos, N. Filippini, A. Mahmood, C. E. Mackay, A. Singh-Manoux, M. Kivimäki,
M. Jenkinson, K. P. Ebmeier, Allostatic load as a predictor of grey matter volume and
white matter integrity in old age: The whitehall ii mri study, Scientific reports 8 (2018)
6411.
[12] M. Anatürk, N. Demnitz, K. Ebmeier, C. Sexton, A systematic review and meta-analysis
of structural magnetic resonance imaging studies investigating cognitive and social ac-
tivity levels in older adults, Neuroscience & Biobehavioral Reviews 93 (2018) 71–84.
[13] S. Sabia, A. Fayosse, J. Dumurgier, A. Schnitzler, J.-P. Empana, K. P. Ebmeier,
A. Dugravot, M. Kivimäki, A. Singh-Manoux, Association of ideal cardiovascular health
at age 50 with incidence of dementia: 25 year follow-up of whitehall ii cohort study, bmj
366 (2019) l4414.
23[14] C. K. Nyberg, A. M. Fjell, K. B. Walhovd, Level of body fat relates to memory decline
and interacts with age in its association with hippocampal and subcortical atrophy,
Neurobiology of Aging (2019).
[15] T. Gefen, E. Shaw, K. Whitney, A. Martersteck, J. Stratton, A. Rademaker, S. Wein-
traub, M.-M. Mesulam, E. Rogalski, Longitudinal neuropsychological performance of
cognitive superagers, Journal of the American Geriatrics Society 62 (2014) 1598.
[16] T. M. Harrison, S. Weintraub, M.-M. Mesulam, E. Rogalski, Superior memory and higher
cortical volumes in unusually successful cognitive aging, Journal of the International
Neuropsychological Society 18 (2012) 1081–1085.
[17] J. Yu, S. L. Collinson, T. M. Liew, T.-P. Ng, R. Mahendran, E.-H. Kua, L. Feng,
Super-cognition in aging: cognitive profiles and associated lifestyle factors, Applied
Neuropsychology: Adult (2019) 1–7.
[18] E. J. Rogalski, T. Gefen, J. Shi, M. Samimi, E. Bigio, S. Weintraub, C. Geula, M.-M.
Mesulam, Youthful memory capacity in old brains: anatomic and genetic clues from the
northwestern superaging project, Journal of cognitive neuroscience 25 (2013) 29–36.
[19] F. W. Sun, M. R. Stepanovic, J. Andreano, L. F. Barrett, A. Touroutoglou, B. C.
Dickerson, Youthful brains in older adults: preserved neuroanatomy in the default
mode and salience networks contributes to youthful memory in superaging, Journal
of Neuroscience 36 (2016) 9659–9668.
[20] N. Scarmeas, Y. Stern, Cognitive reserve and lifestyle, Journal of clinical and experi-
mental neuropsychology 25 (2003) 625–633.
[21] I. Driscoll, S. M. Resnick, J. C. Troncoso, Y. An, R. O’Brien, A. B. Zonderman, Impact
of alzheimer’s pathology on cognitive trajectories in nondemented elderly, Annals of
Neurology: Official Journal of the American Neurological Association and the Child
Neurology Society 60 (2006) 688–695.
[22] D. A. Snowdon, Healthy aging and dementia: findings from the nun study, Annals of
internal medicine 139 (2003) 450–454.
[23] Y. Stern, What is cognitive reserve? theory and research application of the reserve
concept, Journal of the international neuropsychological society 8 (2002) 448–460.
[24] Y. Stern, Cognitive reserve, Neuropsychologia 47 (2009) 2015–2028.
[25] M. J. Valenzuela, P. Sachdev, Brain reserve and cognitive decline: a non-parametric
systematic review, Psychological medicine 36 (2006) 1065–1073.
[26] M. J. Valenzuela, P. Sachdev, Brain reserve and dementia: a systematic review, Psy-
chological medicine 36 (2006) 441–454.
[27] Y. Stern, The concept of cognitive reserve: a catalyst for research, Journal of clinical
and experimental neuropsychology 25 (2003) 589–593.
24[28] J. H. Cole, R. E. Marioni, S. E. Harris, I. J. Deary, Brain age and other bodily ‘ages’:
implications for neuropsychiatry, Molecular psychiatry 24 (2019) 266–281.
[29] J. H. Cole, S. J. Ritchie, M. E. Bastin, M. V. Hernández, S. M. Maniega, N. Royle,
J. Corley, A. Pattie, S. E. Harris, Q. Zhang, et al., Brain age predicts mortality, Molecular
psychiatry 23 (2018) 1385–1392.
[30] M. L. Elliott, D. W. Belsky, A. R. Knodt, D. Ireland, T. R. Melzer, R. Poulton, S. Ram-
rakha, A. Caspi, T. E. Moffitt, A. R. Hariri, Brain-age in midlife is associated with
accelerated biological aging and cognitive decline in a longitudinal birth cohort, Molec-
ular Psychiatry (2019) 1–10.
[31] R. Boyle, L. Jollans, L. M. Rueda-Delgado, R. Rizzo, G. G. Yener, J. P. McMorrow,
S. P. Knight, D. Carey, I. H. Robertson, D. D. Emek-Savaş, et al., Brain-predicted age
difference score is related to specific cognitive functions: A multi-site replication analysis,
Brain Imaging and Behavior (2020) 1–19.
[32] T. Kaufmann, D. van der Meer, N. T. Doan, E. Schwarz, M. J. Lund, I. Agartz, D. Al-
næs, D. M. Barch, R. Baur-Streubel, A. Bertolino, et al., Common brain disorders are
associated with heritable patterns of apparent aging of the brain, Nature neuroscience
22 (2019) 1617–1623.
[33] J. Steffener, C. Habeck, D. O’Shea, Q. Razlighi, L. Bherer, Y. Stern, Differences between
chronological and brain age are related to education and self-reported physical activity,
Neurobiology of aging 40 (2016) 138–144.
[34] G. Livingston, A. Sommerlad, V. Orgeta, S. G. Costafreda, J. Huntley, D. Ames, C. Bal-
lard, S. Banerjee, A. Burns, J. Cohen-Mansfield, et al., Dementia prevention, interven-
tion, and care, The Lancet 390 (2017) 2673–2734.
[35] G. Zhong, Y. Wang, Y. Zhang, J. J. Guo, Y. Zhao, Smoking is associated with an in-
creased risk of dementia: a meta-analysis of prospective cohort studies with investigation
of potential effect modifiers, PloS one 10 (2015).
[36] J. Rehm, O. Hasan, S. Black, K. Shield, M. Schwarzinger, Alcohol use and dementia: a
systematic scoping review, alzheimer’s res, 2019.
[37] C. B. Guure, N. A. Ibrahim, M. B. Adam, S. M. Said, Impact of physical activity
on cognitive decline, dementia, and its subtypes: meta-analysis of prospective studies,
BioMed research international 2017 (2017).
[38] D. Cadar, H. Pikhart, G. Mishra, A. Stephen, D. Kuh, M. Richards, The role of lifestyle
behaviors on 20-year cognitive decline, Journal of aging research 2012 (2012).
[39] L. Clare, Y.-T. Wu, J. C. Teale, C. MacLeod, F. Matthews, C. Brayne, B. Woods,
C.-W. S. Team, et al., Potentially modifiable lifestyle factors, cognitive reserve, and
cognitive function in later life: A cross-sectional study, PLoS medicine 14 (2017).
[40] S. Sabia, H. Nabi, M. Kivimaki, M. J. Shipley, M. G. Marmot, A. Singh-Manoux, Health
behaviors from early to late midlife as predictors of cognitive function: The whitehall ii
study, American journal of epidemiology 170 (2009) 428–437.
25[41] I. Lourida, E. Hannon, T. J. Littlejohns, K. M. Langa, E. Hyppönen, E. Kuźma, D. J.
Llewellyn, Association of lifestyle and genetic risk with incidence of dementia, Jama 322
(2019) 430–437.
[42] J. H. Cole, Multi-modality neuroimaging brain-age in uk biobank: relationship to
biomedical, lifestyle and cognitive factors, Neurobiology of Aging (2020).
[43] S. M. Smith, L. T. Elliott, F. Alfaro-Almagro, P. McCarthy, T. E. Nichols, G. Douaud,
K. L. Miller, Brain aging comprises many modes of structural and functional change
with distinct genetic and biophysical associations, Elife 9 (2020).
[44] A.-M. G. de Lange, M. Anatürk, T. Kaufmann, J. H. Cole, L. Griffanti, E. Zsoldos,
D. Jensen, S. Suri, N. Filippini, A. Singh-Manoux, et al., Multimodal brain-age predic-
tion and cardiovascular risk: The whitehall ii mri sub-study, bioRxiv (2020).
[45] A. J. Gow, A. Pattie, I. J. Deary, Lifecourse activity participation from early, mid, and
later adulthood as determinants of cognitive aging: the lothian birth cohort 1921, The
Journals of Gerontology: Series B 72 (2017) 25–37.
[46] Y. Ben-Shlomo, R. Cooper, D. Kuh, The last two decades of life course epidemiology,
and its relevance for research on ageing, International Journal of Epidemiology 45 (2016)
973–988.
[47] L. J. Whalley, F. D. Dick, G. McNeill, A life-course approach to the aetiology of late-
onset dementias, The Lancet Neurology 5 (2006) 87–96.
[48] A. Topiwala, C. L. Allan, V. Valkanova, E. Zsoldos, N. Filippini, C. Sexton, A. Mahmood,
P. Fooks, A. Singh-Manoux, C. E. Mackay, et al., Moderate alcohol consumption as risk
factor for adverse brain outcomes and cognitive decline: longitudinal cohort study, bmj
357 (2017) j2353.
[49] J. Liao, C. Mawditt, S. Scholes, W. Lu, M. Umeda, G. Muniz Terrera, Y. Hao, S. Mejía,
Similarities and differences in health-related behavior clustering among older adults in
eastern and western countries: A latent class analysis of global aging cohorts, Geriatrics
& gerontology international 19 (2019) 930–937.
[50] N. Noble, C. Paul, H. Turon, C. Oldmeadow, Which modifiable health risk behaviours
are related? a systematic review of the clustering of smoking, nutrition, alcohol and
physical activity (‘snap’) health risk factors, Preventive medicine 81 (2015) 16–41.
[51] N. Filippini, E. Zsoldos, R. Haapakoski, C. E. Sexton, A. Mahmood, C. L. Allan, A. Top-
iwala, V. Valkanova, E. J. Brunner, M. J. Shipley, et al., Study protocol: the whitehall
ii imaging sub-study, BMC psychiatry 14 (2014) 159.
[52] M. Marmot, E. Brunner, Cohort profile: the whitehall ii study, International journal of
epidemiology 34 (2005) 251–256.
[53] A.-M. G. de Lange, T. Kaufmann, D. van der Meer, L. A. Maglanoc, D. Alnæs, T. Mober-
get, G. Douaud, O. A. Andreassen, L. T. Westlye, Population-based neuroimaging re-
veals traces of childbirth in the maternal brain, Proceedings of the National Academy
of Sciences (2019).
26[54] T. Kaufmann, D. van der Meer, N. T. Doan, E. Schwarz, M. J. Lund, I. Agartz, D. Al-
næs, D. M. Barch, R. Baur-Streubel, A. Bertolino, et al., Common brain disorders are
associated with heritable patterns of apparent aging of the brain, Nature Neuroscience,
In press (2019).
[55] M. F. Glasser, T. S. Coalson, E. C. Robinson, C. D. Hacker, J. Harwell, E. Yacoub,
K. Ugurbil, J. Andersson, C. F. Beckmann, M. Jenkinson, et al., A multi-modal parcel-
lation of human cerebral cortex, Nature 536 (2016) 171.
[56] B. Fischl, D. H. Salat, E. Busa, M. Albert, M. Dieterich, C. Haselgrove, A. Van
Der Kouwe, R. Killiany, D. Kennedy, S. Klaveness, et al., Whole brain segmentation:
automated labeling of neuroanatomical structures in the human brain, Neuron 33 (2002)
341–355.
[57] K. L. Miller, F. Alfaro-Almagro, N. K. Bangerter, D. L. Thomas, E. Yacoub, J. Xu, A. J.
Bartsch, S. Jbabdi, S. N. Sotiropoulos, J. L. Andersson, et al., Multimodal population
brain imaging in the uk biobank prospective epidemiological study, Nature neuroscience
19 (2016) 1523.
[58] S. M. Smith, T. E. Nichols, D. Vidaurre, A. M. Winkler, T. E. Behrens, M. F. Glasser,
K. Ugurbil, D. M. Barch, D. C. Van Essen, K. L. Miller, A positive-negative mode
of population covariation links brain connectivity, demographics and behavior, Nature
neuroscience 18 (2015) 1565.
[59] O. Voevodskaya, A. Simmons, R. Nordenskjöld, J. Kullberg, H. Ahlström, L. Lind, L.-
O. Wahlund, E.-M. Larsson, E. Westman, A. D. N. Initiative, et al., The effects of
intracranial volume adjustment approaches on multiple regional mri volumes in healthy
aging and alzheimer’s disease, Frontiers in aging neuroscience 6 (2014) 264.
[60] S. Mori, S. Wakana, P. C. Van Zijl, L. Nagae-Poetscher, MRI atlas of human white
matter, Elsevier, 2005.
[61] S. Wakana, A. Caprihan, M. M. Panzenboeck, J. H. Fallon, M. Perry, R. L. Gollub,
K. Hua, J. Zhang, H. Jiang, P. Dubey, et al., Reproducibility of quantitative tractography
methods applied to cerebral white matter, Neuroimage 36 (2007) 630–644.
[62] L. Griffanti, G. Zamboni, A. Khan, L. Li, G. Bonifacio, V. Sundaresan, U. G. Schulz,
W. Kuker, M. Battaglini, P. M. Rothwell, et al., Bianca (brain intensity abnormal-
ity classification algorithm): a new tool for automated segmentation of white matter
hyperintensities, Neuroimage 141 (2016) 191–205.
[63] D. Wechsler, Test of premorbid functioning. uk version (topf uk), UK: Pearson Corpo-
ration (2011).
[64] Z. S. Nasreddine, N. A. Phillips, V. Bédirian, S. Charbonneau, V. Whitehead, I. Collin,
J. L. Cummings, H. Chertkow, The montreal cognitive assessment, moca: a brief screen-
ing tool for mild cognitive impairment, Journal of the American Geriatrics Society 53
(2005) 695–699.
[65] D. Wechsler, Wechsler adult intelligence scale–fourth edition (wais–iv), San Antonio,
TX: NCS Pearson 22 (2008) 816–827.
27You can also read