Survival Rates and Capture Heterogeneity of Bottlenose Dolphins (Tursiops truncatus) in the Shannon Estuary, Ireland - Thünen-Institut: ...
←
→
Page content transcription
If your browser does not render page correctly, please read the page content below
ORIGINAL RESEARCH
                                                                                                                                           published: 30 March 2021
                                                                                                                                    doi: 10.3389/fmars.2021.611219

                                            Survival Rates and Capture
                                            Heterogeneity of Bottlenose
                                            Dolphins (Tursiops truncatus) in the
                                            Shannon Estuary, Ireland
                                            Kim E. Ludwig 1* † , Mags Daly 2 , Stephanie Levesque 2 and Simon D. Berrow 1,2
                                            1
                                             Marine and Freshwater Research Centre, Galway-Mayo Institute of Technology, Galway, Ireland, 2 Irish Whale and Dolphin
                                            Group, Kilrush, Ireland

                                            Adult survival is arguably the most important demographic parameter for long-lived
                                            species as it has a large impact on population growth, and it can be estimated
                             Edited by:     for cetacean populations using natural markings and mark-recapture (MR) modelling.
                          Mark Meekan,
 Australian Institute of Marine Science
                                            Here we describe a 26-year study of a genetically discrete, resident population of
                       (AIMS), Australia    bottlenose dolphins in the Shannon Estuary, Ireland, conducted by an NGO using
                         Reviewed by:       multiple platforms. We estimated survival rates (SRs) using Cormack-Jolly-Seber models
                         Vinay Udyawer,
                                            and explored the effects of variable survey effort, multiple researchers, and changes in
 Australian Institute of Marine Science
                       (AIMS), Australia    camera equipment as well as capture heterogeneity induced by changes in marks and
               Delphine Brigitte Hélène     site fidelity variation, all common issues affecting longitudinal dolphin studies. The mean
                             Chabanne,
          Murdoch University, Australia
                                            adult SR was 0.94 (±0.001 SD) and thus comparable to the estimates reported for other
                  *Correspondence:
                                            bottlenose dolphin populations. Capture heterogeneity through variation in mark severity
                        Kim E. Ludwig       was confirmed, with higher capture probabilities for well-marked individuals than for
             kim.ludwig@thuenen.de;
                                            poorly marked individuals and a “transience” effect being detected for less well-marked
          kimellen.ludwig@imbrsea.eu
                   † Present
                                            individuals with 43% only recorded once. Likewise, both SR and capture probabilities
                             address:
                        Kim E. Ludwig       were comparatively low for individuals with low site fidelity to the Shannon Estuary, and
    Thünen Institute for Sea Fisheries,     SR of these individuals additionally decreased even further toward the end of the study,
             Bremerhaven, Germany
                                            reflecting a terminal bias. This bias was attributed to non-random temporal migration,
                   Specialty section:       and, together with high encounter rates in Brandon Bay, supported the hypothesis of
         This article was submitted to      range expansion. Our results highlight the importance of consistent and geographically
                    Marine Megafauna,
               a section of the journal     homogenous survey effort and support the differentiation of individuals according to their
          Frontiers in Marine Science       distinctiveness to avoid biased survival estimates.
      Received: 28 September 2020
                                            Keywords: bottlenose dolphin (Tursiops truncatus), photo-identification, Cormack-Jolly-Seber models, survival
         Accepted: 08 March 2021
                                            rate, capture heterogeneity, non-random temporal migration, site fidelity
         Published: 30 March 2021
                             Citation:
     Ludwig KE, Daly M, Levesque S          INTRODUCTION
and Berrow SD (2021) Survival Rates
          and Capture Heterogeneity         For effective conservation of animal populations, regular assessment of demographic parameters
     of Bottlenose Dolphins (Tursiops
                                            such as population size and life history traits is essential (Berrow et al., 2012; Arso Civil et al., 2019).
  truncatus) in the Shannon Estuary,
  Ireland. Front. Mar. Sci. 8:611219.
                                            Population size over time is arguably the most frequently and relatively routine parameter assessed
   doi: 10.3389/fmars.2021.611219           and can be used to detect trends in population status. However, to understand the underlying cause

Frontiers in Marine Science | www.frontiersin.org                                 1                                           March 2021 | Volume 8 | Article 611219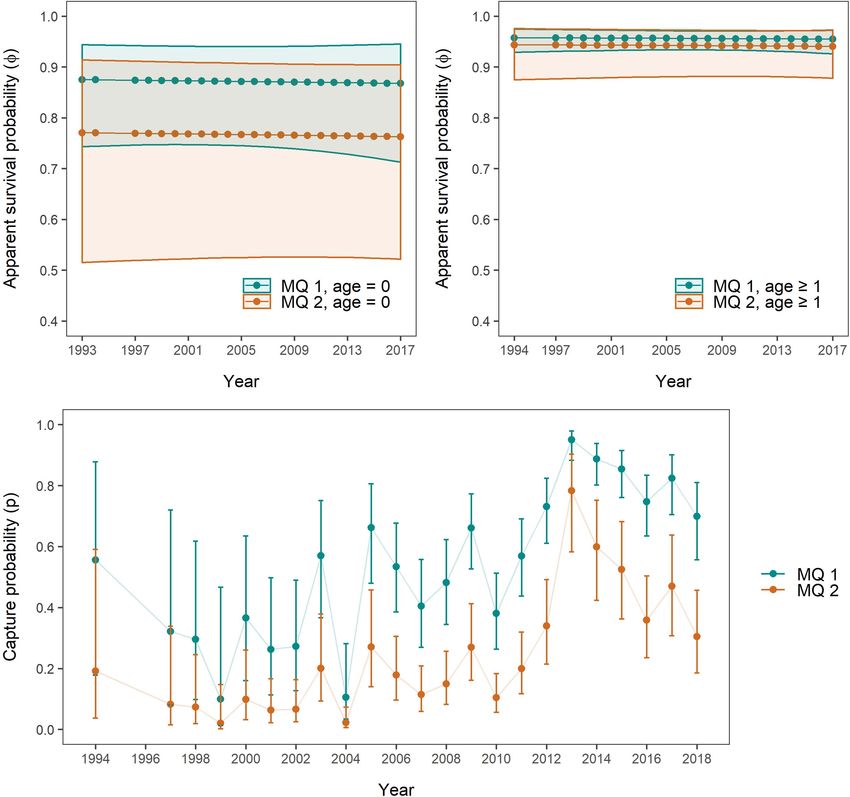
Ludwig et al.                                                                                              Survival Rates and Capture Heterogeneity

for any changes, information about those parameters driving               mark severity and image quality is routine now in cetacean
population size are required (Lindberg and Rexstad, 2002; Arso            photo-ID catalogues (Urian et al., 2015). To address migration,
Civil et al., 2019; Schleimer et al., 2019).                              individuals may be differentiated into groups corresponding to
    For long-lived species, adult survival in particular greatly          their site fidelity, which is especially useful in populations where
influences population growth rates (Prévot-Julliard et al., 1998;         some individuals have home ranges that exceed the study area
Fletcher et al., 2012). In cetaceans, which are highly mobile             (Schleimer et al., 2019).
and elusive animals (Pace et al., 2017), mark-recapture (MR)                  The Shannon Estuary is the largest estuarine system in Ireland
modelling has become well-established as tool to assess survival          and designated as Special Area of Conservation (SAC) under the
rates (SRs) (Currey et al., 2009; Pace et al., 2017; Bertulli             EU Habitats Directive (Council Directive 92/43/EEC) (European
et al., 2018; Arso Civil et al., 2019). After the reconstruction of       Council, 1992) to protect a resident and genetically distinct
encounter histories of individuals over time, MR-models allow             population of bottlenose dolphins (Berrow et al., 1996; Mirimin
for the estimation of both survival and capture probabilities             et al., 2011, NPWS, 2013). The population is relatively small (139
through maximum likelihood approaches (Lebreton et al., 1992;             individuals, 95% CI: 121–160; Rogan et al., 2018) and regular
Corkrey et al., 2008; Cooch and White, 2019a).                            monitoring is crucial to early detection of potential negative
    One frequently used model is the Cormack-Jolly-Seber                  trends (Blázquez et al., 2020). A MR study, funded by the
(CJS) open-population model that allows for the addition                  National Parks and Wildlife Service (NPWS), is carried out about
of individuals to the population over time as well as the                 every 2 years to fulfil EU reporting obligations, but focusses
removal of individuals through death and permanent emigration             entirely on estimating abundance (Englund et al., 2007, 2008;
(Cormack, 1964; Jolly, 1965; Seber, 1965; Hammond et al.,                 Berrow et al., 2012; Rogan et al., 2015, 2018). The only available
1990; Currey et al., 2009; Bertulli et al., 2018). However,               mortality estimate was carried out by Baker et al. (2018a), using
because CJS models estimate capture and survival probabilities            an approach which made assumptions about death rates based
across all individuals, accuracy is conditional on a set of               on the absence of sightings of individuals over a given number of
assumptions, namely that each individual (1) is uniquely marked           years (see also Wells and Scott, 1990). This approach, however,
and (2) is identified correctly during sampling occasions; (3)            is only valid where individuals show high site fidelity and have
no change or loss of marks occurs and (4) all individuals                 a high capture probability, which is not entirely the case for the
have the same capture probability within a sampling occasion              Shannon population.
(Lindberg and Rexstad, 2002; Urian et al., 2015).                             The longest running photo-ID catalogue for the Shannon
    The use of natural marks for the identification of individual         dolphin population was established in 1993 by the Irish Whale
cetaceans is well established (Würsig and Würsig, 1977;                   and Dolphin Group (IWDG), which has since conducted annual
Hammond et al., 1990; Gowans and Whitehead, 2001; Auger-                  photo-identification surveys (Berrow et al., 1996, 2012; Berrow,
Méthé et al., 2010). The most common type of marks used                   2009; Foley et al., 2010; Baker, 2017). From 2000 onward, data
in MR-studies are profile-changing injuries to the dorsal fin,            collection has been facilitated by the use of dolphin watching
including nicks and notches, which are persistent and visible from        tour boats as regular platforms of opportunity (Berrow and
either side of the fin. Yet, the use of natural markings and photo-       Holmes, 1999). However, survey effort and data quality have
ID also does have limitations, which can lead to the violation of         varied greatly between years with the availability of funding,
CJS model assumptions.                                                    equipment, and personnel. In 2005, the IWDG also established
    Correct identification depends on two factors: mark severity          the Irish Coastal Bottlenose Dolphin Catalogue (ICBDC) with
(i.e., the degree of “uniqueness” of the marking pattern)                 data collected from outside the estuary, largely by volunteers
and photographic quality of the image (Urian et al., 2015;                through opportunistic sightings (O’Brien et al., 2009; Vialcho
Blázquez et al., 2020). A poorly marked individual, or several            Miranda, 2017).
individuals that share similar marking patterns, have a higher                Since 2008, surveys have been carried out in Brandon and
risk of being misidentified than a highly and uniquely marked             Tralee Bays adjacent to the Shannon Estuary, which are part
individual (e.g., Whitehead and Wimmer, 2005). Likewise,                  of the home range of some Shannon dolphins (Ryan and
equal capture probability (assumption 4) is rarely the case in            Berrow, 2013; Levesque et al., 2016). To obtain reliable survival
cetaceans as they are highly mobile, with individuals transiting or       estimates for this population, it is therefore necessary to account
migrating from one population, or area, to another (Speakman              for variations in individual capture availability in the Shannon
et al., 2010; Pace et al., 2017; Bertulli et al., 2018). CJS              Estuary and the possibility of migration. In this study, we estimate
models make no distinction between mortality and permanent                SRs for the Shannon bottlenose dolphin population for the period
emigration, meaning that survival estimates actually reflect              1993 to 2018, using the IWDG photo-ID catalogues and MR-
“apparent survival” (i.e., survival and stay in the study area).          modelling.
In populations where transience or migration occurs, failure to
account for it will lead to negatively biased survival estimates,
as migrating individuals have lower capture probabilities than            MATERIALS AND METHODS
truly residential individuals (Kendall et al., 1997; Pradel et al.,
1997; Fletcher et al., 2012). Different approaches have been              Study Area
suggested to incorporate variation in identifiability and migration       The Shannon Estuary on the west coast of Ireland stretches
as sources of heterogeneity into MR-models. Stratification by             about 100 km from the city of Limerick to Kerry Head, Co.

Frontiers in Marine Science | www.frontiersin.org                     2                                      March 2021 | Volume 8 | Article 611219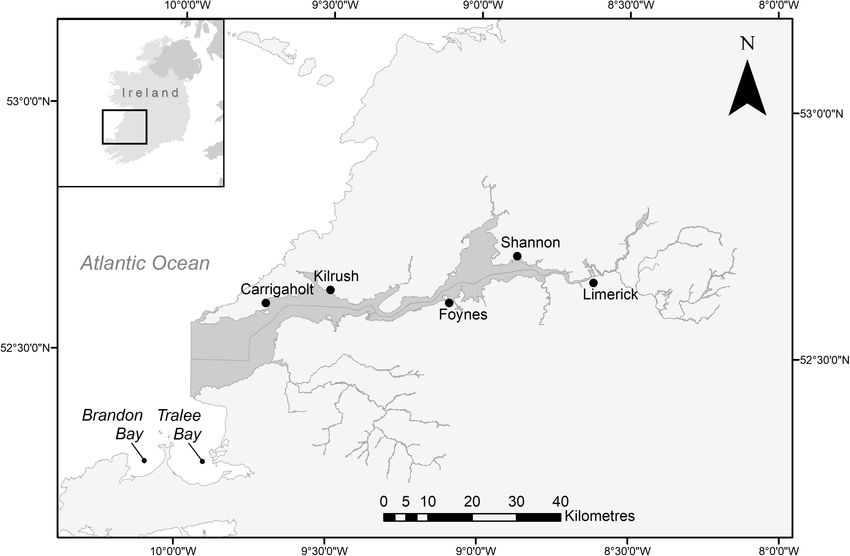
Ludwig et al.                                                                                               Survival Rates and Capture Heterogeneity

Kerry, and Loop Head, Co. Clare, where the River Shannon                  curators, a comparatively high number of misidentifications
enters the Atlantic Ocean (52◦ 300 N and 9◦ 560 W; Figure 1). It          occurred especially during the period from 2003 to 2009. The
was designated as Lower River Shannon SAC (Site Code: 00216)              retrospective approach of this study allowed for the detection and
in 2000 and lists six species as qualifying interests, including          correction of such cases.
bottlenose dolphins (NPWS, 2013). Tralee and Brandon Bays,                    Metadata on images from the initial years of the study
Co. Kerry, are adjacent to each other about 30 km south of the            period were often incomplete, motivating the choice of CJS over
mouth of the Shannon.                                                     alternative models with higher data requirements. To obtain a
                                                                          homogenous dataset for MR modelling, encounter histories were
Photo-ID Surveys                                                          reconstructed as presence/absence of individual dolphins per
Data were collected between 1993 and 2018, by the IWDG                    calendar year. Due to a relatively short sampling season per year
(Berrow et al., 1996; Berrow, 2009; Foley et al., 2010; Baker,            (June–August), this approach allowed for sufficiently long inter-
2015, 2017; Barker and Berrow, 2016; Levesque et al., 2016;               sampling intervals, and had been applied in comparable studies
Baker et al., 2018a,b) as well as the NPWS in 2010, 2015, and             (Corkrey et al., 2008; Currey et al., 2009; Schleimer et al., 2019).
2018 (Berrow et al., 2012; Rogan et al., 2015, 2018). Except                  After validation, the best image per dolphin per year and
for 1995 and 1996, dedicated research surveys were conducted              area was selected as reference for the construction of encounter
annually by the IWDG using a 6 m rigid-hulled inflatable boat             histories. Considering the assumption of equal identifiability of
(RIB). Images were taken from a perpendicular angle to each               individuals in CJS-modelling, three classes of mark distinctness
animal in order to capture the lateral (left or right) side of the        were defined (see also Ingram, 2000; Berrow et al., 2012; Urian
dorsal fin (e.g., Baker et al., 2018a). The exact effort in terms         et al., 2015; Sprogis et al., 2016; Bertulli et al., 2018). Due to the
of number of trips, spatial and temporal extent and the time              long-term nature of this study, we only considered permanent,
of year of surveys depended on the specific research objectives,          profile-changing marks to the dorsal fin as qualifying mark
sea-state and weather conditions, available funding and resources         types (Table 1). Images with dolphins classified as MQ-3 were
(personnel and equipment). Therefore, survey effort varied over           excluded from the study, as the risk of misidentification was
the years. Since 2000, dolphin watching tour boats have provided          regarded too high.
platforms of opportunity between May and September, with two                  Images were furthermore stratified based on their
operators visiting different stretches of the estuary and therefore       photographic quality (Table 1), as this factor can affect
resulting in a good spatial coverage (Berrow and Holmes, 1999;            correct identification (Wilson et al., 1999; Urian et al., 2015). All
Berrow and Ryan, 2009).                                                   PQ-3 images were excluded from the analysis. For highly marked
    In Brandon and Tralee Bays (abbreviated in further text as            dolphins, both high and medium quality images were used, while
“Brandon”), photo-ID data was collected in the years 2008,                moderately marked dolphins were only confidently identifiable
2009, and 2015 during opportunistic sightings. In 2013, the first         on PQ-1 images (see also Hupman et al., 2018). All qualifying
dedicated surveys were conducted in the area (Levesque et al.,            images were used to reconstruct encounter histories for dolphins
2016), and few dedicated surveys have been carried out each               in the population, resulting in a binary dataset with “1” indicating
year since 2016 by the IWDG. The ICBDC was established in                 presence and “0” indicating absence in a given year.
2005 (O’Brien et al., 2009) with images acquired every year since.            To address potential capture heterogeneity between highly
Photographs and data were predominantly (∼95%) collected by               and moderately marked individuals as well as between
citizen scientists during opportunistic sightings. All information        individuals using Brandon/Tralee Bays and those who stay
was validated before including it in the catalogue and database           within the Shannon Estuary, separate MR models with grouping
(Vialcho Miranda, 2017).                                                  variables for either mark severity (=Mark Severity model) or site
    Between 1993 and 2005, analogue cameras of the models                 fidelity (=Site Fidelity model) were fitted. The categorisation of
Canon EOS 50 SLR and Canon EOS RT were used for photo-                    individuals by mark severity was based on the severity state that
ID work, with images being printed on film and slides (Berrow             they had been observed in for the majority of time since their first
et al., 1996; Berrow, 2009). In 2005, the transition to digital           encounter (see Supplementary Material for details). Individuals
photography was made and since then SLR Canon cameras                     that had spent equal amounts of time in each mark severity class
including EOS 20D, 50D, 7Dii, 5D have been used for photo-                were excluded from the Mark Severity model.
ID (Baker et al., 2018b). Lenses varied between 200 and 500 mm                To create categories for site fidelity, the sighting rates of each
auto-focus telephoto (Berrow, 2009), 70–200 mm f2.8USM and                individual in Brandon Bay, the Shannon Estuary and overall
f3.0 300 mm (Berrow et al., 2012), 70–300 mm auto-focus and               were calculated. Based on these sighting rates, an Agglomerative
200–500 mm lenses (Berrow et al., 1996; Baker et al., 2018b).             Hierarchical Cluster (AHC) analysis was performed in R (R Core
                                                                          Team, 2019), following Schleimer et al. (2019) and Zanardo et al.
Data Management                                                           (2016) (details in Supplementary Material). The R packages
Throughout the study period, matching of new images to the                dendextend (Galili, 2015), ggdendro (de Vries and Ripley, 2016),
existing catalogues occurred immediately after data collection            and plot3D (Soetaert, 2019) were used for visualisation of the
(Berrow et al., 1996, 2012, Baker et al., 2018a). Since 2013,             dendrogram and the clustering along the sighting rate axes.
validation of matches was carried out by two or three                     To understand whether individuals were equally distributed
independent researchers (Baker et al., 2018a), however due                across site fidelity and mark severity classes, a χ2 -test of
to a high turnover rate of research assistants and catalogue              independence was conducted.

Frontiers in Marine Science | www.frontiersin.org                     3                                       March 2021 | Volume 8 | Article 611219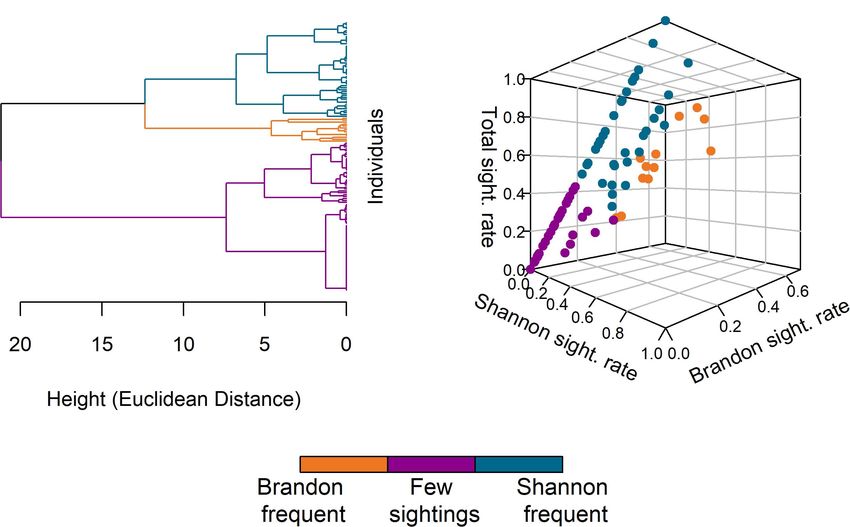
Ludwig et al.                                                                                                                Survival Rates and Capture Heterogeneity

  FIGURE 1 | Map of the lower river shannon special area of conservation (dark grey). The line dividing the estuary horizontally marks the county border between Co.
  Clare (North) and Co. Kerry (South). Tralee- and Brandon Bays are indicated to the southwest. Geospatial Data Sources: Ireland Ordnance Survey (Settlements
  Data), DIVA-GIS (Country Boundary Data), National Parks and Wildlife Service (SAC Boundary Data).

TABLE 1 | Definitions of quality classes for mark distinctness (mark quality = “MQ”)       For incorporation into the MR models, the number of photo-
and photographic quality (=“PQ”), reaching from high (=“1”) to low (=“3”).
                                                                                           ID trips was expressed as count variable effort while changes
Mark distinctness                         Photographic quality                             in photo-equipment (=photo) and years with/without Brandon
                                                                                           surveys (=Brandon) were translated into binary variables (photo-
MQ-1:      Individual has at least 2        PQ-1:      Focussed, good light                equipment: analogue = “0,” digital = ”1”; Brandon/Tralee surveys:
           distinct, permanent marks                   conditions, perpendicular
                                                                                           none = “0,” one or more = ”1”).
           (notches) in the dorsal fin.                to dolphin, close distance.
MQ-2:      Individual has one distinct,     PQ-2:      Focussed to slightly blurry,
           permanent mark, and/or                      intermediate light
           some small nicks.                           conditions, slightly angled,
                                                                                           Mark-Recapture Modelling
                                                       more distant.                       The R package R2ucare (Gimenez et al., 2018b), an R-version
MQ-3:      Individual has only temporal     PQ-3:      Out-of-focus, bad light             of the software U-CARE (Choquet et al., 2009), was used
           marks or none at all.                       conditions, highly angled,          to assess goodness-of-fit (GOF) of the data for a time-
                                                       far distance.                       dependent CJS model. Lack of fit was indicated for the overall
All dolphins and images used in the analysis were categorised for each variable and        dataset by component Test 2.CT (χ2 = 36.34, df = 21,
stratified accordingly.                                                                    P = 0.02), pointing out trap dependence (Gimenez et al., 2018b).
                                                                                           Accordingly, the starting model for overall survival assessment
                                                                                           (Overall Survival model) was generalised by adding a time-
   Survey effort was reconstructed as number of trips per year                             varying trap-dependence covariate td for capture probability
and area, which was considered to be the best available proxy,                             estimation (φ t , pt∗ td ). This variable was computed by creating
since the details recorded for each trip varied over the years. Due                        binary dummy variables for each individual per year, with
to large variation in annual survey effort, the number of photo-                           “1” indicating capture of the individual at the previous
ID surveys was considered a potential covariate affecting capture                          sampling occasion and “0” indicating apparent absence of the
probability over time. Likewise, the transition from analogue to                           individual in the previous year (Lebreton et al., 1992; Gimenez
digital photography with advances in storage capacity and image                            et al., 2018b; Cooch and White, 2019b; Laake and Rexstad,
quality, as well as the extension of survey effort to Brandon                              2019, p. 1026; Schleimer et al., 2019). Additionally, GOF-
and Tralee Bays were examined as covariates. The relationship                              component Test 3.SM was significant (χ2 = 41.65, df = 19,
between the number of surveys and number of individuals                                    p = 0.002), and therefore the later fitted models were corrected
encountered was assessed by simple linear regression analysis.                             for overdispersion.

Frontiers in Marine Science | www.frontiersin.org                                      4                                       March 2021 | Volume 8 | Article 611219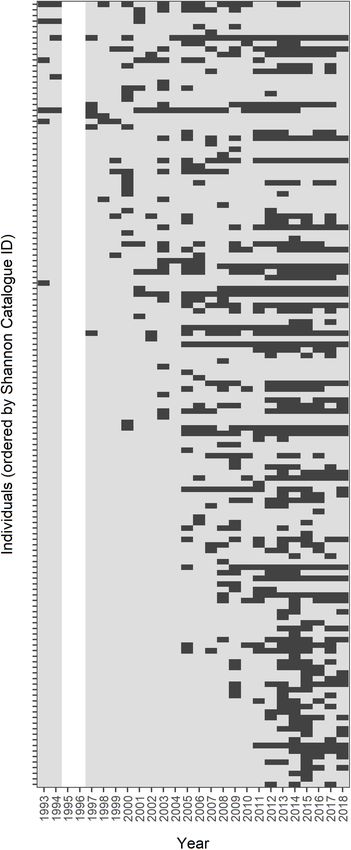
Ludwig et al.                                                                                              Survival Rates and Capture Heterogeneity

     During GOF-testing for the Mark Severity model, Test 3.SR for          models by summarising the Akaike weights of all candidate
group MQ-1 could not be fitted without returning an error. This             models in which the respective covariate was included (Burnham
component indicates the presence of transience, and to account              and Anderson, 2002b). Finally, the parameter estimates for φ
for a potentially undetected transience effect, an age model was            and p were averaged to account for model selection uncertainty
fitted as starting model, with survival after initial sightings being       (Cooch and White, 2019b). Model averaged outcomes of all
separated from survival after subsequent sightings (φ t/t , p t )           survival models were visualised using the packages ggplot2
(Bertulli et al., 2018; Cooch and White, 2019c). Age, in this case,         (Wickham, 2016), and egg (Auguie, 2019) in R.
referred to “time since first encounter” rather than reflecting
true age of animals. For the Site Fidelity groups, no lack of fit
was detected by the GOF-test components. The results of the                 RESULTS
GOF-tests can be found in Supplementary Tables 1–3.
     All MR models were fitted using the create.model.list()                Encounter histories of 141 individual bottlenose dolphins, all
function of the R package RMark (Laake, 2013), which                        classified as either MQ-1 or MQ-2, were reconstructed to
automatically creates and runs an exhaustive list of models based           determine SRs for the Shannon population. Additional sighting
on the parameter definitions that are specified for φ (survival             information from Brandon/Tralee Bays and the ICBDC were
probability) and p (capture probability). For all three models              used to address gaps in encounter histories. The number of
(Overall Survival, Site Fidelity, Mark Severity), the survival              surveys in the Shannon Estuary varied considerably between
parameter φ was defined as either staying constant over time                years ranging from only two RIB surveys in 2004 to a combined
(.), varying by sampling occasions (t) or following a temporal              102 surveys in 2016 from both research RIB and commercial
trend (T). The difference between t and T is that t considers               dolphin watching vessels (Figure 2). The median annual effort
each sampling occasion independent from the foregoing and                   was 40 surveys. In Brandon and Tralee Bays, photo-ID data
following occasions, while T assumes a directional trend across all         collection from both opportunistic and dedicated opportunities
sampling occasions. In the Site Fidelity model, φ was additionally          was limited to the years 2008/2009, 2013, and 2015–2018
defined to vary by site fidelity group (Site), while in the Mark            (Figure 2), however data from 2015 was not included in
Severity model, both a mark severity group effect (MQ) and                  this study due to low photographic quality (all PQ-3). The
an age effect (t/t) were included. To assess the drivers of                 highest number of dedicated surveys (eight) occurred in 2013,
capture probabilities, p in all three models was defined as                 two surveys in 2017 and one each in 2016 and in 2018. In
constant (.), varying by sampling occasion (t), or varying by               coastal waters, outside of both Shannon Estuary and Brandon,
the covariates effort, photo, or Brandon. Additionally, the trap            five opportunistic encounters with Shannon individuals were
dependence covariate (td) was included in the Overall Survival              recorded; three encounters in 2017 and one encounter each in
and Site Fidelity models in order to compare potential drivers              2012 and 2018 (Figure 2). The total number of encounters with
of capture heterogeneity (true trap dependence or variation in              bottlenose dolphins in coastal waters in general between 2005 and
site fidelity). The Mark Severity model was run on a reduced                2018 was 225, with a median of 13.5 encounters per year (Range:
dataset due to categorisation issues with individuals of equal              2–33 encounters).
observation time in MQ-1 and MQ-2 state, and therefore a
direct comparison with the other two models was not attempted.              Encounter Histories
All possible combinations of additive and interaction effects               For the reconstruction of encounter histories, 750 images were
between covariates were explored [e.g., (φ t + MQ ) or (p                   compiled: 682 (90.9%) from the Shannon Catalogue, 63 (8.4%)
                                                         ∗
td∗ effort ), with (+) indicating additive models and ( ) indicating        from Brandon/Tralee Bays and five (0.7%) from the ICBDC.
interaction models] (see Supplementary Material for more                    Some individuals were sighted in more than one area in given
detailed model descriptions).                                               years, however since our encounter history data did not capture
     To correct the Overall Survival models for overdispersion, the         this redundancy and only recorded “presence” in such a case,
Variance Inflation Factor ĉ (sum of Pearson’s χ2 -test statistics          the final dataset included only 716 sightings across all sampling
divided by the sum of their degrees of freedom) was adjusted                occasions, individuals and areas (Figure 3). Of these, 580 images
using the adjust.chat() function in RMark. Standard errors and              (81%) were of significant fin marks (MQ-1) while 136 images
confidence intervals were also adjusted. Due to the resulting               (19%) depicted less significant mark patterns (MQ-2). The
transformation of AICc’s into QAICc’s, the latter were used                 categorisation of individuals by mark distinctiveness resulted in
to identify the most parsimonious model, together with the                  92 MQ-1 individuals and 47 MQ-2 individuals. The remaining
QAIC weights, while the best fitting models for Site Fidelity               two individuals could not be classified confidently, having been
and Mark Severity were determined based on AICc values                      sighted two times each, the first time as MQ-2 and the second
and Akaike weights. For all three model sets, the three most                time as MQ-1. They were excluded from the dataset for the Mark
parsimonious candidate models were identified and compared by               Severity models. In total, 35 individuals with only one sighting
calculating the evidence ratio, i.e., the ratio between the Akaike          over the whole period were recorded, 20 of which were MQ-2
weights, indicating how much better one model explains the data             and the remaining 15 MQ-1.
compared to the other (Burnham and Anderson, 2002a).                           A significant positive relationship (b = 0.628, t = 8.205,
     The relative importance of each covariate in estimating φ and          df = 22, p < 0.001) and regression function [F(1,22) = 67.33,
p was assessed for Overall Survival, Site Fidelity and Mark Severity        p < 0.001; R2 = 0.754 (Supplementary Figure 1)] between

Frontiers in Marine Science | www.frontiersin.org                       5                                    March 2021 | Volume 8 | Article 611219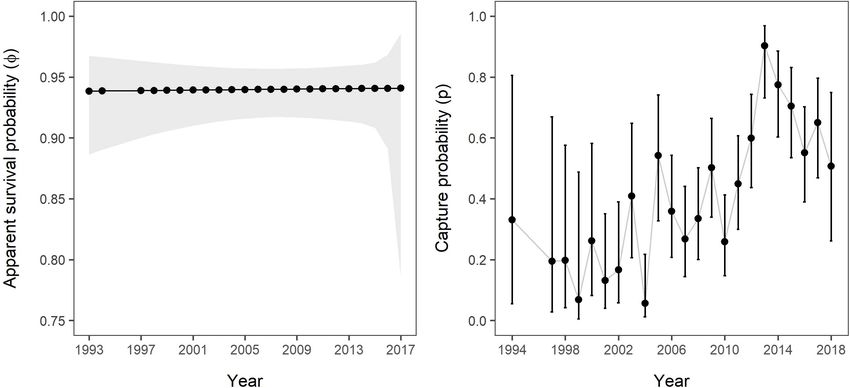
Ludwig et al.                                                                                                           Survival Rates and Capture Heterogeneity

  FIGURE 2 | Number of surveys, both dedicated and opportunistic, with photo-ID data collection per annum and per area (Brandon/Tralee Bays, Coastal, Shannon
  Estuary). No surveys were conducted in 1995 and 1996, resulting in the complete absence of photo-ID data from these years. All encounters in Brandon Bay in
  2008/2009 and 2015 were opportunistic. Coastal encounters were entirely opportunistic and only counted when Shannon dolphins were part of the encountered
  group.

the total number of individuals encountered each year and the                      fidelity and a temporal trend on survival (Site∗ T), meaning that
number of dedicated and opportunistic sightings were found.                        survival trends differed between the three groups (Table 2).
                                                                                   Capture probability varied with an additive effect of site fidelity
Site Fidelity AHC Analysis                                                         and sampling occasion (t), with each of the groups having
The AHC analysis resulted in a dendrogram with a Cophenetic                        different capture probabilities while the overall variation across
Correlation Coefficient (CCC) of 0.75, which was considered                        time was parallel between the groups. This model, which had a
acceptable, as the clustering solution seemed reasonable for the                   conditional probability of 0.76, was the best model among the
classification of individuals by site fidelity. The most supported                 candidates and had an evidence ratio as high as 4.4, making it
ideal number of clusters was three (Figure 4A) with one                            more than four times as likely to be the best model than the
cluster (n = 13, “Brandon frequent”) comprising individuals with                   second one in the ranking. All other candidate models had a
comparatively high sighting rates in Brandon Bay, a second                         lower likelihood (Supplementary Table 5).
cluster (n = 78, “Few sightings”) including individuals with few                       For Mark Severity, the comparison between candidate models
total sightings (max. number of sightings = 8) and the third                       was less conclusive (Table 2). Between first and second most
cluster (n = 50, “Shannon frequent”) containing individuals with                   parsimonious model, which had identical covariates and only
a high sighting rate in the Shannon Estuary and none or few                        differed in one addition/interaction term (MQ + t/t vs. MQ ∗
sightings in Brandon Bay (Figure 4B).                                              t/t), the evidence ratio was 1.02. Capture probability in both
                                                                                   models was explained by the additive effect of mark severity and
Cormack-Jolly-Seber Models                                                         time (MQ + t), showing a parallel variation between the two
In total, 78 candidate models were run for the Overall Survival                    mark severity groups over time, while survival was affected by
model, 120 candidate models were fitted for the Site Fidelity                      mark severity (MQ) and age class (t/t). Only the relationship
model and 210 candidate models were compared for the Mark                          between mark severity and age class was additive in one model
Severity model. The most parsimonious model for Overall                            and interactive in the other. The evidence ratios between the first
Survival suggested that survival was constant over time, while                     and second compared to the third model were 2.28 and 2.24,
capture probability varied in response to an additive effect of                    respectively, indicating that each of the models was more than
trap dependence and time (Table 2 and Supplementary Table 4).                      twice as likely as the third model, and all other candidate models
The Akaike weight was 0.731 out of 1, thus the probability that                    had a lower likelihood (Supplementary Table 6).
this model was the best one out of the candidate model list was
high (Wagenmakers and Farrell, 2004). The evidence ratio was                       Overall Survival
2.9 between first and second most parsimonious model, making                       Following an information theoretic approach, the relative
the most parsimonious model almost three times as likely to be                     importance of each covariate in influencing the estimation of
the best fit than the second model in the ranking.                                 survival (φ) and encounter (p) parameters was assessed (Table 3
   Among the candidate models for Site Fidelity, the most                          and Supplementary Table 7). For the Overall Survival model, the
parsimonious model incorporated an interaction between site                        most supported influencing factor was constancy over time (sum

Frontiers in Marine Science | www.frontiersin.org                              6                                          March 2021 | Volume 8 | Article 611219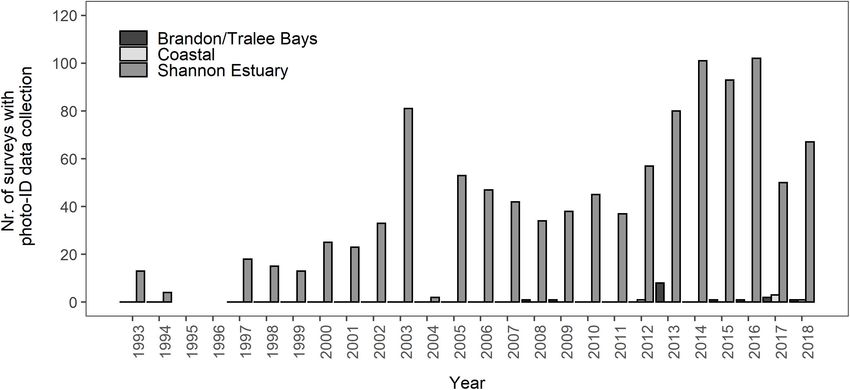
Ludwig et al. Survival Rates and Capture Heterogeneity
effect of these two factors had the strongest support among all
possible relationships of all included covariates (Ak = 0.983).
The three covariates effort, photographic equipment change
(photo), and years with/without Brandon Bay surveys (Brandon)
contributed little to capture probability estimation (Ak = 0.014,
0.003, and 0.002, resp.).
The estimated apparent SRs showed slight variation over
time despite strong support for constancy (Figure 5A), varying
between 0.938 (95% CI: 0.887–0.967) in 1993/1994 and 0.941
(95% CI: 0.785–0.986) in 2017/2018. The mean across all 23
available estimates was 0.94 (±0.001 SD). Estimates for capture
probability showed strong variation over time (Figure 5B), with
the lowest estimate in 2004 (=0.056, 95% CI: 0.013–0.218) and the
highest in 2013 (=0.903, 95% CI: 0.732–0.969). Median capture
probability across all sample occasions was 0.359, meaning that
in 50% of the study period 36% or less of the marked population
were recorded. Both apparent survival and capture probability
estimates showed a similar pattern with regards to precision.
Site Fidelity
The relative importance of covariates in the Site Fidelity model
was in line with the most parsimonious model (Table 4 and
Supplementary Table 8). Site fidelity group effect (Site) was
strongly supported (Ak = 1), and support for a temporal trend
(T), thus a directional trend in SR over time, was almost equally
strong (Ak = 0.932). The interaction term between the two factors
received greater support than an additive effect (Ak = 0.76 and
0.172, resp.). For capture probability, an additive effect between
Site and t was most supported (Ak = 0.999), while each of the
factors on itself had an Ak = 1 (see Table 4). Trap dependence
(td) as an alternative explanatory variable received virtually no
support (Ak < 0.001), neither did the variables effort, photo, and
Brandon (Supplementary Table 8).
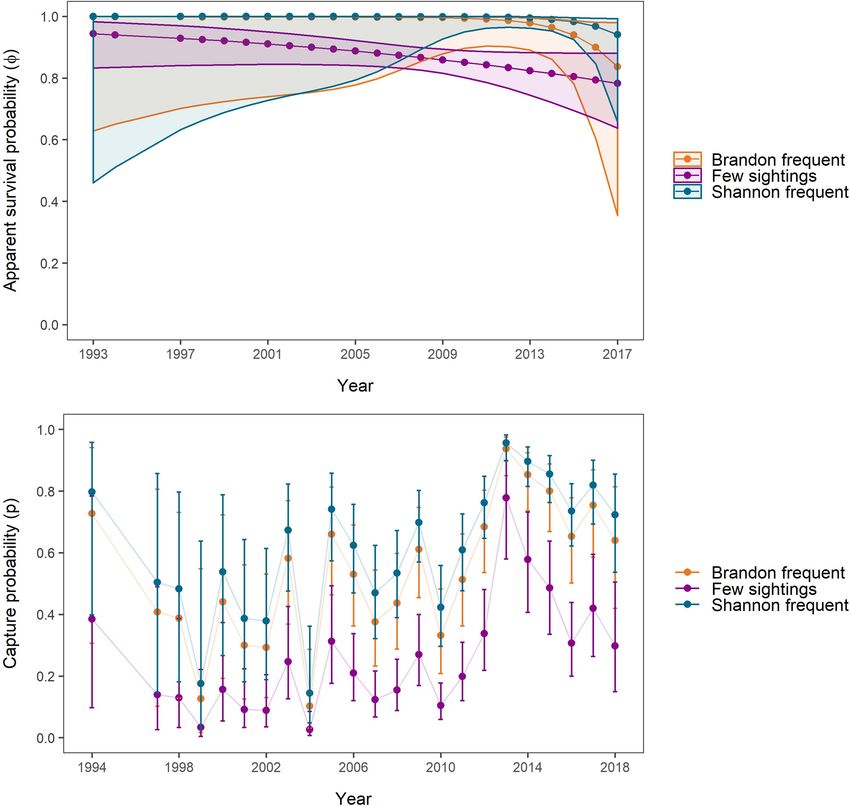
The model-averaged apparent survival estimates of “Brandon
frequent” and “Shannon frequent” individuals were significantly
higher than those of individuals with few sightings during the
period 2009 to 2015 (“Shannon frequent”) and 2010 to 2013
(“Brandon frequent”) (Figure 6A). No significant difference
was found in apparent SRs between “Shannon frequent” and
“Brandon frequent.” Between 1993 and 2017, apparent SRs
declined from 0.999 (95% CI: 0.629–1) to 0.836 (95% CI: 0.354–
0.979) for “Brandon frequent” individuals. They decreased from
0.944 (95% CI: 0.833–0.982) to 0.783 (95% CI: 0.637–0.881)
for individuals with “Few sightings” and from 0.9997 (95% CI:
0.461–1) to 0.941 (95% CI: 0.658–0.992) for “Shannon frequent”
individuals. However, while the decline was relatively linear
for “Few sightings” individuals, survival was stable and close
to 1 in the other two groups until 2008 (“Brandon frequent”)
FIGURE 3 | Encounter histories of 141 Shannon bottlenose dolphins, ordered
by their ID-codes in the Shannon Catalogue. Each row represents the
and 2012 (“Shannon frequent”), before starting to decline. The
encounter history of one individual, dark-grey rectangles represent “presence” negative trend indicated by the most parsimonious model was not
while light-grey rectangles represent “absence.” The blank cells for 1995/1996 significant in any of the three groups (Figure 6A).
indicate absence of data for these years. The highest capture probabilities for all groups were achieved
in 2013 [“Brandon frequent” = 0.937 (95% CI: 0.851–0.975);
“Few sightings = 0.778 (95% CI: 0.58–0.899); “Shannon
of Akaike weights (Ak) = 0.743), while, for capture probability, frequent” = 0.957 (95% CI: 0.898–0.982)], which coincided with
trap dependence (td) and time (t) were almost equally well one of the years with high survey effort (Figure 6B). The
supported (Ak = 0.993 and 0.987, respectively). Also, the additive lowest estimates for all groups were obtained for 2004, when
Frontiers in Marine Science | www.frontiersin.org 7 March 2021 | Volume 8 | Article 611219Ludwig et al. Survival Rates and Capture Heterogeneity
FIGURE 4 | Results of the agglomerative hierarchical cluster analysis. (A) The dendrogram of individual dolphins as obtained based on their sighting rates in
Brandon/Tralee Bays, the Shannon Estuary and overall sightings. Euclidean distance was used as measure for the distance between individuals. (B) 3D-visualisation
of the three clusters obtained after truncation of the dendrogram. The axes represent the three sighting rates (Shannon, Brandon, and Total). The groups identified
are “Brandon frequent” (orange, n = 13), “Few sightings” (purple, n = 78), and “Shannon frequent” (blue, n = 50).
TABLE 2 | Summary of the first three most parsimonious candidate models as obtained for each of the three modelling approaches, ranked by (Q)AICc.
Model QAICc 1 QAICc Akaike weight QDeviance ĉ No. of parameters
Overall (ϕ., ptd + t) 1037.557 0 0.731 985.554 1.556 25
(ϕT , ptd + t) 1039.685 2.128 0.252 985.518 1.556 26
(ϕ., ptd + effort ) 1047.319 9.762 0.006 1039.259 1.556 4
Model AICc 1 AICc Akaike weight Deviance ĉ No. of parameters
Site Fidelity (ϕ Site ∗ T, pSite + t) 1404.735 0 0.759 1051.346 1 31
(ϕ Site + T, pSite + t) 1407.705 2.970 0.172 1058.704 1 29
(ϕ Site , pSite + t) 1410.005 5.270 0.054 1063.187 1 28
Mark Severity (ϕ MQ + t/t , pMQ + t) 1501.451 0 0.346 1056.512 1 27
(ϕ MQ ∗ t/t , pMQ + t) 1501.489 0.038 0.340 1054.371 1 28
(ϕ t/t , pMQ + t) 1503.092 1.640 0.152 1060.323 1 26
The models are expressed as combinations of survival (“ϕ”) and capture probability (“p”) parameters with incorporation of group or covariate effects (indicated in this
table: “.” = constant, t = discrete sampling occasions, T = directional temporal trend, td = trap dependence, effort = number of trips, Site = site fidelity groups, MQ = mark
severity groups, t/t = age effect). Due to correction for overdispersion (adjustment of ĉ), the QAICc and associated model weights were used to compare candidate
models for the Overall Survival model, while those for the Site Fidelity and Mark Severity models were compared using the AICc and model weights. Complete lists of all
candidate models can be found in Supplementary Tables 4–6.
only two surveys were carried out, with 0.103 (95% CI: 0.012– had not delivered a clear result. The Ak suggested that both
0.287) for “Brandon frequent,” 0.026 (95% CI: 0.008–0.085) for mark severity (MQ) and age class (t/t) were the most important
“Few sightings” and 0.144 (95% CI: 0.048–0.361) for “Shannon covariates influencing survival parameters (Ak = 0.729 and 0.94,
frequent.” respectively) (Table 5 and Supplementary Table 9). A temporal
trend (T) received little support (Ak = 0.12), and indeed, within
Mark Severity the groups of age class and mark severity, SRs showed very little
For the Mark Severity model, an age effect was included, after variation over time (Figures 7A,B). Ambiguity was found to
the GOF component TEST 3.SR (=test for a transience effect) exist about the relationship between age class and mark severity,
Frontiers in Marine Science | www.frontiersin.org 8 March 2021 | Volume 8 | Article 611219Ludwig et al. Survival Rates and Capture Heterogeneity
TABLE 3 | Summary of the relative importance of each covariate incorporated into classes, however, this disparity was very small in the “older”
the Overall Survival model.
age class (Figure 7B), and for both age classes the confidence
Parameter Covariate Sum of Akaike Weights (Ak) intervals were so wide that no significant difference in survival
could be detected between mark severity groups. Only between
Overall Survival Model
“older” MQ-1 individuals and “young” MQ-2 individuals, SRs
Survival (ϕ) constant (.) 0.743
of the former were significantly higher than for the latter group,
temporal trend (T) 0.257
across all years.
Capture (p) trap dependence (td) 0.993
Capture probabilities, like in the Site Fidelity models,
sampling occasion (t) 0.987
responded primarily to an additive effect of time (t) and group
effort 0.014
(here mark severity, Table 5 and Supplementary Table 9). These
photo 0.003
two factors, and their additive relationship, received virtually all
Brandon 0.002
support from the candidate models (all Ak = 1). The lowest
td + t 0.983
capture probabilities for both MQ-1 and MQ-2 individuals were
td + effort 0.008
estimated for the year 1999, with 0.099 (95% CI: 0.014–0.467)
Td ∗ effort 0.003
and 0.021 (95% CI: 0.003–0.148), respectively, while the highest
effort + photo 0.001
capture probabilities were obtained for 2013, with 0.95 (95% CI:
Relative importance was determined by summarising the model weights of all 0.884–0.98) for MQ-1 and 0.783 (95% CI: 0.583–0.903) for MQ-2
models in which a given covariate (or relational term between this and another
dolphins (Figure 7C).
covariate) was incorporated. The covariates are sorted by their sum of Akaike
weights (Ak). Only covariates with an overall Akaike weight of ≥0.001 are shown in To investigate the distribution of individuals over mark
this summary, the full list can be found in Supplementary Table 7. severity and site fidelity classes a posteriori, a χ2 -test of
independence was conducted and was highly significant
(χ2 = 21.126, df = 2, p < 0.001), indicating that individuals were
as both an additive and interaction term received almost equal not equally distributed across the categories of the two variables.
support (Ak = 0.346 and 0.340, resp.). The difference between “Few sightings” included equal numbers of MQ-1 and MQ-2
the MQ classes was greater for age class “0” than for all “older” individuals (38 each), while “Brandon frequent” encompassed
individuals, pointing toward an interaction effect. no MQ-2 and 13 MQ-1 individuals, and “Shannon frequent”
Overall, SRs were constant for all age and mark severity classes included nine MQ-2 and 41 MQ-1 individuals.
with lower survival estimates and larger confidence intervals
for age class “0” compared to age class “one or older.” The
mean apparent SRs for age class “0” over the 23 years were DISCUSSION
0.871 (±0.003 SD) for MQ-1 and 0.767 (±0.003 SD) for MQ-2,
while for age class “one or older” they were 0.956 (±0.001 SD) Long-term data are required to estimate survival and mortality
for MQ-1 and 0.942 (±0.001 SD) for MQ-2. SRs were higher of long-lived species. This study used one of the longest-running
for MQ-1 individuals than for MQ-2 individuals in both age photo-ID datasets for bottlenose dolphins in Europe, which now
FIGURE 5 | (A) Apparent survival and (B) capture probabilities over the study period as estimated by the Overall Survival model, including all 141 individuals and no
grouping variable. The grey polygon (A) and error bars (B) represent 95% confidence intervals. No estimates were obtained for 1995 and 1996 due to a lack of data.
Frontiers in Marine Science | www.frontiersin.org 9 March 2021 | Volume 8 | Article 611219Ludwig et al. Survival Rates and Capture Heterogeneity
TABLE 4 | Summary of the covariates included in the Site Fidelity candidate enable a dolphin to be observed before it surfaces, and thus to
models, sorted by their respective sum of Akaike weights (Ak) which reflect their
obtain better images (Berrow and Holmes, 1999; Bertulli et al.,
relative importance across all candidate models.
2018). However, tour boats often have fixed routes, which results
Parameter Covariate Sum of Akaike Weights (Ak) in unequal coverage of the survey area and lower effectiveness
(Berrow and Holmes, 1999; Corkrey et al., 2008; Bertulli et al.,
Site Fidelity Model
2018). They also spend less time on individual groups than
Survival (ϕ) site fidelity (Site) 1.000
a dedicated platform resulting in not all the individuals in a
temporal trend (T) 0.932
group being photographed. In the present study, all these factors
sampling occasion (t) 0.014
were subject to changes over time. Therefore, survey numbers
T ∗ Site 0.760
are too simplistic to grasp the complexity of survey-related
T + Site 0.172
factors influencing capture probability (e.g., Corkrey et al., 2008;
t ∗ Site 0.012
Silva et al., 2009). The same applies to photographic equipment
t + Site 0.002
and years with/without Brandon surveys, which were crude
Capture (p) sampling occasion (t) 1.000
binary variables.
Site 1.000
t + Site 0.999
Choice of Models
t ∗ Site 0.001
Both the Overall Survival model and the Mark Severity model
Only covariates with an overall Akaike weight of ≥0.001 are shown in this summary, suggested constant SRs over time. The Site Fidelity model
the remaining covariates can be found in Supplementary Table 8.
suggested a negative temporal trend in all three groups with the
patterns of decline varying between groups. Capture probabilities
spans almost 27 years (Berrow et al., 1996). The data were showed the same patterns in all three models, with the
collected by an NGO which relies heavily on volunteers and highest capture probabilities for all groups estimated in 2013.
platforms of opportunity, and which has had very limited funding Significantly higher capture probabilities of “Shannon/Brandon
most years for this monitoring. frequent” compared to “Few sightings,” and of MQ-1 compared
Such limitations are typical for long-term monitoring projects to MQ-2 individuals, were repeatedly the case between 2003 and
worldwide which do not have government or academic support, 2018. Variations in capture probability, however, were not found
but they can compromise survey effort and the quality of data to be the direct consequence of effort or any other factor related
collection. Impacts can include high variability in survey effort, to survey approaches (photographic equipment, coverage of
variability in data quality due to variation in photographic Brandon Bay), and were better explained by temporal variation in
skills between volunteers or camera equipment as well as combination with individual heterogeneity (trap dependence and
misidentifications in the photo-ID catalogue during matching. site fidelity/mark severity groups). Overall, large error margins
Misidentifications were found mostly during the period between at the beginning and end of the study period made inference
2005 and 2009, which was characterised by several short-term of precise estimates challenging, for both survival and capture
projects that included the collection and processing of photo-ID probabilities. This was especially pronounced in the Overall
data by a range of researchers (Leeney et al., 2007; Berrow, 2009; Survival and Site Fidelity model, while precision in the Mark
Foley et al., 2010). The number of misidentifications decreased Severity model was constant and only low for age class “0.”
when the catalogue was curated by a single person between 2008 Other MR-model types rather than CJS may have been more
and 2016 (Baker et al., 2018a). This indicates that observer bias suitable to estimate survival for a population where temporal
influenced the matching process. The current protocol involves migration was assumed to occur, like Pollock’s Robust Design
the validation of matched images by two independent researchers or a multi-state model (Pollock, 1982; Lebreton and Pradel,
and the head researcher in order to be accepted into the catalogue, 2002; Arso Civil et al., 2019). However, the Robust Design
and only the best images of each survey are included (Baker, model requires sightings data to be divided into primary and
2015). By maintaining this protocol, the occurrence of matching secondary sampling occasions and therefore needs more precise
errors in the future is expected to remain low. information for the secondary sampling occasions than was
Regression analysis showed a positive relationship between the available (Pollock, 1982). Likewise, the use of multistate models
number of individuals encountered and the number of surveys was rejected because sightings of the same individuals in both the
conducted, and capture probabilities were comparatively higher Shannon and Brandon in the same year would have complicated
in the years of higher survey effort (2012–2018) than in years encounter histories. Also, there were too few transitions in mark
of lower effort, yet no relationship between effort and capture severity from MQ-2 to MQ-1 to calculate these rates reliably
probabilities was detected by any of the three CJS models. This (e.g., Lindberg and Rexstad, 2002). Therefore, an extension of
appears paradoxical, but survey effort is not a constant entity as the CJS model was selected instead. Half of the individuals in
it can vary due to observer skills and experience (Lusseau and the “few sightings” group were MQ-2 individuals, and their
Slooten, 2002), sea state (Stern et al., 1990), available equipment lower level of identifiability was at least partly responsible for
(Urian et al., 2015), and the platform used. Tour boats, for their low sighting rates, rather than migration. All dolphins
instance, can greatly augment survey numbers as platforms of assigned to “Brandon frequent” were well-marked individuals,
opportunity, and in the Shannon Estuary, dolphin watching tour probably because assignment to this group was conditional on
boat platforms are higher above sea-level than a RIB, which may a relatively high overall sighting rate, which less well-identifiable
Frontiers in Marine Science | www.frontiersin.org 10 March 2021 | Volume 8 | Article 611219Ludwig et al. Survival Rates and Capture Heterogeneity FIGURE 6 | (A) Apparent survival and (B) capture probabilities over the study period as estimated by and averaged for all Site Fidelity CJS models. Estimates were obtained for individuals frequently sighted in Brandon Bay (n = 13, orange), individuals with few overall sightings (n = 78, purple), and individuals frequently and almost exclusively sighted in the Shannon Estuary (n = 50, blue). The correspondingly coloured polygons (A) and error bars (B) represent 95% confidence intervals around the estimates. No estimates for 1995/1996 were obtained due to lacking data. MQ-2 individuals generally did not have. If this study were to be and attributed to the restrictions in quality of MQ-2 images in repeated, the exclusion of less well-marked individuals from the the dataset to maximise available data without compromising analysis could result in more representative site fidelity groups, identifiability (Whitehead and Wimmer, 2005). Lower sighting although this would lead to reduction of the effective sample size. rates of less identifiable MQ-2 individuals may also explain Capture heterogeneity among individuals of the Shannon the significantly lower survival and capture probabilities of population occurred but this is common in wild animal “few sightings” individuals of the Site Fidelity model. However, populations and can have different explanations (Pledger and 50% of these individuals were distinctly marked and fifteen Efford, 1998; Gimenez et al., 2018a), including indication of of them had only been sighted once over the course of the non-random temporal migration. Trap dependence assumes study period. This indicates that mark severity is not the only that some individuals avoid observers and others are more factor causing individual heterogeneity in capture probabilities. “trap-happy,” whereas non-random temporal migration indicates Another explanation is habitat partitioning with some dolphins that some individuals are less available for capture because using less frequently surveyed areas and are thus rarely sighted they periodically leave the study area altogether (Schleimer (Ingram and Rogan, 2002; Baker et al., 2018b). Variation in et al., 2019). From the Mark Severity model, higher capture site fidelity between individuals has been observed in bottlenose probabilities for more distinctive individuals were confirmed dolphins (Speakman et al., 2010; Zanardo et al., 2016), with Frontiers in Marine Science | www.frontiersin.org 11 March 2021 | Volume 8 | Article 611219
Ludwig et al.                                                                                                              Survival Rates and Capture Heterogeneity

TABLE 5 | Summary of the covariates included in the Mark Severity candidate              between sites in order to have high sighting rates in both study
models, sorted by their respective sum of Akaike weights (Ak) which reflect their
                                                                                         areas. Hastie et al. (2004) and Wilson et al. (2004) suggested
relative importance across all candidate models.
                                                                                         prey abundance and distribution was the main driver for
Parameter            Covariate                      Sum of Akaike Weights (Ak)           similar behaviour in Scotland, with the availability of alternative
                                                                                         prey species in Brandon and Tralee Bays being a potential
Mark Severity Model
                                                                                         reason for temporary occupancy by bottlenose dolphins. The
Survival (ϕ)         age class (t/t)                             0.940
                                                                                         ICBDC comprised 192 individuals, but only one individual
                     mark severity (MQ)                          0.729
                                                                                         was exclusively observed outside of both Shannon Estuary
                     temporal trend (T)                          0.120
                                                                                         and Brandon Bay in any 1 year. These observations suggest
                     constant (.)                                0.013
                                                                                         that emigration beyond Brandon is currently rare. However,
                          t/t + MQ                               0.346
                                                                                         the apparent “emigration effect” from the Shannon Estuary
                          t/t ∗ MQ                               0.340
                                                                                         to Brandon Bay has implications for future monitoring and
                          t/t + T                                0.075
                                                                                         conservation plans. Some individuals might have permanently
                          t/t ∗ T                                0.027
                                                                                         emigrated to Brandon/Tralee Bays, thus showing a “range shift”
                          MQ + T                                 0.010
                                                                                         rather than mere “expansion” and future survey effort in Brandon
                          MQ ∗ T                                 0.004
                                                                                         and Tralee Bays is needed to explore this through a more
Capture (p)          sampling occasion (t)                       1.000
                                                                                         balanced, continuous monitoring effort.
                     MQ                                          1.000
                     t + MQ                                      1.000
                                                                                         Survival Rates
Only covariates with a sum of ≥0.001 are included in this summary, the remaining         The average SR across all individuals and years was 0.94 (±0.001
covariates are listed in Supplementary Table 9.
                                                                                         SD), with strong support for constancy of survival over time.
                                                                                         The Mark Severity model also suggested constant survival, with
explanations including sex-specific migration between areas                              rates being slightly higher than in the Overall Survival model after
(Wells and Scott, 1990) and specialisation on different prey,                            individuals with only one sighting (“transients”) had been filtered
or competition between individuals/groups within the same                                out through age dependence [0.956 (±0.001 SD) for MQ-1 and
population (Wilson et al., 1997). Given that groups of Shannon                           0.942 (±0.001 SD) for MQ-2]. The inclusion of age dependence
individuals typically include both males and females (Baker et al.,                      was strongly supported by the Mark Severity model. Likewise,
2020), sex-specific differentiation seems unlikely. Competition                          lower initial than subsequent SRs are a typical observation when
or variation in prey preferences, however, could be potential                            a transient effect is the case, and this pattern was observed from
drivers, as the Shannon Estuary is known to offer special types of                       the Mark Severity model, although it was not significant within
prey to dolphins, including Atlantic salmon (O’Brien et al., 2014;                       mark severity groups (Pradel et al., 1997; Silva et al., 2009).
Hernandez-Milian et al., 2015).                                                          “Transient” individuals with an effective SR of zero after their
                                                                                         only sighting can introduce a considerable negative bias if they
                                                                                         are too prominently represented in a dataset, especially when the
Brandon Bay and Coastal Area                                                             discrepancy to individuals with high sighting rates is large (Pradel
Encounters                                                                               et al., 1997; Prévot-Julliard et al., 1998; Fletcher et al., 2012). As
A total of 40 out of 141 marked individuals from the Shannon                             almost half of all MQ-2 individuals were only recorded once over
Catalogue have been sighted at least once in Brandon and Tralee                          the study period, they are probably the reason behind the strong
Bays across all years, and 16% of the marked population were                             support for an age model. In this case, low identifiability rather
sighted exclusively in the area in at least 1 year, one individual in                    than true transience was likely the factor responsible for the effect.
as many as 4 years. The largest number of encounters coincided                               Both the Mark Severity and Overall Survival models favoured
with the year of highest survey effort (2013) in Brandon/Tralee                          constant SRs. These results are supported by the outcomes of
Bays, with 25 individuals recorded. When considering encounter                           abundance assessments which have been repeatedly performed
histories for individual dolphins in this study, exclusive Brandon                       by independent research groups since 2007 and which have
sightings accounted for 33 data-points that otherwise would have                         indicated a stable population size over the years, confirming the
been recorded as absence. For ten individuals, encounters in                             assumption of a healthy population (Rogan et al., 2000, 2018;
Brandon Bay occurred after their last sighting in the Shannon                            Englund et al., 2008; Berrow et al., 2012; Baker et al., 2018a;
Estuary, and four individuals have been exclusively sighted in                           Blázquez et al., 2020). Considering these findings, the downward
Brandon Bay since 2008, providing evidence for migration rather                          survival trends proposed by the Site Fidelity model are assumed
than mortality. For now, temporal migration of these individuals                         not to represent true effects. Rather, they are a consequence of the
stays a hypothesis.                                                                      classification scheme for site fidelity groups. The “Few sightings”
   Essentially, “Brandon frequent” and “Shannon frequent”                                group had both lower capture and survival probabilities than
individuals had the same capture probabilities, and most                                 the other two groups and showed a steady downward trend in
“Brandon frequent” individuals also had relatively high sighting                         survival from 0.944 (95% CI: 0.833–0.982) to 0.783 (95% CI:
rates in the Shannon Estuary, with sightings in both areas often                         0.637–0.881) between 1993 and 2017. Given the reported stability
occurring within the same year or alternating between years.                             of abundance and the constancy of survival in the other two
Individuals recorded in Brandon must be regularly travelling                             models, the negative temporal trend could be the consequence of

Frontiers in Marine Science | www.frontiersin.org                                   12                                       March 2021 | Volume 8 | Article 611219
You can also read