Longitudinal Improvements in Zoo-Housed Elephant Welfare: A Case Study at ZSL Whipsnade Zoo
←
→
Page content transcription
If your browser does not render page correctly, please read the page content below
animals
Article
Longitudinal Improvements in Zoo-Housed Elephant
Welfare: A Case Study at ZSL Whipsnade Zoo
Katherine Finch, Fiona Sach, Malcolm Fitzpatrick, Nic Masters and Lewis J. Rowden *
 Zoological Society of London, Outer Circle, Regent’s Park, London NW1 4RY, UK; k.finch@chesterzoo.org (K.F.);
 fiona.sach@zsl.org (F.S.); malcolm.fitzpatrick@zsl.org (M.F.); nic.masters@zsl.org (N.M.)
 * Correspondence: lewis.rowden@zsl.org; Tel.: +44-020-7449-6490

 Received: 3 September 2020; Accepted: 2 November 2020; Published: 4 November 2020

 Simple Summary: Zoo elephant welfare has been the topic of much debate over the last two decades,
 with criticisms made regarding the husbandry and welfare of these species held in European and
 North American zoos. The aim of this study was to evidence the value of a species-specific behavioural
 monitoring programme and highlight the positive improvements in elephant welfare that were
 made in a single collection case study, by the comparison of behavioural activity budgets (time
 spent performing a particular behaviour) with previous published literature. This study identifies
 numerous indicators of positive welfare in our collection, including species-appropriate levels of
 feeding, low engagement in stereotypy (abnormal repetitive behaviour), and proportions of resting
 behaviour that are consistent with figures published from comparative zoo individuals. Additionally,
 we show that positive social associations exist between individuals in our study group, with low
 incidences of agonistic social behaviour and high engagement in positive social interactions. Finally,
 we acknowledge that improvements are required to further enhance elephant welfare in zoos and
 we have used the data collected throughout this research programme to adopt an evidence-based
 approach to the husbandry and management of Asian elephants at Zoological Society of London
 (ZSL) Whipsnade Zoo.

 Abstract: Over the last two decades, criticisms were raised regarding the welfare experienced by
 elephants in European and North American zoos. Concerns regarding the welfare of zoo-housed
 elephants in the UK and Europe were consolidated in the publication of several key reports, and media
 interest peaked. Throughout this study we aim to outline the behavioural measures of welfare observed in
 the current group of Asian elephants (Elephas maximus) at Zoological Society of London (ZSL) Whipsnade
 Zoo, using key welfare indicators for this species and comparing them to previous published work.
 Following the instigation of a species-specific research programme, empirical behavioural data were
 available to quantify any developments in care and welfare. The collection of behavioural information
 revealed that individuals in our study group engage in low levels of stereotypic behaviour, have formed
 and maintain strong associations with one another and display a high proportion of engagement in lying
 rest. We outline that by applying simple, low-cost methods of behavioural data collection and analysis,
 it is possible to collect evidence that allows us to evaluate individual level welfare. This facilitates the
 adoption of an evidence-based approach to zoo management as well as demonstrating compliance with
 updated legislation for this species.

 Keywords: animal welfare; Asian elephant; Elephas maximus; SSSMZP; behaviour; social; resting

Animals 2020, 10, 2029; doi:10.3390/ani10112029                                  www.mdpi.com/journal/animals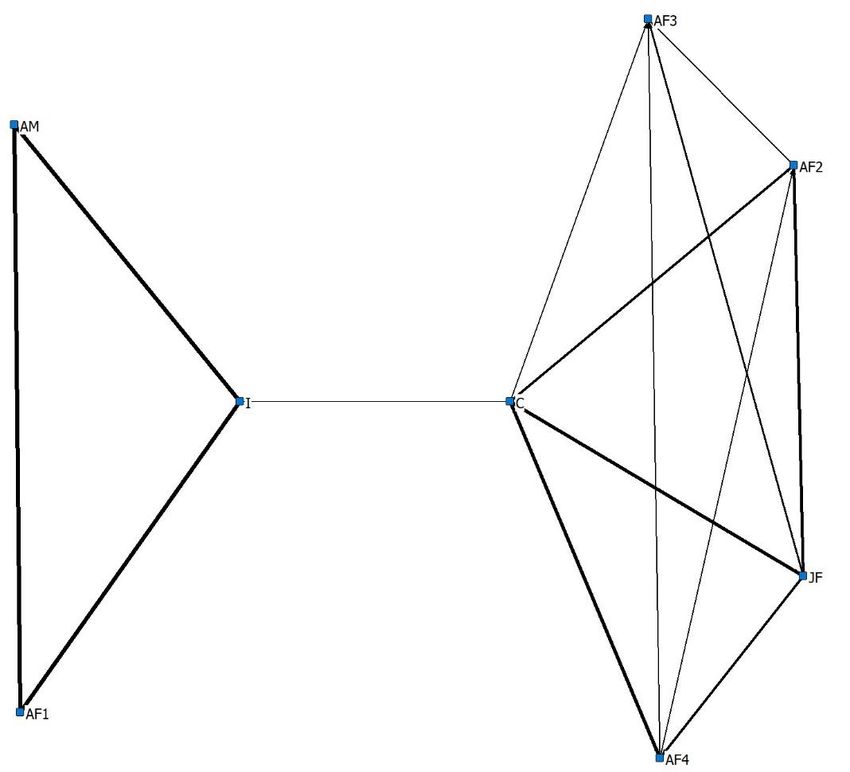
Animals 2020, 10, 2029                                                                                2 of 20

1. Introduction
     There are multiple roles which a 21st century zoological collection strives to fulfil. Institutions are
now expected to not only provide an engaging visitor experience [1], but also to deliver conservation
related education programmes [2] and conduct scientific research [3]. However, the provision of
optimal animal welfare and husbandry practices is widely acknowledged to be the primary goal of
any modern zoo [4–7].
     Animal welfare can be described as the state of an individual in relation to its environment [8]
and requires a multidimensional approach to assessment [9]. The value of using behavioural data
in assessing welfare is increasingly highlighted. Behavioural measures are non-invasive, cheap to
measure and can be easily repeated over time [10]. Multiple studies outline unique behavioural
measures of welfare for zoo species, which can include both positive and negative indicators [11–13].
The importance of optimising animal welfare cannot be understated, with individuals experiencing a
positive welfare state suggested to be best placed to contribute meaningfully towards conservation
breeding programmes [14], the most behaviourally competent [15] and most likely to enhance visitor
experiences [16].
     To ensure that animals experience a high level of welfare in a zoo setting, there is specific guidance
and legislation that all zoos must adhere to, some of which is specific to certain species or taxonomic
groups [17]. British zoos are required to meet the animal welfare standards set out in the Zoo Licensing
Act of 1981 [18]. The Secretary of State Standards of Moderns Zoo Practice (SSSMZP) [19] provide
the necessary guidance to zoo operators and inspectors on the Act’s implementation and set out
the minimum standards that zoos are expected to meet [20,21].
     Over the last two decades, elephant welfare within zoos across Europe has been the topic of much
investigation following publication of studies which criticised the standard of care elephants receive
in zoo environments [22,23]. As with other large, highly intelligent and socially complex species
with a vast natural home range, there are concerns that it is not possible to meet the basic needs of
elephants in captivity [24]. Many of these concerns for captive elephants housed specifically in the
United Kingdom (UK) were documented in a report published in 2008 by Harris et al. [23]. This report
included data on 77 elephants (both Asian Elephas maximus and African Loxodonta africana) managed
in 13 UK zoos at the time. The age ranges of these individuals were from 0.6–50 years for Asian
elephants and 0.5–40 years for African elephants. The main findings of this report outlined a high
engagement in abnormal repetitive behaviours, poor social compatibility between individuals and
concerns with obesity, all issues suggested to be associated with poor zoo management practices at the
time or historically.
     As a response to the findings of the report by Harris et al. [23], the UK Government raised concern
about the keeping of elephants in UK zoos and invited the Zoos Forum Report (now the Zoo Expert
Committee) to review the situation. They recommended the establishment of an Elephant Welfare
Group (EWG), designed to demonstrate evidence of improved welfare of UK zoo elephants over a
10-year period. The UK Government followed this recommendation and tasked the British and Irish
Association of Zoos and Aquariums (BIAZA—previously known as the Zoo Federation) to coordinate
the work. The EWG is a multi-stakeholder group that has since worked together to develop monitoring
tools and protocols for the consistent assessment of body condition, locomotion, foot health and overall
welfare in elephants [25]. Frameworks for assessing captive elephant welfare currently include the UK
Elephant Behaviour Welfare Assessment Tool and Health Pack which all institutions are required to
complete quarterly [12]. In addition to this, as part of their zoo license, all UK zoos holding elephants
are inspected by Department for Environment, Food and Rural Affairs (DEFRA) appointed inspectors,
against Appendix 8 of the SSSMZP—An elephant specific legislative guidance document. Appendix 8
was updated in 2017 to align elephant management standards with current best practice for the species,
with the aim to enhance elephant welfare [26]. On a European level, the European Association of
Zoo and Aquaria (EAZA) elephant Taxon Advisory Group (TAG) manage the populations of African
and Asian elephants to be genetically sustainable and consist of reproductively, behaviourally and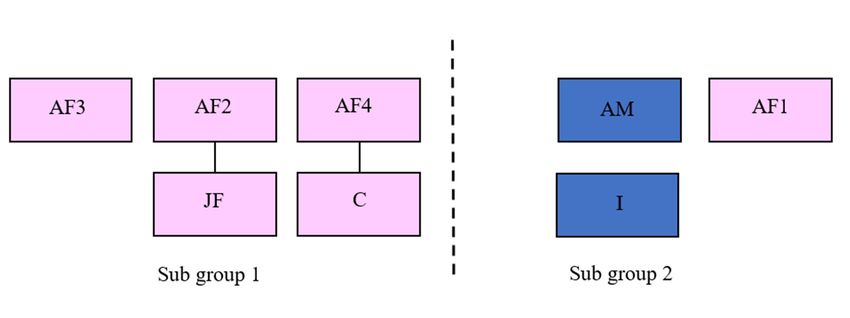
Animals 2020,10,
Animals2020,  10,2029
                  x                                                                                                     33of
                                                                                                                           of20
                                                                                                                              21

      The Zoological Society of London (ZSL) has been keeping elephants for over 150 years, with ZSL
physically competent individuals, which have the ability to fulfil multiple roles within a modern
 Whipsnade Zoo (WZ) currently holding a breeding group of Asian elephants. These individuals
zoological collection [27].
 inhabit a custom-built exhibit within the 600-acre site and have a dedicated elephant keeping team,
      The Zoological Society of London (ZSL) has been keeping elephants for over 150 years, with
 with support provided by on-site specialist animal management teams. Over the last decade, ZSL
ZSL Whipsnade Zoo (WZ) currently holding a breeding group of Asian elephants. These individuals
 have made a series of coordinated investments to improve elephant welfare. This was largely through
inhabit a custom-built exhibit within the 600-acre site and have a dedicated elephant keeping team,
 implementing new husbandry practices as well as constructing a purpose-built elephant facility to
with support provided by on-site specialist animal management teams. Over the last decade, ZSL have
 update elephant management, in line with advancing best practice. In addition to these husbandry
made a series of coordinated investments to improve elephant welfare. This was largely through
 changes, a species-specific research programme was implemented in July 2018. This programme
implementing new husbandry practices as well as constructing a purpose-built elephant facility to
 aimed to provide data to inform animal management at WZ, as well as benefit the welfare of other
update elephant management, in line with advancing best practice. In addition to these husbandry
 elephants managed under human care in range state countries or in ex situ zoo populations.
changes, a species-specific research programme was implemented in July 2018. This programme aimed
      Throughout this study, we aim to use behavioural data to understand and evaluate the
to provide data to inform animal management at WZ, as well as benefit the welfare of other elephants
 development in elephant welfare through comparisons with previous published literature, with
managed under human care in range state countries or in ex situ zoo populations.
 focus on the data published by Harris et al. [23]. We emphasise how information collected cannot
      Throughout this study, we aim to use behavioural data to understand and evaluate the development
 only form a basis for evidence-based management, but also show compliance with outlined
in elephant welfare through comparisons with previous published literature, with focus on the data
 legislation for keeping elephants in a zoo environment. Additionally, we aim to outline that
published by Harris et al. [23]. We emphasise how information collected cannot only form a basis
 appropriate documentation and quantification of these advances in welfare, through targeted
for evidence-based management, but also show compliance with outlined legislation for keeping
 behavioural monitoring programmes, give collections scope to assess well-being on an individual as
elephants in a zoo environment. Additionally, we aim to outline that appropriate documentation and
 well as a group level. Our methods are designed to be accessible, low-cost and repeatable in other
quantification of these advances in welfare, through targeted behavioural monitoring programmes,
 captive settings.
give collections scope to assess well-being on an individual as well as a group level. Our methods are
designed   to be
 2. Materials    accessible,
               and Methodslow-cost and repeatable in other captive settings.
2. Materials and Methods
2.1. Study Subjects
2.1. Study   Subjects of this research were eight Asian elephants housed at ZSL Whipsnade Zoo, UK. The
       The subjects
 study   group
       The        consisted
            subjects   of thisofresearch
                                  one adult werebreeding    male elephants
                                                   eight Asian     (AM; Datehoused
                                                                                Of Birth  at [DOB]:    10 July 1991),
                                                                                              ZSL Whipsnade         Zoo,three
                                                                                                                            UK.
The study group consisted of one adult breeding male (AM; Date Of Birth [DOB]: 10 July241991),
 post-reproductive       females   (AF1;   DOB:    4  March     1982,  AF2;  DOB:    20  July   1982,  AF3;   DOB:          May
 1982),post-reproductive
three    one breeding adultfemales
                                 female (AF4;
                                           (AF1;DOB:
                                                   DOB:274August
                                                               March 1998),
                                                                        1982, one
                                                                              AF2;breeding
                                                                                      DOB: 20   juvenile   female
                                                                                                   July 1982,    AF3;(JF; DOB:
                                                                                                                          DOB:
 23  July 2009),  one  infant male   (I; DOB:    16 September     2014)   and one   female    calf
24 May 1982), one breeding adult female (AF4; DOB: 27 August 1998), one breeding juvenile female   (C; DOB:    10  June   2016),
 all individuals
(JF;  DOB: 23 July  were   managed
                      2009),  one infantin amale
                                             protected     contact
                                                    (I; DOB:         management
                                                                16 September         system,
                                                                                 2014)   and onesince   January
                                                                                                     female   calf2018.    Data
                                                                                                                    (C; DOB:
 from
10  Juneall2016),
            adultallanimals   werewere
                     individuals     included     in the
                                            managed     in Harris   report
                                                           a protected      of 2008.
                                                                         contact       Age classes
                                                                                  management           for this
                                                                                                    system,       study
                                                                                                               since       were
                                                                                                                      January
 determined     using   previous   published     work   [8]. Due  to  severe long-term     compatibility
2018. Data from all adult animals were included in the Harris report of 2008. Age classes for this study     issues   between
 two individuals,
were   determined‘AF1′usingand    ‘AF2′, the
                              previous         eight animals
                                          published              were
                                                         work [8].     routinely
                                                                     Due           housed
                                                                           to severe          as twocompatibility
                                                                                       long-term      subgroups to ensure
                                                                                                                        issues
 the  safety  of all elephants    (Figure
                                      0     1). The0  dam    of study   subject ‘I’ is deceased
between two individuals, ‘AF1 and ‘AF2 , the eight animals were routinely housed as two subgroups   and   as a  result  ‘I’ was
 managed     as  part of  Sub  group    2 with   ‘AM’   and   ‘AF1′.
to ensure the safety of all elephants (Figure 1). The dam of study subject ‘I’ is deceased and as a result
‘I’ was managed as part of Sub group 2 with ‘AM’ and ‘AF10 .

      Figure 1. Schematic diagram representing relatedness between individuals and the composition of the
      two  sub-groups
       Figure          throughout
               1. Schematic  diagramthe representing
                                        data collectionrelatedness
                                                        period. ‘AM’  is the sire
                                                                    between       of ‘JF’, ‘C’and
                                                                              individuals     and the
                                                                                                  ‘I’. Both subgroups
                                                                                                        composition  of
      had  the ability to maintain   auditory, visual,  and  physical contact   with   each  other through
       the two sub-groups throughout the data collection period. ‘AM’ is the sire of ‘JF’, ‘C’ and ‘I’. Both  dividing
      fences throughout
       subgroups   had thethe ‘Day’toobservations.
                            ability                 Pink and
                                      maintain auditory,      blue and
                                                            visual, squares referscontact
                                                                        physical    to female   and
                                                                                             with    male
                                                                                                  each     individuals
                                                                                                         other through
      respectively, with solid lines representing a mother-calf relationship.
Animals 2020, 10, 2029 4 of 20
2.2. Data Collection
Data were collected between 19 August 2018–28 February 2019 (n = 139 days) with behavioural
observations being divided into ‘Day’ and ‘Night’ sessions. Total observation hours were as follows:
‘Day’—213 h; ‘Night’—4656 h. Within this overall collection period, data were further classified into one
of two seasonal conditions, ‘Summer’ and ‘Winter’, due to variations in housing. ‘Summer’ observations
were undertaken from 19 August 2018–3 November 2018. ‘Winter’ observations were undertaken from
24 November 2018–28 February 2019. Observations were conducted when individuals were not under
direct management from keepers i.e training sessions or movement between enclosures, and so had
free-choice of behaviour.
The data collection schedule was randomised but balanced to ensure that all individuals and time
periods were observed equally
During the winter data collection period (on 11 December 2018), ‘AF10 was moved to another
zoo upon recommendation of the EAZA Elephant TAG. Additionally, on 12 January 2019 ‘JF’ gave
birth to a calf which subsequently died approximately 72 h later. For this reason, data in date range
(12 January 2019–21 January 2019) was excluded from analysis as daily husbandry routine was severely
disrupted during this period for all individuals due to extensive veterinary intervention.
2.2.1. Day Observation Data Collection
Data were collected between 10:00–16:00 approximately, dependent upon husbandry routine,
using instantaneous focal sampling (via direct, in person observations) at one-minute intervals over
30 min observation sessions [28]. Each individual was observed for at least one 30 min session per day.
At each interval, the state behaviour of the focal individual was recorded using a pre-defined ethogram
(Appendix A) [28]. Additionally, at each interval the ID and proximity of the focal individuals’ two
nearest conspecifics were recorded in elephant body lengths (Appendix B). All occurrence sampling of
pre-determined event behaviours (Appendix B) was also conducted throughout all focal observation
sessions. When a social interaction occurred between the focal animal and another conspecific, the ID(s)
of the participating individual(s) were recorded.
2.2.2. Night Observation Data Collection
Due to restriction on camera equipment, ‘AM’ was excluded from overnight study. Data were
collected between approximately 16:00–10:00, dependent upon husbandry routine, using instantaneous
focal sampling (via CCTV recording) of state behaviours at 15 min intervals for the entire duration
that individuals spent in overnight housing. Continuous focal sampling was used to record accurate
duration of resting behaviour. Information on social resting behaviour was captured by recording
the ID and proximity of the resting individuals’ two nearest conspecifics, in elephant body lengths.
This data collection method allowed for multiple individuals to be observed across each ‘Night’ period.
Three CCTV cameras were used for overnight recording, these were positioned to cover the entire
indoor area with no blind-spots. All data collection throughout the project was carried out by the lead
author, eliminating the need for inter-observer reliability assessment. Due to lack of technology and
inability to individually identify all study subjects overnight, individual resting behaviour was not
able to be studied in the report by Harris et al. [23]. As a result, comparisons of time spent engaging in
resting behaviour will be drawn from other published literature [29,30].
2.2.3. Social Behaviour
Social behaviour was recorded throughout this study as both a state and an event behaviour.
When individuals were engaging in social behaviour at the one-minute sampling interval, the behaviour
was classed as agonistic or affiliative social behaviour. However, to collect further detail, all occurrence
sampling of key event behaviours (Appendix B) was conducted on social behaviour to record both the
nature and number of bouts of social behaviour.Animals 2020, 10, 2029 5 of 20
Index of association [28] was used to determine the extent to which each dyad, both within
and between the sub groups, associated with each other throughout the study period. The index
of association score ranged from 0 (no association) to 1.0 (complete association). Only scores ≥0.1
were displayed on the sociograms for clarity. Line thickness was adjusted to display strength of
relationship between individuals. Proximity data were used to construct these sociograms. To gauge
a true representation of the extent to which individuals were choosing to associate with each other,
sociograms were constructed only using data in which individuals were either touching or within one
elephant body length of each other.
2.3. Enclosure
2.3.1. Daytime Housing
Day Time Housing Changed Between Seasons
‘Summer’–All individuals had access to grass paddocks throughout the summer period.
Sub group 1 had access to a paddock measuring 13000 m2 , while Sub group 2 had access to an
enclosure measuring 4800 m2 . Both paddocks had species-specific features such as wallows, sand piles
and feeding sites. Sub group 1 also had access to a small pool.
‘Winter’–All individuals had access to all weather sand paddocks throughout the winter period.
Sub group 1 had access to a paddock measuring 1500 m2 . ‘AM’ and ‘I’ were housed separately in
paddocks measuring 360 m2 and 700 m2 respectively. ‘AM’ and ‘I’ did not have the ability to engage in
physical contact with each other throughout the winter period due to enclosure limitations; however,
each individual had the opportunity to engage with Sub-group 1 through a physical barrier.
2.3.2. Nighttime Housing
Overnight housing was consistent throughout seasons in purpose-built elephant barns.
All individuals except ‘AM10 were housed in an enclosure that was split into two sections ‘A’ and ‘B’
and included a deep sand substrate and multiple timed haynet feeders along with species-specific
enclosure furnishings such as logs and enrichment devices. Sub group 1 were housed in ‘A’ while
‘I’ and ‘AF10 were housed in ‘B’, with the total area of ‘A’ and ‘B’ being 700 m2 ‘AM’ was housed
overnight in a separate bull facility of 180 m2 . This area included rubber flooring multiple feeding sites
and enrichment devices.
As this study consisted of purely observational data collection and required no changes to routine
husbandry, ethical approval was not required. The project was approved following ZSL internal review
(reference code ZDZ104).
2.4. Data Analysis
2.4.1. Activity Budgets
All analyses were conducted using R statistical analysis software version 1.3.1056 [31]. To allow
for comparison with data in the report by Harris et al. [23], activity budgets were calculated and
presented as the proportion of time the focal individual was visible to the observer.
Each response variable was found to have a non-normal distribution (Shapiro-Wilks test: Feeding;
w = 0.96, p ≤ 0.05, Stereotypy; w = 0.54, p ≤ 0.05, Resting; w = 0.89, p ≤ 0.05, Anticipatory; w = 0.42,
p ≤ 0.05). As appropriate transformations could not be applied, non-parametric statistical tests were
used for these variables. Resting was also calculated in minutes, these data were tested separately for
normality (Shapiro-Wilks test: w = 0.98, p = 0.98) and were found to be normally distributed. As a result,
parametric statistical tests were used when analysing these data. To allow for accurate comparison to
published literature, resting duration data were only used between time periods 19:00–08:00 in analysis.Animals 2020, 10, x 6 of 21
accurate comparison to published literature, resting duration data were only used between time
periods 19:00–08:00 in analysis.
Animals 2020, 10, 2029 6 of 20
2.4.2. Data Analysis–Sociograms
2.4.2.Sociograms
Data Analysis–Sociograms
were made using NetDraw Network Visualisation Software 2.172 package on
UCINET 6.709 [32],
Sociograms wereusing
madeinformation
using NetDraw obtained by calculating
Network VisualisationanSoftware
index of2.172
association
package[28] for each
on UCINET
dyad [32],
6.709 within andinformation
using between theobtained
sub groups.
by calculating an index of association [28] for each dyad within
and between the sub groups.
3. Results
3. Results
3.1. Feeding
3.1. Feeding
All types of feeding behaviour described in Appendix A were grouped together for the purpose
All types
of analysis andof presentation
feeding behaviour described
of results. in Appendix
All food-stuff was A were grouped
presented in atogether
way to for the purpose
mimic natural
of analysis and presentation of results. All food-stuff was presented in a way
foraging behaviour and extend foraging time, all hay was presented in elevated hay nets to mimic natural foraging
while
behaviour and extend foraging time, all hay was presented in elevated hay nets
browse was either hung up on winches or presented throughout the enclosure at ground level.while browse was either
hung up on winches
Throughout or presented
the summer, throughout
individuals the enclosure
were housed at ground
on grass paddockslevel. Throughout
which further the summer,
encouraged
individuals werebehaviour
natural foraging housed oningrass paddocks
the form which
of grazing forfurther
grass. encouraged natural
Individuals were foraging behaviour
encouraged to use the
in the form of grazing for grass. Individuals were encouraged to use the
whole exhibit through placement of browse and hay nets at opposite ends of the enclosure. Towhole exhibit through
allow
placement of browse and hay nets at opposite ends of the enclosure. To allow for direct
for direct comparison with Harris et al. [23], younger individuals were not included in Figure 2 or in comparison
with Harris
statistical et al. [23], younger individuals were not included in Figure 2 or in statistical analysis.
analysis.
100
90
Average proportion of daytime spent
80
70
60
feeding (%)
50
40
30
20
10
0
Harris et al. (2008) Adult male Adult female
Study subjects
Figure 2. Average proportion of time spent feeding throughout ‘Day’ observations for the adult male
and all adult females in study group. Values
Values from
from published
published literature
literature taken
taken from
from Harris
Harris et
et al.
al. [23].
[23].
All values displayed as mean ±
as mean ± s.e.
Average
Average proportion
proportionofofdaytime
daytime spent
spentengaging
engaging in feeding behaviour
in feeding for the
behaviour foradult male male
the adult and adult
and
females was significantly higher than the value of 45% published by Harris et al. [23]
adult females was significantly higher than the value of 45% published by Harris et al. [23] (Wilcoxon(Wilcoxon signed
rank
signedtest:
rankAM;test: = 496,
w AM; wp=Animals 2020, 10, 2029 7 of 20
Animals 2020, 10, x 7 of 21
3.2. Stereotypic Behaviour
3.2. Stereotypic Behaviour
All stereotypic behaviours (Appendix A) observed were grouped together for purpose of analysis
All stereotypic behaviours (Appendix A) observed were grouped together for purpose of
and presented here as such. To make data directly comparable to those presented by Harris et al. [23]
analysis and presented here as such. To make data directly comparable to those presented by Harris
stereotypies were calculated as proportion of engagement over a 24 h period. Due to enclosure
et al. [23] stereotypies were calculated as proportion of engagement over a 24 h period. Due to
limitations
enclosure with CCTV with
limitations equipment,
CCTV ‘AM’ could not
equipment, ‘AM’be could
observed
not over a 24 h period,
be observed over athus
24 hthis individual
period, thus
was excluded from the graph below.
this individual was excluded from the graph below.
Of
Ofthe
theeight
eightindividuals
individualswithin
withinthethestudy
study group,
group,3 individuals
3 individualswere
werenotnot
observed
observedengaging
engagingin any
in
form of stereotypic behaviour (Figure 3). Of the individuals that did engage in
any form of stereotypic behaviour (Figure 3). Of the individuals that did engage in stereotypic stereotypic behaviour,
all displayedall
behaviour, significantly
displayed lower levels oflower
significantly stereotypy
levels than the average
of stereotypy for the
than UK Asian
average elephants
for UK in 2008
Asian
aselephants
stated byinHarris
2008 aset al. [23]by
stated (Figure
Harris3: et
Wilcox
al. [23]signed
(Figurerank test; AM,
3: Wilcox w = 2278,
signed p < 0.001;
rank test; AM, w AF2, w = p496,
= 2278, <
< 0.001;
p0.001; AF3, w = 2701, p < 0.001; AF4, w = 1485, p < 0.001; I, w = 496, p < 0.001). The most
AF2, w = 496, p < 0.001; AF3, w = 2701, p < 0.001; AF4, w = 1485, p < 0.001; I, w = 496, p < 0.001). common
stereotypic behaviourstereotypic
The most common observed in our individuals
behaviour observed was inpacing, accounting
our individuals forpacing,
was 76.6% ofaccounting
all stereotypic
for
behaviour observed, followed by swaying (15.9%) and then weaving (7.5%).
76.6% of all stereotypic behaviour observed, followed by swaying (15.9%) and then weaving (7.5%).
20
18
stereotypy across 24 hours (%)
Average time engaging in
16
14
12
10
8
6
4
2
0
Harris et al. AF1 AF2 AF3 AF4 JF I C
(2008)
Individual
Figure3.3.Average
Figure Averageproportion
proportion of
of time
time spent
spent engaging
engaging in stereotypic
stereotypic behaviour
behaviour compared
comparedto
tohistoric
historic
figurespublished
figures publishedin
inHarris
Harriset
etal.
al.[23].
[23]. All
All values displayed as mean ±±s.e.
s.e.
3.3.
3.3.Resting
Resting
Resting
Restingdata
datawere
werecalculated
calculatedasasboth
bothaverage
averageproportion
proportionofof
time over
time over2424
h (%) and
h (%) as duration
and per
as duration
night (mins). For the purposes of data presentation and analysis, both lying and standing rest
per night (mins). For the purposes of data presentation and analysis, both lying and standing rest were
grouped (Table 1(Table
were grouped and Figure
1 and4).Figure
All individuals had access to
4). All individuals haddeep sandtosubstrate
access onlysubstrate
deep sand throughout the
only
course of data collection.
throughout the course of data collection.
Table 1. Average proportion of time spent resting (%) over 24 h and the average duration of resting
Table 1. Average proportion of time spent resting (%) over 24 h and the average duration of resting
(minutes) per night by each study subject at WZ.
(minutes) per night by each study subject at WZ.
Average Proportion
Average Proportion of Time of Time
Spent Average Duration
Average Duration Spent Resting
Spent Resting Per
Individual
Individual Spent Resting per Night (% ± s.e) per Night (Minutes ± s.e)
Resting Per Night (% ± s.e) Night (Minutes ± s.e)
AF1 AF1 24.9 (±2.6)
24.9 (±2.6) 243.8 (±12.6)
243.8 (±12.6)
AF2 26 (±1.5) 296.7 (±18.3)
AF2 26 (±1.5) 296.7 (±18.3)
AF3 24.2 (±2.8) 246.1 (±15.8)
AF3 AF4 24.2 (±2.8)
21 (±1.2) 246.1
246.8 (±15.8)
(±13.5)
AF4 JF 21 (±1.2)
28.6 (±0.9) 246.8
343.9 (±13.5)
(±10.5)
JF I 28.6 (±0.9)
31.5 (±0.8) 343.9
338.3 (±10.5)
(±10.5)
I C 29.8 (±2)
31.5 (±0.8) 343.2 (±16.7)
338.3 (±10.5)
C 29.8 (±2) 343.2 (±16.7)Animals 2020, 10, x 8 of 21
Animals 2020, 10, 2029 8 of 20
Animals 2020, 10, x 8 of 21
450
Average duration of rest for adult
400 450
for (mins)
adult
350 400
individuals per night (mins)
300 350
night
300
of rest
250
durationper
250
200
individuals
200
150
150
Average
100
100
50
50
0 0
Walsh (2017)
Walsh (2017) Williams
Williamset
et al.
al. (2015)
(2015) -- Williams
Williamsetetal.al. (2015)
(2015) - - WZ WZ
Zoo
Zoo B*B* Zoo
Zoo CC
Source of individuals
Source individualsstudied
studied
Figure
Figure 4. Comparison
4. Comparison of of
thethe averagetime
average timespent
spent resting
resting (min)
(min)perpernight
nightbetween
betweenadult individuals
adult at at
individuals
WZ and those published by Walsh [29] and by Williams et al. [30]. All values displayed as mean ± s.e.
WZ
WZ and
and those
those published
published by
by Walsh
Walsh [29]
[29] and
and byby Williams
Williams etet al.
al. [30].
[30]. All
All values
values displayed
displayed as mean ±
as mean s.e.
± s.e.
* Values from Williams et al. [30] Zoo B only included duration of lying rest.
** Values
Values from
fromWilliams
Williamset
etal.
al.[30]
[30]Zoo
ZooBBonlyonlyincluded
includedduration
durationof oflying
lyingrest.
rest.
Upon Upon comparison
comparison with
with publisheddata
published data from
from another
anotherEuropean
European institution
institution [29][29]
andandfromfrom
otherother
Upon
UK Zoos comparison with
[30], the duration published
of time spent data frominanother
resting minutes,European institution
did not significantly [29]between
differ and from WZother
UK
UK Zoos
Zoos [30], the duration of time
time spent
spent resting
resting in in minutes,
minutes, did did not
not significantly
significantly differ
differ between WZ
adults and Walsh [29] adults (Figure 4, One sample t-test: Walsh [29], t = 55, p = 0.13). However, a WZ
[30], the duration of between
adults
adults and Walsh
and Walsh [29] adults
[29] adults (Figure
(Figure 4, One sample t-test: Walsh [29], t = 55, p = 0.13). However,
significant difference was found in 4,
theOne sample
average t-test: of
duration Walsh [29],night
rest per t = 55,
forpadult
= 0.13). However, a
individuals
a significant
significant difference
sampleddifference
by Williams waswas found
found
et al., 2015 inin the average
the average
in both Zoos B and duration
duration of
C whenofcomparedrest per night
rest pertonight for
adult for adult
adult individuals
individuals individuals
at WZ
sampled
(Figure
sampled by Williams
by4,Williams
One sample et al., 2015
t-test:
et al., 2015 in both
Williams Zoos
in bothet Zoos B and
al. [30]B Zoo C when
andB,Ct when compared
= 8.6, pcompared to
≤ 0.05; Williams adult individuals
et al.,
to adult (2015) Zoo C,
individuals at
at WZ
WZ
(Figure
t = 4,
5.5, One
p = sample
0.01) ‘Zoo t-test:
A’ fromWilliams
Williams et al.
et [30]
al. Zoo
[30] wasB, t = 8.6,
excluded p ≤
from 0.05;
dataWilliams
(Figure 4, One sample t-test: Williams et al. [30] Zoo B, t = 8.6, p ≤ 0.05; Williams et al., (2015) Zoo C, collection, et al.,
as (2015)
individualsZoo C,
tt = 5.5,
did p =
not 0.01)
have ‘Zoo
accessA’ tofrom
sand Williams
substrate, eta al. [30]
substrate was excluded
provided for from
all data
other
= 5.5, p = 0.01) ‘Zoo A’ from Williams et al. [30] was excluded from data collection, as individuals collection,
study as
individuals. individuals did
not When evaluating the average proportion of time spent resting over 24 individuals.
h (%), all individuals at
did have access
not have to sand
access to sandsubstrate, a substrate
substrate, a substrateprovided for all
provided for other study
all other study individuals.
WZ
When studied spent more than 50% of their time engaging in lying rest behaviour, with theindividuals
youngest
When evaluating the average proportion of time spent resting over 24 h (%),
evaluating the average proportion of time spent resting over 24 h (%), all
all individuals at at
WZ group members ‘I’ and ‘C’ spending the most time engaging in lying rest (99.69% ± 0.15 s.e and 90.39%
WZ studied
studied spent
spent more
more thanthan 50% 50% of of their
their time
time engaging
engaging in in lying
lying rest
rest behaviour,
behaviour, with with thethe youngest
youngest
± 5.72 s.e respectively) (Figure 5).
group members‘I’
group members ‘I’and
and‘C’
‘C’ spending
spending thethe most
most time
time engaging
engaging in lying
in lying ± 0.15 ±
rest (99.69%
rest (99.69% s.e0.15
and s.e and
90.39%
90.39% ± respectively)
± 5.72 s.e 5.72 s.e respectively)
(Figure (Figure
5). 5).
100
90
Average lying rest (%)
100 80
90 70
80 60
Average lying rest (%)
70 50
40
60
30
50
20
40 10
30 0
20 AF1 AF2 AF3 AF4 JF I C
10 Individual
0
AF1 AF2 AF3 AF4 JF I C
Figure 5. Average proportion of resting time spent in lying rest for each subject over 24 h. All values
displayed as mean ± s.e. Individual
Figure 5. Average proportion of resting time spent in lying rest for each
each subject
subject over
over 24
24 h.
h. All values
± s.e.
displayed as mean ± s.e.Animals 2020, 10, 2029 9 of 20
3.4. Social Behaviour
Due to seasonal changes in housing resulting in a difference in enclosure size (Methods 2.3),
sociograms were constructed for both the ‘Summer’ housing (Figure 6a) and ‘Winter’ (Figure 6b)
housing observation periods.
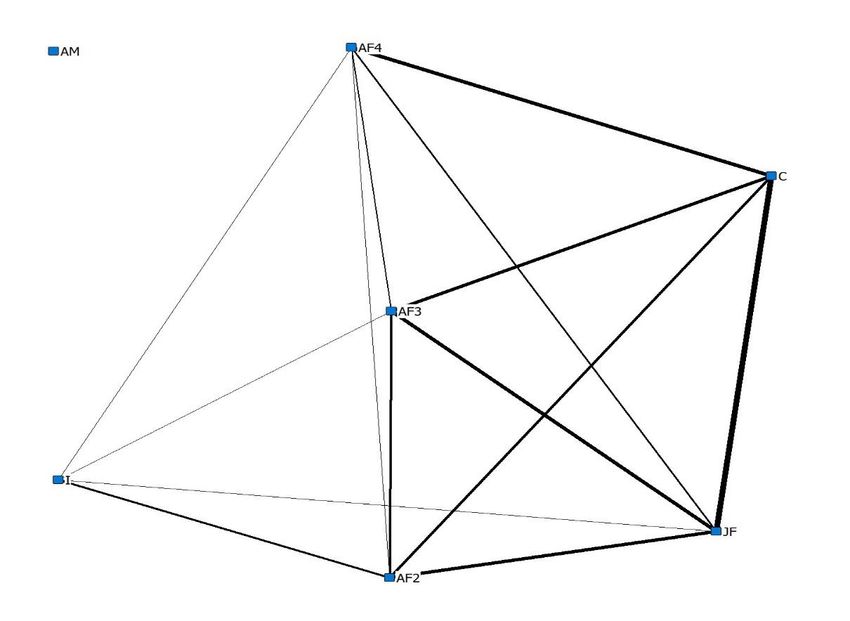
The strongest index of association scores in sub-group 1 were observed between ‘JF’ and ‘C’ (0.7 and
0.8 summer and winter respectively), ‘AF40 and ‘C’ (0.7 and 0.6 summer and winter respectively)
and ‘AF20 and ‘JF’ (0.7 and 0.6 summer and winter respectively). Throughout the summer period
(Figure 6a), Sub group 2 had high index of association scores between all dyads (0.9). Throughout the
winter period, ‘I’ chose to associate with ‘AF20 , ‘AF30 , ‘AF40 and ‘JF’. ‘AM’ chose to associate less
frequently with members of Sub group 1 leading to the removal of this individual from the core
sociogram (Figure 6b).
Animals 2020, 10,
Affiliative x behaviour was recorded as a state behaviour for all eight of our study individuals.
social 9 of 21
The highest average proportion of engagement in affiliative social behaviour observed was from
3.4. Social
‘C’ (8.71% Behaviour
± 2.1 s.e) and the lowest from ‘AF10 (0.63% ± 0.54 s.e). Agonistic social behaviour was
not observed
Due toas seasonal
a state behaviour
changes throughout our studyinperiod.
in housing resulting Both affiliative
a difference and size
in enclosure agonistic social2.3),
(Methods
interactions were recorded as event behaviours for seven of the eight individuals throughout
sociograms were constructed for both the ‘Summer’ housing (Figure 6a) and ‘Winter’ (Figure the 6b)
period of observations (Figure
housing observation periods. 7).
(a)
0.3
0.3
0.2
0.9
0.4
0.5
0.1 0.7
0.9
0.7
0.7
0.9
0.3
0.5
Figure 6. Cont.Animals2020,
Animals 2020,10,
10,2029
x 10 of
10 of2021
(b)
0.6
0.3
0.6
0.2
0.2
0.5
0.8
0.6
0.2
0.4 0.3
0.2
0.4
0.6
Figure 6. A sociogram highlighting index of association scores ≥0.1 between members of the study
Figure
group 6. Asocial
using sociogram highlighting
proximity indexthroughout
data collected of association scoresobservation
the ‘Day’ ≥0.1 between members
period of the study
while individuals
group
were using
housed social proximity
in summer data(b)
(a) and winter collected throughout
accommodation. the ‘Day’
Interactions observation
involving period
‘I’ in Figure while
6b were
individuals
Animals 2020, 10, x were housed in summer
through a fence, due to enclosure design. (a) and winter (b) accommodation. Interactions involving ‘I’11
inof 21
Figure 6b were through a fence, due to enclosure design.
5
The strongest index of association scores in sub-group 1 were observed between ‘JF’ and ‘C’ (0.7
Average number of bouts per observation
4.5
and 0.8 summer and winter respectively), ‘AF4′ and ‘C’ (0.7 and 0.6 summer and winter respectively)
4
and ‘AF2′ and ‘JF’ (0.7 and 0.6 summer and winter respectively). Throughout the summer period
3.5
(Figure 6a), Sub group 2 had high index of association scores between all dyads (0.9). Throughout the
3
winter period, ‘I’ chose to associate with ‘AF2′, ‘AF3′, ‘AF4′ and ‘JF’. ‘AM’ chose to associate less
2.5
frequently with members of Sub group 1 leading to the removal of this individual from the core
session
2
sociogram (Figure 6b).
1.5 social behaviour was recorded as a state behaviour for all eight of our study
Affiliative
1 highest average proportion of engagement in affiliative social behaviour observed
individuals. The
was from ‘C’0.5(8.71% ± 2.1 s.e) and the lowest from ‘AF1′ (0.63% ± 0.54 s.e). Agonistic social behaviour
0
was not observed as a state behaviour throughout our study period. Both affiliative and agonistic
AM recorded
social interactions were AF1 as event
AF2 behaviours
AF3 forAF4 JF eight individuals
seven of the I Cthroughout
the period of observations (Figure 7). Individual
Agonistic Affilative
Figure 7.7.Average
Averagenumber
number of bouts
of bouts of affiliative
of affiliative and agonistic
and agonistic social interactions
social interactions initiated
initiated per per
individual,
individual,
per per observation
observation session. All session. All valuesasdisplayed
values displayed mean ± s.e.
as mean ± s.e.
Per observation session on average, ‘AM’, ‘AF1′, ‘AF3′, ‘AF4′, ‘JF’ and ‘C’ all initiated more bouts
of affiliative than agonistic social behaviour throughout our study period On average, study subject
I engaged in the most agonistic bouts per session (1.47 ± 0.43 s.e) while ‘AM’ engaged in the most
affiliative bouts per session (2.2 ± 0.6 s.e).Agonistic Affilative
Figure 7. Average number of bouts of affiliative and agonistic social interactions initiated per
individual,
Animals per observation session. All values displayed as mean ± s.e.
2020, 10, 2029 11 of 20
Per observation session on average, ‘AM’, ‘AF1′, ‘AF3′, ‘AF4′, ‘JF’ and ‘C’ all initiated more bouts
Per observation
of affiliative sessionsocial
than agonistic on average, ‘AM’,
behaviour ‘AF10 , ‘AF3our
throughout
0 , ‘AF40 , ‘JF’ and ‘C’ all initiated more bouts
study period On average, study subject
of affiliative
I engaged inthan agonistic
the most socialbouts
agonistic behaviour throughout
per session (1.47 ±our study
0.43 s.e) period On average,
while ‘AM’ engagedstudy subject
in the most
Iaffiliative
engagedbouts in theper
most agonistic
session (2.2 ±bouts per session (1.47 ± 0.43 s.e) while ‘AM’ engaged in the most
0.6 s.e).
affiliative bouts per session (2.2 ± 0.6 s.e).
3.5. Anticipatory Behaviour
3.5. Anticipatory Behaviour
Anticipatory behaviour formed a proportion of the activity budget for all individuals studied,
Anticipatory
with ‘AF2′ showing behaviour
the highestformed a proportion
proportion of the activity
of anticipatory budget
behaviour for all
(Figure individuals
8; 7.53% ± 2.59 studied,
s.e) and
with ‘AF2 0 showing the highest proportion of anticipatory behaviour (Figure 8; 7.53% ± 2.59 s.e) and ‘I’
‘I’ showing the lowest (Figure 8; 0.29% ± 0.11 s.e). This behaviour was almost exclusively observed
showing
between the lowest (Figure
07:00–09:00 (51.8% of all ±anticipatory
8; 0.29% 0.11 s.e). Thisbehaviour
behaviourobserved)
was almostand exclusively observed
14:00–15:00 (44.7%between
of all
07:00–09:00 (51.8% of all anticipatory behaviour observed) and 14:00–15:00 (44.7%
anticipatory behaviour observed), before individuals were moved into either daytime or overnight of all anticipatory
behaviour
housing. observed), before individuals were moved into either daytime or overnight housing.
14
anticipatory behaviour over a 24
Avergae time engaging in
12
hour period (%)
10
8
6
4
2
0
AF1 AF2 AF3 AF4 JF I C
Individual
Figure 8.8.Average
Averageproportion
proportion of time
of time spentspent bystudy
by each each individual
study individual
engagingengaging in anticipatory
in anticipatory behaviour.
behaviour. All values displayed
All values displayed as mean ± s.e.as mean ± s.e.
4. Discussion
4.1. Feeding
Asian elephants are known as generalist herbivores, consuming a variety of plant material
including bark, twigs, fruit and leaves [33] with estimates of daily dry matter intake for a wild adult
elephant to be around 1–1.5% of their body mass [34]. Elephants have a low digestive efficiency and
are designed to eat large quantities of nutrient poor fibrous material, which passes quickly through the
gastrointestinal tract [35,36].
Average values for proportion of daytime feeding behaviour collected throughout our study
(Adult male 80.9% ± 4.1 s.e; Adult female 70.2% ± 3.0 s.e) are significantly higher than those stated by
Harris et al. [23], who stated that at the time of data collection, feeding represented 45% of a UK captive
elephants activity budget. Studies focusing on wild elephant ecology show that individuals spend up
to 67% of their time feeding [33] and that elephants are extremely opportunistic in their food choice,
adjusting their movements, food choices and subsequent behaviour-based upon mineral need [37].
Increased time spent feeding compared to the UK average stated by Harris et al. [23] may be due
to the seasonal provision of grass at WZ. These findings are consistent with studies on wild individuals,
Sukumar [33] suggested that wild Asian elephants will increase their time spent feeding on grasses
when they become seasonally available. Grass is highlighted as an important resource for elephants
in section 8.8.34 of the SSSMZP [19] and required in the BIAZA Best Practice Guidelines for theseAnimals 2020, 10, 2029 12 of 20
species [38], to maximise and extend foraging time for zoo individuals without significantly increasing
the quantity of food consumed and putting the species at increased risk of obesity. Since the publication
of data in Harris et al. [23] elephant holders have made a concerted effort to increase foraging time
and promote natural foraging behaviour, through targeted enrichment, increased provision of browse,
timed feeders, and the use of raised hay nets [39–41]. To meet the nutritional needs of these species and
reduce the risk and incidence of obesity within zoo elephants, further work is required to develop low
quality palatable forages that are better suited to the nutrient poor high fibre needs of the species, rather
than UK grass hays which are designed primarily for the nutritional needs of domestic farm animals.
4.2. Stereotypy
Stereotypic behaviours are one of the most common behavioural measures used to indicate zoo
animal welfare status [40]. In elephants, the most common stereotypies include pacing, weaving,
and swaying [41], with Harris et al. [23] reporting that swaying was the most common stereotypy in the
UK elephant population. Swaying was recorded by Harris et al. [23] to form 67% and 78% of all daytime
and nighttime stereotypies observed respectively. Harris et al. [23] reported locomotor stereotypy
to be the next most common stereotypic behaviour (27% and 11% of day and nighttime stereotypy
respectively). Of stereotypies reported in our study group, individuals engaged the most in locomotor
stereotypy (76.6% of all stereotypy observed), followed by swaying (15.9% of all stereotypy observed).
Additionally, a questionnaire developed by Hapeslagh et al. [42] which surveyed 87 elephants across
12 European zoos, also concluded that locomotor stereotypies were the two of the most common, with
weaving and pacing forming 37.9% and 17.2% of all stereotypies observed.
Individuals engage in stereotypic behaviour for several reasons, with both biotic and abiotic
factors linked to the frequency of occurrence such as enclosure size [43], husbandry routine [42]
and health status [44]. Engagement in stereotypic behaviour can be a product of a previous poor
welfare experience, with work suggesting that these forms of stereotypy may persist, despite positive
changes to the current environment [45,46]. Engagement in stereotypic behaviour from our study
subjects was found to be significantly lower than those published by Harris et al. [23]. A reduction in
levels of stereotypy has been suggested to indicate an improvement in welfare state for many captive
species [47,48], and linked to positive advances made in husbandry practices [49] and animals feeling
comfortable in their environment [50].
Furthermore, our results highlight the importance of evaluating welfare on an individual level in
this species, with the type of stereotypy and proportion of time spent engaging in abnormal repetitive
behaviour varying greatly between study subjects. Each individual within our study group, particularly
the older adult females, had a unique and sometimes complex life history, with experienced multiple
management systems, facilities, and husbandry practices. Therefore, development of husbandry
practices and investment in facilities may reduce levels of stereotypy for these individuals but ultimately
they never fully remove this less desirable behaviour from their activity budget. Continual improvement
in evidence-based husbandry and appropriate intervention will prevent or at least significantly reduce
the likelihood of younger animals developing stereotypies into the future.
4.3. Resting
While observational data on resting behaviour in wild Asian elephants is scarce, engagement in
lying rest is considered important for this species and is used as an indicator for positive welfare in
zoo individuals [51]. Absence of lying rest behaviour could be linked to environmental factors such
as substrate provision [30] or physiological health conditions such as degenerative joint disease or
impaired musculoskeletal strength [52] especially in geriatric individuals. At the time of data collection,
WZ elephants were all of a good health status, with no diagnosed cases or signs of disease or physical
impairment. Our results show that all study subjects engaged in nightly lying rest and all individuals did
so for more than 50% of their overall resting period. Our results support findings of another study which
highlighted that duration of rest decreased with age [53], with our calf and infant study subjects engagedAnimals 2020, 10, 2029 13 of 20
in the highest proportion of both lying and overall rest. WZ invested in providing a substrate of deep
sand throughout the indoor facility, housing all individuals except ‘AM’. The provision of appropriate
substrate and enclosure furnishings were suggested to encourage safe, positive lying rest in elephants,
with deep sand recommended as the most suitable substrate for elephants [54]. Due to research into
the effect of substrate on elephant health [30,55], many UK elephant holding zoos have transitioned to
more species-appropriate substrates, since the report by Harris et al. [23]. Additionally, appropriate social
groupings overnight are found to be related to positive lying rest, with individuals with longer resting
bouts when a conspecific was within two elephant body lengths than when conspecifics were not [56].
The duration of rest behaviour for our study subjects was recorded and was found to be consistent with
data published from another large elephant holder within Europe [29]. These findings highlight the
importance of collaboration and dissemination of research across the zoo community, particularly in the
UK, in order to promote a holistic, institution-wide approach to evaluating welfare.
4.4. Social Behaviour
Elephants are a highly social species [57], with wild herds formed of multiple matrilines and led
by a matriarch. Individuals live in a fission fusion society, with the integration or dispersal of group
members dependent on multiple factors such as resource availability [58] or reproductive status [59].
It is now recommended that elephant holders should aim to replicate the natural social structure of wild
elephant herds within a zoo setting to ensure optimum welfare [59,60]. Our study group is made of
both related and unrelated members and we have used sociograms to demonstrate the extent to which
individuals chose to associate with another throughout our study. Our sociograms demonstrate that
individuals within the study group are exercising a level of choice and control over their association
with other group members, with individuals within and between each sub group actively choosing
to spend time in close proximity. Throughout the summer data collection period, the strongest
associations were observed between all members of Sub group 1, the mother-calf dyads in Sub group 2
and half-sister dyad between ‘JF’ and ‘C’. Our findings are consistent with studies on both wild and
zoo individuals, highlighting the importance and strength of the mother—Calf relationship [57,61,62].
The strong association we observed between ‘JF’ and ‘C’ further highlights the importance and benefits
of keeping this species in related social groupings. However, it is also important to highlight that
‘AF30 , an unrelated female in this group has formed associations with all other members in her sub
group. This level of association was maintained throughout both summer and winter housing periods,
showing that while not related, this individual can both form and maintain cohesive social associations
with group members. Despite these cohesive social associations, ‘AF30 engaged in the lowest rates
of affiliative behaviour with other group members. Suggesting that while unrelated individuals can
co-exist within a herd setting, the role they play is not as important as one of a matrilineal relationship.
This work revealed that six of the eight study individuals engaged in significantly more affiliative than
aggressive social interactions throughout our study period. Opportunities for engagement in affiliative
social interactions have been suggested to be very important in zoo individuals [63], particularly
for complex and social species such as elephants [11]. Elephants use social encounters to both form
and maintain social relationships, with group cohesion and stability used as an indicator of welfare
experience in captivity [64]. Updated legislation recognises the importance of compatibility, stating
that elephant groups should consist of at least four compatible females over 2 years old [19].
Additionally, our results highlight the important, positive influence of integrating males of
different ages into socially compatible groups where possible. The strong association index observed
between ‘AM’ and ‘I’ in the ‘Summer’ was not present throughout ‘Winter’ observation sessions as
enclosure limitations prevented ‘AM’ socialising with ‘I’ throughout the winter. In the wild, male
elephants are reported to socialise with conspecifics, forming batchelor groups with other males [65–68]
and developing social relationships with females that may be maintained throughout their lives [67].
Hartley et al. [67] highlight the issues surrounding social management of male elephants in zoos and
the importance of adopting new approaches to management in the future. Our data is further evidenceAnimals 2020, 10, 2029 14 of 20
that investment is needed in facilities to allow the free socialisation of males in a fission fusion system,
during all weathers.
4.5. Anticipatory Behaviour
Anticipatory behaviour, often described as the actions taken to prepare for an upcoming
event [68], has been linked to zoo animals living in highly predictable environments with specific
husbandry routines [69]. This behaviour has been recorded in multiple captive species [70]. However,
the interpretation of anticipatory behaviour in relation to animal welfare experience must be done
with caution [71]. Associated with the release of dopamine, anticipatory behaviours were used as an
indicator of positive welfare in some species [72]. However, Watters [71] outlined that the development
of anticipatory behaviours escalated to a point that they became detrimental to a naturalistic activity
budget. Engagement of anticipatory over more natural species-specific behaviour is a cause for welfare
concern. Anticipatory behaviour in our study subjects was almost exclusively observed towards the
end of ‘Day’ and ‘Night’ observations before the event of moving into a new enclosure or starting
their daily husbandry routine. Engagement in anticipatory behaviour must be closely monitored
through further research to assess how this behaviour influences the activity budget of the study
group. Further mitigations must be investigated, especially during the ‘high risk’ times of end of
‘Day’ and ‘Night’ when significant events occur, resulting in this observed anticipatory behaviour.
Dependency on these events must be minimised as much as possible, for example through enabling
24 h indoor/outdoor access (weather permitting) and conducting the daily husbandry routine and
training on a flexible, opportunistic schedule, to lessen the dependency on these critical time points.
5. Conclusions
Throughout this study, we emphasised the value of implementing a species-specific research
programme in adopting an evidence-based approach to husbandry and management. Data collected
through the initial period of this long-term monitoring programme, shows that since the publication of
a report on UK elephants by Harris et al. [23] there were positive advances in elephant welfare at ZSL
Whipsnade Zoo. We documented that individuals in our study group engaged in significantly less
stereotypic behaviour than reported by Harris et al. [23] that individuals spent longer engaging in
natural feeding behaviour and that these individuals form and maintained strong social associations
with one another across seasons. We outlined that investment and advancement in facilities enabled
us to observe our study group overnight on an individual level, allowing detailed information
to be documented on resting behaviour, with a particular focus on the engagement in lying rest.
When compared with published literature from another large European elephant collection [31],
we found statistical concordance between duration of rest for all comparative age classes, showing the
importance of a collaborative approach to assessing welfare between institutions. We acknowledge that
within our collection there is still work to be done to achieve what is currently considered optimum
elephant welfare and that programmes must continually evolve in line with ever advancing best practice.
Examples of suggested improvements by the authors include providing all individuals with 24 h access
to outdoor enclosures, increased grazing and access to browse particularly over the winter period and
an increased provision for male socialisation within future enclosure design. Long-term management
plans are currently in place to work to achieve these goals over the coming years, along with continued
effort to develop a cohesive matriline structure within the study group. This evidence-based assessment
signifies a key step in the evolution of modern elephant management, by using both positive and
negative indicators of wellbeing and an individual approach to the assessment of welfare. We also
acknowledge areas for future development within our research programme, such as the current lack of
focus on overnight male behaviour, identifying a need for further investment in camera resource to
gain a 24 h insight into bull welfare within our collection.You can also read