Assessing soil redistribution of forest and cropland sites in wet tropical Africa using
←
→
Page content transcription
If your browser does not render page correctly, please read the page content below
SOIL, 7, 399–414, 2021

                                                                                                         SOIL
https://doi.org/10.5194/soil-7-399-2021
© Author(s) 2021. This work is distributed under
the Creative Commons Attribution 4.0 License.

                       Assessing soil redistribution of forest and
                       cropland sites in wet tropical Africa using
                             239+240
                                     Pu fallout radionuclides
           Florian Wilken1,2 , Peter Fiener2 , Michael Ketterer3 , Katrin Meusburger4 , Daniel Iragi Muhindo5 ,
                                        Kristof van Oost6 , and Sebastian Doetterl1
              1 Department     of Environmental Systems Science, Eidgenössische Technische Hochschule Zürich,
                                                         Zürich, Switzerland
                                2 Institute for Geography, Universität Augsburg, Augsburg, Germany
                            3 Chemistry and Biochemistry, Northern Arizona University, Flagstaff, USA
                 4 Swiss Federal Institute for Forest, Snow and Landscape Research, Birmensdorf, Switzerland
                          5 Faculty of Agronomy, Université Catholique de Bukavu, Bukavu, DR Congo
                    6 Earth and Life Institute, Université Catholique de Louvain, Louvain-la-Neuve, Belgium

                           Correspondence: Florian Wilken (florian.wilken@geo.uni-augsburg.de)

                                Received: 15 December 2020 – Discussion started: 28 December 2020
                               Revised: 26 April 2021 – Accepted: 6 May 2021 – Published: 8 July 2021

       Abstract. Due to the rapidly growing population in tropical Africa, a substantial rise in food demand is pre-
       dicted in upcoming decades, which will result in higher pressure on soil resources. However, there is limited
       knowledge on soil redistribution dynamics following land conversion into arable land in tropical Africa that is
       partly caused by infrastructure limitations for long-term landscape-scale monitoring. In this study, fallout ra-
       dionuclides 239+240 Pu are used to assess soil redistribution along topographic gradients at two cropland sites and
       at three nearby pristine forest sites located in the DR Congo, Uganda and Rwanda. In the study area, a 239+240 Pu
       baseline inventory is found that is higher than typically expected for tropical regions (mean forest inventory
       41 Bq m−2 ). Pristine forests show no indication of soil redistribution based on 239+240 Pu along topographical
       gradients. In contrast, soil erosion and sedimentation on cropland reached up to 37 cm (81 Mg ha−1 yr−1 ) and
       40 cm (87 Mg ha−1 yr−1 ) within the last 55 years, respectively. Cropland sites show high intra-slope variability
       with locations showing severe soil erosion located in direct proximity to sedimentation sites. This study shows
       the applicability of a valuable method to assess tropical soil redistribution and provides insight into soil degrada-
       tion rates and patterns in one of the most socio-economically and ecologically vulnerable regions of the world.

1   Introduction                                                    al., 2014) due to steep terrain and high rainfall erosivity with
                                                                    a strong intra-annual seasonality (Fick and Hijmans, 2017)
Soil erosion is considered to be the major threat to global soil    that causes sparse vegetation cover of soil at the end of the
resources and substantially contributes to crop yield reduc-        dry seasons but also throughout the cultivation period (Lewis
tion (Amundson et al., 2015; Montanarella et al., 2016; Gov-        and Nyamulinda, 1996; Fick and Hijmans, 2017) due to non-
ers et al., 2017), which challenges food security in regions        mechanised farming. The region is also predicted to undergo
facing population growth beyond sustainable limits in the           substantial climate change, which might further increase soil
21st century. In particular, the White Nile–Congo rift (NiCo)       erosion (Borrelli et al., 2020). The loss of soil resources and
region faces a strong impact of soil redistribution (Lewis and      crop yield decline in the NiCo region happens in parallel to
Nyamulinda, 1996; FAO and ITPS, 2015; Montanarella et al.,          a rapid population growth (population of Rwanda, Uganda
2016) and corresponding sediment delivery (Vanmaercke et            and the Democratic Republic of Congo 2020: 150 million –

Published by Copernicus Publications on behalf of the European Geosciences Union.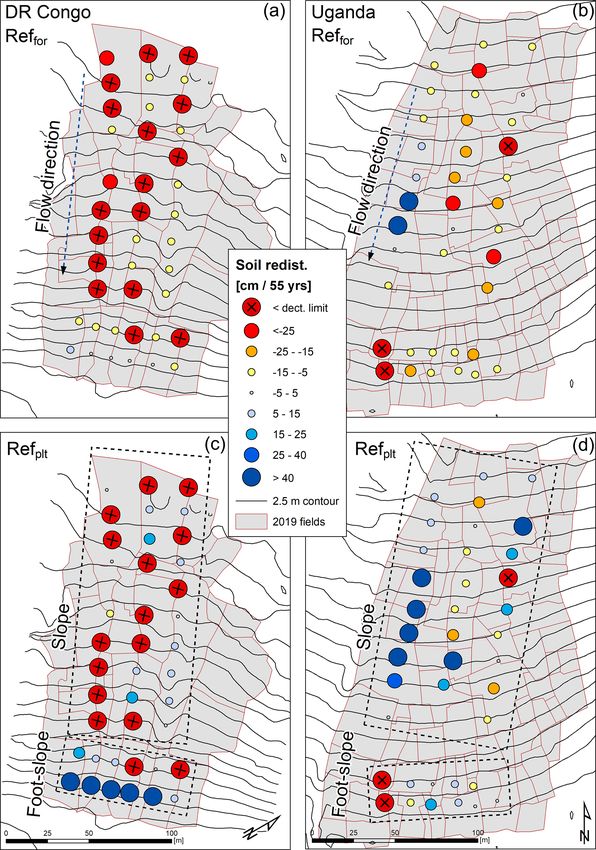
400                                            F. Wilken et al.: 239+240 Pu soil redistribution assessment in wet tropical Africa

predicted 2100: 430 million; WPR, 2020), which drives ris-         1993; Evrard et al., 2020). The most widely used fallout ra-
ing food demands that are expected to triple for the entire        dioisotope in soil redistribution studies is 137 Cs (e.g. Porto
sub-Saharan Africa between 2010 and 2050 (van Ittersum et          and Walling, 2012; Chartin et al., 2013; Evrard et al., 2020),
al., 2016). The associated pressure on land resources leads        which has a rather short half-life of about 30 years. Hence,
to various problems that will have dramatic ecological and         decay has already led to a pronounced reduction (73 % in
social impacts (food insecurity, political unrest, migration)      2020) of the 137 Cs activity until today (Alewell et al., 2017).
in the NiCo region (Chamberlin et al., 2014; FAO and ITPS,         In tropical and equatorial regions, this is a critical limitation
2015). Under current practices, an increasing demand in food       of using 137 Cs for soil redistribution analysis due to much
is typically compensated through deforestation to assess new       lower fallout compared to the mid-latitudes of the Northern
soil resources, which are often located in areas with steep        Hemisphere (Hardy et al., 1973; Evrard et al., 2020). Fur-
slopes (Govers et al., 2017). This causes a loss of highly         thermore, extreme soil erosion rates in the tropics (Lewis
valuable forest ecosystem services (e.g. carbon storage, bio-      and Nyamulinda, 1996; Angima et al., 2003; Nyesheja et
diversity, imbalance of the hydrological cycle) and the on-        al., 2019; Xiong et al., 2019) are additionally driving a de-
set of potential soil erosion at previously undisturbed sites      pletion of the 137 Cs inventories. To overcome these analyt-
(Nyssen et al., 2004) and often unsustainable use of soil re-      ical difficulties, the fallout radionuclides 239 Pu and 240 Pu
sources (Wynants et al., 2019). In steep cropland sites of the     have been discussed and tested as an alternative radioisotopic
NiCo region, it is frequently observed that the entire deep        tracer to 137 Cs for soil redistribution studies over the past
tropical saprolite body is removed and the bedrock is ex-          decade. The major advantage of both isotopes is their long
posed at the surface, which means a quasi-permanent loss           half-life (239 Pu = 24 110 years, 240 Pu = 6561 years). Fur-
of cropland and the option of reforesting areas for decadal to     thermore, 239 Pu and 240 Pu show a very limited plant uptake
centennial timescales (Evans et al., 2020). A pressing need        (Akleyev et al., 2000) and preferentially form associations
persists to predict future dynamics and timescales of crop-        with soil iron oxides (Ryan et al., 1998; Lal et al., 2013),
land degradation in order to understand the pace of a rising       which potentially makes the isotopes very suitable tracers
food shortage and to develop adapted agricultural manage-          for tropical environments dominated by Ferralsols. Hence,
ment strategies at suitable locations. Smart intensification of    the 239+240 Pu activity in tropical soils might be high enough
existing cropland soils due to adapted agricultural practices      to successfully carry out soil redistribution studies and pro-
in suitable locations and the conservation/restoration of soils    vide important insights into soil redistribution dynamics in
prone to erosion (e.g. reforestation or grassland use) has been    tropical Africa. Few fallout radionuclide-based soil redistri-
discussed as a key management strategy to combat degrada-          bution studies have been carried out in the tropics (Evrard et
tion (Govers et al., 2017). To develop a smart intensification     al., 2020) and, to the best of our knowledge, none was con-
plan, detailed information on soil degradation dynamics of         ducted in the wet tropics of Africa (Af, Am climate; Kottek
individual regions under specific conditions is essential (e.g.    et al., 2006).
land use, topography, soil type, rainfall characteristics). Soil      The aims of the study are (i) to test the suitability of fallout
erosion plot experiments were carried out in tropical Africa       radionuclides 239 Pu and 240 Pu as tracers of soil redistribution
(Lewis and Nyamulinda, 1996; Xiong et al., 2019) to under-         in the wet tropics of Africa and (ii) to analyse soil redistribu-
stand the rates of soil loss. However, plot experiments are        tion dynamics after conversion from forest into cropland for
limited to soil erosion processes, while soil redistribution dy-   selected sites within the East African NiCo region.
namics (interaction of erosion and sedimentation) remain un-
explained, although they are crucial for understanding soil
                                                                   2     Methods
degradation rates on a landscape scale. However, catchment
monitoring that provides insight into spatially distributed soil   2.1    Study sites and sampling design
redistribution dynamics necessitates a sufficiently long time
series (years to decades) to integrate a statistically repre-      The NiCo region is located in the headwater catchments of
sentative variety of erosive rainfall events impacting differ-     the White Nile (Lake Edward) and the Congo River (Lake
ent land-cover conditions (Fiener et al., 2019). Particularly      Kivu) that are part of the East African Rift Valley system
in regions of limited infrastructure, long-term catchment-         (Fig. 1). The region faces rapid population growth creating
monitoring projects are challenging and typically rare. This       substantial pressure on land resources and initiating conver-
problem can be overcome by the analysis of fallout radionu-        sion of forest into cropland. Soil degradation by water ero-
clides from nuclear weapon tests (i.e. 137 Cs, 239+240 Pu) as      sion is a recognised problem in the region (Lewis and Nya-
soil redistribution tracers (Meusburger et al., 2016; Alewell      mulinda, 1996; Montanarella et al., 2016) indicated via fre-
et al., 2017; Evrard et al., 2020), which have the major ad-       quent soil erosion events resulting in ephemeral rills and gul-
vantage of providing insight into spatial patterns of both soil    lies as well as permanent deep gully systems. The region is
erosion and sedimentation processes integrated over the pe-        characterised by steep terrain (Fig. 1; Table 1) and tropical
riod since 1963–1964 (test ban treaty that caused a rapid          climate with a mean annual air temperature between 16.7
decrease in atmospheric bomb tests; Wallbrink and Murray,          and 19.3 ◦ C and an annual rainfall ranging between 1300

SOIL, 7, 399–414, 2021                                                                  https://doi.org/10.5194/soil-7-399-2021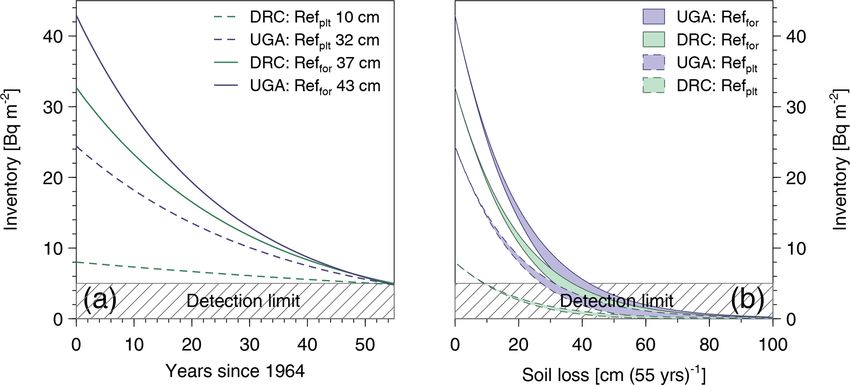
F. Wilken et al.: 239+240 Pu soil redistribution assessment in wet tropical Africa 401
Table 1. Coordinates and main characteristics of investigated study sites. Mean annual rainfall and temperature data are based on Fick and
Hijmans (2017).
Study site Location (lat., long., elevation) Max. Mean annual Mean annual Mean field
slope (◦ ) rainfall (mm) temperature (◦ C) size (m2 )
DRC forest 2◦ 190 S, 28◦ 440 E; 2208–2248 m 60 1925 15.2 –
Uganda forest 0◦ 280 N, 30◦ 220 E; 1271–1306 m 55 1277 20.7 –
Rwanda forest 2◦ 280 S, 29◦ 060 E; 1271–1306 m 60 1689 17.3 –
DRC cropland 2◦ 350 S, 28◦ 430 E; 1711–1747 m 17 1586 17.7 662
Uganda cropland 0◦ 340 N, 30◦ 200 E; 1470–1510 m 20 1459 19.5 336
occurring storm events with large rainfall amounts linked
to high rainfall intensities during the rain seasons (on av-
erage 20 erosive rainfall events per rain season; events ex-
ceeding 10 mm h−1 of rainfall per 30 min interval) (Doet-
terl et al., 2021b). Soils in the region are deeply weath-
ered Ferralsols (> 6 m; WRB, 2006; Doetterl et al., 2021a)
developed from three geochemically distinct parent materi-
als (DR Congo: mafic magmatic rocks; Uganda: felsic mag-
matic rocks; Rwanda: sedimentary rock of mixed geochem-
ical composition). Soils across the study area are typically
classified as clay loam, while at the Ugandan forest and crop-
land study sites a lower clay and higher sand content is found
(Doetterl et al., 2021a).
The forest sites in the study area are primary tropical
mountain forests (for detailed information, see Doetterl et al.,
2021a). Farming is documented since the 1950s for the site
in DR Congo, while conversion into cropland at the Ugandan
site took place during the 1970s (personal communication
with local villagers). The cropland sites represent the typical
smallholder farming found in the region, which is based on
small non-terraced fields with non-mechanised tillage prac-
tices. Due to the small fields (mean field size = 450 m2 ) and
an individual and dynamic field management, a high patchi-
ness of soil cover conditions is present and can alternate be-
tween bare soil and fully grown vegetation cover in direct
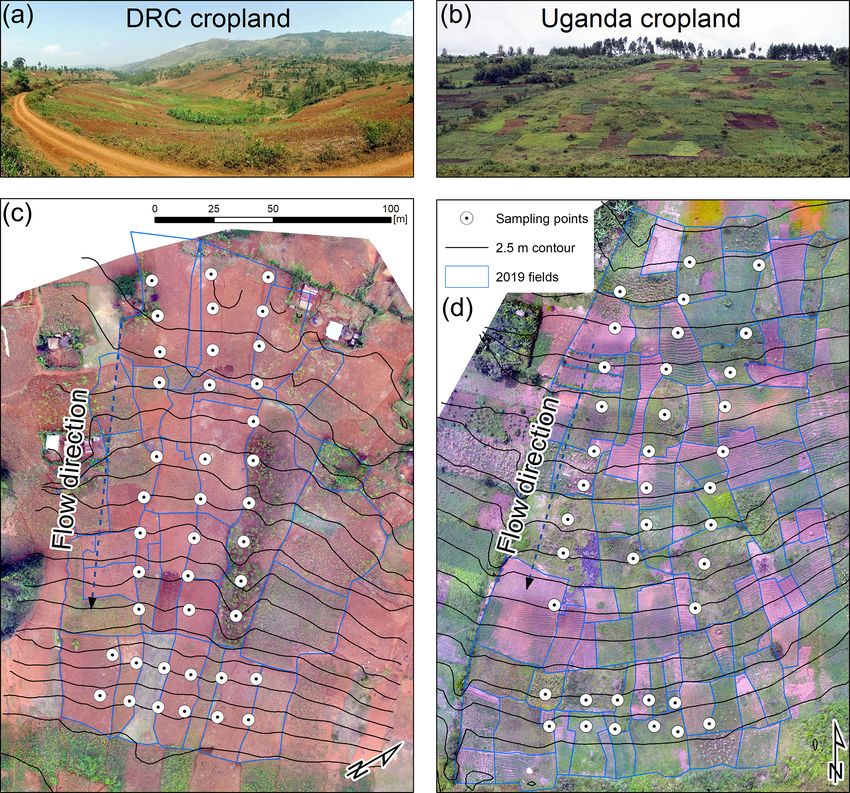
proximity to each other (Fig. A1 in the Appendix).
In 2018, a soil sampling campaign was carried out in three
pristine forests and two cropland sites in the NiCo region
in order to collect soil samples for a soil redistribution as-
sessment based on the fallout radionuclides 239 Pu and 240 Pu.
As part of this campaign, a total of 347 samples were taken.
Soil sampling was carried out using a manual closed-tube
soil corer (VSI soil core sampler, Vienna Scientific, Austria)
Figure 1. Study area, locations of forest and cropland sites, and
topography and land use in the White Nile–Congo rift region (land-
with a diameter of 6.8 cm and a length of 120 cm.
use data are based on ESA Climate Change Initiative – Land Cover Sampling sites in forests were located within the Kahuzi
project 2017). Biega (DR Congo), Kibale (Uganda) and Nyungwe For-
est (Rwanda) National Parks (Fig. 1). There, the sampling
scheme is aligned to a toposequence approach that covers
three different landscape positions situated along a catena:
and 1900 mm (time period 1970–2000; Fick and Hijmans, plateau, slope and foot-slope. Sampling was carried out at 19
2017). The seasonal rainfall distribution is subdivided into locations within each catena and covers different soil layers
two cycles of wet and dry seasons (Fick and Hijmans, 2017). (L horizon, O horizon and mineral soil; see Table 2). Discrete
The rainfall erosivity in the region is high due to frequently
https://doi.org/10.5194/soil-7-399-2021 SOIL, 7, 399–414, 2021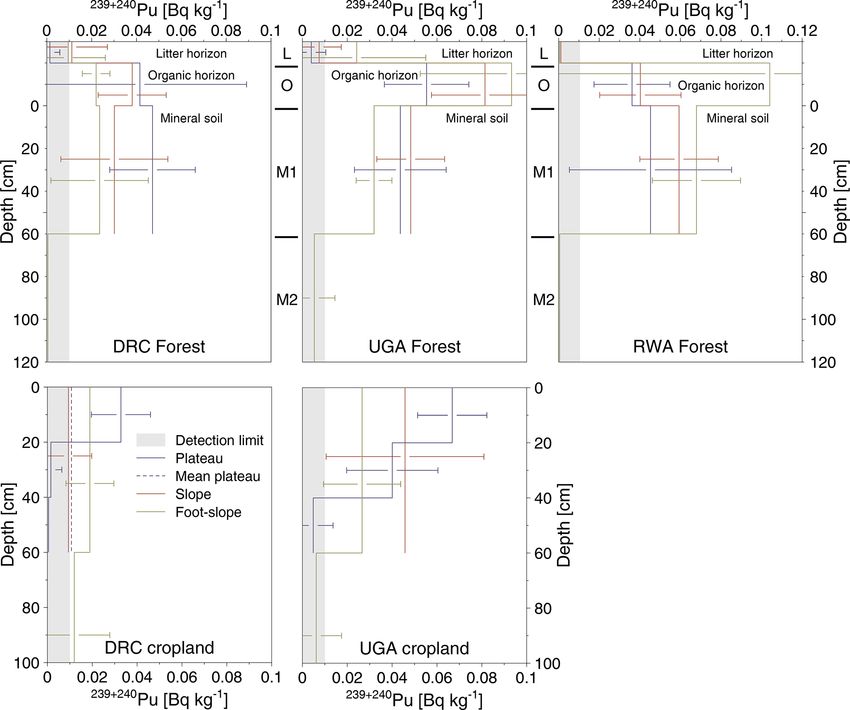
402                                                     F. Wilken et al.: 239+240 Pu soil redistribution assessment in wet tropical Africa

Table 2. Numbers of samples taken at three forest (DR Congo,                2.2 239+240 Pu measurements
Uganda, Rwanda) and two cropland (DR Congo, Uganda) study
sites. While the O-horizon depth is measured individually for each          An assessment of fallout radionuclide 239+240 Pu inventories
sample, the L-horizon depth is assumed to be 1 cm as it was not             was used to estimate effective soil redistribution since the
possible to be accurately measured. L: L horizon; O: O horizon;             1960s along the investigated geomorphic transects. Pluto-
M: mineral layers 1: 0–60 cm and 2: 60–120 cm in forest and 60–             nium isotope measurements were conducted following Cal-
100 cm in cropland.                                                         itri et al. (2019) and Ketterer et al. (2004). The chemical
                                                                            preparation consisted of the following sequence.
                                         Forest
                                                                              1. Soil material was milled and subsequently dry-ashed
                           Plateau      Slope      Foot-slope
                                                                                 for at least 8 h at 600 ◦ C to remove organic matter. An
           L, O, M1              10          6                 6                 aliquot of the dry-ashed material of up to 50 g was
           M2                     0          0                 6                 weighed into a 250 mL polypropylene bottle. Samples
                                       Cropland                                  were tested for excessive reaction of carbonates by ad-
                                                                                 dition of 5 mL of 8 M HNO3 .
                          Plateau∗      Slope      Foot-slope
           M1                    12         27                12              2. Samples were spiked using seven picograms (∼ 1 mBq)
           M2                     0          0                12                 of a 242 Pu tracer (NIST 4334 g) in the form of a solution
                                                                                 in 4 M aqueous HNO3 .
         *Three depth increments 0–20, 20–40, and 40–60 cm.
                                                                              3. 125 mL of 8 M aqueous HNO3 was added, with cau-
                                                                                 tion being exercised to add acid slowly when carbonates
sampling at plateau locations took place in order to quantify                    were present.
spatial variation in reference fallout inventories. To average
out the typical variability of fallout radionuclide inventories,              4. The sample vessels were capped and heated at 80 ◦ C
composite samples were taken at the slope and foot-slope po-                     overnight (∼ 16 h) with occasional mixing.
sitions. In addition to mineral soil layers, two organic layers
at two different levels of decomposition (L and O horizons)                   5. Following heating, the sample leach solutions were re-
were collected over an area of 20 cm × 20 cm at each sam-                        covered by filtration with 0.45 micron cellulose nitrate
pling site. About 40 % of the total forest samples were taken                    membranes.
at plateau positions (high proportion due to non-composite
sampling), while 30 % of the samples were taken at slope                      6. The plutonium was converted to the +4 oxidation state
and foot-slope locations, respectively. At foot-slope locations                  via addition of 0.5 g FeSO4 × 7H2 O dissolved in 2 mL
soils were additionally sampled from 60 to 120 cm soil depth                     water, followed by 2 g of NaNO2 dissolved in 5 mL wa-
to cover colluvial sites with 239+240 Pu activity in deeper soil                 ter. Thereafter, the solutions were heated uncapped in a
layers.                                                                          90 ◦ C convection oven for 1.5 h to release evolved NO2
   Sampling sites in cropland were placed along two catenae                      (g) and allow for conversion of the Pu into Pu(IV).
within DR Congo and in Uganda, covering 51 individual lo-
cations at each study site (Table 2). The majority (∼ 50 %) of                7. 300 mg of Pu-selective resin TEVA (EIChrom, Lisle, IL,
sampling sites are distributed along slope positions (12–13◦                     USA) was added to the sample solution; the mixtures
steepness in both cropland sites), while 25 % of sites are lo-                   were agitated over a 4 h time frame to allow for the resin
cated at foot-slope and plateau sites. To understand the depth                   to uptake the Pu(IV).
distribution of 239+240 Pu and the variability of radionuclide
                                                                              8. The TEVA resin was collected on a 20 mL polyethy-
inventories under stable geomorphic conditions, three depth
                                                                                 lene column equipped with a glass wool plug; the
increments of 20 cm thickness were taken to a total soil depth
                                                                                 pass-through solution was drained and discarded. The
of 60 cm at plateau sites. In DR Congo, a cropland plateau
                                                                                 columns were rinsed with the following sequence:
site (converted to grassland approximately in 2005) located
                                                                                 (i) 50 mL of 2 M aqueous HNO3 ; (ii) 20 mL of 9 M
about 8 km apart from the study site was sampled, while in
                                                                                 aqueous HCl; and (iii) 10 mL of 2 M aqueous HNO3 .
Uganda, flat plateau sites under arable use in direct proximity
                                                                                 The rinse sequence removes matrix elements, uranium
to the study site were sampled. At slope locations, a single
                                                                                 and thorium.
soil increment down to 60 cm was taken. At the foot-slope
locations, to cover potential sedimentation, an additional in-                9. Plutonium was eluted from the columns using the fol-
crement from 60 to 100 cm was sampled to ensure full cover                       lowing sequence: (i) 0.5 mL water; (ii) 0.5 mL of 0.05 M
of the radionuclide inventory.                                                   aqueous ammonium oxalate; and (iii) 0.5 mL water, all
                                                                                 of which were collected together for analysis directly
                                                                                 after elution.

SOIL, 7, 399–414, 2021                                                                          https://doi.org/10.5194/soil-7-399-2021
F. Wilken et al.: 239+240 Pu soil redistribution assessment in wet tropical Africa 403
In the preparations, quality control samples were included that simulates the 239+240 Pu inventory reduction on a year-
to assess the results; these consisted of blanks (35 g pow- by-year basis over the simulation period:
dered sandstone devoid of detectable Pu). Blanks consist-
ing of 35 g sandstone spiked with small quantities (50– Zyr
Ryr
100 mg) of IAEA 384 (Fangataufu sediment) were also pre- Ayr = Ayr−1963 1 − ,
d
pared. Eleven measurements of IAEA 384 resulted in an av- 1964
erage of 102 Bq kg−1239+240 Pu and a standard deviation of
10 Bq kg−1 ; these results compare well to the reference value where yr is the simulation year, Ayr is the 239+240 Pu inven-
of 107 Bq kg−1239+240 Pu. The blanks were used to determine tory at the specific simulation year in Bq m−2 , Ayr−1963 is
a detection limit of 0.01 Bq kg−1239+240 Pu. the annually updated 239+240 Pu inventory in Bq m−2 , d is
Sample Pu fractions were measured with a Thermo X Se- the average plough depth in m, and Ryr is soil erosion of the
ries II quadrupole ICP-MS (Bremen, Germany) equipped simulation year in m. Based on these results, an individual
with an APEX HF high-efficiency sample introduction logarithmic function between A and R for each study site
system (ESI Scientific, Omaha, NE, USA). The APEX was fitted that can be used to derive the amount of soil loss
is equipped with a self-aspirating concentric fluorinated in centimetres (55 yr)−1 .
ethylene–propylene nebuliser operating at an uptake rate of Sedimentation is represented as a linear increase in the in-
∼ 0.15 mL/min. The instrument is located at Northern Ari- ventory:
zona University; the laboratory is licensed with the State of
A
Arizona for handling 242 Pu spike solutions. The intensities Ri = −d 1 − ,
of 235 U, 239 Pu, 240 Pu and 242 Pu were recorded using a peak- Aref
jump algorithm (10 ms dwell time, 1000 sweeps/integration,
where Ri is the soil redistribution rate in m (55 yr)−1 , Aref
three integrations per sample). The 235 U isotope was mea-
is the 239+240 Pu reference inventory and Ai is the 239+240 Pu
sured as a proxy for 238 U, the latter whose intensity occa-
inventory at location i (more details on the Aref implementa-
sionally exceeded the linear range of the ICPMS’s pulse-
tion are given in Sect. 2.4).
counting detector; this was done in order to assess the po-
Finally, the 239+240 Pu activity (Bq m−2 ) was converted
tential interference of 238 U1 H+ on 239 Pu. As many samples
from topographic change (in m) into soil redistribution rates
exhibited relatively high levels of 238 U1 H+ , generating a po-
Yi in Mg ha−1 (55 yr)−1 as follows (Walling et al., 2011):
tential “false-positive” detection of 239 Pu, it was determined
to be advantageous to measure Pu using the 240 Pu isotope,
Ri
which is unaffected by uranium hydride species. The mea- Yi = 10 d Bi 1 − ,
d
sured atom ratio 240 Pu / 242 Pu was converted into a mass of
240 Pu detected, using the known mass of 242 Pu; the 240 Pu
where Bi is the bulk density in kg m−3 . Bi is measured for
activity was calculated and converted into the correspond- each mineral and O-horizon sample, while Bi for the L layer
ing 239+240 Pu activity based on the known 240 Pu / 239 Pu was taken from the literature, i.e. 80 kg m−3 (Wilcke et al.,
atom and activity ratios in stratospheric fallout Pu (Kelley 2002).
et al., 1999). The method resulted in a detection limit of
0.01 Bq kg−1239+240 Pu, which equates to a soil inventory
2.4 Cropland scenario assessment using a mass
of ca. 5–8 Bq m−2239+240 Pu for a bulk density of ∼ 0.8 to
balance model
∼ 1.3 Mg m−3 .
The mass balance soil mixing model was used to assess dif-
2.3 Cropland soil redistribution calculation
ferent scenario assumptions and their sensitivity. First, differ-
ent 239+240 Pu reference inventories were determined in two
To derive topographic change and corresponding soil redis- ways: (i) the mean 239+240 Pu inventory of all forest sites of a
tribution using 239+240 Pu inventories, a mass balance model specific region (Reffor , i.e. mean inventory of Kahuzi Biega
(Zhang et al., 2019) was applied integrating soil erosion and forest for the DR Congo cropland sites and Kibale forest for
sedimentation over the period 1964 to 2018. Soil erosion and the Ugandan cropland sites) and (ii) the mean 239+240 Pu in-
sedimentation processes were implemented (R Core Team, ventory of the cropland plateau sites of the specific region
2019) individually to account for differences of both pro- (Refplt ). These land-use-specific reference scenarios are sup-
cesses. posed to address potential differences between Reffor and
Due to topsoil loss by soil erosion, former soil from deeper Refplt to understand uncertainties associated with the refer-
layers with negligible low 239+240 Pu activity gets increas- ence determination. Second, the sensitivity of the ploughing
ingly incorporated into the plough layer. This exponential and corresponding mixing depth is assessed using a 20±5 cm
decay of the 239+240 Pu inventory is mainly controlled by ploughing depth deviation as the exact plough depth over the
the soil erosion magnitude and frequency and plough depth. integration period cannot be accurately derived. Third, to ad-
These processes are addressed by the mass balance model dress potential interannual variability of water erosion, a sce-
https://doi.org/10.5194/soil-7-399-2021 SOIL, 7, 399–414, 2021404 F. Wilken et al.: 239+240 Pu soil redistribution assessment in wet tropical Africa
is 41.3 Bq m−2 , whereas the measured 239+240 Pu activity
in the Kahuzi Biega forest is somewhat smaller compared
to the Kibale and Nyungwe forests (Fig. 2; Kahuzi Biega:
32.7 Bq m−2 , Kibale: 42.9 Bq m−2 ; Nyungwe: 48.4 Bq m−2 ).
The majority of L horizon samples fall below the 239+240 Pu
detection limit (0.01 Bq kg−1 ; 40 out of 55 samples). O hori-
zon samples show distinctively higher 239+240 Pu activities
(Fig. 3). However, the contribution of the O horizons to the
239+240 Pu inventory of the soil profile is small (mean: 1.2 %)
because of low bulk density (approx. 0.2 Mg m−3 ) and O
horizon thickness (mean 5 cm). Few (13 %, 7 of 55 samples)
of the 239+240 Pu activities of the 0 to 60 cm depth mineral
soil layers fall below the detection limit, while the 239+240 Pu
activities of samples within the detectable range are at least
3 times higher than the detection limit (Fig. 2). In contrast,
almost no activity is detected in the deeper soil layer from 60
to 120 cm.
Comparing the 239+240 Pu activities at different topo-
graphic positions does not result in a consistent 239+240 Pu
activity-to-topography relation (Fig. 3). While the foot-
slopes in Rwanda show the highest 239+240 Pu activities,
the opposite is the case for foot-slopes in Uganda and DR
Congo. At the plateau sites in Uganda and Rwanda, a lower
239+240 Pu activity compared to the slope sites is found.
A large 239+240 Pu activity standard deviation of the for-
est sites was found for all topographic positions (Fig. 3). The
mean 239+240 Pu inventories found at the slope and foot-slope
sites fall within the range of 1 standard deviation ± mean
239+240 Pu inventory of the corresponding plateau sites. The
only exception is the foot-slope in the Ugandan forest that
falls in range by 2 standard deviations of the plateau mean.
3.2 Cropland sites239+240 Pu activities and inventories
At both cropland study sites, a distinctively lower 239+240 Pu
activity relative to the forest sites is found. The lowest ac-
Figure 2. Distribution of 239+240 Pu inventories in three forests and tivity of 239+240 Pu is found at slope positions in DR Congo,
two cropland study sites. In (a) the 239+240 Pu histogram for three where 50 % (n = 16) of sampling sites fall below the detec-
forest sites is given, while (b) and (c) represent the cropland distri- tion limit. The measurable slope samples show a mean and
bution at the slope and foot-slope topographic positions. The verti- standard deviation of 0.019± < 0.01 Bq kg−1 . A pronounced
cal lines represent the mean values serving as the forest reference increase in the 239+240 Pu activities can be observed at foot-
(Reffor ) and cropland plateau reference (Refplt ). Red section on the slope positions with activity also detectable in the sampled
left of the graphs illustrates the detection limit.
60–100 cm deeper soil layer (Fig. 3). Hence, the 239+240 Pu
activity at the DR Congo cropland site follows a topography-
related spatial pattern from low activities at slope to elevated
nario with 5 extreme years producing the same total soil ero- activities at foot-slope positions.
sion as a 55-year continuous soil erosion rate was compared In comparison to the cropland study site in DR Congo,
against the results of the first scenario. the activities at the Ugandan cropland site are much
higher (mean 239+240 Pu activity at slope sites DR Congo:
3 Results 0.012 Bq kg−1 and Uganda: 0.046 Bq kg−1 ) and rarely (3
of 44 samples) fall below the detection limit. Variability of
239+240 Pu activities at the Ugandan site is extremely high and
3.1 Forest sites239+240 Pu activities and inventories
shows for slope positions a coefficient of variation of 76 %.
The mean inventory (i.e. sum of L, O and mineral hori- In contrast to DR Congo cropland, lower 239+240 Pu activi-
zons 239+240 Pu activities) of all the forest sampling sites ties are found at Ugandan foot-slope sites compared to slope
SOIL, 7, 399–414, 2021 https://doi.org/10.5194/soil-7-399-2021F. Wilken et al.: 239+240 Pu soil redistribution assessment in wet tropical Africa 405
Figure 3. Catenae-related depth profiles of 239+240 Pu activity and standard deviations (whisker) within three pristine forests (DRC: DR
Congo, UGA: Uganda, RWA: Rwanda) and two cropland study sites. Please note that the L and O horizons are for illustrative purposes
shown thicker than they naturally appear.
positions (Fig. 3). Furthermore, the Ugandan foot-slope posi- 239+240 Pu inventory that falls below the detection limit after
tions showed almost no 239+240 Pu activity in the deeper soil the model integration period of 55 years. The difference be-
layer of 60–100 cm soil depth (Fig. 3). tween the Reffor and Ref239+240
plt Pu baseline reference leads
DR Congo plateau sites (Refplt ), assumed to represent the to substantial differences in modelled erosion. The model in-
preserved full inventory of the global fallout, show a substan- dicates that at the DR Congo cropland sites, soil loss of at
tially lower 239+240 Pu inventory compared to the forest sites least 37 cm (55 yr)−1 is necessary before the 239+240 Pu ac-
located about 30 km apart (DR Congo Refplt : 8.0 Bq m−2 tivity falls below the detection limit using Reffor , while using
vs. mean forest Reffor : 32.7 Bq m−2 ). Similarly, Uganda Refplt at least 10 cm (55 yr)−1 of soil loss must have taken
cropland plateau sites 239+240 Pu inventory (24.4 Bq m−2 ) are place before the detection limit is reached. At the Ugandan
lower compared to nearby (∼ 10 km) forest sites but with cropland sites, a 239+240 Pu inventory reduction to reduce ac-
a lower relative difference compared to their DR Congo tivity below the detection limit is found for 43 cm soil loss
counterparts (relative difference Reffor vs. Refplt : Uganda (55 yr)−1 when applying Reffor and 32 cm (55 yr)−1 when
43 %, DR Congo 75 %). The 239+240 Pu activity below the 0– applying Refplt , respectively (Fig. 4).
20 cm topsoil layer at the plateau sites in DR Congo shows a Also, a pronounced sensitivity of the mass balance model
sharp reduction of the 239+240 Pu activity in deeper soil lay- to the tillage depth parameter is found. A deviation from an
ers (Fig. 3), while at the Ugandan cropland sites, soil layers assumed 20 cm plough depth of ±5 cm causes a change in
down to 40 cm show significant 239+240 Pu activity. the required soil loss until the detection limit is reached of
about ±24 %. Testing the low-frequency but high-magnitude
soil erosion scenario (only 5 extreme erosion years within a
3.3 Cropland soil erosion and sedimentation 55-year simulation period) showed that the detection limit is
reached already at 81 % of soil loss compared to the con-
An important piece of information that is provided by the tinuous 55-year erosion rate. Hence, the sensitivity of the
erosion module of the mass balance model is the minimum ±5 cm plough depth exceeds the impact of the erosion year
quantity of soil loss that is required to cause a reduction of the
https://doi.org/10.5194/soil-7-399-2021 SOIL, 7, 399–414, 2021406 F. Wilken et al.: 239+240 Pu soil redistribution assessment in wet tropical Africa
Figure 4. DR Congo (DRC) and Uganda (UGA) cropland soil erosion results of the mass balance model. A scenario assessment was carried
out to understand 239+240 Pu inventory reduction until the detection limit is reached after the simulation period: (a) soil erosion magnitude
and corresponding (b) soil erosion frequency according to the mean forest (Reffor ) and mean cropland plateau (Refplt ) assumptions. Panel
(a) represents the minimum quantity of soil erosion to pass the detection limit with different reference 239+240 Pu inventories. All displayed
curves show the corresponding scenario runs of minimum soil erosion to cause a 239+240 Pu inventory reduction that falls below the detection
limit. (b) Comparison between a continuous 55-year soil erosion rate vs. 5 erosive years that cause the same quantity of soil erosion. Soil
erosion from 1 to 100 cm (55 yr)−1 is simulated. The coloured area describes the difference between the two scenarios, where the lower line
is the 5-year scenario.
frequency, even for this extreme scenario assumption in the 6, Reffor : 2) and therefore suggests a limited impact of en-
NiCo ecosystem (approx. 20 erosive rainfall events per rain richment processes by selective transport of fine soil parti-
season). cles.
The number of sampling sites that are considered to
be subject to sedimentation is strongly controlled by
the assumption about the applied reference (Reffor and 4 Discussion
Refplt ). When using Reffor , four slope sites (DR Congo:
zero, Uganda: four) show sedimentation greater than 5 cm 4.1 Applicability of 239+240 Pu as a soil erosion tracer in
(55 yr)−1 . This number increased to 24 sites following Refplt tropical Africa
(DR Congo: 9, Uganda: 15). For both reference scenarios,
sedimentation at slope positions is much lower in DR Congo In this study, a 239+240 Pu-based soil redistribution analysis at
as compared to Ugandan cropland (Fig. 5). The foot-slope three forest and two cropland sites in the NiCo region was
sites in DR Congo show distinctively higher 239+240 Pu in- carried out. It is shown that for the majority of samples the
ventories compared to the slope sites (Fig. 5). However, the topsoil 239+240 Pu activity is high enough to be successfully
mean inventory of foot-slope positions is still lower than the measured and provide insight into soil redistribution in trop-
Ref239+240 Pu inventory (28 vs. 32 Bq m−2 ), which would be ical Africa over the past decades. To our knowledge, this is
for the first 239+240 Pu-based soil redistribution study in tropical
interpreted as an indicator of weak soil erosion consider-
ing Reffor for soil redistribution calculation. In contrast, if Africa.
Refplt is used in the calculation, the same foot-slope posi- The 239+240 Pu inventories found in this study are much
tions would be interpreted as sites that received substantial higher than expected based on the global fallout estimates
sedimentation exceeding 40 cm (55 yr)−1 (Fig. 5). The foot- reported by Kelley et al. (1999) and Hardy et al. (1973) (4.8
slope sites in DR Congo show pronounced 239+240 Pu activ- and 11.1 Bq m−2 for 10◦ N and 10◦ S). It is well established
ity in many samples of deeper soil layers (60–100 cm), while that the initial deposition of 239+240 Pu fallout was strongly
no such deeper soil layer 239+240 Pu activity is found at foot- dependent upon latitude; the study of Kelley et al. (1999)
slope sites of the Ugandan study site (Fig. 3). Simulated sed- compared 237 Np, 239 Pu and 240 Pu inventories from soil cores
imentation that exceeds the site-specific sampling depth mi- collected from undisturbed, worldwide locations. One data
nus the plough depth (i.e. 40 cm at the slope locations assum- point (Muguga, Kenya) included in the results of Kelley
ing a 20 cm plough depth) is rarely found for both reference et al. (1999) yields a 239+240 Pu inventory of 19.2 Bq m−2 ,
assumptions (DR Congo Refplt : 1, Reffor : 0; Uganda Refplt : which is significantly lower than the inventories for soils
in the mid-latitude regions of the Northern Hemisphere;
SOIL, 7, 399–414, 2021 https://doi.org/10.5194/soil-7-399-2021F. Wilken et al.: 239+240 Pu soil redistribution assessment in wet tropical Africa 407 Figure 5. Soil redistribution derived from 239+240 Pu measurements using a mass balance model. Two different reference inventories (a, b Reffor mean forest reference; c, d Refplt mean cropland plateau reference) in two cropland areas of the White Nile-Congo rift re- gion (a, c DR Congo; b, d Uganda) were used for calculation. e.g. Munich, Germany, exhibits a 239+240 Pu inventory of and 9.0◦ S, Luanda, Angola; Hardy et al., 1973; Kelley et al., 104 Bq m−2 . Although the results of Kelley et al. (1999) 1999). Both stations receive a substantially lower annual pre- are drawn from a limited set of samples, they nevertheless cipitation (960 and 430 mm for Kenya and Angola, respec- make the case for a strong dependency of inventory vs. lat- tively) than the NiCo region (> 1400 mm yr−1 ; Fick and Hi- itude, as well as annual precipitation, as factors that control jmans, 2017) and show contrasting 239+240 Pu inventories of the depositional inventory. For the latitudinal classification 19.2 Bq m−2 in Kenya and 3.4 Bq m−2 in Angola. Hence, it of Hardy et al. (1973), only two measurements between 0 is not surprising to find higher baseline 239+240 Pu inventories and 10◦ S were located in Africa (1.2◦ S, Muguga, Kenya, within the NiCo region than in Kenya or Angola. The three https://doi.org/10.5194/soil-7-399-2021 SOIL, 7, 399–414, 2021
408                                             F. Wilken et al.: 239+240 Pu soil redistribution assessment in wet tropical Africa

pristine forests show mean 239+240 Pu inventories between           of cropland plateau positions of the specific sites. A high
33 and 48 Bq m−2 (DR Congo: 32.7 ± 7.7 Bq m−2 ; Uganda:             variability of 239+240 Pu activities and corresponding inven-
42.91 ± 15.5 Bq m−2 ; Rwanda: 48.4 ± 18.2 Bq m−2 ), which           tories in three pristine tropical forests within similar topo-
is sufficiently high for conducting soil redistribution studies.    graphic positions that exceeds differences in Pu inventories
   However, half of the slope sites (14 of 28) at the crop-         along slope positions is found (Fig. 3). The variation of for-
land site in DR Congo fall below the detection limit                est 239+240 Pu inventories due to bioturbation and fallout infil-
(0.01 Bq kg−1 ; ∼ 5 Bq m−2 ). This is partly caused by the          tration patterns (e.g. caused by throughfall or stem flow pat-
sampling design of this study, which is based on large and          terns) exceeds a potential soil redistribution impact, which is
deep single soil increments that cover the soil depth from 0        illustrated by the standard deviation of the plateau sites that
to 60 cm and from 60 to 100 cm at the slope and foot-slope          covers the variability of the slope and foot-slope composite
positions. A straightforward way to increase the 239+240 Pu         samples (Fig. 3). Additional evidence that soil redistribution
activity in the sample is the reduction of the sample incre-        processes in the studied forest systems are low is that no ma-
ment depth for a corresponding increase in the topsoil pro-         jor differences between chemical and physical soil properties
portion that has a higher 239+240 Pu activity (see 20 cm in-        are found along geomorphic gradients (Reichenbach et al.,
crements taken at cropland plateau sites: Fig. 3). However, a       2021). This finding is in line with global erosion plot studies
reduction of the sampling increments necessarily requires an        from tropical forest plots (mean erosion 0.2 Mg ha−1 yr−1 ,
additional analysis of deeper soil layers in highly degraded        39 plots with 116 plot years; Xiong et al., 2019). Observa-
soil systems, particularly in regions with complex soil redis-      tions of sediment delivery monitoring in the NiCo region
tribution patterns to include the full 239+240 Pu inventory.        show that the amount of sediment delivery from pristine
   For future 239+240 Pu-based soil redistribution investiga-       forests is typically less than 1 Mg ha−1 yr−1 (personal com-
tions in tropical cropland areas, a two-layered sampling            munication with Simon Baumgartner, UCL runoff monitor-
scheme is suggested that individually samples the plough            ing FORSEDCO project). Furthermore, Drake et al. (2019)
layer and the deeper soil layer (e.g. 0–20 and 20–60 cm at          exemplarily showed in the NiCo region that particular mat-
a slope and an additional 60–100 cm sample at foot-slope            ter export within pristine tropical forest catchments is domi-
sites). The two-layered sampling scheme accounts for the            nated by organic matter export, with little to no mineral sed-
large number of samples falling below the detection limit and       iment being transported. In contrast, partly deforested catch-
allows for a better understanding of the 239+240 Pu depth dis-      ments with agricultural use show substantial carbon delivery
tribution and thereby depletion status of the sediment source       by organo-mineral complexes that indicates detachment and
area. In tropical forests, the sampling scheme can be focused       transport of the mineral soil layers, which is again in line
on mineral soil as the activity in the litter and organic layer     with the soil erosion results of this study (Drake et al., 2019).
does not substantially contribute to the 239+240 Pu inventory.      Hence, the forest sites are assumed to represent almost the
Sedimentation at the three forest study sites did not exceed        entire 239+240 Pu inventory of the baseline inventory with-
60 cm at the foot-slope, suggesting that a sampling depth of        out substantial loss due to soil erosion. The basic assump-
0–60 cm is sufficient to include the full inventory. Neverthe-      tion behind the reference sites is that the full inventory is
less, additional deeper soil sampling, with reduced increment       preserved as no soil redistribution has taken place and the
depth (e.g. 20 cm) at foot-slope locations, is suggested to ac-     239+240 Pu inventories of both Ref
                                                                                                         for and Refplt are supposed
count for different environmental conditions and potentially        to be similar. However, the mean cropland plateau 239+240 Pu
higher foot-slope sedimentation. The determination of appro-        inventory in Uganda is about half (24.4 ± 7.6 Bq m−2 ) and in
priate reference sites is critical. At plateau sites, three depth   DR Congo only a quarter (8.0 ± 1.0 Bq m−2 ) of the mean in-
increments (0–20; 20–40; 40–60 cm) were sampled to under-           ventories found in the nearby (< 30 km) pristine forest sites
stand the depth distribution of sites without substantial water     (Fig. 2), which cannot be explained by local rainfall hetero-
erosion. At the plateau sites, no 239+240 Pu activity was found     geneities and corresponding spatial patterns of the baseline
in the 40–60 cm soil layer. Hence, a single sample that in-         inventory. Deeper soil layers below 60 cm depth at crop-
tegrates soil from 0 to 40 cm depth seems to be sufficient.         land foot-slope positions show 239+240 Pu activity, which is
However, the number of reference samples should be high             a clear proxy for substantial sedimentation (Fig. 3). How-
enough to represent a robust mean with regards to 239+240 Pu        ever, the 239+240 Pu inventories of these locations do not ex-
variability typically associated with the corresponding land        ceed the forest reference inventory Reffor and would there-
use.                                                                fore be interpreted as weak soil erosion applying the mass
                                                                    balance model. This is unexpected and can point to a variety
4.2 239+240 Pu reference inventory
                                                                    of different processes at play that were not investigated by
                                                                    this study. The measured 239+240 Pu activity at the foot-slope
In this study, two different reference scenarios are taken into     positions may underestimate the 239+240 Pu inventory due to
account to address potential differences of 239+240 Pu inven-       three potential processes. (i) Sedimentation exceeds the sam-
tories between stable forest and cropland plateau positions:        pling depths that do not include the full inventory, (ii) de-
(i) Reffor mean of specific forest sites (ii) and Refplt mean       position of sediments that are already depleted in 239+240 Pu

SOIL, 7, 399–414, 2021                                                                   https://doi.org/10.5194/soil-7-399-2021
F. Wilken et al.: 239+240 Pu soil redistribution assessment in wet tropical Africa 409
as the inventory at the eroded source area has been sub- this discrepancy of the different duration since DR Congo
ject to pronounced soil and corresponding 239+240 Pu loss and Uganda tropical forest has been converted into crop-
and (iii) sedimentation sites may temporarily turn into ero- land. Forest into cropland conversion at the Ugandan study
sion sites. However, an indication of these processes would site took place during the 1970s. Hence, the area was under
be an increasing 239+240 Pu activity with soil depth, which arable use for about 40 years compared to 55 years (since the
is not reflected in the data (Fig. 3). Another potential ex- test ban treaty) at the DR Congo study site. Therefore, the
planation is that 239+240 Pu inventories are reduced due to Ugandan cropland was exposed to soil erosion for a roughly
plant uptake and subsequent plant harvest. However, a sub- 27 % shorter time compared to DR Congo cropland. How-
stantial plant uptake by crops, like that observed for the fall- ever, the relative 239+240 Pu inventory reduction at slope sites
out radionuclide 137 Cs (White and Broadley, 2000; Zhu and in Uganda is about 29 % compared to Reffor , while in DR
Smolders, 2000), is unlikely as no elevated 239+240 Pu activ- Congo the relative reduction is 83 %. The much stronger
ity was found in harvested crops of other studies (Akleyev et relative 239+240 Pu reduction in DR Congo cannot be just
al., 2000). Another potential pathway of soil and 239+240 Pu explained by the shorter cropland cultivation period of the
leaving the cropland plateau sites is harvest erosion associ- Ugandan cropland site. In direct comparison between the two
ated with commonly cultivated root crops (i.e. cassava, sweet sites, no major difference regarding slope steepness (12–13◦
potato, groundnuts). In temperate regions, harvest erosion in both study sites) and rainfall erosivity (Fenta et al., 2017)
rates up to 12 Mg ha−1 yr−1 have been reported for differ- was observed. The different land use during the main time
ent crop types (potato: 2.5–6 Mg ha−1 yr−1 ; Auerswald and of atmospheric nuclear weapon tests (DR Congo: cropland;
Schmidt, 1986; Belotserkovsky and Larinovo, 1988; Ruyss- Uganda: forest) might have caused higher spatial variability
chaert et al., 2007) (sugar beet: 5–8 Mg ha−1 yr−1 ; Auer- of the initial 239+240 Pu inventory associated with complex in-
swald et al., 2006) (chicory: 8.1–11.8 Mg ha−1 yr−1 ; Poesen filtration (e.g. stem flow) and throughfall patterns in forests
et al., 2001). With cassava and sweet potato being the main (Hofhansl et al., 2012). However, this small-scale variation is
food crops within the NiCo region (cassava has a higher pro- likely to be homogenised after 40 years of lateral soil move-
portion on the less fertile soils in the DR Congo, while more ment by plough-based arable use. The main cultivated crops
sweet potato is cultivated in Uganda), this is a likely source differ between the Ugandan and DR Congo study sites sub-
of reduction of 239+240 Pu inventories. To illustrate the poten- stantially. In Uganda sweet potato and maize are the major
tial effect of harvest erosion, a simple example shows that crops, while DR Congo cropland is dominated by cassava.
5.5 Mg ha−1 yr−1 of sediment delivery would roughly cause This difference may have an impact on water- and harvest-
a 20 % reduction of the baseline reference over 55 years (as- driven soil erosion processes.
suming a 20 cm plough depth and 1.35 Mg m−2 bulk den- The determined mean soil redistribution rates at crop-
sity). Harvest erosion can be assumed to be a process that has land slopes found in this study (negative values indi-
a limited spatial distribution as long as the land use and crop cate net erosion and positive values net sedimentation;
yields are not causing pronounced spatial patterns. There- DR Congo: −51.4 Mg ha−1 yr−1 Reffor , −1.4 Mg ha−1 yr−1
fore, in systems where harvest erosion is a relevant driver of Refplt ; Uganda (referring to 40 years of arable land use
239+240 Pu export, Ref would be the valid reference for soil and corresponding soil redistribution): −18.4 Mg ha−1 yr−1
plt
redistribution estimations. However, an accurate estimation Reffor and 27.8 Mg ha−1 yr−1 Refplt ) show contrasting re-
of the contribution of 239+240 Pu loss due to harvest erosion sults with respect to the assumed reference (Fig. 5). In com-
since the 1960s is impossible as limited information is avail- parison to values observed (Boardman and Poesen, 2006)
able on soil harvesting loss of cassava and potato by hand and modelled globally (Borrelli et al., 2017), the high ero-
cultivation. Therefore, both Reffor and Refplt are taken into sion Reffor simulations are in good agreement with plot-
account within this study to cover the range from a fully monitoring results observed in the region (mean soil loss
preserved to a depleted 239+240 Pu reference inventory in the of 68.2 Mg ha−1 yr−1 ; Lewis and Nyamulinda, 1996). Over
study sites. very short distances, high soil redistribution heterogeneities
ranging from sedimentation to heavy soil loss are found,
4.3 Soil redistribution in cropland of the NiCo region
which might be an effect of smallholder farming structures.
These farming structures are potentially mitigating soil loss
Both cropland sites show indications of soil redistribution. rates in the NiCo region due to decreasing hydrologic con-
Particularly the cropland study site in DR Congo shows ev- nectivity (Nunes et al., 2018; Baartman et al., 2020) along
idence of (i) soil loss due to a high number of slope sam- slopes due to a high degree of “patchiness” and a large num-
ples with activities falling below the detection limit (50 %) ber of field boundaries (mean field size 450 m2 ; Fig. 5). Any
and (ii) sedimentation as evidenced by a clear 239+240 Pu fin- conversion of this smallholder farming structure into large-
gerprint in the deeper soil layers of the foot-slope samples. scale farming structures, as known from regions with mecha-
Compared to the Ugandan cropland, the DR Congo crop- nised agriculture, will have devastating effects on soil degra-
land shows a much stronger difference between 239+240 Pu dation rates in the region.
inventories of slope positions and Reffor (Fig. 2). We relate
https://doi.org/10.5194/soil-7-399-2021 SOIL, 7, 399–414, 2021410 F. Wilken et al.: 239+240 Pu soil redistribution assessment in wet tropical Africa 5 Conclusions This study demonstrates the feasibility of analysing fallout radionuclides 239 Pu and 240 Pu as a tool to assess soil degra- dation processes in tropical Africa. Interpreting 239+240 Pu activity and inventories in soils and organic layers, we as- sessed soil redistribution rates along three pristine forest catenae and in two cropland catchments in the White Nile– Congo rift region. 239+240 Pu inventories in forest did not follow a topography-related distribution, which points to minor soil erosion. In contrast, cropland sites show signs of substantial soil erosion and sedimentation that exceed 40 cm over a period of 55 years. However, the selection of an appropriate reference is critical due to a potential 239+240 Pu inventory reduction associated with cropland use other than water erosion. Very high intra-slope variability of the 239+240 Pu inventories in cropland was found (coef- ficient of variation up to 67 %) with sites of pronounced sedimentation at close distance to highly eroded sites, po- tentially a result of soil cover dynamics due to smallholder farming structures with small fields and individual manage- ment. Keeping smallholder farming structures active is es- sential to mitigate soil degradation in the region, also under current agricultural intensification efforts. Particularly in re- gions with limited infrastructure and challenging monitoring conditions, 239+240 Pu-based soil redistribution analysis can shed light on the pace of soil degradation, which remains a major challenge for future food security in tropical Africa. SOIL, 7, 399–414, 2021 https://doi.org/10.5194/soil-7-399-2021
F. Wilken et al.: 239+240 Pu soil redistribution assessment in wet tropical Africa                                               411

Appendix A

Figure A1. Overview photos and orthomosaics of the DR Congo (a, c) and Uganda (b, d) cropland sites. Image acquisition dates: DR Congo
(a) overview photo 1 September 2018, (c) orthomosaic 14 September 2019; Uganda (b) overview photo 12 October 2019, (d) orthomosaic
12 June 2019.

https://doi.org/10.5194/soil-7-399-2021                                                                    SOIL, 7, 399–414, 2021
412                                                F. Wilken et al.: 239+240 Pu soil redistribution assessment in wet tropical Africa

Data availability. Data    description and data are available           Auerswald, K. and Schmidt, F.: Atlas der Erosionsgefährdung in
within the project TropSOC database publication Doet-                     Bayern, GLA-Fachberichte, 1, 1986.
terl et al. (2021a; https://doi.org/10.5194/essd-2021-73)               Auerswald, K., Gerl, G., and Kainz, M.: Influence of cropping sys-
and the corresponding database Doetterl et al. (2021b;                    tem on harvest erosion under potato, Soil Till. Res., 89, 22–34,
https://doi.org/10.5880/fidgeo.2021.009).                                 2006.
                                                                        Baartman, J. E. M., Nunes, J. P., Masselink, R., Dar-
                                                                          boux, F., Bielders, C., Degré, A., Cantreul, V., Cerdan,
Author contributions. This paper represents a result of colle-            O., Grangeon, T., Fiener, P., Wilken, F., Schindewolf, M.,
gial teamwork. FW, SD, PF and KvO developed the study design.             and Wainwright, J.: What do models tell us about wa-
239+240 Pu activity analysis was carried out by MK. DIM carried           ter and sediment connectivity?, Geomorphology, 367, 1–17,
out the field campaign. Data processing and illustration were carried     https://doi.org/10.1016/j.geomorph.2020.107300, 2020.
out by FW. FW, SD, PF, KVO and KM contributed to data analysis          Belotserkovsky, Y. and Larinovo, A.: Removal of soil by harvest
and interpretation. FW drafted the manuscript, while all the authors      of potatoes and root crops (in Russian), Vestnik Moskovskogo
reviewed and approved the final version.                                  Universiteta Seriia 5, Geografia, 4, 49–54, 1988.
                                                                        Boardman, J. and Poesen, J.: Soil Erosion in Europe: Ma-
                                                                          jor Processes, Causes and Consequences, in: Soil Ero-
Competing interests. The authors declare that they have no con-           sion in Europe, John Wiley & Sons, Ltd, 477–487,
flict of interest.                                                        https://doi.org/10.1002/0470859202, 2006.
                                                                        Borrelli, P., Robinson, D. A., Fleischer, L. R., Lugato, E., Bal-
                                                                          labio, C., Alewell, C., Meusburger, K., Modugno, S., Schütt,
                                                                          B., Ferro, V., Bagarello, V., Oost, K. V., Montanarella, L., and
Special issue statement. This article is part of the special is-
                                                                          Panagos, P.: An assessment of the global impact of 21st cen-
sue “Tropical biogeochemistry of soils in the Congo Basin and the
                                                                          tury land use change on soil erosion, Nat. Commun., 8, 1–13,
African Great Lakes region”. It is not associated with a conference.
                                                                          https://doi.org/10.1038/s41467-017-02142-7, 2017.
                                                                        Borrelli, P., Robinson, D. A., Panagos, P., Lugato, E., Yang, J. E.,
                                                                          Alewell, C., Wuepper, D., Montanarella, L., and Ballabio, C.:
Acknowledgements. We are grateful for the outstanding com-                Land use and climate change impacts on global soil erosion by
mitment for project TropSOC and fieldwork support by Landry               water (2015-2070), P. Natl. Acad. Sci. USA, 117, 21994–22001,
Cizugu, Benjamin Bukombe, Laurent Kidinda, and Mario Reichen-             https://doi.org/10.1073/pnas.2001403117, 2020.
bach and for lab work by Anna Stegmann, Julia Mayrock, Moritz           Calitri, F., Sommer, M., Norton, K., Temme, A., Brandova, D.,
Mainka, and Robin Unseld.                                                 Portes, R., Christl, M., Ketterer, M. E., and Egli, M.: Tracing the
                                                                          temporal evolution of soil redistribution rates in an agricultural
                                                                          landscape using Pu239+240 and Be-10, Earth Surf. Proc. Land.,
Financial support. This research has been supported by the                44, 1783–1798, https://doi.org/10.1002/esp.4612, 2019.
Deutsche Forschungsgemeinschaft (grant no. 387472333).                  Chamberlin, J., Jayne, T. S., and Headey, D.: Scarcity
                                                                          amidst abundance? Reassessing the potential for crop-
                                                                          land expansion in Africa, Food Policy, 48, 51–65,
Review statement. This paper was edited by Peter Finke and re-            https://doi.org/10.1016/j.foodpol.2014.05.002, 2014.
viewed by two anonymous referees.                                       Chartin, C., Evrard, O., Salvador-Blanes, S., Hinschberger,
                                                                          F., Van Oost, K., Lefevre, I., Daroussin, J., and Macaire,
                                                                          J. J.: Quantifying and modelling the impact of land con-
                                                                          solidation and field borders on soil redistribution in agri-
                                                                          cultural landscapes (1954-2009), Catena, 110, 184–195,
References                                                                https://doi.org/10.1016/j.catena.2013.06.006, 2013.
                                                                        Doetterl, S., Asifiwe, R., Baert, G., Bamba, F., Bauters, M., Boeckx,
Akleyev, A. V., Kostyuchenko, V. A., Peremyslova, L. M., Ba-              P., Bukombe, B., Cadisch, G., Cooper, M., Cizungu, L., Hoyt,
  turin, V. A., and Popova, I. Y.: Radioecological impacts                A., Kabaseke, C., Kalbitz, K., Kidinda, L., Maier, A., Mainka,
  of the Techa River contamination, Health Phys., 79, 36–47,              M., Mayrock, J., Muhindo, D., Mujinya, B., Mukotanyi, S.,
  https://doi.org/10.1097/00004032-200007000-00008, 2000.                 Nabahungu, L., Reichenbach, M., Rewald, B., Six, J., Stegmann,
Alewell, C., Pitois, A., Meusburger, K., Ketterer, M., and                A., Summerauer, L., Unseld, R., Vanlauwe, B., Van Oost, K.,
  Mabit, L.: Pu239+240 from “contaminant” to soil erosion                 Verheyen, K., Vogel, C., Wilken, F., and Fiener, P.: Organic mat-
  tracer: Where do we stand?, Earth-Sci. Rev., 172, 107–123,              ter cycling along geochemical, geomorphic and disturbance gra-
  https://doi.org/10.1016/j.earscirev.2017.07.009, 2017.                  dients in forests and cropland of the African Tropics – Project
Amundson, R., Berhe, A. A., Hopmans, J. W., Olson, C., Sztein,            TropSOC Database Version 1.0, Earth Syst. Sci. Data Dis-
  A. E., and Sparks, D. L.: Soil and human security in the 21st           cuss. [preprint], https://doi.org/10.5194/essd-2021-73, in review,
  century, Science, 348, 12610711–12610716, 2015.                         2021a.
Angima, S. D., Stott, D. E., O’Neill, M. K., Ong, C. K., and            Doetterl, S., Bukombe, B., Cooper, M., Kidinda, L., Muhindo, D.,
  Weesies, G. A.: Soil erosion prediction using RUSLE for central         Reichenbach, M., Stegmann, A., Summerauer, L., Wilken, F.,
  Kenyan highland conditions, Agric., Ecosyst. Environ., 97, 295–
  308, https://doi.org/10.1016/S0167-8809(03)00011-2, 2003.

SOIL, 7, 399–414, 2021                                                                        https://doi.org/10.5194/soil-7-399-2021
You can also read