"Trust Us": Mobile Phone Use Patterns Can Predict Individual Trust Propensity
←
→
Page content transcription
If your browser does not render page correctly, please read the page content below
“Trust Us”: Mobile Phone Use Patterns Can
                          Predict Individual Trust Propensity
                    Ghassan F. Bati                                                                       Vivek K. Singh
      Umm Al-Qura University and Rutgers University                                                      Rutgers University
       Makkah, Saudi Arabia and New Brunswick, NJ                                                       New Brunswick, NJ
                   gfbati@uqu.edu.sa                                                                    v.singh@rutgers.edu
ABSTRACT                                                                          technical systems [2]. For example, trust propensity strongly
An individual’s trust propensity - i.e., “a dispositional                         influences how an individual makes privacy and security
willingness to rely on others” - mediates multiple socio-                         decisions, consumes unverified news, and maintains
technical systems and has implications for their personal, and                    resources in shared online repositories e.g., [3, 4, 5, 6]. Such
societal, well-being. Hence, understanding and modeling an                        scenarios are only likely to grow with the expected growth
individual’s trust propensity is important for human-centered                     curves in shared economy, shared augmented reality spaces,
computing       research.    Conventional      methods      for                   and the social internet of things. Hence, understanding and
understanding trust propensities have been surveys and lab                        modeling an individual’s trust propensity is an important
experiments. We propose a new approach to model trust                             question for human-centered-computing researchers [7, 8].
propensity based on long-term phone use metadata that aims
to complement typical survey approaches with a lower-cost,                        Multiple recent efforts have attempted to elicit and model an
faster, and scalable alternative. Based on analysis of data                       individual’s trust propensity using different methods [9, 2].
from a 10-week field study (mobile phone logs) and “ground                        Nonetheless, such studies have mostly focused on traits
truth” survey involving 50 participants, we: (1) identify                         which could be simply observed (e.g., gender, race, age) or
multiple associations between phone-based social behavior                         elicited in a small period of time in lab settings (e.g., via
and trust propensity; (2) define a machine learning model                         surveys and game experiments). Unfortunately, the human-
that automatically infers a person’s trust propensity. The                        related information taken by observations in such restricted
results pave way for understanding trust at a societal scale                      and atypical settings must contend with numerous challenges
and have implications for personalized applications in the                        such as subjective observations, biases, and narrow
emerging social internet of things.                                               observation chances while dealing with pressures such as
                                                                                  budget, time, and the effort required [10].
Author Keywords
Trust Propensity; Mobile Sensing; Behavioral Sensing                              Recently, mobile phones along with sensor-based data have
                                                                                  been used by multiple researchers to construct rich and
ACM Classification Keywords                                                       individualized models of human behavior in social, spatial,
J.4 Computer Applications, Social and Behavioral Sciences                         and temporal settings, and link them to individual personality
INTRODUCTION                                                                      traits and cooperation tendencies [11, 12, 13]. In fact, some
Trust is a fundamental human concept that mediates multiple                       researchers consider smartphones to be a “vast psychological
human processes. It facilitates cooperation, supports                             questionnaire that we are constantly filling out, both
commerce, and enhances societal well-being [1]. With the                          consciously and unconsciously” [14].
growth in social networks, social internet of things, and                         Given such recent trends and the theoretical literature
cyber-physical systems, there is a renewed need to                                connecting trust propensity with social capital and social
understand and model people’s trust propensities as they                          habits such as maintaining interpersonal relationships [15,
connect with one another and with the devices around them.                        16], this study explores the creation of an automated phone
An individual’s trust propensity - i.e., “a dispositional                         data-based approach to model individual trust propensity.
willingness to rely on others” - mediates multiple socio-                         Such a phone-based method, if successful, could offer a low-
                                                                                  cost, fast, scalable, and automatic method for generating
Permission to make digital or hard copies of all or part of this work for         insights into trust propensities for millions of users with
personal or classroom use is granted without fee provided that copies are         applications in social computing, political systems, and
not made or distributed for profit or commercial advantage and that copies        sociology.
bear this notice and the full citation on the first page. Copyrights for
components of this work owned by others than ACM must be honored.                 Hence, building upon this line of work, this exploratory study
Abstracting with credit is permitted. To copy otherwise, or republish, to         examines the possibility of using phone metadata to
post on servers or to redistribute to lists, requires prior specific permission
and/or a fee. Request permissions from Permissions@acm.org.                       automatically infer an individual’s trust propensity by
CHI 2018, April 21–26, 2018, Montreal, QC, Canada                                 investigating the following research questions:
© 2018 Association for Computing Machinery.
ACM ISBN 978-1-4503-5620-6/18/04…$15.00                                           RQ1: Do long-term phone-use patterns have some
https://doi.org/10.1145/3173574.3173904                                           associations with an individual’s trust propensity?
RQ2: Can a machine learning algorithm be used to computational settings, trust influences purchase patterns in
automatically infer individual trust propensity based on electronic and mobile commerce [25]. Trust is also an
phone metadata? important mediator in how individuals deal with security
measures, online service agreements, and mobile commerce
In this work, we analyze the data from a ten-week field + lab
transactions [26, 27].
study to systematically study the interconnections between
phone-based behavioral measures (e.g., number of phone Measuring Trust Propensities
calls made) and “ground truth” trust propensity survey scores Multiple efforts have attempted to elicit an individual’s
[17] for 50 individuals. propensity to trust others [2, 9]. However, previous studies
have largely focused on demographic traits (e.g., gender,
The rest of the paper is organized as follows. First, we race) or used lab-based experiments (e.g., Dictator Game)
present the related work. Then, we describe the study [28, 29]. Using such methods for eliciting trust propensity
conducted. Next, we present the obtained results along with often constrain the scope of studies to factors that can be
their implications and limitations. Finally, we conclude the elicited in the lab settings. Thus, there have been very few
paper and suggest some potential future work. attempts that have studied the interconnections between long-
RELATED WORK term, “in the wild”, behavioral features based on mobility or
Trust has been studied across multiple disciplines (e.g., communication traces that range over time and space (e.g.,
information science, computer science, sociology, day/night call ratios, average travel distance) and the
psychology, political science, economy) in the past [9, 18, propensity to trust others.
19, 20, 21]. In this paper, we discuss the related work which Computational Modeling of Trust
is directly connected with the scope of this paper i.e., Several recent efforts have tried to model trust computational
modeling trust propensity using phone-based data. Hence, settings. Adali et al., define a computational model for
we discuss the related work that clarifies the terminology and interpersonal trust in [7], which treats trust as a social tie
suggests different ways to model trust propensities with a between a trustor and a trustee [30]. In this model, trust
specific focus on computational models of trust. We also develops as a part of an emotional relationship between a pair
review some applications and implications of trust as well as of people akin to the concepts of emotional and relational
the recent use of mobile phones to infer different behavioral trust. However, this is quite different from the focus of this
propensities and traits for individuals. paper on trust propensity, which is not specific to a
Trust as a Field of Study relationship, but rather captures an individual’s dispositional
Despite its importance and popularity in various disciplines, a willingness to rely on (all) others. Similarly, Farrahi & Zia
clear scientific definition of trust is not obvious [22]. The study the propagation of trust as a probabilistic stochastic
notions of trust, trust propensity, and trustworthiness are process [31]. Roy et al., propose a pair of complementary
often confused [9, 2, 23]. To remove confusion, we adopt measures to determine trust scores of actors in social
here the following definitions for these concepts: networks [19] and Zolfaghar & Aghaieb, focus on the
evolution of trust in social networks [32]. However, there are
Trust: “the intention to accept vulnerability to a trustee based
no existing efforts that study the interconnections between
on positive expectations of his or her actions” [2, p. 909].
individual trust propensities and phone-based data.
Trust propensity: “a dispositional willingness to rely on Trust and Social Capital
others” [2, p. 909]. An individual's trust propensity is often related to their social
Trustworthiness: “the willingness of a person B to act behavior [15, 16]. A very important concept in the study of
favorably towards a person A, when A has placed an implicit social behavior is social capital [33, 34]. Putnam [33]
or explicit demand or expectation for action on B” [9, p. 65]. characterizes social capital as trust, network structures, and
norms that promote cooperation among actors within a
While a person’s propensity to trust measures their overall society for their mutual benefit. He also suggests that formal
willingness to take risks and overall expectations of people to membership, civic participation, social trust, and altruism are
generally behave well, a trustworthy person acts respectfully indicators of social capital [34]. Such social capital often
and with consideration to the needs of other people. In this comes in two variants: bonding and bridging [33]. While
work, we focus on trust propensity. bonding social capital is associated with the presence of
Trust is an essential social concept for understanding human family and strong personal ties and provides emotional
behaviors in various fields. The presence of trust preserves support, bridging social capital is associated with the
many relations and produces much good [9]. For example, presence of acquaintances and weak ties that provide access
trust could allow for the use of low-cost informal agreements to newer information and resources. Both of these variants of
rather than expensive complex contracts [18]. In addition, social capital have been connected with trust in multiple
individuals in more trusting communities often feel happier studies [33, 35, 36, 37, 38].
and are more content with life, more involved with their local Recent HCI studies have connected social capital with phone
communities, and have more supportive friends [24]. In use behavior suggesting that phone use behavior could alsobe predictive of an individual’s trust propensity [39, 40, 41]. intended to be considerably lesser than what is usually
Trust has also been connected to maintaining inter-personal required by common apps (e.g., Instagram app on Android).
relationships especially in long distance relationships where The participation in the study was optional and the
face to face interaction is often not possible. Therefore, participants could withdraw from the study whenever they
phone usage patterns could help predict an individual’s trust like. The study was approved by the Institutional Review
propensity. Board and all personnel who handled the data in this study
were trained and certified in human subject research.
Using Mobile Phones to Understand Individual
Personality and Propensities
Mobile phones have become a primary communication
device used by billions of people globally. Majority of
contemporary mobile phones are equipped with several
sensors and there exists significant literature utilizing mobile
phone sensors to automatically infer individuals’ cooperation
propensities and personality traits [42, 13, 43]. Indeed, this
work builds upon a recent line of work on phoneotypic
modeling [13] which defines a phoneotype as the “composite
of an individual’s traits as observable via a mobile phone”.
Hence, it argues that a combination of phone-based
behavioral features could build a unique signature for an
individual which can predict facets of the individual’s life Figure 1. Screenshot of the Android App.
(e.g., propensity to cooperate). There are, thus far, no efforts While the study included 59 participants, some of the
which utilize phoneotypic, i.e., phone-based data, to define participants did not complete all the surveys, and some did
automated machine-learning approaches for modeling not enter their unique identifying code consistently across
individual trust propensities and this work seeks to address different surveys, resulting in 53 participants. Of these, three
this gap. participants uploaded location data very rarely (ten or lower
STUDY instances) - presumably because they turned off location
We study the interconnections between trust propensity and features on their phones - so we removed them from the
phone-based features based on the data gathered as part of dataset. This resulted in a dataset involving 50 (32 male, 18
Rutgers Well-being Study undertaken at Rutgers University. female) participants for whom we have the mobile-based
This study was a 10-week field and lab study conducted in data as well as the scores for the two surveys of interest
Spring 2015 including 59 participants, most of whom were (more details on surveys presented later). Most participants
undergraduate students at Rutgers. were in the age group of 18 to 21 years, and the most
common education level was “some college”. The median
Initially, all participants were invited to sign consent forms to income of the participants’ families ranged from US $50,000
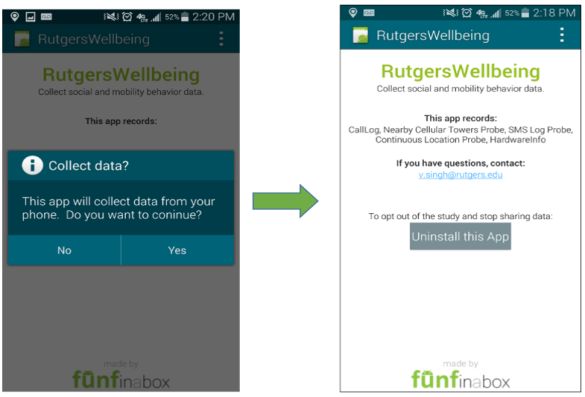
participate in the study and install an Android app that would to $74,999.
record their call, SMS, and GPS logs. Figure 1 shows a
screenshot of the app. The app was developed using the The 50 participants made a total of 25,302 calls with an
“Funf in a box” framework [44] and was released via a URL average of around 506 and a median of 302.5 calls per
shared with the study participants. participant and exchanged 177,263 SMS messages with an
average of 3,545 and a median of 2,347 per participant, and
The participants were also asked to attend three in-person visited 14,045 unique locations with an average of about 280
sessions where they filled out a number of surveys and a median of 295.5 per participant during the period of the
concerning their health, well-being, trust propensity, and study (10 weeks). Table 1 gives a summary of the total,
some demographics. The order of surveys was randomized mean, and median for calls, SMS, and locations.
for the participants. We use here the trust propensity and
demographics surveys for their relevance to this work. There Feature Total Mean Median
was a compensation of US $20, $30, and $50 respectively for
Calls 25,302 506.0 302.5
attending the sessions.
Participants’ privacy was of utmost priority; hence, SMS 177,263 3,545.3 2,347.4
anonymized IMEI numbers were used to recognize the Unique Locations 14,045 280.9 295.5
participants. All user data were anonymized before analysis.
Furthermore, the actual phone numbers or the content of the Table 1. Summary of Calls, SMS, and Location Logs.
calls or SMS messages were not available to the personnel Trust Propensity Descriptor
analyzing and processing the data at any point of time. The The literature discusses several ways of quantifying an
permissions required for this study’s app (call logs, SMS individual’s trust propensity. For example, games in
logs, location logs, and phone identifier information) were controlled lab settings (such as Trust Game) represent oneway of quantifying trust propensities [28, 29]. Surveys that Second, we consider a group of features that have been
draw individuals’ behavior in prepared scenarios are another selected to quantify the trajectories or the mobility behavior
option [17]. Furthermore, a third way is a combination of of the individuals. These features are related to the concepts
game experiments and lab surveys [18]. of mobility capital (location based analog to social capital)
and the notion of a “third place” [50, 51]. (A Third place is a
In this paper, we decided to use a well-known survey
place other than work and home used to build social ties and
“General Trust Scale” to measure trust propensity [17]. The
live a healthy life [51]). Prior research has connected such
survey has 6 questions whose responses scaled from (5)
mobility capital and access to third place with trust [52, 53].
“Strongly Agree” to (1) “Strongly Disagree” on a five points
Empirically, these features are based on the recent literature,
scale. Some examples of the questions are: “Most people are
which has been used to characterize human geo-mobility
basically honest” and “Most people are basically good and
patterns and study its interconnections with personality and
kind” [17, p. 147]. Besides the prevalent acceptance of the
mental health [43, 49].
survey (over 1,800 citations as per Google Scholar), we
chose this survey as the nature of these questions is not Third, we consider a set of features that capture the temporal
restricted to a specific context and the results could be rhythms of human behavior. Conceptually, these features are
interpreted in a wide variety of everyday applications. Also, associated with the notions of circadian rhythms and
the scale’s internal reliability ranges from 0.70 to 0.78 and chronotypes, which have been connected with trust and
several studies support its predictive validity [45, 46]. It was cooperation in the past literature [54, 55, 56]. Empirically,
developed by selecting items from important trust surveys these features have been based on recent works that have
and has been found to have robust associations with Big Five connected similar features with social capital, cooperation,
Personality traits [45, 46]. and well-being [41, 13, 57, 58].
The scores of the survey are averaged together and We focus on trust propensity which remains largely stable
normalized as a percentage of the maximum possible score. over time. According to [46], trust is an enduring trait, not a
Thus, the maximum theoretical trust propensity score is 100. transient state. All features here follow a key working
In the considered sample, the maximum was found to be 97, assumption based on Macey and Schneider’s model
the minimum was 40, the mean was 71.5, and the median connecting states, traits, and behaviors [59]. Propensity (trait)
was 73 as seen in Table 2. is not transient, but the behavior is affected by both the states
and traits. Traits are considered to be long-term
Minimum Maximum Mean Median predispositions, similar to personality attributes that are often
40 97 71.5 73 experientially manifested as states, which can be measured
indirectly through surveys. States may further manifest
Table 2. Summary of Trust Propensity Scores. through observable and directly measurable behaviors.
Demographic Descriptors
Hence, we hypothesize that an individual trust propensity
The participants were surveyed about their demography. traits manifest themselves in the *long-term* behavior
Specifically, we obtained the following information: age, patterns of the users [13, 60]. A summary of the features
gender, marital, level of education (school), and level of (N=24) is presented in Table 3.
family’s income. 1. Social Behavior
Mobile Phone Data Features Social Activity
Trust and socio-mobile behavior have been (indirectly) We quantify the level of social activity as the number of
connected in the past literature in both conceptual and exchanged phone calls, SMS messages, and unique visited
empirical ways. In this work, we consider three major types locations. A higher count of social activity level suggests an
of socio-mobile features to predict trust propensities. active user and multiple studies have connected individual
First, social capital as a concept is connected with both phone social activity with social capital and/or trust propensities.
use behavior [41] and trust propensities [37, 38]. Hence, we High social activity has also been connected with reducing
consider a number of phone based features (e.g., number of relational uncertainty and as a means of establishing trust in
phone calls, diversity of contacts, and engagement with interpersonal relationships [22, 61].
strong ties) based on the recent literature on using phone We also consider location logs (physical movements) as a
meta-data to predict individual social capital or personality proxy of one type of social behavior for it has been used
traits [43, 13, 41]. In doing so, we do not only consider the previously to comprehend human social behaviors [48, 49,
frequently used call and SMS metadata, but also consider 13]. The visited locations were updated hourly to balance
GPS (location) metadata, which are increasingly being between getting an idea about the pattern of a user’s
adopted as indicators of physical social activity [47, 48] and movement and their phone’s battery life.
also as predictors of an individual’s traits and states in their
own right [13, 49].Type Literature Support Features
Social Activity (Call, SMS, GPS)
o ∑Activity
Conceptual:
Diversity (Call, SMS, GPS)
Social Behavior Features
Social Capital o Di = − ∑j pij log b p
Putnam [33]; Granovetter [62];
Novelty (Call, SMS, GPS)
Golbeck [61]; Coleman [63] ∑ New Contacts
o Percent New Contacts= ∑ X 100
All Contacts
Empirical:
Eagle et al. [64]; Shmueli et al. [22]; Tie Strength (Call, SMS, GPS)
o Strong Tie Engagement Ratio =
Gilbert et al. [65]; deMontjoye et al. [43]; ∑communication for highest 1/3 contacts
X 100
∑ communication
Singh & Agarwal [13]; o Weak Tie Engagement Ratio =
∑communication for lowest 1/3 contacts
X 100
∑ communication
Conceptual:
Spatial Trajectory Features
∑distance from centroid for each location visited
Mobility Capital Gyradius =
number of locations visited
Golbeck [61]; Coleman [63]; ||Long Distance Trips||
Percent Long Distance Trips = X 100
||All Trips||
Third Place
Oldenburg [51]; Location Loyalty =
∑(time spent in top three locations)
X 100
∑(time spent in all locations)
Empirical:
∑(time spent in third place)
Pappalardo et al. [66]; Canzian et al. [49]; Percent Time Third Place = X 100
∑(time spent in all locations)
Singh & Agarwal [13]; Singh et al. [67]
Conceptual:
Temporal Rhythm
Circadian Cycles & Chronotypes
Diurnal Activity Ratio (Call, SMS, GPS)
Features
Jonassona [54]; Lyons [55]; ∑Activity when productive
o DAR =
∑Activity when relaxed
Empirical: Weekday/Weekend Activity Ratio (Call, SMS)
∑(Call,SMS)in weekdays
Abdullah et al. [58]; Saeb et al. [57]; o WWAR =
∑(Call,SMS)in weekends
deMontjoye et al. [43]; Singh & Ghosh [41];
Table 3. Summary of Phoneotypic (phone-based) Features Defined in this Study.
To avoid getting the same amount of locations per participant Where pij is the percentage of social events involving
(24 locations/day), we only count unique locations. The individual ‘i’ and contact ‘j', and 'b' is the total number of
location data were obtained from a mobile phone’s GPS as such contacts.
tuple at fourth decimal point resolution,
Novelty
which roughly corresponds to 10m by 10m blocks [13, 68]. The growth of networks plays an important role in social
Social Activity (Call, SMS, GPS) = ∑Activity capital [70]. Hence, we also consider “new contacts” that are
not present in the first four weeks of the data collection
Diversity
period. This feature quantifies how much time users devote
We are not only considering the total amount of calls, SMS
to their new contacts as compared to their frequent contacts.
messages, and unique locations, but also the diversity
(measured as Shannon Entropy) for each one of them, as ∑ New Contacts
such a diversity metric has been reported to be associated Percent New Contacts = X 100
∑ All Contacts
with multiple personal well-being outcomes and personality
Tie Strength
traits [12, 69].
Previous studies have related strength of ties and trust [71].
Di = − ∑j pij log b pij Such literature underscores the value of maintaining
relationships with both strong and weak ties, and each mayyield different types of social capital, and presumably, over ∑(time spent in top three locations)
LocationLoyalty = X 100
periods of time, a propensity to trust others. ∑(time spent in all locations)
Following Williams [72], we connect the concepts of Percentage Time Third Place
‘bonding’ and ‘bridging’ social capital to those of ‘strong’ We also introduce here the third place feature which
and ‘weak’ ties as proposed by Granovetter and other represents the percentage of time spent at the third most
researchers [62, 65, 73]. We conjecture that the relative visited location by a participant. This is based on the
spread (or concentration) of communication with strong sociological concept of “third place”, proposed by Ray
(respectively weak) ties may be a predictor of one’s Oldenburg, which states that a person needs a third place -
propensity to trust others. It is anticipated that a person would other than work and home (e.g., library, café, worshipping
devote at least 33% of their time with their top-third most house) - to build social ties and live a healthy life [51]. Past
frequent contacts (proxy for strong ties) [13]. Nonetheless, a research has connected third places with social capital and
high score like 85% may indicate an individual’s preference trust [53].
to intentionally engage more with strong ties rather than ∑(time spent in third place)
distributing the communication effort more equally amongst Percent Time Third Place = X 100
∑(time spent in all places)
all ties. Hence, we define the following features:
3. Temporal Rhythms
Strong Tie Engagement Ratio
∑communication for highest 1/3 contacts Prior literature has connected circadian cycles, Dark Triad
(STER)= X 100 (i.e., narcissism, machiavellianism, and psychopathy) and
∑ communication
trust [54, 55]. The classification of different individual’s
Weak Tie Engagement Ratio
∑communication for lowest 1/3 contacts chronotype - the tendency for the individual to sleep at a
(WTER)= X 100 particular time during a day-and/or-night period (24-hour) -
∑ communication
has been connected with cheating and machiavellianism [56].
2. Spatial Trajectories
Diurnal Activity Ratio
Prior research has connected a number of mobility or spatial When we asked some of the participants about their daily
trajectory related concepts (e.g., mobility capital and access activities regarding times when they become productive, and
to third place) with trust [52, 53]. Hence, we consider a times when they tend to play or sleep (relax), we found that
number of GPS related features to quantify individual there are two main states: “productive” state from 8 am to 8
behavior. pm; “relax” state from 8 pm to 8 am. Hence, to quantify daily
Gyradius patterns of activity and the differences between different
To get a sense about the location distribution of a participant phases, we define the following features:
(physical activity), we determine the gyradius (radius of ∑(Call, SMS, Location)when productive(8am to 8pm)
gyration) which is computed as follows. First, we identify the
centroid of all the distinct points that a person has visited. ∑(Call, SMS, Location)when relaxed(8pm to 8am)
Next, we calculate the distance to all points from this center Weekday/Weekend Activity Ratio
point. The average of such distances traveled is the gyradius We added another layer of characterization for the
[74]. abovementioned two states of the daily activity ratio
(productive and relaxed) to get more insights out of these
∑distance from centroid for each location
Gyradius = circadian rhythms by quantifying the weekdays (Monday to
number of locations visited Friday) to weekends (Saturday and Sunday) communication
Percentage Long-distance Trips (Call, SMS) ratio.
An individual’s access to new resources and information is
∑(Call, SMS)in weekdays
likely to be a function of their access to “far-away” people
and places. Hence, we also define a feature called Percentage ∑(Call, SMS)in weekends
Long-distance trips to quantify the ratio of long distance RESULTS
(above 100 km) trips undertaken by the individual. Since multiple applications vary in their requirements of
||Long Distance Trips|| either predicting an exact numeric trust propensity score or
Percent Longdistance Trips = X 100 working with broader classifications of trust propensity
||All Trips||
score, we consider both types of applications by undertaking
Location Loyalty linear regression and classification analyses as follows.
Location loyalty considers how frequently participants
Building a Regression Model for Trust Propensity
engage with their favorite locations. Past research has Here, we first consider predicting trust propensity level as a
connected this loyalty feature with individual well-being regression problem; that is, predicting an outcome variable
[75]. Precisely, we calculate the percentage of time spent in (i.e., trust propensity level) from a set of input predictors (i.e.,
their top three frequented visited locations out of all visited phone-based features). We use the Lasso (Least Absolute
locations. Shrinkage and Selection Operator) regression approach toundertake this [76]. Lasso is a specialized form of regression model. However, the demographic features were useful in
suitable for scenarios where there are relatively more number increasing the correlation score for the phoneotypic model,
of features for a given sample size. It tries to minimize thus suggesting that phoneotypic features and demographic
overfitting by penalizing the presence of too many features in features are not merely proxies for each other, but rather add
the eventual model. It has been applied in similar contexts (in newer information when combined.
terms of sample size, number of features, and application) in
recent human-centered computing research [11, 41]. Model Type Cor SD MAE SD
Similarly, following [11, 41] we evaluate the regression Demography Only 0.274 0.062 9.146 0.416
models using the metrics of correlation scores (Cor) (between
predicted and actual outcome variables) and the Mean Phoneotype Only 0.538 0.153 7.913 1.776
Absolute Error (MAE). While a higher correlation (closer to
Both 0.544 0.153 7.711 1.541
1) suggests a higher predictive ability of the considered
models, smaller MAE is preferred as it shows that the Table 4. Average Results for Modeling Trust Propensities Using
predictions are closer to the ground truth. Different Regression Models.
We ran and tested three different regression models: one with Building a Classification Model for Trust Propensity
the demographic features only, another one with the Next, we consider the task of building automated classifiers
phoneotypic (phone-based) features only, and a third one for trust propensities. In prior research, the same Yamagashi
with a combination of both types of features. The trust scale was used to separate participants into groups of
implementation was undertaken using R 3.4.1 [77] and its high and low trustors [46]. The survey results predicted
Lars 1.2 package [78]. To test the statistical significance of behavioral differences between groups of individuals. For
these three models, we need an estimate of the (variance) in instance, groups of high trustors were more likely to
the effects found. To estimate this, we undertook 100-fold cooperate and reciprocate across variations of the prisoner’s
bootstrapping for each Lasso regression model and then dilemma and public goods problems [46]. This motivates the
undertook unpaired t-tests for the correlation and MAE analysis on the (phone-based) behavioral differences between
scores obtained. All comparisons were found to be high and low trustors and create computational models to be
statistically different at alpha= 0.05 level i.e., Both *>* used in other applications. For instance, an application
Phoneotype *>* Demography (*>* means statistically provider may want to recommend different default privacy
significantly higher performance). Table 4 presents the settings for individuals with “high” and “low” trust
average results for modeling trust propensities using various propensity.
regression models.
Given that there is no universal definition of “high” and
The demography based model obtained on average a “low” trust propensity, for this exploratory work, we divided
correlation of 0.274 (MAE=9.146). The low - but significant the participants into two groups based on the median value
- scores for the “demography only” model indicates that the (73) for trust propensity survey instrument. The first group
demographic features can explain some (but not a lot) of (“low” propensity) has 23 participants whose trust score is
variance in the trust propensity levels. Phone-based model lower than the median, whereas the second group (“high
performed much better with an average correlation score of propensity”) has 27 participants whose trust score is higher
0.538 (MAE=7.913). than or equal to the median.
The combined model using phoneotype and demography Demography
features performed the best in terms of all metrics and the Age, School (education level)
Only
predicted trust propensity was found to have 0.544
correlation on average with the actual propensity scores Phoneotype
SMS Entropy, Weekday Weekend Call Ratio
(MAE=7.711). This MAE signifies that the predictions are Only
within ±7.711 of the absolute value of the trust propensity SMS Entropy, Weekday Weekend Call Ratio,
scores obtained by the survey (ground truth). Since the trust Both
Age
propensity scores obtained by the survey vary from 40 to 97
as shown in Table 2, ranges of ±7.711 could be considered a Table 5. Selected Features for Different Prediction Models.
reasonable approximation.
Similar to the previous analysis, we built three models: one
Also, we clearly see that the phoneotype model and with the demographic features only, another one with the
“phoneotype + demography” (both) models yield phoneotypic features only, and a third one with a
considerably better models than the demography-based combination of both types of features.Demography Only Phoneotype Only Both
Method
AUC CA F1 AUC CA F1 AUC CA F1
AdaBoost 0.68 0.69 0.66 0.81 0.76 0.75 0.83 0.79 0.78
Random Forest 0.58 0.62 0.60 0.79 0.77 0.75 0.82 0.78 0.77
KStar 0.63 0.62 0.60 0.73 0.64 0.62 0.80 0.73 0.72
Zero-R 0.50 0.54 0.38 0.50 0.54 0.38 0.50 0.54 0.38
Table 6. Average Results of Trust Propensity Levels Using Different Classification Methods.
We used CfsSubsetEval (Correlation-based Feature Subset We also considered the cases where the demographic data
Selection) [79] with leave-one-out cross-validation in Weka may be available to the phone app. In such a case, the
3.8.1 [80, 81] which ranks the best subset of the 24 features combined model (demography + phoneotype data) yielded an
described previously by determining the predictive capability even higher performance with a CA of 79%, AUC of 0.83,
of each feature in company with the degree of redundancy and F1 of 0.78.
between them. The best subsets of features are correlated
Hence, we note that a phone-features based model beats
with the target variable and have low intercorrelation [79].
baseline majority classification and also goes beyond static
We found that the best subsets of features in most of the folds
demographic descriptors (e.g. age, gender, education) for
are the ones shown in Table 5.
predicting trust propensities. This underscores the potential
To define and test a machine learning based classifier whose for using phone-based (phoneotypic) features to build
phoneotypic features can statistically significantly improve automatic classifiers for individual trust propensities. One
the ability of predicting trust propensity when compared to way to interpret these results is that having mobile sensing
the demographic features, we took 10-fold cross-validation data for 10 weeks may allow for the creation of a detailed
and repeated it 10 times to get 100 different values for CA, model for personal behavior based on the aforementioned
AUC, and F1 and build the predictive models. AUC stands idea of phone behavior being akin to a vast psychological
for (Area Under the Receiver Operating Characteristic questionnaire, being constantly filled out [84].
Curve), CA means classification accuracy and F1 score
Behavioral Features Associated with Trust Propensity
represents the harmonic mean between precision and recall Besides creating automated methods for identifying an
[82, 83]. The aforementioned features were used to test out individual’s trust propensity levels, one of the goals of this
three well-known machine learning algorithms for work is to understand the socio-mobile behavior of
classification. Specifically, we used Adaptive Boosting individuals with different propensities to trust. Thus, we
(AdaBoost), Random Forest, and KStar. We also used a undertook a post-hoc Pearson’s correlation analysis between
Zero-R model which simply classifies all the instances into trust propensity scores and the phoneotypic features. In the
the majority class, as a baseline to help interpreting the interest of space, we only report the correlations that were
performance of the considered models. Statistical comparison found to be (at least marginally i.e., p*
Demography, Both *>* Demography, Both (not significantly Feature r p-value
different from) Phoneotype; (*>* means statistically o
significantly higher performance). All three models above Social Activity (Call) +0.237 0.097
were significantly better than Zero-R. Strong Tie Engagement Ratio (Call) +0.249o 0.081
Table 6 shows that the demography-based model returned the Weekday Weekend Ratio (Call) +0.371** 0.008
best CA of 69%, AUC of 0.68, and F1 score of 0.66. The
o
phoneotype-based model yielded a better classification Gyradius -0.271 0.057
performance and the best CA was 77%, AUC was 0.81, and
Percent Time Third Place -0.252 o 0.078
F1 was 0.75. While the demographic features contained some
predictive power, we observe that phoneotypic models Table 7. Pearson’s Correlation between Phone-based Features
considerably outperform demographic models. and Trust Propensity. Significance Codes (** 0.01,* 0.05,o 0.10).
It is also clear that the phoneotypic model outperformed the We note that people who have high trust propensity tend to
Zero-R model. The phoneotypic model performed 62% better be more socially active, yet tend to limit or concentrate their
than the Zero-R model in terms of AUC, 42.6% better in social activities both spatially and temporally. For instance,
terms of CA, and 97.4% better in terms of F1. individuals with higher trust propensity tend to call more
often (r= +0.237). This can be understood as trust propensityis associated with healthy social relationships and higher call According to the social identity and self-categorization
activity captures such behavior [24, 18]. theories, group-based stereotypes or in-group
favoring behaviors might explain how an individual trusts
Next, we notice that individuals with higher trust propensity
strangers [86]. While individuals normally have good
tend to have higher preference for concentrating social
expectations on strangers (out-group members), they
activities in multiple ways. First, they show a marked
anticipate a better treatment when it comes to in-group
preference for engaging in phone calls with their “strong ties”
members (in-group favoritism) which eventually transforms
as opposed to spending it equitably with all contacts (r=
into a greater trust propensity to an in-group, not an out-
+0.249). The notion of concentrating social activities
group member [87, 86, 88]. Constant interactions with such
continues temporally and we notice that the individuals with
in-group members may result in a longer-term internalization
higher trust propensity tend to concentrate their calling more
of this trust propensity. All of these aspects are associated
over the weekdays as opposed to spreading it evenly across
with the positive association observed between concentrating
all days of the week (r= +0.371).
social activities - socially and geographically - and a higher
This aspect of concentrating activities becomes even more trust propensity.
prominent when we consider their spatial trajectories.
The relational uncertainty theory (RUT), which studies the
Individuals with higher trust propensity tend to have a
degree of confidence people have in their perceptions of
smaller gyradius (r= -0.271) and spend less time at even their
involvement within interpersonal relationships [89] gives yet
third-favorite place (r= -0.252), presumably preferring to
another perspective to understand the results. It suggests that
spend time at their top two favorite locations. One way to
trust in long distance relationships is negatively associated
interpret these results is that those who travel further and
with relational uncertainty and reducing uncertainty via
frequently tend to have limited chances to build strong ties
constant communication (Social Activity (Call), Strong Tie
and the lack of strong ties has been associated with a lower
Engagement Ratio) might be positively associated with trust
trust propensity in the past [85].
building. While RUT has mostly been studied in terms of
DISCUSSION face to face interactions in the past, the current results
The first research question (RQ1) for this study was: Do suggest that similar relationships might hold over phone
long-term phone-use patterns have some associations with an interactions too.
individual’s trust propensity?
The second research question (RQ2) for this study was: Can
The Pearson’s correlation analysis in the preceding section a machine learning algorithm be used to automatically infer
indicates that multiple phone-based features are correlated individual trust propensity based on phone metadata?
with an individual’s trust propensity. We notice that the
individual effect sizes are small and the p-values for multiple The three types of analysis adopted in this work (regression
of the associations are considered marginally significant. We analysis, correlation analysis, and the classification models)
acknowledge this as a limitation of the sample size, but our suggest that machine learning and in general analytics
confidence is increased by considering that many of the same approaches can indeed be used to infer individual trust
features show up to be prominent in the features selected by propensity based on phone metadata to a large extent. The
Lasso regression and those selected by the classification regression analysis can estimate the individual trust
algorithms. propensities with high correlation (0.544) and within a
margin of ±7.711 over a range of 40 to 97. Complementing
Hence, while further testing on individual features is needed phone features with demographic data, where available,
as part of the future work, the exploratory work here suggests could yield even better performance. For instance, the
multiple associations between trust propensity and phone- classification analysis yielded up to 79% accuracy
based social behavior. (AUC=0.83; F1=0.78) based on such models.
The individual associations found can also be connected with Given the modest sample size, we concentrate here on
the literature connecting trust and social relationships. First, finding general patterns and trends over the three analysis
the findings suggest that trust propensity builds more on techniques. We can see a consistency in the results across the
“strong ties” rather than “weak ties” [62]. While, higher three analysis methods suggesting that socio-mobile signals
social activity was positively associated with trust propensity, as observed via a phone (phoneotype) could indeed be used
it was also found to grow in concentrated (social, spatial, and to infer trust propensity of an individual to a reasonable
temporal) accumulation of such connections. Presumably, extent.
repeated social interactions with familiar faces and places,
Privacy of User Data and Ethical Considerations
i.e., “bonding” social capital is conducive for developing
All data used in this study were hashed and anonymized as
trust propensities. Conversely, it is possible that those with
discussed in the study design. The permissions needed for the
higher trust propensities tend to build and focus on a small
study app were designed to be significantly lesser than those
number of relationships.
typically adopted by popular apps. Lastly, the participation inthe study was on a voluntary basis and the participants could authors found that trust propensity is an antecedent of the
drop out at any time. attitudes of mobile users toward in-app ads. Similarly,
understanding trust propensity is likely to be the most
We also note the ethical concerns surrounding assigning an
relevant trust antecedent in contexts involving unfamiliar
individual a score based on their propensity to trust. While
actors [2]. This is important to understand societal changes
such scores could be used by an individual to receive
and emerging socio-technical contexts like the sharing
recommendations for privacy, social networking, and mobile
economy [92]. Generally, the suggested phone-based method
commerce applications, they could also be used by
here could open ways to better model human beings based on
commercial and other organizations to infer individual trust
ubiquitous sensing and act as a building block towards the
propensities. Similar concerns have been raised about the
vision of Internet of People [93].
traditional paper survey based methods administered by any
organization, and also newer automated techniques that use At a societal level, such apps could alleviate the need to run
social media and phone data to assign health, well-being, or costly annual surveys to access the trust-based “state of the
similar “suitability” scores to individuals [90]. Instead of nation” as proposed by [18]. Instead, automated methods can
shunning away from reporting such results, or shrouding be used to create a real-time nation-wide trust propensity
such research in secrecy, we adopt the approach of raising census and make it a part of the public policy and decision
awareness about these new possibilities and informing the making process. Further, an ability to study the phenomenon
policy debate surrounding them. of trust propensity and its “in the wild” dynamics at scale can
substantially advance the literature in several fields (e.g.,
Limitations
This study has some limitations. First, we acknowledge that economics, psychology) that study trust propensity. For
our analysis focused on correlations, not causation. Next, the instance, this approach can help the researchers in many
homogeneity of the sample (participants were mostly fields to ask research questions that were not simply feasible
undergraduate students from the same university) stops us in labs settings (e.g., contagion in trust propensities across
from generalizing the findings to larger populations, yet it networks of millions of users). In this sense, this work
permits isolating socio-mobile behavior as a predictor. supports the vision painted in the smartphone psychology
manifesto, which states that “… smartphones could
From a methodological perspective, we note the multiple transform psychology even more profoundly than PCs and
comparisons undertaken in the correlation analysis. While brain imaging did” ( [84], p.1).
such multiple comparisons are often “corrected” using
CONCLUSION AND FUTURE WORK
Bonferroni-Holm correction to maintain the confidence in the
In this work, we have proposed a new approach to infer
associations found, we do not do so here because our analysis
individual trust propensities using phone features as an
is posthoc and intended to help interpret the observed
alternative to conventional methods like surveys and lab
prediction results rather than being prescriptive in its own
experiments. Using phone-based behavioral features allowed
right. Similarly, we acknowledge the issues associated with
us to build predictive models by means of machine learning
the use of a relatively large number (24) of possibly collinear
classification algorithms whose accuracy, AUC, and F1
features in regression given the modest sample size (50).
scores were promising and encouraging. To the best of our
While this makes the interpretation of individual feature
knowledge, there has been no previous study that analyzes
coefficients difficult, the model’s average correlation scores
the link between individual trust propensity and phone-based
of 0.538 for phoneotype (respectively 0.544 for phoneotype +
behavioral features. Hence, these results pave way for more
demography) remain interpretable, especially given the use
research on leveraging ubiquitous sensing data for
of Lasso regression, which is purposely designed to handle
understanding the interconnections between socio-mobile
such scenarios [76].
behavioral data and trust propensities.
While we consider the results here to be exploratory, the
With further technical and ethical ground work, the proposed
results from the regression analysis, correlation analysis, and
approach can be used for inferring trust propensities of
the classification models point to a common theme that there
individuals at a scale of billions of people. Hence, with the
are indeed interconnections between phoneotype features and
growth in mobile phone penetration, the proposed approach
trust propensities. These results motivate further work in this
could have multiple implications for individuals (e.g.,
direction.
customized apps) and societies as they engage in higher
Implications levels of technology-mediated interactions.
With further validation, this line of research could have
ACKNOWLEDGMENT
multiple implications for individuals as well as the society.
We thank Cecilia Gal, Padmapriya Subramanian, Ariana
We suggest the use of such methods to be based on opt-in. Blake, Suril Dalal, Sneha Dasari, Isha Ghosh, and Christin
The participants who opt-in to such automated trust Jose for assisting in conducting the study. G.F.B. thanks
propensity scoring apps could get better customized Umm Al-Qura University for partially sponsoring this work
recommendations for privacy, security, social networking, and fully sponsoring his graduate studies at Rutgers.
news, and mobile commerce apps. For instance, in [91], theREFERENCES Seattle, Washington, US, 2014.
[1] K. Cook (Ed.), Trust in society, New York, NY:
Russell Sage Foundation, 2001. [12] Y. A. de Montjoye, S. S. Wang, A. Pentland, D. T. T.
Anh and A. Datta, “On the Trusted Use of Large-Scale
[2] J. A. Colquitt, B. A. Scott and J. A. LePine, “Trust, Personal Data,” IEEE Data Eng. Bull., pp. 5-8, 2012.
Trustworthiness, and Trust Propensity: A Meta-
Analytic Test of Their Unique Relationships With Risk [13] V. K. Singh and R. R. Agarwal, “Cooperative
Taking and Job Performance,” Journal of applied Phoneotypes: Exploring Phone-based Behavioral
psychology, pp. 909-927, 2007. Markers of Cooperation,” in The 2016 ACM
International Joint Conference on Pervasive and
[3] C. M. Cheung and M. K. Lee, “Understanding Ubiquitous Computing (UbiComp '16), Heidelberg,
consumer trust in Internet shopping: A Germany, 2016.
multidisciplinary approach,” Journal of the American
society for Information Science and Technology, pp. [14] H. Grassegger and M. Krogerus, “The Data That
479-492, 2006. Turned the World Upside Down,” Vice Media, 28
January 2017. [Online]. Available:
[4] D. L. McGuinness, H. Zeng, P. P. Da Silva, L. Ding, https://motherboard.vice.com/en_us/article/mg9vvn/ho
D. Narayanan and M. Bhaowal, “Investigations into w-our-likes-helped-trump-win. [Accessed 18
Trust for Collaborative Information Repositories: A September 2017].
Wikipedia Case Study,” in The World Wide Web
Conference (WWW2006), Edinburgh, UK, 2006. [15] J. Berg, J. Dickhaut and K. McCabe, “Trust,
reciprocity, and social history,” Games and economic
[5] M. J. Metzger, “Making sense of credibility on the behavior, vol. 10, no. 1, pp. 122-142, 1995.
Web: Models for evaluating online information and
recommendations for future research,” Journal of the [16] J. Fogel and E. Nehmad, “Internet social network
American Society for Information Science and communities: Risk taking, trust, and privacy concerns,”
Technology, pp. 2078-2091, 2007. Computers in human behavior, vol. 25, no. 1, pp. 153-
160, 2009.
[6] E. Sillence and P. Briggs, “Trust and engagement in
online health a timeline approach,” in The Handbook of [17] T. Yamagishi and M. Yamagishi, “Trust and
the Psychology of Communication Technology, commitment in the United States and Japan,”
Oxford, Wiley-Blackwell, 2015, pp. 469-487. Motivation and emotion, pp. 129-166, 1994.
[7] K. Kelton, K. R. Fleischmann and W. A. Wallace, [18] J. Ermisch, D. Gambetta, H. Laurie, T. Siedler and S.
“Trust in digital information,” Journal of the American C. Noah Uhrig, “Measuring people's trust,” Journal of
Society for Information Science and Technology, pp. the Royal Statistical Society: Series A (Statistics in
363-374, 2008. Society), pp. 749-769, 2009.
[8] M. Harding, B. Knowles, N. Davies and M. [19] A. Roy, C. Sarkar, J. Srivastava and J. Huh,
Rouncefield, “HCI, Civic Engagement & Trust,” in the “Trustingness & trustworthiness: A pair of
33rd Annual ACM Conference on Human Factors in complementary trust measures in a social network,” in
Computing Systems (CHI '15), New York, NY, USA, IEEE/ACM International Conference on Advances in
2015. Social Networks Analysis and Mining (ASONAM), San
Francisco, CA, 2016.
[9] A. Ben-Ner and F. Halldorsson, “Trusting and
trustworthiness: What are they, how to measure them, [20] D. Gambetta, Trust: Making and Breaking Cooperative
and what affects them,” Journal of Economic Relations, Oxford and Cambridge, MA: Basil
Psychology, pp. 64-79, 2010. Blackwell, 1988.
[10] J. Giles, “Computational social science: Making the [21] D. M. Rousseau, S. B. Sitkin, R. S. Burt and C.
links,” Nature, vol. 488, no. 7412, pp. 448-450, 2012. Camerer, “Not so different after all: A cross-discipline
view of trust,” Academy of management review, pp.
[11] R. Wang, F. Chen, Z. Chen, T. Li, G. Harari, S. Tignor, 393-404, 1998.
X. Zhou, D. Ben-Zeev and A. Campbell, “StudentLife:
assessing mental health, academic performance and [22] E. Shmueli, V. Singh, B. Lepri and A. Pentland,
behavioral trends of college students using “Sensing, understanding, and shaping social behavior,”
smartphones,” in the 2014 ACM International Joint IEEE Transactions on Computational Social Systems,
Conference on Pervasive and Ubiquitous Computing, vol. 1, no. 1, pp. 22-34, 2014.[23] D. H. McKnight and N. L. Chervany, “Trust and Science and Politics, vol. 28, no. 4, pp. 664-683 , 1995.
distrust definitions: One bite at a time,” in Trust in
Cyber-societies, Berlin Heidelberg, Springer, 2001, pp. [35] B. Lancee, “The economic returns of immigrants’
27-54. bonding and bridging social capital: The case of the
Netherlands,” International Migration Review, vol. 44,
[24] R. I. M. Dunbar, “Breaking Bread: the Functions of no. 1, pp. 202-226, 2010.
Social Eating,” Adaptive Human Behavior and
Physiology, pp. 1-14, 2017. [36] H. Coffé and B. Geys, “Toward an empirical
characterization of bridging and bonding social
[25] G. K. Sahi, H. S. Sekhon and T. K. Quareshi, “Role of capital,” Nonprofit and Voluntary Sector Quarterly,
trusting beliefs in predicting purchase intentions,” vol. 36, no. 1, pp. 121-139, 2007.
International Journal of Retail & Distribution
Management, pp. 860-880, 2016. [37] K. Newton, “Trust, social capital, civil society, and
democracy,” International Political Science Review,
[26] C. M. Cheung and M. K. Lee, “Understanding vol. 22, no. 2, pp. 201-214, 2001.
consumer trust in Internet shopping: A
multidisciplinary approach,” Journal of the American [38] S. Valenzuela, N. Park and K. F. Kee, “Is there social
society for Information Science and Technology, pp. capital in a social network site?: Facebook use and
479-492, 2006. college students' life satisfaction, trust, and
participation,” Journal of Computer‐Mediated
[27] C. H. S. Dwyer and K. Passerini, “Trust and privacy Communication, vol. 14 , no. 4, pp. 875-901, 2009.
concern within social networking sites: A comparison
of Facebook and MySpace,” in 13th Americas [39] S. Yang, S. Kurnia, H. Lee and S. Kim, “Mobile
Conference on Information Systems (AMCIS 2007), phones and social capital: A preliminary study in south
Keystone, CO, 2007. Korea,” in PACIS 2008, 2008.
[28] P. Barclay, “Trustworthiness and competitive altruism [40] Y.-F. Chen, “Social Phenomena of Mobile Phone Use:
can also solve the “tragedy of the commons”,” An Exploratory Study in Taiwanese College Student,”
Evolution and Human Behavior, vol. 25, no. 4, pp. in the Second International Conference on Digital
209-220, 2004. Communication Conference of the National Chung-
Cheng University, Chia-Yi, Taiwan, 2006.
[29] F. Exadaktylos, A. M. Espín and P. Brañas-Garza,
“Experimental subjects are not different,” Scientific [41] V. Singh and I. Ghosh, “Inferring Individual Social
Reports, vol. 3, 2013. Capital Automatically via Phone Logs,” Proceedings
of the ACM Human Computer Interaction, vol. 1, no.
[30] S. Adali, R. Escriva, M. Goldberg, M. Hayvanovych, 2, 2017.
M. Magdon-Ismail, B. Szymanski, W. Wallace and G.
Williams, “Measuring behavioral trust in social [42] W. Z. Khan, Y. Xiang, M. Y. Aalsalem and Q. Arshad,
networks,” in International Intelligence and Security “Mobile Phone Sensing Systems: A Survey,” IEEE
Informatics (ISI), Vancouver, BC, 2010. COMMUNICATIONS SURVEYS & TUTORIALS, vol.
15, no. 1, pp. 402 - 427, 2013.
[31] K. Farrahi and K. Zia, “Trust reality-mining:
evidencing the role of friendship for trust diffusion,” [43] Y. A. de Montjoye, J. Quoidbach, F. Robic and A. S.
Human-centric Computing and Information Sciences, Pentland, “Predicting personality using novel mobile
pp. 1-16, 2017. phone-based metrics,” in 6th International Conference
on Social Computing, Behavioral-Cultural Modeling,
[32] K. Zolfaghar and A. Aghaieb, “Evolution of trust and Prediction, Washington, DC, 2013.
networks in social web applications using supervised
learning,” in World Congress on Information [44] N. Aharony, W. Pan, C. Ip, I. Khayal and A. Pentland,
Technology 2010 (WCIT 2010), Amsterdam, “Social fMRI: Investigating and shaping social
Netherlands, 2010. mechanisms in the real world,” Pervasive and Mobile
Computing, vol. 7, no. 6, pp. 643-659, 2011.
[33] R. D. Putnam, “Bowling alone: America's declining
social capital,” Journal of democracy, vol. 6, no. 1, pp. [45] A. Montoro, P.-C. Shih, M. Román and A. Martínez-
65-78, 1995. Molina, “Spanish adaptation of Yamagishi General
Trust Scale,” Anales de Psicología/Annals of
[34] R. D. Putnam, “Tuning in, tuning out: The strange Psychology, vol. 30, no. 1, pp. 302-307, 2013.
disappearance of social capital in America,” Political
[46] A. M. Evans and W. Revelle, “Survey and behavioralYou can also read