"It makes me feel not so alone": features of the Choose to Move physical activity intervention that reduce loneliness in older adults
←
→
Page content transcription
If your browser does not render page correctly, please read the page content below
Franke et al. BMC Public Health    (2021) 21:312
https://doi.org/10.1186/s12889-021-10363-1

 RESEARCH ARTICLE                                                                                                                                    Open Access

“It makes me feel not so alone”: features of
the Choose to Move physical activity
intervention that reduce loneliness in older
adults
Thea Franke1,2* , Joanie Sims-Gould1,2, Lindsay Nettlefold1,2, Callista Ottoni1 and Heather A. McKay1,2

  Abstract
  Background: Despite the well-known health benefits of physical activity (PA), older adults are the least active
  citizens. Older adults are also at risk for loneliness. Given that lonely individuals are at risk for accelerated loss of
  physical functioning and health with age, PA interventions that aim to enhance social connectedness may decrease
  loneliness and increase long-term PA participation. The objectives of this mixed-method study are to: (1) evaluate
  whether an evidence-based PA intervention (Choose to Move; CTM) influenced PA and loneliness differently among
  self-identified ‘lonely’ versus ‘not lonely’ older adults and (2) to describe factors within CTM components most likely
  to promote social connectedness/reduce loneliness.
  Methods: CTM is a flexible, scalable, community-based health promoting physical activity intervention for older adults.
  Two community delivery partner organizations delivered 56 CTM programs in 26 urban locations across British
  Columbia. We collected survey data from participants (n = 458 at baseline) at 0 (baseline), 3 (mid-intervention) and 6
  (post-intervention) months. We conducted in depth interviews with a subset of older adults to understand how CTM
  facilitated or impeded their PA and social connectedness.
  Results: PA increased significantly from baseline to 3 months in lonely and not lonely participants. PA decreased
  significantly from 3 to 6 months in lonely participants; however, PA at 6 months remained significantly above baseline
  levels in both groups. Loneliness decreased significantly from baseline to 3 and 6 months in participants identifying as
  lonely at baseline. Factors within CTM components that promote social connectedness/reduce loneliness include:
  Activity coach characteristics/personality traits and approaches; opportunity to share information and experiences and learn
  from others; engagement with others who share similar/familiar experiences; increased opportunity for meaningful
  interaction; and accountability.
  (Continued on next page)

* Correspondence: Thea.Franke@hiphealth.ca
1
 Active Aging Research Team, The University of British Columbia, Vancouver,
BC, Canada
2
 Department of Family Practice, Faculty of Medicine, The University of British
Columbia, Vancouver, BC, Canada

                                         © The Author(s). 2021 Open Access This article is licensed under a Creative Commons Attribution 4.0 International License,
                                         which permits use, sharing, adaptation, distribution and reproduction in any medium or format, as long as you give
                                         appropriate credit to the original author(s) and the source, provide a link to the Creative Commons licence, and indicate if
                                         changes were made. The images or other third party material in this article are included in the article's Creative Commons
                                         licence, unless indicated otherwise in a credit line to the material. If material is not included in the article's Creative Commons
                                         licence and your intended use is not permitted by statutory regulation or exceeds the permitted use, you will need to obtain
                                         permission directly from the copyright holder. To view a copy of this licence, visit http://creativecommons.org/licenses/by/4.0/.
                                         The Creative Commons Public Domain Dedication waiver (http://creativecommons.org/publicdomain/zero/1.0/) applies to the
                                         data made available in this article, unless otherwise stated in a credit line to the data.
Franke et al. BMC Public Health (2021) 21:312 Page 2 of 15
(Continued from previous page)
Conclusion: Health promoting interventions that focus on PA and social connectedness through group-based activities
can effectively reduce social isolation and loneliness of older adults. Given the ‘epidemic of loneliness’ that plagues many
countries currently, these kinds of interventions are timely and important. Research that further delineates mechanisms
(e.g., sharing experiences vs. lectures), that modify the effect of an intervention on social connectedness outcomes for
older adults engaged in community-based PA programs would be a welcome addition to the literature.
Keywords: Isolation, Loneliness, Older adults
Background various health outcomes [e.g., high blood pressure, heart
In the next decade, we will experience an unprecedented disease, a weakened immune system and cognitive de-
escalation in the number of older adults in most devel- cline] associated with loneliness [19, 20]. Social connect-
oped countries worldwide--with an anticipated rise in mo- edness (e.g., social bonding) contributes to older adults’
bility loss [1], physical inactivity [2] and loneliness [3]. In engagement and acceptability of PA interventions [25].
Canada, at least four of five older adults do not meet Can- Yet most physical activity interventions, for community
adian Physical Activity Guidelines of 150 min of dwelling older adults, fail to create and sustain social con-
moderate-to-vigorous physical activity (PA) per week [4]. nectedness among participants [26].
Developed countries have described an ‘epidemic of loneli- Loneliness must be distinctly defined from social isola-
ness’ sweeping major cities [5]. In the United Kingdom tion which is a reduced social network [27, 28]. It is a
loneliness was identified as a key public health priority by quantifiable measure of the number and structure of one’s
appointing a ‘Loneliness Minister’, implementing a loneli- relationships (i.e., social, family, and friend contacts) or
ness strategy for Scotland [6] and launching its ‘Campaign frequency of interaction with others (i.e., social contact).
to End Loneliness’ (www.campaigntoendloneliness.org) Social contact is described as physical closeness, inter-
which targets older adults. Loneliness is closely linked with action (face-to-face/ in-person, internet-based, and/or
accelerated loss of physical functioning and health and age telephone) or touch encounters [29] with others [30, 31].
[7, 8], thus, taking action to counter loneliness is timely and Social isolation/social contact are objective constructs
important. Interventions designed to increase long-term PA whereas loneliness/social connectedness are subjective. To
participation and promote social connectedness [9] may ef- illustrate, an older person may be alone (i.e., isolated) but
fectively stop or slow mobility loss [10] and diminish loneli- still feel a sense of social connectedness. Conversely, they
ness [11–13]. However, interventions that aim to positively may be surrounded by people (i.e., have social contact)
promote social connectedness and reduce feelings of loneli- but still feel lonely [32, 33]. Although isolation/social con-
ness among older adults are often grouped with interven- tact may influence social connectedness/loneliness [34],
tions that promote social contact/ reduce isolation (related they are not necessary mediators [35].
but distinct concepts) [14–17]. Differentiating the distinct The distinction is important when designing PA inter-
effect of an intervention, and in particular a PA interven- ventions that promote social connectedness/ reduce lone-
tion, on social connectedness/loneliness versus social con- liness. Specific mechanisms of an intervention (e.g., goals,
tact/isolation has for the most part been overlooked. components, activities, mode and dose of delivery) will
Loneliness and social connectedness are positioned at vary if the specific goal is to positively affect loneliness/so-
opposite ends of a continuum. If an individual is lonely, cial connectedness outcomes versus isolation/social con-
then they are not socially connected. If they are socially tact outcomes [34]. For example, rather than bringing
connected, then they are not lonely. Loneliness is a per- older adults together for informative lectures (isolation/so-
ceived lack in quality or quantity of one’s relationships cial contact), interventions may offer activities that create
[18] and predicts various health outcomes, including: sys- social bonding such as storytelling/sharing (loneliness/so-
temic inflammation, increased blood pressure, depression, cial connectedness). However, few studies (i) clearly de-
weight gain, smoking alcohol/drug use, physical inactivity, scribe the mechanisms of the intervention, and (ii) assess
and alone time [19–24]. Social connectedness is defined as the extent to which the hypothesized mechanisms map on
feelings of interpersonal connection and meaningful, close, to factors within those mechanisms that may promote so-
and constructive relationships with others (i.e., individuals, cial connectedness/reduce loneliness [12].
groups, and society). A socially connected person feels
that they: (i) care about others and are cared about by
others, and (ii) belong to a group or community [12]. Car- Context
ing and respect in social relationships prompts a sense of In partnership with British Columbia (BC) Ministry of
well-being—together they act as a buffer against the Health, we co-created a community-based, flexible, scal-
able health promoting PA and social connectednessFranke et al. BMC Public Health (2021) 21:312 Page 3 of 15
intervention called Choose to Move [36]. In collabor- among older adults who identified as lonely versus older
ation with key community stakeholders, CTM is being adults who identified as not lonely at baseline; (ii) to de-
scaled up in a phased manner across the province of BC, scribe factors within CTM components most likely to
Canada [2016–2021; Fig. 1]. We used phase 1 and phase promote social connectedness/reduce loneliness.
2 (small scale up) data for the current study (Jan 2016-
May 2017). In phases 1 and 2 (Jan 2016-May 2017) Methods
CTM effectively enhanced PA, mobility and social con- Study design and setting
nectedness, and reduced social isolation in older adults Choose to move
[37]. Our implementation evaluation demonstrated that Elsewhere we described the CTM intervention, imple-
CTM could be effectively adapted to context [38] and mentation and evaluation frameworks that guide our
implemented at scale by trained activity coaches in col- work [36, 37, 39], the benefits of CTM on PA and social
laboration with key community recreations organizations connectedness [37] and factors that influenced imple-
with established reach to older adults [37, 38]. mentation [38]. Briefly, CTM is a 6-month, choice-based
health promotion program that supports older adults
Aims and objectives with low levels of PA to become more physically active
The aim of our mixed-method study is to evaluate and socially connected. Development of CTM was in-
whether older adults’ perceptions of loneliness modify formed by the CHAMPS intervention [40] based on its
the effect of CTM on PA and social connectedness implementation and successful dissemination at an
outcomes. organizational level [36]. CHAMPS was based on princi-
Our specific objectives are twofold: (i) to evaluate ples derived from social cognitive theory; CTM is guided
whether CTM influenced PA and loneliness differently by many of these same principles. In Phases 1 and 2 (Jan
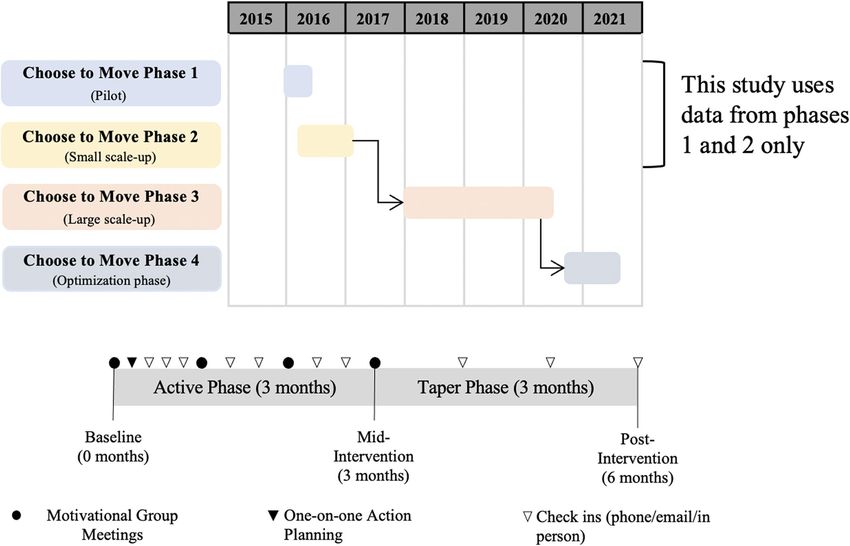
Fig. 1 The upper portion illustrates the phased scale-up of Choose to Move. Black arrows between phase 2 and 3, and between phase 3 and 4
indicate the formal and systematic adaptation of the model to enhance fit and optimize the model. We use data from phases 1 and 2 in this
manuscript. The lower panel illustrates the time points for one Choose to Move program. Data collection (surveys - all participants; interviews -
subset) occurred at 0, 3 and 6 months. Lower panel is adapted with permission from “Implementation of a co-designed physical activity program
for older adults: positive impact when delivered at scale,” by McKay H, Nettlefold L, Bauman A, Hoy C, Gray SM, Lau E, and Sims-Gould J, 2018,
BMC public health, 18 [1]:1289. CC BY 4.0Franke et al. BMC Public Health (2021) 21:312 Page 4 of 15
2016-May 2017; the focus of this manuscript), CTM Measurements
consisted of: (i) a one-on-one consultation with an activ- Quantitative
ity coach, plus (ii) regular phone call ‘check-ins’ with an Participants enrolled in the evaluation provided survey
activity coach, and (iii) regular motivational group meet- data at 0, 3 and 6 months. At 0 and 3 months we col-
ings with other CTM participants (up to 12 participants/ lected participant data at Motivational Group Meetings
group), led by an activity coach. Group meetings in- (or by mail if they missed a group meeting). At 6
cluded opportunities to share experiences, educational months, participants received and returned surveys via
content on a specific topic and sharing of resources. Ac- mail [37].
tivity coaches received [in-person] standardized CTM
training. Delivery ‘dose’ of program components was Demographic characteristics At baseline participants
greater in the first 3 m (active phase: one-on-one, seven provided the following demographic data: age (as age
phone calls, four group meetings) and tapered off in the category; 60–74, ≥75 years), sex (male, female), height
last 3 m (taper phase: three phone calls; Fig. 1). and weight (used to calculate body mass index (kg/m2);
During the one-on-one consultation personal PA goals categorized as (< 30, ≥30 kg/m2, level of education (sec-
were set, action plans were created, barriers to participa- ondary school or less, at least some trade/technical
tion were problem solved, social support was received, school or college, at least some university), ethnicity
and PA and health-related information was provided. (Asian, white, other), number of chronic diseases (0, 1,
The personalized action plan aligned with each partici- ≥2), self-rated health (very poor, poor, fair, good, excel-
pants’ available resources, interests, abilities, and income. lent), self-efficacy for increasing PA and accessing recre-
Activity coaches facilitated groups on a monthly basis ation centre services (1 item each; not at all, slightly,
(4 × 1 h each). During the group meetings, information moderately, quite or very confident), social support for
designed to promote PA and support the development PA received from family or friends (1 item each; yes, no,
of relationships (e.g., support, companionship) among not sure) and capacity for mobility (no/any difficulty
group members was presented [37]. Participants were walking 400 m and/or climbing one flight of stairs [43].
given the opportunity to participate in group or paired
discussions, shared their experiences and connected with Physical activity We assess PA using a single item
others. Individual phone check-ins provided opportun- questionnaire: “In the past week, on how many days
ities for activity coaches to discuss progress and setbacks have you done a total of 30 minutes or more of physical
and to adjust their action plans accordingly. activity, which was enough to raise your breathing rate?
We describe our study design and implementation This may include sport, exercise, and brisk walking or
approach in detail elsewhere [36–39]. Briefly, we con- cycling for recreation or to get to and from places, but
ducted a type 2 hybrid effectiveness-implementation should not include housework or physical activity that
study, using both quantitative and qualitative methods may be part of your job” [44]. This questionnaire is re-
[41]. We measured participants at 0 (baseline), 3 (mid- producible [44] and shows acceptable concurrent and
intervention) and 6 (immediately post-intervention) criterion validity [44, 45].
months (Fig. 1). In phases 1 and 2 (Jan 2016-May 2017),
two partner organizations delivered 56 CTM programs in Loneliness We used a three item questionnaire (LQ-3)
26 small (population 1000–29,999; n = 8 community sites), with a 3 point scale to assess loneliness [46]. Questions
medium (population 30,000-99,999; n = 7 community asked were, “how much of the time do you feel (i) you lack
sites) and large (population 100,000+; n = 11 community companionship; (ii) left out; (iii) isolated from others” (3 =
sites) urban communities (Statistics Canada, 2017). often, 2 = some of the time, 1 = hardly ever). The overall
score reflects the sum of the three items (range 3–9) with
Participants lower scores indicating lower levels of loneliness. We clas-
We received consent from 458 of 534 (86%) CTM par- sified participants as “lonely” if they responded “some of
ticipants to participate in the evaluation. To register for the time” or “often” to any of the 3 components on the
CTM, participants had to be over the age of 60, speak questionnaire and as “not lonely” if they responded
English and engage in < 150 min/week of PA [2]. Partici- “hardly ever (or never)” to all 3 components [46]. This
pants had no contraindications to participate in PA short questionnaire shows good internal consistency, dis-
based on the Physical Activity Readiness-Questionnaire+ criminant validity and convergent validity [46].
[42], or physician clearance. CTM recruitment strategies
included printed materials (e.g., community centre pro- Social isolation We assessed isolation using three items
gram guides, posters, newspaper advertisements), infor- adapted from two questions focused on frequency of
mation sessions, radio and social media advertisements, contact [47]. Questions asked were “How often do you
and word of mouth [37]. (i) get together with friends, neighbours or relatives, andFranke et al. BMC Public Health (2021) 21:312 Page 5 of 15
do things like go out together or visit in each other’s Participants were randomly selected from those who con-
homes?; (ii) talk on the telephone or exchange emails sented to the interview component. Interviews took ap-
with friends, neighbours or relatives? and; (iii) attend proximately 15–30 min. If interview participants dropped
meetings or programs of groups, clubs or organizations out, the Research Coordinator asked why they withdrew
that you belong to?”. Response options are: never; less and about barriers to participation. Questions included in
than once a month; about once a month; 2 or 3 times a the interview guide were developed by our research team.
month; once a week and; more than once a week (scored Interview topics included feedback on the three CTM com-
on a 6-point scale from 0 to 5, respectively). The 3 items ponents (one-on-one consultation, motivational group
are summed to create an overall social isolation score meetings, check-ins); we identified factors within these
(range 0–15); lower scores indicate greater levels of so- components that facilitated/impeded their influence on PA
cial isolation. We classified participants as “socially iso- and social connectedness (e.g., meeting content, number of
lated” if they reported low levels of interpersonal meetings and check-ins, perceptions of activity coach), as
interaction (once/month or less) [48]. We defined that well as facilitators and barriers to committing and adhering
operationally as those who answered once/month or less to their Action Plan; continuing PA after CTM (Table 1).
(i.e., a score of 0, 1 or 2) for all 3 questions. As an We fully transcribed each interview verbatim.
adapted measure, psychometric properties for this in-
house measurement scale are not available. Analysis
Qualitative
Analysis We reviewed transcripts using a deductive framework
Quantitative analysis; framework analysis is well suited to research
We used Stata v13.1 for all quantitative analysis. We first that has specific questions, a pre-designed sample and
assessed differences in socio-demographic characteristics theoretically deduced issues [50]. In deductive frame-
between participants who identified as lonely versus not work analysis, the categories/codes are often pre-defined
lonely at baseline using Chi-squared or Fisher’s exact (e.g., by specific areas of interest to the project). Our cat-
test (categorical variables: sex, age category, ethnicity, egories/codes were created in order to systematically
education, chronic conditions, mobility limitations) and capture participants descriptions of (i) CTM compo-
unpaired t-tests (continuous variables: BMI). nents, (ii) factors within these components most likely to
To assess whether PA and loneliness differed by par- promote social connectedness/reduce loneliness and (iii)
ticipants’ loneliness status at baseline, we used general any social connectedness indicators [12] linked to those
linear mixed effects models with time (0, 3, 6 months) as factors. There are 7 stages to framework analysis [50–
a categorical predictor [37]. In model 1 we included sex 52]. We briefly discuss each stage below. First, the lead
and baseline loneliness (dichotomous measure; lonely vs. author received the transcripts (stage 1- transcription),
not lonely) as fixed effects. In model 2 we included add- read through the transcripts to become more familiar
itional covariates (age category, delivery partner, social with the interviews (stage 2 - familiarize). Even though
isolation category, baseline mobility limitation, number we had pre-defined categories/codes we still did open
of chronic conditions, level of education and BMI cat- coding on a few transcripts to ensure any codes were
egory) sequentially, testing for interactions with time not missed (stage 3 – coding). We held a series of team
after each addition. We retained the interaction of base- meetings to discuss the framework (stage 4 – developing
line loneliness*time in the model regardless of signifi- a framework) and then the lead author coded the re-
cance; other interactions were only retained if they mainder of the transcripts using the framework and
significantly improved model fit (likelihood ratio test added any additional codes if missing from the frame-
[49] of p < 0.05). We used residual plots to assess model work (stage 5- applying the framework). The lead author
fit and calculated adjusted values at each time point coded full paragraphs to not lose contextual meaning.
within Stata (margins command with Bonferroni adjust- We adopted the constant comparison method [53] to
ment to account for multiple comparisons between and look for patterns and connections within and between
within loneliness groups) [37]. We did not use any im- cases and codes and within and across groups. This re-
putation techniques to address missing data. vealed similarities and differences in the data. We com-
pared responses between participants who were lonely
Data collection with participants who were not lonely (stage 6- chart-
Qualitative ing). We then began interpreting the data by mapping
We conducted in depth semi-structured audio-recorded in- connections between codes to explore relationships and
terviews by phone with a subset of older adults at baseline develop themes within each category.
(n = 43), 3 months (n = 38) and 6 months (n = 19). The We used a number of strategies to reinforce the
same participants were interviewed at each time point. rigor of our study. They were: cross-checking fullFranke et al. BMC Public Health (2021) 21:312 Page 6 of 15
Table 1 Sample participant interview questions
Baseline 3-month follow up 6-month follow up
Why did you decide to join this program? How is this program working for you? How did the last three months of Choose to Move go
for you?
What (if anything) is appealing to you about What are your favourite parts of the program? How did you find the telephone check-ins?
this program?
transcripts against original audio files for quality and conducted reflexive memoing throughout data ge-
completeness; “member reflections” which involve neration and data analysis processes [54]. We also
the process of re-iterating interpretations of what created an audit trail to record all key procedural
was heard during the interview back to participants and analytical decisions made throughout the study
in order to avoid misunderstanding. We also [55, 56].
Table 2 Baseline socio-demographic characteristics in participants classified as ‘lonely’ vs. ‘not lonely’
Not lonely Lonely Total
Participants, n (women/men) 191 (138/53) 261 (212/49)* 452 (350/102)
% (men) 28% 19% 23%
Age category, n (%)
60–74 years 126 (66%) 193 (74%) 319 (71%)
≥ 75 years 65 (34%) 68 (26%) 133 (29%)
Self-reported BMI, kg/m2
Men (n = 102) 28.8 (4.6) 29.1 (4.3) 28.9 (4.5)
Women (n = 342) 29.0 (6.5) 29.8 (7.7) 29.5 (7.2)
Ethnicity, n (%)
White 168 (88%) 220 (84%) 388 (86%)
Asian 15 (8%) 20 (8%) 35 (8%)
Other 8 (4%) 21 (8%) 29 (6%)
Educational attainment, n (%)
Secondary or less 58 (30%) 55 (21%) 113 (25%)
Some trade, technical school or college 63 (33%) 87 (33%) 150 (33%)
Some university 70 (37%) 119 (46%) 189 (42%)
Chronic Conditions, n (%)
0 28 (15%) 33 (13%) 61 (14%)
1 78 (41%) 105 (40%) 183 (40%)
≥2 85 (45%) 123 (47%) 208 (46%)
Mobility limitations (walk or stair), n (%)
Yes 82 (43%) 113 (43%) 195 (43%)
No 109 (57%) 148 (57%) 257 (57%)
Self-rated health, n (%) a
Very poor, poor or fair for age 71 (37%) 133 (51%) 201 (45%)
Good or excellent for age 120 (63%) 128 (49%)* 248 (55%)
Self-efficacy for increasing PA, n (%) a
Not at all, slightly or moderately confident 79 (41%) 127 (49%) 206 (46%)
Quite or very confident 112 (59%) 134 (51%) 246 (54%)
Self-efficacy for rec centre access, n (%) b
Not at all, slightly or moderately confident 48 (31%) 79 (36%) 127 (34%)
Quite or very confident 105 (69%) 141 (64%) 246 (66%)
Values are n (%) or mean (SD). Sample sizes vary between each variable due to missing data. *Difference between groupsFranke et al. BMC Public Health (2021) 21:312 Page 7 of 15
Table 3 Baseline socio-demographic characteristics for participants who were interviewed, separated by ‘lonely’ vs. ‘not lonely’
Not lonely Lonely Total a
Participants, n (women/men) 16 (8/8) 26 (19/7) 43 (27/16)
% (men) 50% 27% 37%
Age category, n (%)
60–74 years 14 (88%) 18 (69%) 33 (77%)
≥ 75 years 2 (13%) 8 (31%) 10 (23%)
Self-reported BMI, kg/m2
Men 29.4 (3.8) 29.4 (2.7) 29.6 (3.2)
Women 31.1 (6.8) 28.5 (7.5) b 29.3 (7.3) b
Ethnicity, n (%)
White 14 (88%) 21 (81%) 36 (84%)
Asian 1 (6%) 2 (8%) 3 (7%)
Other 1 (6%) 3 (12%) 4 (9%)
Educational attainment, n (%)
Secondary or less 4 (25%) 4 (15%) 8 (19%)
Some trade, technical school or college 7 (44%) 8 (31%) 15 (35%)
Some university 5 (31%) 14 (54%) 20 (47%)
Chronic Conditions, n (%)
0 1 (6%) 4 (15%) 5 (12%)
1 5 (31%) 7 (27%) 12 (28%)
≥2 10 (63%) 15 (58%) 26 (60%)
Mobility limitations (walk or stair), n (%)
Yes 7 (44%) 12 (46%) 20 (47%)
No 9 (56%) 14 (54%) 23 (53%)
Self-rated health, n (%) a
Very poor, poor or fair for age 12 (75%) 13 (50%) 26 (60%)
Good or excellent for age 4 (25%) 13 (50%) 17 (40%)
Self-efficacy for increasing PA, n (%)
Not at all, slightly or moderately confident 8 (50%) 14 (54%) 22 (51%)
Quite or very confident 8 (50%) 12 (46%) 21 (49%)
Self-efficacy for rec centre access, n (%) c
Not at all, slightly or moderately confident 4 (31%) 11 (47%) 15 (42%)
Quite or very confident 9 (69%) 12 (52%) 21 (58%)
Values are n (%) or mean (SD)
a
one participant was missing baseline data for the loneliness questionnaire and cannot be represented in the not lonely/lonely columns. They are represented in
the ‘total’ column
b
n = 26 women (one woman missing self-reported BMI)
c
n = 36 total
Results post-secondary education (75%), no mobility limitations
Quantitative (57%) and identified as white (86%). Specific to these ana-
Participants lyses, 58% of participants identified as lonely at baseline
Our final sample size at baseline was 452 participants [6 (n = 261). Those who identified as lonely were more likely
participants did not complete baseline surveys]. We to be women and reported lower self-rated health com-
summarize socio-demographic characteristics for the pared to same-age peers (Table 2). Less than 1% of partici-
whole sample in Table 2 and for the interview subset in pants (n = 4) identified as socially isolated at baseline.
Table 3. As previously reported [37], in the whole sample Given the low prevalence of socially isolated participants
most participants identified as women (77%), lived in in this group we were unable to include social isolation in
medium to large urban centres (77%), had at least some the models; therefore, we focused solely on loneliness.Franke et al. BMC Public Health (2021) 21:312 Page 8 of 15
Table 4 Outcome measures by time point and baseline loneliness category
Month (# obs) Not Lonely Lonely p-value (not lonely) P value (lonely)
0–3 mo. 0–6 mo. 0–3 mo. 0–6 mo.
Physical activity (# days/week 0 (n = 443) 2.4 (2.1, 2.7) 2.2 (2.0, 2.4)
> 30 min)
3 (n = 369) 3.8 (3.5, 4.1) 3.7 (3.4, 3.9) p < 0.001 p < 0.001
6 (n = 361) 3.4 (3.1, 3.7) 3.3 (3.1, 3.6)* p < 0.001 p < 0.001
Loneliness (score; range 3–9) 0 (n = 442) 3.0 (2.9–3.2)** 5.7 (5.5, 5.8)
3 (n = 367) 3.2 (3.0, 3.4)** 4.8 (4.6, 4.9) p = 0.2 p < 0.001
6 (n = 357) 3.3 (3.1, 3.5)** 4.9 (4.7, 5.1) p = 0.006 p < 0.001
Values are mean (95% CI)
Statistical models include: age category, gender, delivery organization, baseline mobility, number of chronic conditions, education and BMI category. Physical
activity model additionally included statistically significant interactions of age category and number of chronic conditions with time
*Significantly different from 3 months within lonely group
**Significant between-group difference
Among participants who dropped out of CTM (n = 49), (Table 4). By definition, loneliness scores at baseline
withdrew from the evaluation (n = 2) or missed an evalu- were significantly different between participants identify-
ation timepoint (n = 51), the proportion who identified as ing as lonely and not lonely; this significant between-
lonely was similar between those who withdrew from, and group difference was maintained at 3 and 6 months.
those who remained in the study (58%). Loneliness decreased significantly from 0 to 3 months in
participants who identified as lonely at baseline; lower
Physical activity loneliness scores were maintained at 6 months (signifi-
Results were similar for minimally and fully adjusted cantly different from baseline). There was no change in
models, thus we focus on the fully adjusted model here loneliness from 0 to 3 months in the ‘not lonely’ group.
(Table 4). At baseline, PA levels were similar between par- However, loneliness increased significantly in this group
ticipants who identified as lonely and not lonely (mean at 6 months compared to baseline.
difference: − 0.2 days/week (95% CI, − 0.6, 0.3). PA in-
creased significantly during the active intervention
phase (baseline to 3 months) in both lonely and not Qualitative
lonely participants. PA decreased significantly from Our deductive framework analysis consisted of three
3 to 6 months (in the taper phase) in lonely partici- CTM intervention components as our categories. Below,
pants only. However, PA at 6 months remained sig- we present each category and describe the themes (e.g.,
nificantly above baseline levels in both groups. factors), within each CTM intervention component,
found to promote social connectedness/ reduce loneli-
Loneliness ness. We highlight the social connectedness indicators
Results were similar for minimally and fully adjusted of each theme in Table 5. Interview participants were
models, thus we focus on the fully adjusted model here men (n = 16) and women (n = 27), aged 60–74 (n = 33)
Table 5 Social connectedness features and indicators of Choose to Move’s three delivery components
Delivery Component Feature Social Connectedness Indicators
Feeling cared Meaningful Feelings of
for relationships belonging
One-on-One Activity Coach characteristics/personality traits and X X
Consultation approaches
Motivational Group Activity Coach characteristics/personality traits and X X
Meetings approaches
Opportunities to share information and experiences and X X X
learn from others
Engage with others who share similar/familiar experiences X
Increased opportunity for meaningful interaction X X
Check-Ins Activity Coach characteristics/personality traits and X X
approaches
Accountability XFranke et al. BMC Public Health (2021) 21:312 Page 9 of 15
or 75+ (n = 10) who identified as lonely (n = 26), not really didn’t want to disappoint anyone else, as well
lonely (n = 16) or did not respond (n = 2). We present as myself.
participant responses by time point (baseline, 3 months
and 6 months), and whether participants identified as
lonely or not lonely. Compared with not lonely partici- Motivational group meetings
pants, lonely participants more often discussed social Motivational Group Meetings were overwhelmingly con-
connectedness factors (e.g., social activities, chatting) sidered of great value to create and sustain social con-
within each intervention component. Not lonely partici- nections. The following factors within the Motivational
pants placed more emphasis on education and goal com- Group Meetings were found to promote social connect-
mitment. We focused our analysis on describing factors edness/reduce loneliness: activity coach characteristics/
within CTM intervention components that may promote personality traits and approaches; opportunities to share
social connectedness/ reduce loneliness. The following information and experiences and learn from others; en-
themes were found: activity coach characteristics/personal- gage with others who share similar/familiar experiences;
ity traits and approaches; opportunities to share information and increased opportunity for meaningful interaction.
and experiences and learn from others; engage with others Activity coach characteristics/personality traits and ap-
who share similar/familiar experiences; increased opportun- proaches: being positive, engaging, accommodating,
ity for meaningful interaction; and accountability. accepting, observant, careful, motivating, offering en-
couragement and calls participants by name.
One-on-one consultation
Participants deemed the activity coach as essential to in- (Lonely, mid-intervention)
fluencing social connectedness within all three CTM Yeah, ‘cause when I missed one of the classes every-
intervention components. Participants described distinct body said, oh, good to see you back. But they didn’t
activity coach characteristics/personality traits and say “[name of participant].” But by the end of--
approaches that promote social connectedness/ reduce when (activity coach) said [name of participant], tell
loneliness. us what you’ve done, by the end of the class every-
Activity coach characteristics/personality traits and ap- body goes, see you the next month [name of partici-
proaches: being personable (easy to talk to), positive, ac- pant], right.
commodating, accepting, observant, careful, motivating,
and approachable, offering encouragement and provid- (Lonely, post-intervention)
ing accountability. She [activity coach] is so positive and she’s so encour-
Participants enjoyed being able to connect with an activ- aging. And she really knows her stuff. Because she
ity coach during the one-on-one consultation, and work really tries to engage everybody in-- she knows every-
with the activity coach to design a personalized action body and she knows everybody’s progress and ability.
plan. This process enacted feelings of being listened to She is encouraging that way ‘cause she knows when
and cared for and supported development of a meaningful someone is taking it slower ‘cause-- sprained ankle or
relationship between participants and their activity coach. not feeling well that day. And so she does that in the
The activity coach-participant relationship spurred feel- CTM too where she, you know, like, caters it kind of
ings of motivation and encouragement. individually and often as a group. And it’s really hard
to explain. But you do feel like you’re getting individ-
(Not lonely, baseline) ual attention even though you’re also in a group get-
Oh, I really like it because it’s designed individually ting to know everybody else.
for me and [name of Activity Coach] is really easy
to talk to and very personable. And so, yeah, when Opportunities to share information and experiences
we had our one-hour session on Thursday where and learn from others promoted interactions between
we discussed and made the plan for this coming participants, encouraged the exchange of phone num-
week. And so when she said would you be inter- bers, provided personal introductions, and engaged par-
ested, she was full of ideas. And she was good at ticipants in paired and group discussions to share
taking my ideas and adjusting them. It’s personal- information on community resources.
ized. So, yeah, which made it very manageable. Participants discussed how they enjoyed activities
that offered them the opportunity to share information
(Not lonely, mid-intervention) and experiences with other group members. Being able to
Yeah, oh, so for the Choose to Move, yeah, having learn from others created a sense of bonding, belonging
to be accountable, that’s an important thing for me, and being cared for, and developed meaningful
I find that once I make the commitment and I just-- relationships.Franke et al. BMC Public Health (2021) 21:312 Page 10 of 15
(Lonely, mid-intervention) Engage with others who share similar/familiar experi-
Well, everybody got to share what they did from the ences promotes emotional and informational support to
last meeting, and then-- like, every time, like, what participants and offers space to share common charac-
we did and then if there were problems and what teristics or life experiences-- this fosters a sense of be-
we plan to-- like, exactly what was in the email, but longing and companionship.
we said it out loud so everybody could hear. And I
think everybody-- it was quite helpful, I think. (Lonely, baseline)
When they had a solution to-- or everybody said, oh There were other people in the class that, when we
yeah, that happened to me. Or-- it was like bonding. all introduced ourselves, were having the same kind
So, it was nice, and everybody got to speak, and it of struggles I had, the same kind of goals and were
was encouraged. And I don’t think anybody was people that I thought, hmm, okay. There’s some-
really quiet about it. So, I think everybody enjoyed body I could probably call; see how they’re doing
sharing. Yeah, and it was nice to speak up and see if because they’re like me.
other people felt the same way sometimes.
(Lonely, mid-intervention)
(Lonely, mid-intervention) Well, companionship or-- communication and com-
I liked the meeting. I liked the fact that other people panionship with the other people who are attending.
shared their difficulties. It makes me feel not so Yeah, these weren’t people that I knew prior. It
alone. just-- I think it’s just more supportive when there
are other people that you’re hearing are dealing with
(Not lonely, post-intervention) issues too that are similar, um-hum.
There are so many people out there in our age group
that would benefit from this if they knew about it. Increased opportunity for meaningful interaction. Par-
It’s-- so many of us people in, you know, in their 60s ticipants enjoyed the more frequent interactions during
feel uncomfortable going to a gym because it’s, you the active phase (first 3 months) of Choose to Move and
know, full of 20 year olds and you feel like you don’t felt the decline in motivational group meetings over the
belong. And this-- with our instructor it just made us later months (taper phase) negatively influenced their
feel like we were part of a group like everybody else. sense of social connectedness.
It was a good feeling.
(Lonely, mid-intervention)
Sharing/learning opportunities within Motivational Well, I think name (activity coach) did say they were
Group Meetings were considered a more fruitful way to continuing for three more months for checking in on
promote social connectedness/reduce loneliness than us, right. And I’d assume it’s through email, right, that it
were ‘lecture’ style sessions. wasn’t over. But it would have been nice, I think, to do
it one last time, to end the program, just for a goodbye.
(Not lonely, post-intervention) I guess it’s because I like the group maybe too, yeah.
But it might be nice to have actually had a-- even if
it was just a get together with the group, just to see (Lonely, post-intervention)
how everybody else did. I know that one lady was It was nicer when we met more frequently, I think. I
wanting-- she had joined the group with the pur- think that was-- yeah, ‘cause we met-- the first while
pose of, you know, finding someone else to exercise we were meeting once a week, then once every two
with. Which is a good thing too. But there wasn’t a weeks and then it got to the month. I think the
lot of social opportunity, I think, because we got in- interaction for some people is a good thing.
formation. We were given-- there was a video and Through the winter that was really nice to have that
there was talks and exercises and discussions about group to go back to every few weeks, that other
things that you did individually. But we really didn’t group, yeah. I think maybe a little more interaction
have a lot of opportunities to sort of talk to one an- would be good.
other. And that’s [inaudible] I think everybody’s
fairly shy. But it may be something that they could
throw in, maybe halfway and again at the end. A lit- Check-ins
tle social time, a tea or something. And just every- Participants described specific Activity Coach character-
body could sort of talk about how they’re doing istics/personality traits and approaches that promoted a
things. ‘Cause we learn from what some of the other sense of social connectedness/ reduced loneliness during
people were doing too. So that was a good thing the Check-Ins.Franke et al. BMC Public Health (2021) 21:312 Page 11 of 15
Activity coach characteristics/personality traits and ap- and she made sure before she hung up that we had
proaches that promoted social connectedness during a date set and I had it written in my calendar. A
check-ins included: being personable (easy to talk to), date and time that she would call her next call. So,
positive, someone who offers encouragement, accommo- all the time when you’re-- if you weren’t doing
dates, is accepting, motivates, provides accountability, something, in your head you know oh, you-- I’ve
approachable, high energy, makes sure to be available, got to tell [name of Activity Coach] that I haven’t
takes time, listens, and is thoughtful. been doing anything. So, it’s just that little guilt trip
there too, I guess
(Lonely, mid-intervention)
Well, I think if they were serious about trying to get Discussion
more physical in their activity and-- slowly and real- CTM influenced PA and loneliness differently among
istically and with support from the class and the in- older adults who identified as lonely versus older adults
structor. And also, like, personal checks, either how who identified as not lonely. It is not clear within an
would they prefer, email, face-to-face or phone call. array of intervention mechanisms which ones directly or
So, I think it’s a really good follow-up, because a lot indirectly influence intervention effectiveness [57]. Thus,
of times you get lost in the programs or it doesn’t we describe factors within components of a health pro-
seem like anybody cares, so you don’t care. moting PA intervention (CTM), that were most likely to
promote social connectedness/reduce loneliness. In
(Not lonely, mid-intervention) doing so we heed the call to assess mechanisms that
Especially the encouragement. I mean, that’s the ‘move beyond the current focus on the objective social
main thing anyway for me. ‘Cause I live alone and network as a way to promote social connectedness for
it’s easy to not do anything. So, it’s very nice when older adults’ (pg.1) [12]. We also identify key indicators
someone phones you up and says, how are you of social connectedness within these mechanisms that
doing and, you know, can I help you in any way, get likely moderate this influence—a novel contribution to
some ideas together and stuff like that. So that helps the literature. Our findings support the benefits of
a great deal choice-based, group-focused interventions delivered to
older adults in community settings.
(Not lonely, mid-intervention) It was telling that more than half (58%) of older adults
The phone calls are very encouraging. So that helps in our study identified as lonely at baseline. In a recent
a lot. Yeah, she’s [activity Coach] fabulous. Really is systematic review [58], people described as more lonely
a dear friend already so-- wonderful lady, and a very were less physically active. We attribute the decline in
good encourager PA in the lonely group during the last 3 months of the
program to the reduced number of contacts with the
Accountability promoted social connectedness by pro- activity coach during this ‘taper’ period. Lonely partici-
viding participants a sense of responsibility to the Activ- pants valued and expressed a desire for more motiv-
ity Coach and to themselves and the other older adults ational group meetings [59], as they fostered social
in their group. The pre-planned check-in offered a con- connections (e.g., feeling cared for, belonging, meaning-
sistent point of contact for participants that many ful relationships). At baseline more women (61%) than
looked forward to. Participants were accountable to the men (48%) identified as lonely. PA levels of women were
Activity Coach, which motivated and encouraged partici- more likely than men to be influenced by loneliness [24].
pants to engage in activity. This speaks to gender sensitive implementation ap-
proaches; group, as compared with individual-based in-
(Lonely, mid-intervention) terventions may more effectively influence social
I mean, she’s right on top of it because she’ll make-- connectedness in lonely women.
actually make an appointment for you. So that’s a It is perhaps not surprising that lonely, as compared to
good thing too, right. Because like I said, because not lonely participants, valued different parts of CTM
I’m so busy doing stuff, that way I already-- it’s sort program delivery. Activity coach characteristics/person-
of pre-planned. I know she’s going to be phoning ality traits were the nexus of CTM program effective-
on that day, approximate time and all that. So, it’s ness—and especially valued by lonely participants.
not like I-- you know, so I already know that’s going Activity coaches promoted social connectedness across
to take place, and that’s great, yeah all three CTM components. They were considered key
to older adult participation [38] and CTM’s (phases 1
(Lonely, post-intervention) and 2) effect on mobility, social connectedness, loneli-
Well, I thought it was good. And she was excellent, ness and PA [37]. Specific characteristics/traits thatFranke et al. BMC Public Health (2021) 21:312 Page 12 of 15 influenced feeling socially connected were: being person- and data-driven process to improve a health intervention able (easy to talk to), positive, accommodating, encour- and/or its implementation to meet stakeholder-defined aging, accepting, observant, careful, motivating, and public health impacts within resource constraints” [63]. approachable. By identifying specific traits, we ‘drill It may be prudent to adapt CTM to decrease the num- down’ into meaningful aspects of how activity coaches ber of individual phone check ins (higher resource use) respond to the needs and concerns of participants to and increase the number of motivational group meetings generate feelings of social connectedness. For example, (lower resource use). Future work (CTM phase 4; Fig. 1) activity coaches called every participant by name so will evaluate whether intervention effectiveness persists; older adults got to know each other; they encouraged if so, an optimized model would serve as one means to participants to share their experiences which cultivated a enhance social connectedness outcomes while also en- sense of bonding and belonging among the group. In hancing scalability and sustainability of CTM (through traditional fitness classes the fitness leader role is more reduced cost). technical and prescriptive [60]. CTM activity coaches To maintain benefits for individuals beyond the initial were less prescriptive serving more as a recreational intervention, behaviour change must be maintained – a ‘champion’ [61] by encouraging participants to do what potentially challenging feat to achieve [64]. While evi- they chose to do (and to stick with it). There is no one- dence suggests that behaviour change is maintained be- size-fits all approach to addressing loneliness or physical yond the end of an intervention for healthy inactive inactivity in social connectedness and physical activity adults (≥18 yrs) [65], this does not appear to hold true interventions; hence there is a key role for champions for older adults in the absence of strategies designed to (like activity coaches) to tailor interventions to suit the support maintenance [66]. Studies that formally evalu- needs of the individual participants [57]. CTM activity ated effective strategies to maintain intervention-related coach training included elements of social support and benefits in older adults specifically are scarce [67]. Our building a sense of community to enhance social con- findings demonstrate that lonely older adults value and nections--ideas that they embedded into their delivery desire increased and continued interaction with each approach. We were unable to find previous studies that other. A systematic review of adults ≥18 yrs. noted that described characteristics, skillsets and approaches of ac- maintenance strategies such as extended contact inter- tivity coaches that were likely to influence participant ventions and booster strategies to reinforce the initial level outcomes---specifically, social connectedness [5]. intervention supported long-term effectiveness [68]. In the motivational group meetings participants de- These took the form of a lower intensity intervention scribed the importance of sharing information and expe- after a more intensive initial intervention [69], and riences, learning from others and engaging with others booster sessions over the longer term that provide op- who shared similar/familiar experiences. Their percep- portunities for groups to meet. Together these strategies tions distinguished between a group of older adults in a may counter the known decline in lonely participants room receiving a ‘lecture’ about aspects of health versus PA and social connectedness. We continue our efforts to embedding strategies that foster interaction and commu- optimize the costs, and sustain the benefits, of CTM nication among the group. Oral or video presentations during scale-up. We are currently evaluating the effect- may reduce social isolation by increasing social contact, iveness of an optimized (reduced cost) ‘sustainability’ but may not generate feelings of being cared for, belong- model on person-level outcomes. ing or the development of meaningful relationships [12]. Social connectedness was facilitated when participants Limitations were partnered with others who shared similar experi- We acknowledge volunteer and recruitment bias as the ences. In our study, shared experiences cultivated feel- reach of partner organizations was primarily to a white ings of belonging (e.g., not alone, companionship) -- key middle-class (on average) constituency. Given our rela- indicators of social connectedness. Older adults may be tively homogeneous sample, results cannot be general- more ‘comfortable’ and feel more ‘supported’ when exer- ized to older adults who are marginalized by virtue of cising with others who are perceived to be similar to sex, gender, geography, socio-economic status, health them [62]. status and/or ethnicity [37]. We randomly selected older Check-ins were instrumental to develop meaningful adults to participate in interviews. However, as in our relationships between older adults and their activity previous pre-post, hybrid effectiveness study, partici- coach. However, motivational group meetings were the pants were not randomly assigned to group. In future, core component that influenced social connectedness. our findings should be replicated in a study purposely Understanding the program components of CTM that designed to evaluate the independent and combined ef- drive effectiveness is essential to optimize interventions fects of loneliness and social isolation on PA; future [63]. Optimization is defined as a “deliberate, iterative studies should include participants who identify as lonely
Franke et al. BMC Public Health   (2021) 21:312                                                                                  Page 13 of 15

but not isolated, isolated but not lonely, lonely and iso-     who are marginalized by virtue of their sex, gender,
lated, and neither lonely nor isolated. Conversely the         geography, socio-economic status, health status and/or
direct or mediating effect of PA on loneliness and social      ethnicity.
isolation warrants further attention.
                                                               Abbreviations
   We classified participants as ‘lonely’ if they responded    BC: British Columbia; COVID-19: Coronavirus disease; CTM: Choose to Move;
‘some of the time’ or ‘often’ to any of the three questions    PA: Physical activity
on the questionnaire [70]. We acknowledge that this di-
                                                               Acknowledgments
chotomization may obscure variation within the ‘lonely’        We thank our delivery partner organizations, facility managers and
category. However, a previous study noted similar find-        coordinators, activity coaches, and all the older adults who participated in
ings when the ‘lonely’ category was further broken down        Choose to Move. Thanks to staff and trainees from AART (Centre for Hip
                                                               Health and Mobility, University of British Columbia, Vancouver, Canada) for
into ‘moderately’ and ‘severely’ lonely groups [70].           data collection. Data were collected and managed using REDCap (Research
   Finally, we used a single item, self-report measure of      Electronic Data Capture) electronic data capture tools hosted at the
PA as a means to reduce participant burden and to en-          University of British Columbia [72]. REDCap is a secure, web-based applica-
                                                               tion designed to support data capture for research studies, providing: 1) an
hance feasibility of a province-wide evaluation. We ac-        intuitive interface for validated data entry; 2) audit trails for tracking data ma-
knowledge the potential for social desirability bias with      nipulation and export procedures; 3) automated export procedures for seam-
self-report measures. In addition, although the single         less data downloads to common statistical packages; and 4) procedures for
                                                               importing data from external sources.
item PA questionnaire demonstrates acceptable reliabil-
ity [44] and validity [45] the output (number of days per      Authors’ contributions
week over 30 min) does not capture all aspects of PA be-       TF: data analysis and interpretation, manuscript writing. LN: study design,
                                                               data collection oversight, data analysis, manuscript writing. JSG: study
haviours such as duration, intensity, type or domain           concept and design, data interpretation, manuscript writing. CO: study
[71]. Thus, we are unable to directly assess participants’     concept and design, data interpretation, manuscript writing HM: study
compliance to PA guidelines and may not capture all            concept and design, data interpretation, manuscript writing. All authors have
                                                               read and approved the final manuscript. TF had full access to all of the data
relevant changes in PA behaviours. Although there is a         in this study and takes complete responsibility for the integrity of the data
need for short, pragmatic tools for scale-up studies,          and the accuracy of the data analysis. The authors read and approved the
there is a need for more nuanced PA questionnaires that        final manuscript.
ascertain the influence of loneliness on specific aspects      Funding
of PA behaviours.                                              This work was supported by a Grant-in-Aid from the BC Ministry of Health as
                                                               well as a Canadian Institutes of Health Research project grant (PJT-153248).
                                                               Dr. Sims-Gould is supported by a New Investigator award from the Canadian
Conclusions                                                    Institutes of Health Research and a Scholar award from the Michael Smith
First, given the ‘epidemic of loneliness’ that plagues         Foundation for Health Research. The supporting source/financial relationships
many countries currently [5], PA and social connected-         had no such involvement in study design; collection, analysis, and interpret-
                                                               ation of data; writing of the report; or the decision to submit the report for
ness interventions are timely and important. Although          publication.
our study was not conducted in the COVID-19 environ-
ment, our findings have tremendous implications as             Availability of data and materials
                                                               The datasets used during the current study are not publicly available as
COVID public health directives escalate social isolation       stipulated in our participant consent forms but are available from the
and feelings of loneliness. Key factors of the CTM inter-      corresponding author on reasonable request.
vention that influenced social connectedness for older
                                                               Ethics approval and consent to participate
adults included interactions with the activity coaches,        The University of British Columbia (UBC) and Simon Fraser University (SFU)
the opportunity to engage with other older adults and          Clinical Research Ethics Boards (H15–02522 (UBC) and 22,015 s0614 (SFU))
share information and experiences, and increased oppor-        approved all study procedures. All participants provided informed written
                                                               consent prior to providing data.
tunity for meaningful interaction. CTM participants who
were lonely reduced their PA during the last 3 months          Consent for publication
of the program (taper phase). We attribute this to fewer       Not applicable.
contacts between older adults and their activity coach.        Competing interests
Second, health promoting interventions that were effect-       The authors claim no conflict of interest.
ive at small scale must be scaled up to promote physical,
                                                               Received: 26 August 2020 Accepted: 31 January 2021
social and mental health at the population level. Strat-
egies to scale-out CTM—'implement, test, improve,
sustain and optimize an evidence-based intervention de-        References
                                                               1. Mitra S, Sambamoorthi U. Disability prevalence among adults: estimates for
livered to new populations and/or through new delivery             54 countries and progress toward a global estimate. Disabil Rehabil. 2014
systems that differ from those in effectiveness trials’ [71]       Jun 20;36(11):940–7.
—are in order. Third, to honor the central tenets of           2. World Health Organization. Global recommendation on physical activity for
                                                                   health. 2011.
equity, diversity and inclusion, health promoting flexible     3. Berg-Weger M, Morley JE. Loneliness in old age: an unaddressed health
programs like CTM should be adapted for older adults               problem. J Nutr Health Aging. 2020;24(3):243–5.
You can also read