Best Practices for Benchmarking Germline Small Variant Calls in Human Genomes
←
→
Page content transcription
If your browser does not render page correctly, please read the page content below
bioRxiv preprint first posted online Feb. 23, 2018; doi: http://dx.doi.org/10.1101/270157. The copyright holder for this preprint
 (which was not peer-reviewed) is the author/funder, who has granted bioRxiv a license to display the preprint in perpetuity.
                                  It is made available under a CC-BY 4.0 International license.

   Best Practices for Benchmarking Germline
   Small Variant Calls in Human Genomes

   Authors
   Peter Krusche1, Len Trigg2, Paul C. Boutros3, Christopher E. Mason4, Francisco M. De La
   Vega5, Benjamin L. Moore1, Mar Gonzalez-Porta1, Michael A. Eberle6, Zivana Tezak7, Samir
   Lababidi8, Rebecca Truty9, George Asimenos10, Birgit Funke11, Mark Fleharty12, Marc Salit13,*,
   Justin M Zook14,*

   1
    Illumina Cambridge Ltd, Chesterford Research Park, Little Chesterford, Saffron Walden, Essex,
   CB10 1XL, UK
   2
    Real Time Genomics, Level 1, South Bloc, 19 Knox St. Hamilton. New Zealand
   3
    Ontario Institute for Cancer Research, Toronto, Ontario, Canada
   4
    Weill Cornell Medicine, New York, NY, USA
   5
    Department of Biomedical Data Science, Stanford University School of Medicine, Stanford, CA,
   USA
   6
    Illumina Inc., 5200 Illumina Way, San Diego, CA 92122
   7
    Center for Devices and Radiological Health, FDA, Silver Spring, MD
   8
    Office of Health Informatics, Office of the Commissioner, FDA, Silver Spring, MD
   9
    Invitae, 1400 16th St, San Francisco, CA 94103
   10
     DNAnexus, 730 Market St Suite 2100, San Francisco, CA 94103
   11
     Veritas Genetics, 99 Conifer Hill Dr, Danvers, MA 01923
   12
     Broad Institute, 415 Main Street, Cambridge, MA 02142, USA
   13
     Material Measurement Laboratory, Joint Initiative for Metrology in Biology, National Institute of
   Standards and Technology, Stanford, CA
   14
     Material Measurement Laboratory, National Institute of Standards and Technology, 100
   Bureau Dr, MS8301, Gaithersburg, MD 20899

   *These authors contributed equally to this work
   Contact Information: Justin Zook, jzook@nist.gov
bioRxiv preprint first posted online Feb. 23, 2018; doi: http://dx.doi.org/10.1101/270157. The copyright holder for this preprint
 (which was not peer-reviewed) is the author/funder, who has granted bioRxiv a license to display the preprint in perpetuity.
                                  It is made available under a CC-BY 4.0 International license.

   Abstract
   Assessing accuracy of NGS variant calling is immensely facilitated by a robust benchmarking
   strategy and tools to carry it out in a standard way. Benchmarking variant calls requires careful
   attention to definitions of performance metrics, sophisticated comparison approaches, and
   stratification by variant type and genome context. The Global Alliance for Genomics and Health
   (GA4GH) Benchmarking Team has developed standardized performance metrics and tools for
   benchmarking germline small variant calls. This Team includes representatives from sequencing
   technology developers, government agencies, academic bioinformatics researchers, clinical
   laboratories, and commercial technology and bioinformatics developers for whom benchmarking
   variant calls is essential to their work. Benchmarking variant calls is a challenging problem for
   many reasons:

        ●    Evaluating variant calls requires complex matching algorithms and standardized
             counting, because the same variant may be represented differently in truth and query
             callsets.
        ●    Defining and interpreting resulting metrics such as precision (aka positive predictive
             value = TP/(TP+FP)) and recall (aka sensitivity = TP/(TP+FN)) requires standardization
             to draw robust conclusions about comparative performance for different variant calling
             methods.
        ●    Performance of NGS methods can vary depending on variant types and genome
             context; and as a result understanding performance requires meaningful stratification.
        ●    High-confidence variant calls and regions that can be used as “truth” to accurately
             identify false positives and negatives are difficult to define, and reliable calls for the most
             challenging regions and variants remain out of reach.

   We have made significant progress on standardizing comparison methods, metric definitions and
   reporting, as well as developing and using truth sets. Our methods are publicly available on
   GitHub (https://github.com/ga4gh/benchmarking-tools) and in a web-based app on precisionFDA,
   which allow users to compare their variant calls against truth sets and to obtain a standardized
   report on their variant calling performance. Our methods have been piloted in the precisionFDA
   variant calling challenges to identify the best-in-class variant calling methods within high-
   confidence regions. Finally, we recommend a set of best practices for using our tools and critically
   evaluating the results.
bioRxiv preprint first posted online Feb. 23, 2018; doi: http://dx.doi.org/10.1101/270157. The copyright holder for this preprint
 (which was not peer-reviewed) is the author/funder, who has granted bioRxiv a license to display the preprint in perpetuity.
                                  It is made available under a CC-BY 4.0 International license.

   Introduction
   Next generation sequencing (NGS) technologies and analysis methods have rapidly evolved and
   are increasingly being used in research and clinical settings. The ability to detect DNA variants
   began in the last third of the 20th century when recombinant DNA technology facilitated the
   identification and characterization of human genes. Due to the high cost of sequencing
   technologies, early diagnostic applications were limited to screening patient samples for
   established pathogenic variants. Clinical heterogeneity and overlapping presentations can
   complicate accurate diagnosis based on clinical symptoms alone, which often resulted in the need
   for sequential testing approaches (diagnostic odysseys). While some focused tests are still in use
   today, large gene panels including tens to hundreds of genes, often accommodating sets of
   diseases with clinical overlap, are the most common application for NGS today, with exome and
   genome sequencing rapidly gaining popularity in the research and medical genetics
   communities.1,2 An output of these tests is a list of variant calls and their genotypes, often in
   variant call format (VCF), and benchmarking these calls is an important part of analytical
   validation.

   Robust, sophisticated, and standardized benchmarking methods are critical to enable
   development, optimization, and demonstration of performance of these sequencing and analysis
   tools. This is especially important for clinical laboratories developing sequencing based tests for
   medical care. Efforts such as the Genome in a Bottle Consortium and Platinum Genomes Project
   have developed small variant “truth” sets for several well-characterized human genomes from
   publicly available cell lines and DNA.3–5 A “truth” set was also recently developed from a
   “synthetic-diploid” mixture of two haploid hyditaform mole cell lines that are not currently in a
   public repository.6 A framework for benchmarking simple variant calls in the exome was
   developed previously as a web-based tool GCAT.7 However, comparing variant calls from any
   particular sequencing pipeline to a truth set is not a trivial exercise. First, benchmarking must
   consider that variants may be represented in multiple ways in the commonly used variant call
   format (VCF).8–11 When comparing VCF files record by record, many of the putative differences
   are simply different representations of the same variant. Secondly, definitions for performance
   metrics such as true positive (TP), false positive (FP), and false negative (FN), which are key for
   the interpretation of the benchmarking results, are not yet standardized. Lastly, due to the
   complexity of the human genome, performance can vary across variant types and genomic
   regions, which inevitably increases the number of benchmarking statistics to report.

   In the context of performance metrics, two critical performance parameters that are traditionally
   required for clinical tests are sensitivity (the ability to detect variants that are known to be present
   or “absence of false negatives”, which we call recall in this work) and specificity (the ability to
   correctly identify the absence of variants or “absence of false positives”, which we replace with
   “precision” in the work).12 The shift from focused genotyping tests to DNA sequencing enables
   the detection of novel sequence variants, which has fundamental implications on how these
   diagnostic performance parameters need to be determined. Early professional guidelines call for
   the use of samples with and without known pathogenic variants to determine sensitivity and
   specificity, which was appropriate when genetic testing interrogated only targeted, previously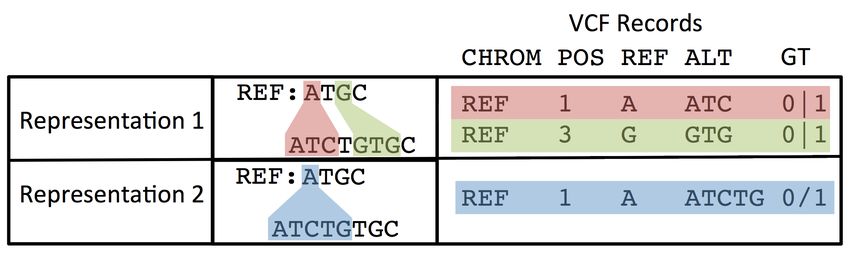
bioRxiv preprint first posted online Feb. 23, 2018; doi: http://dx.doi.org/10.1101/270157. The copyright holder for this preprint
 (which was not peer-reviewed) is the author/funder, who has granted bioRxiv a license to display the preprint in perpetuity.
                                  It is made available under a CC-BY 4.0 International license.

   identified variants. This approach remains valid for sequencing based testing, but now
   constitutes an incomplete evaluation, since it does not address the ability to detect novel variants.
   To predict performance for novel variants, it is important to maximize the number and variety of
   variants that can be compared to a “gold standard” in order to establish statistical confidence
   values for different types of variants and genome contexts, which can then be extrapolated to all
   sequenced bases.13–16 While this problem already existed for Sanger sequencing tests, the power
   and scope of NGS technologies presents a different scale of challenges for fit-for-purpose test
   validation. Laboratories that performed Sanger sequencing prior to transitioning to NGS were
   often able to utilize previously analyzed specimens to establish analytical performance of NGS
   tests; however, this approach is practically limiting, poses severe challenges for other
   laboratories, and is completely infeasible as test sizes increase from a few genes to the exome
   or genome. Guidelines were recently published for validating clinical bioinformatics assays.17
   These guidelines highlight the utility of reference materials for benchmarking variant calls, as well
   as the importance of stratifying performance by variant type and genome context.

   To address the needs for using reference materials to benchmark variant calls in a standardized,
   robust manner, we present the work of the Global Alliance for Genomics and Health (GA4GH)
   Benchmarking Team. This team, open to all interested parties, includes broad stakeholder
   representation from research institutes and academia, sequencing technology companies,
   government agencies, and clinical laboratories, with the common goal of driving towards the
   standardisation of variant calling benchmarking. In particular, we describe the available reference
   materials and tools to benchmark variant calls, and provide best practices for using these
   resources and interpreting benchmarking results.

   Comparison Method Standardization
   Our goal was to standardize the variant benchmarking process such that (1) the methods used to
   compare callsets assess the accuracy of the variant and genotype calls independent of different
   representations of the same variant, (2) primary performance metrics are represented in the most
   commonly used binary classification form (i.e., TP, FP, FN, and statistics derived from these), (3)
   calculation of performance metrics is standardized such that they can be compared more easily
   across methods, and (4) performance metrics can be stratified by variant type and genome
   context.

   In this section we discuss the technical challenges presented by comparing VCF files accurately
   and describe our solution to implement such comparisons. We focus on the use case where we
   have a call set that can be used as “truth” (e.g. Genome in a Bottle or Platinum Genomes) and
   would like to benchmark a single-sample query VCF against this dataset. The inputs to this
   comparison are a truth callset (in VCF format), and a set of confident regions (in BED format) for
   the truth set. The confident regions indicate the locations of the genome where, when comparing
   to the truth callset, variants that do not match the truth callset should be false positives and
   variants missed in the truth callset should be false negatives. Furthermore, our inputs include a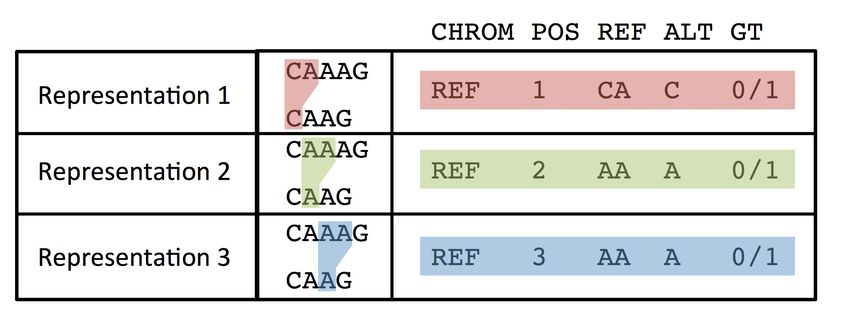
bioRxiv preprint first posted online Feb. 23, 2018; doi: http://dx.doi.org/10.1101/270157. The copyright holder for this preprint
(which was not peer-reviewed) is the author/funder, who has granted bioRxiv a license to display the preprint in perpetuity.
It is made available under a CC-BY 4.0 International license.
query callset in (g)VCF format, a reference FASTA file and optionally stratification and subset
regions to break out variant calling performance in particular regions of the genome or to restrict
comparisons to a genomic subset (e.g. exons / regions captured by targeted sequencing). For
more details see SI A.
We developed a framework for standardized benchmarking of variant calls (Fig. 1), which
addresses the challenges discussed in detail in the following sections.
Figure 1: The GA4GH Benchmarking Team’s reference implementation of a comparison
framework. The framework takes in a Truth VCF, Query VCF, confident call regions for the Truth
and/or Query, and optionally BED files to stratify performance by genome context. A standardized
intermediate output (VCF-I) from the comparison engines allows them to be interchanged and for
TP, FP, and FN to be quantified in a standard way.
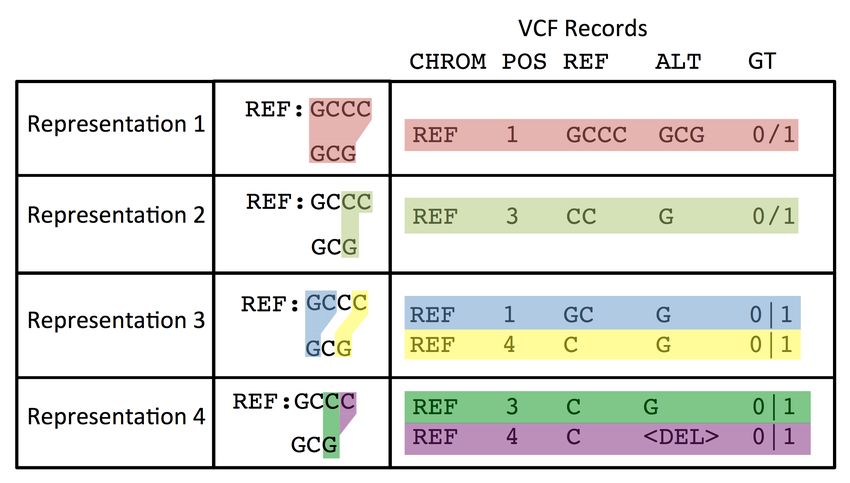
Variant representation
The challenge with comparing two or more VCF files is handling complex variant representations
correctly. In a VCF file, we describe two haplotype sequences by means of REF-ALT pairs and
genotypes. These variant calls do not uniquely represent the same haplotype sequences.
Alignments are not always unique even when using a fixed set of gap and substitution scores;
different variant calling methods may produce different variant representations. While some of
these differences can be handled using pre-processing of VCF files (e.g. variant trimming and
left-shifting), others cannot be fixed easily. As a result we cannot compare VCF files accurately
by comparing VCF records and genotypes directly. Approaches were developed to standardize
indel representation by means of left-shifting and trimming the indel alleles.18,19 These methods
determine the left-most and right-most positions at which a particular indel could be represented
in a VCF file (Fig. 2a). These methods work well when considering each VCF record
independently. However, when multiple VCF records are used to represent a complex haplotype,
more sophisticated comparison methods are required (Fig. 2b-d).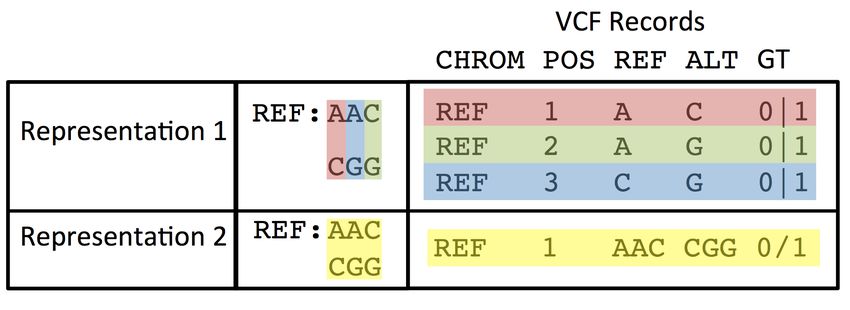
bioRxiv preprint first posted online Feb. 23, 2018; doi: http://dx.doi.org/10.1101/270157. The copyright holder for this preprint
 (which was not peer-reviewed) is the author/funder, who has granted bioRxiv a license to display the preprint in perpetuity.
                                  It is made available under a CC-BY 4.0 International license.

   Variant representation differences broadly fall into the following categories.

        1. Reference-trimming of alleles: Variant alleles may include reference bases at the
           beginning or at the end. This is required to represent insertions in a VCF file, which always
           include a single padding base (the reference base just before the insertion), and is also
           used by most variant calling methods to represent deletions. Some methods add reference
           padding to explicitly assert surrounding bases have been observed to be homozygous
           reference.
        2. Left-shifting and right-shifting of alleles: variant calls in repetitive sequence may have
           different possible starting positions after trimming. The simplest example of this scenario
           is change in length in a homopolymer: this can be represented as an insertion/deletion
           which may be anchored at any position within the homopolymer (Fig 2a). Interestingly, the
           unstated convention for VCF is that variants are left-aligned, whereas HGVS guidelines
           state that variants should be right-aligned in the context of the transcript (i.e., represent
           the 3’ most possibility), which may be either left or right aligned in the genomic context
           depending on which strand the gene is encoded on. More complex repeats lead to
           additional complexity.8–10
        3. Allele decomposition and phasing: Complex alleles may be represented as a single VCF
           record, or split into multiple records with different starting positions. An insertion can often
           be represented as one large insertion or multiple smaller insertions (Fig 2b). Similarly,
           multi-nucleotide polymorphisms (MNPs) can be represented either as a single MNP
           record, or alternatively as separate SNVs (Fig 2c). The MNP representation may be
           chosen since it explicitly encodes variant phasing and makes it clear that two SNVs have
           occurred on the same haplotype, which can have a significant impact on clinical
           interpretation, as illustrated in Supplementary Figure 1. In the SNV representation the
           same information may be encoded using the PS format field in the VCF file, but the
           practical implementation varies between different variant calling methods. Also, although
           including local phasing is strongly encouraged, phasing information may not be present in
           the VCF file, in which case we can match the MNP to the SNVs by decomposing it, but
           we cannot recompose the SNVs into the MNP if they are unphased and heterozygous.
        4. Generic ambiguous alignment: Cases 1 and 2 are specific examples for ambiguous
           alignments between reference sequence and the observed haplotype in a sample.
           However, these are not the only case where different sequence alignments with the same
           maximum score may exist. In low-complexity sequence, more difficult scenarios may
           arise. One example is the case where we have a SNV adjacent to a deletion. The SNV
           may be called either at the start or at the end of the deletion, and the choice is up to the
           variant caller or the aligner. An example is shown in Fig. 2d. Complex variants in repetitive
           regions often cannot be “normalized” (i.e., converted into a standard representation) by
           any existing tools, so that sophisticated variant comparison tools like those developed in
           this work are necessary.

   When benchmarking, the above variant representation differences can also give rise to different
   notions of giving partial credit for variant calls. One example is where we may have called only
   one SNV in an MNP with the correct genotype. When assigning TP/FP/FN status on a per-VCF-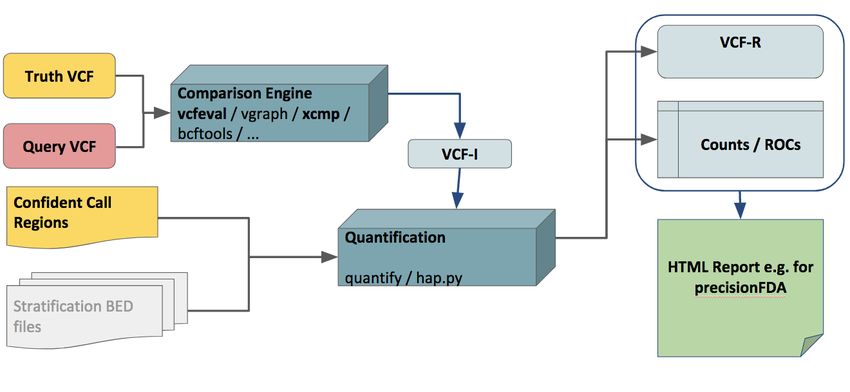
bioRxiv preprint first posted online Feb. 23, 2018; doi: http://dx.doi.org/10.1101/270157. The copyright holder for this preprint
 (which was not peer-reviewed) is the author/funder, who has granted bioRxiv a license to display the preprint in perpetuity.
                                  It is made available under a CC-BY 4.0 International license.

   record basis, a variant caller that chooses to represent calls using single MNP records would not
   get credit for calling this SNV correctly since the overall MNP record does not reproduce the
   correct haplotype. Another example would be phasing switch-errors: a choice needs to be made
   whether to use phasing-aware benchmarking for a particular evaluation. Handling these cases is
   important since adding phasing information provides additional information to the users of a
   variant caller, but may lead to FPs / FNs when running a benchmarking comparison when
   comparing to a method which does not provide phasing information and outputs all alleles in
   decomposed form for maximum credit in the benchmarking comparison.

   A variety of approaches have been recently developed to address the challenges in variant
   representation.8–10,20,21 Real Time Genomics (RTG) developed the comparison tool vcfeval, which
   introduced the idea of comparing variants at the level of the genomic haplotypes that the variants
   represent as a way to overcome the problems associated with comparing complex variants, where
   alternative yet equivalent variant representations can confound direct comparison methods.8
   Variant “normalization” tools help to represent variants in a standardized way (e.g., by left-shifting
   indels in repeats), but they demonstrated that “variant normalization” approaches alone were not
   able to reconcile different representations of many complex variants. In contrast, global
   optimization permits evaluation of alternate representations that minimize the number of
   discrepancies between truth and test set caused by differences in representations of the same
   variant. Similarly, VarMatch was developed to resolve alternate representations of complex
   variants, with additional ability to tune the matching parameters depending on the application.9
   Finally, hap.py includes a comparison tool to perform haplotype-based comparison of complex
   variants in addition to sophisticated functionality to stratify variant calls by type or region.20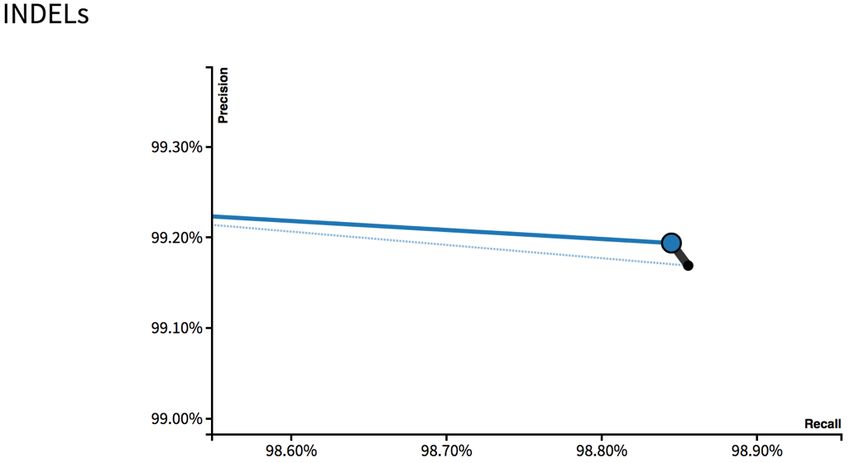
bioRxiv preprint first posted online Feb. 23, 2018; doi: http://dx.doi.org/10.1101/270157. The copyright holder for this preprint
  (which was not peer-reviewed) is the author/funder, who has granted bioRxiv a license to display the preprint in perpetuity.
                                   It is made available under a CC-BY 4.0 International license.

(a)

(b)

(c)

(d)

      Fig. 2: Four examples of cases where variants can be represented in multiple forms in VCF format.
      (a) Three representations of a deletion in a homopolymer. (b) The insertion can be represented
      as one 4-bp insertion or two 2-bp insertions. (c) An MNP can be represented as 3 SNVs or one
      larger substitution. (d) Four different representations of a complex variant. Note that
      representations include phasing information in these examples where it is necessary to
      unambiguously describe the variant. If phasing was not described for these variants, it would
      impossible to normalize their representations, but our sophisticated variant comparison tools can
      determine that they could describe the same two haplotypes.
bioRxiv preprint first posted online Feb. 23, 2018; doi: http://dx.doi.org/10.1101/270157. The copyright holder for this preprint
(which was not peer-reviewed) is the author/funder, who has granted bioRxiv a license to display the preprint in perpetuity.
It is made available under a CC-BY 4.0 International license.
Variant counting
The GA4GH Benchmarking Team developed consensus definitions and recommendations for
expressing performance metrics for small germline variant calls. Assessing the performance of
variant callers does not easily lend itself to the typical binary classification performance
assessment model of simply determining true and false "positives" and “negatives”. Several
characteristics of the genome do not fit well in a binary classification model:
1. More than two possible genotypes exist at any given location. For SNVs (if ignoring
phasing), any location can have one of 10 different true genotypes (i.e., A/A, A/C, A/G,
A/T, C/C, C/G, …). For indels and complex variants, an infinite number of possible
genotypes exists (e.g., any length of insertion).
2. A number of variant callers distinguish between "no-calls" and homozygous reference
calls at some genome positions or regions. Some variant callers even output partial no-
calls, calling one allele but not the other. “No-calls” at a true variant site could be treated
as false negatives or be excluded from counting.
3. In addition to the challenges comparing different representations of complex variants (i.e.,
nearby SNVs and/or indels) discussed above, there are challenges in standardizing
counting of these variants. Complex variants can be treated as a single positive event or
as multiple distinct SNV and indel events when counting the number of TP, FP, and FN
variants. In addition, only part of a complex variant may be called, which poses challenges
in defining TP, FP, and FN.
4. Methods for assessing accuracy of phasing have not been fully developed or
standardized, but accurate phasing can be critical, particularly when multiple
heterozygous variants exist in a small region (e.g., complex variants).
Matching Stringencies
Due to the inherent complexity of the human genome, TP, FP, and FN can be defined in different
ways. Our reference implementation for benchmarking uses a tiered definition of variant matches,
a standardized VCF format for outputting matched variant calls, and a common counting and
stratification tool (see SI A).
We consider the following types of variant matches from least to most stringent, with “Genotype
match” being used by our current tools to calculate TP, FP, and FN:
● Local match: Truth and query variants are counted as TP_LM if their reference span
intervals are closer than a pre-defined local matching distance, i.e. all yellow categories in
Table 1 are considered TPs, including “F” matches that are within a specified number of
basepairs. This approach has previously been implemented.6,20 An advantage of this
matching method is that it is robust towards representational differences. A drawback for
many applications is that it does not measure allele or genotype accuracy. We use local
matches as the lowest tier of matching to label variants which are close-by but cannot be
matched with other methods. Local match statistics (TP_LM, FP_LM, and FN_LM) can bebioRxiv preprint first posted online Feb. 23, 2018; doi: http://dx.doi.org/10.1101/270157. The copyright holder for this preprint
(which was not peer-reviewed) is the author/funder, who has granted bioRxiv a license to display the preprint in perpetuity.
It is made available under a CC-BY 4.0 International license.
calculated from our outputs: TP_LM=QUERY.TP+FP.GT+FP.AL; FP_LM=QUERY.FP-
FP.GT-FP.AL; FN_LM=TRUTH.FN-FP.GT-FP.AL. Local matching has been
implemented in the hap.py tool scmp-distancebased.
● Allele match: Truth and query alleles are counted as TP_AM if they contain any of the
same (trimmed and left-shifted) alleles. This method is more specific than local matching
(e.g. repeat expansions must be called with the correct length in order to get an allele
match), but could also be susceptible to spurious mismatches when truth and query
variant alleles are decomposed differently. Genotype mismatches (FP.GT in Table 1) are
considered TPs in this matching method. We indicate allele matches in scenarios where
variants can be matched when ignoring the genotype. Allele match statistics (TP_AM,
FP_AM, and FN_AM) can be calculated from our outputs: TP_AM=QUERY.TP+FP.GT;
FP_AM=QUERY.FP-FP.GT; FN_AM=TRUTH.FN-FP.GT. Allele matching has been
implemented in the hap.py tool scmp-somatic and in vcfeval with the --squash-ploidy
option.
● Genotype match: Variant sets in truth and query are considered TPs when their unphased
genotypes and alleles can be phased to produce a matching pair of haplotype sequences
for a diploid genome. Each truth (and query) variant may be replayed onto one of two truth
(or query) haplotypes. A maximal subset of variants that is replayed to produce matching
haplotype sequences forms the TP variants, query variants outside this set are FP, truth
variants outside this set are FN. The method only considers haploid or diploid samples but
could be extended to higher ploidy also. Enumerating the possible assignments for
haplotype generation is computationally expensive. Vcfeval solves this problem using
global optimization methods supplemented with heuristic pruning. Genotype match
statistics are the default TP, FP, and FN output by our tools. Genotype matching has been
implemented in the hap.py tool xcmp and in vcfeval.
● Phased genotype match: When VCF files specify phasing information, we can compare
on a haplotype level: variants will only be matched if they produce matching haplotype
sequences under phasing constraints. Both vcfeval and hap.py’s xcmp method support
phased matching when both callsets include variants that are globally phased (i.e. specify
a paternal and maternal haplotype for each chromosome). To our knowledge, no current
comparison method supports phasesets and local phasing to compare variants. Moreover,
assessing phasing requires us to consider not only phasing variant accuracy, but also
completeness of phasing coverage. In our current methods we do not implement phased
genotype matching beyond the basic support provided by vcfeval and xcmp.bioRxiv preprint first posted online Feb. 23, 2018; doi: http://dx.doi.org/10.1101/270157. The copyright holder for this preprint
(which was not peer-reviewed) is the author/funder, who has granted bioRxiv a license to display the preprint in perpetuity.
It is made available under a CC-BY 4.0 International license.
Table 1: Contingency table describing the GA4GH definitions of true positive (TP), false positive
(FP), false negative (FN), allele mismatch (FP.AL), genotype mismatch (FP.GT), and unknown
(UNK). Matches counted as FP.GT and FP.AL are additionally counted as both FP and FN, since
our tool’s default matching stringency requires genotypes to match. Query variants outside the
Truth bed file are counted as UNK.
Truth
Outside
Genotype ref/ref ref/var1 var1/var2 var1/var1 bed
ref/ref n/a FN FN FN n/a
ref/var1 FP TP FP.GT FP.GT UNK
ref/var2 n/a FP.AL FP.GT FP.AL n/a
ref/var3 n/a n/a FP.AL n/a n/a
var1/var2 FP FP.GT TP FP.GT UNK
Query
var1/var3 n/a n/a FP.GT n/a n/a
var2/var3 n/a FP.AL FP.GT FP.AL n/a
var3/var4 n/a n/a FP.AL n/a n/a
var1/var1 FP FP.GT FP.GT TP UNK
var2/var2 n/a FP.AL FP.GT FP.AL n/a
var3/var3 n/a n/a FP.AL n/a n/a
Defining True Positives, False Positives, and False Negatives
In Table 1, we enumerate the types of matches that are clear TP, FP, and FN as well as various
kinds of partial matches that may be considered TP, FP, and/or FN depending on the matching
stringency, and how they are counted by our tools. Our tools calculate TP, FP, and FN requiring
the genotype to match, but output additional statistics related to how many of the FPs and FNs
are allele matches (FP.GT) or local matches (FP.AL). Note that we have chosen not to include
true negatives (or consequently specificity) in our standardized definitions. This is due to the
challenge in defining the number of true negatives, particularly around complex variants. In
addition, precision is often a more useful metric than specificity due to the very large proportion
of true negative positions in the genome.
Another key question is how to count both matching and mismatching variant calls when they are
differently represented in the truth dataset and a query. When representing MNPs as multiple
SNVs, we may count one variant call for each SNV, or only one call in total for the MNP record.
Similar considerations apply to counting complex records. We approach variant counting as
follows:
● We count the truth and query VCF files separately. A set of truth records may be
represented by a different set of query records.bioRxiv preprint first posted online Feb. 23, 2018; doi: http://dx.doi.org/10.1101/270157. The copyright holder for this preprint
(which was not peer-reviewed) is the author/funder, who has granted bioRxiv a license to display the preprint in perpetuity.
It is made available under a CC-BY 4.0 International license.
● To get comparable recall, we count both TPs and FNs in their truth representation. When
comparing different variant calling results to the same truthset, these counts will be based
on the same variant representation.
● Precision is assessed using the query representation of variants. We give a relative
precision to the number of truth variants in query representation. If a variant caller is
consistent about the way it represents variants, this approach mitigates counting-related
performance differences.
● We implement a “partial credit” mode in which we trim, left-shift and decompose all query
variant calls before comparison. This resolves the MNP vs. SNV comparison issues and
also simplifies the variant types we use for stratification, rather than having a category of
complex variant calls which has results that are difficult to interpret, we account for every
atomic indel and SNV call independently.
● Variants are stratified into a canonical set of types and subtypes (see SI B).
● When stratification regions are applied, we match variants by their trimmed reference
span. If any part of a deletion overlaps the stratification region, it is counted as part of that
stratum. Insertions receive special treatment by requiring both the base before and the
base after to be captured. Importantly, this stratification is performed after comparison to
deal appropriately with representation issues.
Benchmarking metrics report
To reconcile the comparison methods and metrics discussed above into a simple summary, we
have implemented in hap.py a standardized report that can be generated from the tabular output
of the benchmarking workflow.20 This report displays the metrics we believe are most important
in an accessible fashion (Tier 1 metrics), while also allowing to examine the data in more detail
(Tier 2 metrics). An example for the metrics and plots displayed in such a report is shown in Fig.
3.
From the TP, FP, and FN counts defined in Table 1, we calculate:
METRIC.PRECISION = QUERY.TP / (QUERY.TP + QUERY.FP)
METRIC.RECALL = TRUTH.TP / (TRUTH.TP + TRUTH.FN)
We use the count of TPs based on the Query representation to calculate precision, and we use
the count of TPs based on the Truth representation to calculate recall, in order to account best
for cases where the Truth may tend to split a complex variant into multiple varaints and the Query
may combine them into a single variant, or vice versa. Definitions and formulas for all performance
metrics are detailed in Supplementary Table 1.
Note that we do not define “True negatives” or “specificity” because these are not cleanly
applicable to genome sequencing. For example, there are an infinite number of possible indels
in the genome, so there are an infinite number of true negatives for any assay.bioRxiv preprint first posted online Feb. 23, 2018; doi: http://dx.doi.org/10.1101/270157. The copyright holder for this preprint
(which was not peer-reviewed) is the author/funder, who has granted bioRxiv a license to display the preprint in perpetuity.
It is made available under a CC-BY 4.0 International license.
(a)
(b)
(c)
Figure 3: Example standardized HTML report output from hap.py. (a) Tier 1 high-level metrics
output in the default view. (b) Tier 2 more detailed metrics and stratifications by variant type and
genome context. (c) Precision-recall curve using QUAL field, where the black point is all indels,
the blue point is only PASS indels, the dotted blue line is the precision-recall curve for all indels,
and the solid blue line is the precision-recall curve for PASS indels.bioRxiv preprint first posted online Feb. 23, 2018; doi: http://dx.doi.org/10.1101/270157. The copyright holder for this preprint
(which was not peer-reviewed) is the author/funder, who has granted bioRxiv a license to display the preprint in perpetuity.
It is made available under a CC-BY 4.0 International license.
In addition, the GA4GH Benchmarking framework is able to produce precision-recall curves,
which are graphical plots that illustrate the performance of a variant quality score of a test call set
as its discrimination threshold is varied, compared to the reference call set (see Figure 4). The
curve is created by plotting the precision against the recall at various quality score threshold
settings. Commonly used quality scores include QUAL, GQ (genotype quality), DP (depth of
coverage), and machine-learning derived scores such as VQSLOD and AVR. Because some
methods use multiple annotations for filtering, precision-recall curves can be generated for a
particular quality score either before or after removing filtered sites. Examining the precision-recall
curves for various call-sets has two main advantages. Firstly, it allows the user to consider how
accuracy is affected through the precision/recall trade-off. Secondly, different call sets may have
effectively selected different precision/recall trade-off criteria, so simply comparing full call set
metrics may reflect more about the different trade-off points than the call sets themselves at some
shared trade-off criteria.
In the following section, we will discuss example comparisons performed using the standardized
benchmarking workflow and comparison methods.
Benchmark callsets
Benchmarking of variant calls requires a specific genome and an associated set of calls that
represent the “right answers” for that genome. Such call sets have the property that they can be
used as “truth” to accurately identify false positives and negatives. That is, when comparing calls
from any sequencing method to this set of calls, >50% of the putative false positives and false
negatives should be errors in the method being assessed. Because it is treated as the truth, this
benchmark set will be referred to in this manuscript as the “truth” set, but other terms used for this
include the “gold-standard” set, the “high-confidence” set, the “reference callset,” or
“benchmarking data.”
Genome in a Bottle
The Genome in a Bottle Consortium (GIAB) is a public-private-academic consortium hosted by
the National Institute of Standards and Technology (NIST) to perform authoritative
characterization of a small number of human genomes to be used as benchmarks. GIAB
published a benchmark set of small variant and reference calls for its pilot genome, NA12878,
which characterized a high-confidence genotype for approximately 78% of the bases with
sequence information (i.e., bases that are not an “N”) in the human genome reference sequence
(version GRCh37).3 Since this publication, GIAB has further developed integration methods to
be more reproducible, comprehensive, and accurate, and has incorporated new technologies and
analysis methods. The new integration process has been used to form benchmark small variant
and reference calls for approximately 90% of GRCh37 and GRCh38 for NA12878, as well as a
mother-father-son trio of Ashkenazi Jewish ancestry and the son in a trio of Chinese ancestry
from the Personal Genome Project (v3.3.2 at ftp://ftp-trace.ncbi.nlm.nih.gov/giab/ftp/release/).4,22
The five GIAB-characterized genomes are available as NIST Reference Materials (RMs 8391,bioRxiv preprint first posted online Feb. 23, 2018; doi: http://dx.doi.org/10.1101/270157. The copyright holder for this preprint
(which was not peer-reviewed) is the author/funder, who has granted bioRxiv a license to display the preprint in perpetuity.
It is made available under a CC-BY 4.0 International license.
8392, 8393, and 8398), which are extracted DNA from a single, homogenized, large growth of
cells for each genome. These samples are also all available as cell lines and DNA from the Coriell
Institute for Medical Research. The Personal Genome Project samples are also consented for
commercial redistribution,22 and several derived products are commercially available, including
FFPE-preserved and in vitro mutated cell lines, or with DNA spike-ins with particular variants of
clinical interest. GIAB is continuing to improve the characterization of these genomes to
characterize increasingly difficult variants and regions with high-confidence.
Platinum Genomes
In addition to the benchmarking data produced by the GIAB consortium, Illumina Platinum
Genomes (PG) has also created a benchmarking data set for small variants (SNVs and Indels)
using the 17-member pedigree (1463) from Coriell Cell Repositories that includes the GIAB pilot
sample NA12878/HG001.5 Every sample of this pedigree was sequenced to ~50x depth on an
Illumina HiSeq2000 system. Variant calls were made from this data using different combinations
of aligners and variant callers. This pedigree includes 11 children of the parents (NA12877 and
NA12878), producing a fully phased dataset that allows to validate the accuracy of variant calls
through genetic inheritance patterns. The HiSeq2000 sequence data used to create these
benchmarking calls can be obtained from the Database of Genotypes and Phenotypes (dbGaP;
https://www.ncbi.nlm.nih.gov/gap) under accession number phs001224.v1.p1. Additionally, the
sequence data for six of the members of this pedigree are released through the European
Nucleotide Archive (ENA; http://www.ebi.ac.uk/ena) under accession number ERP001960. The
DNA and cell lines for all samples are available from the Coriell Institute for Medical Research,
and DNA from a single, homogeneous batch of NA12878 is also available as NIST Reference
Material 8398.
Merged PG and GiaB
Since the two resources mentioned above constitute two different methods for generating “truth”
call sets for NA12878, we have merged these into a single and more comprehensive dataset.
Such a “hybrid” truth set can leverage the strengths of each input, namely the diversity of
technologies used as input to Genome in a Bottle and the robust validation-by-inheritance
methodology employed by Platinum Genomes.
As a first pass, we have compared the call sets in NA12878 and identified the intersection as well
as the ones unique to each (Supplementary Figure 2). Next, starting from the union, we have
used a modified version of the k-mer validation algorithm described in [PG] to validate the merged
calls (Supplementary Methods). This hybrid benchmark call set includes more total variants than
either input set (67-333k additional SNVs and 85-90k additional indels), allowing us to assess
more of the calls made by any sequencing pipeline without a loss in precision (see below).
This new benchmarking set represents the first step towards a more comprehensive call set that
includes both “easy” to characterise variants and those that occur in difficult parts of the genome.
Despite this significant advance, there remains areas for continued improvement, such asbioRxiv preprint first posted online Feb. 23, 2018; doi: http://dx.doi.org/10.1101/270157. The copyright holder for this preprint
(which was not peer-reviewed) is the author/funder, who has granted bioRxiv a license to display the preprint in perpetuity.
It is made available under a CC-BY 4.0 International license.
adjudication between conflicting calls and the merging of confident regions. We will continue to
develop this integration method in order to further expand the breadth of coverage of this hybrid
truth set resource.
Currently, neither PG nor GIAB makes high-confidence calls on chromosome Y or the
mitochondrial genome. In addition, GIAB currently has chromosome X calls only for females, but
PG has haploid chromosome X calls for the male NA12877 as well. Hap.py has an optional
preprocessing step to guess male/female from the truth VCF. For male samples it converts
haploid 1 GT calls on chrX/Y to 1/1 so that they get compared correctly by xcmp. For vcfeval,
haploid 1 GT calls are treated as the same as 1/1, so this conversion is not necessary.
Synthetic Diploid
A new “synthetic-diploid” benchmark callset was created from long read assemblies of the
CHM1 and CHM13 haploid cell lines, in order to benchmark small variant calls in regions difficult
to analyze with short reads or in diploid genomes, which are currently excluded from the GIAB
and Platinum Genomes high-confidence regions.6 Because it is based on long reads,
performance metrics are likely less biased toward any short read sequencing technology or
informatics method, and it enables benchmarking in regions difficult to map with short reads.
However, because it currently contains some errors that were not corrected in the long reads, it
requires a less stringent benchmarking methodology similar to the “local match” method
described below. It also excludes 1bp indels from performance assessment since long read
assemblies contain 1bp indel errors, and >50bp indels because these are not analyzed.
Therefore, it is currently not as useful for assessing accuracy of genotypes or accuracy of the
exact sequence change predicted in the REF and ALT fields. When using GA4GH tools
requiring genotypes to match, the majority of FPs and FNs may not be errors in the query
callset, though work is underway to improve this. Nevertheless, it is likely to be complementary
to the GA4GH benchmarking strategy by enabling users to assess accuracy in more difficult
regions that GIAB and Platinum Genomes currently exclude from their high confidence regions.
In particular, because the truth set was not developed from short reads, and errors in the truth
may be different from errors in short reads, it may better assess of relative performance
between short read-based methods, particularly in more difficult genomic regions. A current
limitation is that CHM1 and CHM13 cell lines are not available in a public repository.
Example comparisons
Lessons from PrecisionFDA Challenges
The PrecisionFDA team held two challenges in 2016, with participants publicly submitting results
from various mapping/variant calling pipelines. While both challenges asked participants to
analyze short read WGS datasets, the first challenge used a sample with high-confidence calls
already available (HG001/NA12878) and the second one without high-confidence calls yet
available (HG002 from GIAB, made available by GIAB upon the close of the challenge).bioRxiv preprint first posted online Feb. 23, 2018; doi: http://dx.doi.org/10.1101/270157. The copyright holder for this preprint
(which was not peer-reviewed) is the author/funder, who has granted bioRxiv a license to display the preprint in perpetuity.
It is made available under a CC-BY 4.0 International license.
In the first, “Consistency” Challenge, 30x Illumina WGS of the HG001/NA12878 sample was
provided from two different sequencing sites, and the VCF file results from 17 participants were
assessed for reproducibility and accuracy against the GIAB v2.19 Benchmark VCF. It is possible
to generate reproducible results without much variability but substantial differences from the truth.
Additionally, the pipelines that generated the variant calls could be tuned to HG001, which, in
many situations, was used to train or optimize pipelines.
Therefore, in the second, “Truth” Challenge, participants were asked to use their pipelines with
50x Illumina WGS to predict variants from at the time yet unknown reference sample
HG0002/NA24385. Challenge results were compared using two benchmarking comparator tools,
RTG Tools vcfeval for Consistency Challenge, and Vcfeval + Hap.py Comparison for Truth
Challenge (more information at https://precision.fda.gov/challenges/). There were 35 entries in
the Truth Challenge and the responses were submitted and ranked according to precision and
recall for SNVs and indels vs. the GIAB v3.3.2 high-confidence calls for each genome (ftp://ftp-
trace.ncbi.nlm.nih.gov/giab/ftp/release/). This was the first time Vcfeval + Hap.py GA4GH
comparison methodology was applied at scale across the large number of entries submitted by
pipeline developers. It helped highlight the utility of the tools and the need for further development
and careful interpretation of results. Based in part on feedback from the challenges, an improved
benchmarking app “GA4GH Benchmarking” uploaded by user peter.krusche is now available on
precisionFDA.
The results of comparisons can be informative and useful to the community, but rankings and
performance metrics should be interpreted with care, as explained in the challenge results
descriptions. For instance, in the Consistency Challenge the indel calling results were not
calculated separately, so the indel performance was unclear considering the majority of the
pipelines correctly called most of the “easy” SNVs in known high confidence regions. This became
distinguishable in the Truth Challenge where separate statistics were computed for SNVs and
indels, with the indels showing much larger variability when using different pipelines.
Note that both the “truth” sets and the comparison methodology in the truth challenge were newly
introduced, with GA4GH comparison methodology under active development. The challenge
results available on precisionFDA web page should be considered only initial evaluation, with the
rich data set resulting from the challenge inviting further exploration. It is especially critical to
recognize that performance metrics indicate performance for the “easier” variants and regions of
the genome, so that precision and recall estimates are higher than if more difficult variants and
regions were included. It is likely that some methods will perform worse than other methods for
easier variants while performing better for harder variants (e.g., methods using a graph reference
or de novo assembly may do better in regions not assessed like the MHC or large insertions while
not performing as well for easier variants because they are less mature). It is also important to
manually curate a subset of FPs and FNs to ensure they are actually FPs and FNs and to
understand their cause. Interestingly, stringency of matching can also significantly influence
performance metrics. For example, Figure 4 shows how the number of FP indels for the
assembly-based fermikit submission is much higher than the RTG submission when countingbioRxiv preprint first posted online Feb. 23, 2018; doi: http://dx.doi.org/10.1101/270157. The copyright holder for this preprint
(which was not peer-reviewed) is the author/funder, who has granted bioRxiv a license to display the preprint in perpetuity.
It is made available under a CC-BY 4.0 International license.
genotype errors as FPs, but the number of FPs is lower for fermikit when matching only the allele
or performing distance-based matching. Additional information about relative strengths and
weaknesses of the pipelines could also be gained through stratification, as discussed in the next
section.
Figure 4: Matching stringency can affect relative performance of algorithms. Number of false
positives for two PrecisionFDA Challenge submissions is shown for different matching
stringencies, showing that the fermikit submission has many more false positives if genotype
errors are counted as FPs, but that it has fewer FPs if matching only the allele or performing
distance-based matching. Note that this is intended to illustrate the importance of matching
stringency and is likely not indicative of the performance of these methods with optimized
parameters or current versions.
Stratification illuminates challenging regions sequenced with and
without PCR amplification
As an example of using stratification, we compare recall and precision for whole genome
sequencing assays with and without a PCR amplification step. Table 2 shows that indel recall
and precision are lower when using PCR amplification than when using PCR-free sequencing.
Stratification highlights that this difference almost entirely results from PCR-related errors in
homopolymers and tandem repeats, since performance is similar when excluding variants that
occur within 5bp of homopolymer sequences longer than 5bp and tandem repeats longer than
10bp. Performance in regions with low GC content is similar, but PCR results in lower SNV and
indel recall where GC content is > 85%.
Further stratification by type of repeat can illuminate particularly challenging genome contexts.
For example, when sorting strata by recall, indels in 51-200 bp AT dinucleotide tandem repeatsbioRxiv preprint first posted online Feb. 23, 2018; doi: http://dx.doi.org/10.1101/270157. The copyright holder for this preprint
(which was not peer-reviewed) is the author/funder, who has granted bioRxiv a license to display the preprint in perpetuity.
It is made available under a CC-BY 4.0 International license.
have significantly lower recall and precision than all other strata for both PCR and PCR-free
results (p
85%
indel 97.3 73.2 -24.1 97.3 96.5 -0.8
51-200 bp AT
indel 28.0 12.0 -16 64.0 39.0 -25
dinucleotide TRs
All 51-200 bp
indel 81.0 45.0 -36 94.0 84.0 -10
dinucleotide TRsbioRxiv preprint first posted online Feb. 23, 2018; doi: http://dx.doi.org/10.1101/270157. The copyright holder for this preprint
(which was not peer-reviewed) is the author/funder, who has granted bioRxiv a license to display the preprint in perpetuity.
It is made available under a CC-BY 4.0 International license.
Benchmarking Best Practices
Box 1: GA4GH recommendations for best practices for germline variant call
benchmarking
Benchmark Use benchmark sets with both high-confidence variant calls as well as high-confidence regions (e.g.,
sets from GIAB or Platinum Genomes).
Stringency Determine whether it is important that the genotypes match exactly, only the alleles match, or the
of variant call just needs to be near the true variant. For example, if you confirm and/or manually curate all
comparison variants to ensure you have the correct allele and genotype, then local matching may be sufficient.
While the default TP, FP and FN require genotype and allele matching, the additional metrics FP.GT
and FP.AL output by the GA4GH tools enable users to calculate performance at different
stringencies.
Variant Use sophisticated variant comparison engines such as vcfeval, xcmp, or varmatch that are able to
comparison determine if different representations of the same variant are consistent with the benchmark call
tools (examples in Fig. 1). Subsetting by high-confidence regions and, if desired, targeted regions, should
only be done after comparison to avoid problems comparing variants with different representations.
Manual Manually curate alignments, ideally from multiple data types, around at least a subset of putative
curation false positive and false negative calls in order to ensure they are truly errors in the user’s callset and
to understand the cause(s) of errors. Report back to benchmark set developers any potential errors
found in the benchmark set (e.g., using https://goo.gl/forms/ECbjHY7nhz0hrCR52 for GIAB).
Interpret- All performance metrics should only be interpreted with respect to the limitations of the variants and
ation of regions in the benchmark set. Performance is unknown for variant types and genome contexts not
metrics well represented in the benchmark set. Performance metrics are likely to be lower for more difficult
variant types and regions that are not fully represented in the benchmark set, such as those in
repetitive or difficult-to-map regions. When comparing methods, note that method A may perform
better in the high-confidence regions, but method B may perform better for more difficult variants
outside the high-confidence regions.
Stratifi- Performance results should be stratified by variant type. Stratification by genomic region should also
cation be considered to gain additional insights into strengths and limitations of the sequencing pipeline, as
it can highlight regions that are not sufficiently represented. Stratification should only be done after
comparison to avoid problems comparing variants with different representations.
Confidence Confidence intervals for performance metrics such as precision and recall should be calculated.
Intervals This is particularly critical for the smaller numbers of variants found when benchmarking targeted
assays and/or less common stratified variant types and regions.
Additional We recommend using other benchmarking approaches in addition to those discussed in this paper
bench- to understand performance of a pipeline, including:
marking ● Confirming results found in samples over time
approaches ● Synthetic DNA spike-ins with challenging and common clinically relevant variants
● Engineering variants into cell lines
● Finding existing samples with challenging and common clinically relevant variants
● Simulation methods, such as read simulators, adding variants into real reads, and modifying the
reference
● Run-specific metrics such as base quality score distributions, coverage distributions, etc. can also
be useful to identify outlier runsbioRxiv preprint first posted online Feb. 23, 2018; doi: http://dx.doi.org/10.1101/270157. The copyright holder for this preprint
(which was not peer-reviewed) is the author/funder, who has granted bioRxiv a license to display the preprint in perpetuity.
It is made available under a CC-BY 4.0 International license.
Conclusions
The GA4GH Benchmarking Team has developed a suite of tools to produce standardized
performance metrics for benchmarking small germline variant calls. These sophisticated tools
address challenges in standardizing metrics like recall and precision, comparing different
representations of variant calls, and stratifying performance by variant type and genome context.
We have developed a set of best practices for benchmarking variant calls to help users avoid
common pitfalls and misinterpreting performance metrics.
Moving forward there will be a continual need for improvements in benchmarking of variant
discovery methodologies. Technological evolution will enable laboratories to characterize
increasingly difficult variants and genomic regions, which will require improved benchmarks.
Simultaneously, this evolution can contribute to improved characterisation of reference materials.
For example, the types of variants being analyzed will increase in scope: most current
benchmarking focuses on relatively small variations, and entirely different techniques will be
needed to consider structural variants. An algorithm that detects copy number variation needs to
identify the two separate breakpoints that define the variant, but also provide an estimate of the
actual number of copies present. There are thus at least three different metrics of interest for each
copy number variant predicted, and it is not clear how these should be weighted to provide a
singular ranking of methodologies. Similarly, performance metrics for large insertions might
include accuracy of the size and sequence predictions, in addition to genotype accuracy. As a
result, definitions of truth and performance metrics can become significantly more complex than
for the smaller variants outlined here.
Assessment of somatic variants introduces challenges that are quite different from those
presented in germline variant calling. Different benchmarking approaches are needed to handle
somatic issues like assessing the accuracy of variant allele frequency or trinucleotide mutational
signatures. A good germline variant caller will not perform well for somatic detection, and vice
versa. A global consortium around benchmarking of somatic variant detection has been
established, called the ICGC-TCGA DREAM Somatic Mutation Calling (SMC) group, and has
been benchmarking both detection of individual variants and of broader processes like subclonal
variation.23
Moving forward, groups will also need to modify benchmarking strategies to address changes in
the way the human genome itself is represented. Today the most common way of representing
the human genome involves a set of linear chromosomes (e.g., the most common usage of
GRCh37). There are key advantages to non-linear representations of the genome, including
ability to recognize copy-number and other polymorphisms directly in the reference, and as a
result more graphical structures are in development.24 The GRCh38 build of the human genome
makes a key step towards this with its use of ALT loci, which provide multiple distinct versions of
specific regions of the genome.25 These ALT loci are not well-accounted for by most aligners or
the benchmarking tools we describe, and their impact on benchmarking studies is largelyYou can also read