Characteristics of Resting State EEG Power in 80+-Year-Olds of Different Cognitive Status - Frontiers
←
→
Page content transcription
If your browser does not render page correctly, please read the page content below
ORIGINAL RESEARCH
                                                                                                                                           published: 11 August 2021
                                                                                                                                     doi: 10.3389/fnagi.2021.675689

                                            Characteristics of Resting State EEG
                                            Power in 80+-Year-Olds of Different
                                            Cognitive Status
                                            Stephanie Fröhlich 1,2 , Dieter F. Kutz 1,3 , Katrin Müller 2,4 and Claudia Voelcker-Rehage 1,2*
                                            1
                                             Department of Neuromotor Behavior and Exercise, Institute of Sport and Exercise Sciences, Faculty of Psychology and
                                            Sport Sciences, University of Münster, Münster, Germany, 2 Department of Sports Psychology (With Focus on Prevention
                                            and Rehabilitation), Institute of Human Movement Science and Health, Faculty of Behavioural and Social Sciences, Chemnitz
                                            University of Technology, Chemnitz, Germany, 3 Institute of Human Movement Science and Health, Faculty of Behavioural
                                            and Social Sciences, Chemnitz University of Technology, Chemnitz, Germany, 4 Department of Social Science of Physical
                                            Activity and Health, Institute of Human Movement Science and Health, Faculty of Behavioural and Social Sciences, Chemnitz
                                            University of Technology, Chemnitz, Germany

                                            Compared with healthy older adults, patients with Alzheimer’s disease show decreased
                                            alpha and beta power as well as increased delta and theta power during resting state
                                            electroencephalography (rsEEG). Findings for mild cognitive impairment (MCI), a stage
                                            of increased risk of conversion to dementia, are less conclusive. Cognitive status of
                                            213 non-demented high-agers (mean age, 82.5 years) was classified according to a
                                            neuropsychological screening and a cognitive test battery. RsEEG was measured with
                                            eyes closed and open, and absolute power in delta, theta, alpha, and beta bands were
                                            calculated for nine regions. Results indicate no rsEEG power differences between healthy
                           Edited by:       individuals and those with MCI. There were also no differences present between groups in
               Priyanka Shah-Basak,         EEG reactivity, the change in power from eyes closed to eyes open, or the topographical
        Medical College of Wisconsin,
                        United States
                                            pattern of each frequency band. Overall, EEG reactivity was preserved in 80+-year-olds
                        Reviewed by:
                                            without dementia, and topographical patterns were described for each frequency band.
                   Ute Gschwandtner,        The application of rsEEG power as a marker for the early detection of dementia might be
                  University Hospital of
                                            less conclusive for high-agers.
                     Basel, Switzerland
          Victor Rodriguez-Gonzalez,        Keywords: aged 80 and over, EEG reactivity, resting state EEG, eyes open, eyes closed, mild cognitive impairment
         University of Valladolid, Spain

                  *Correspondence:
             Claudia Voelcker-Rehage        INTRODUCTION
              claudia.voelcker-rehage
                    @uni-muenster.de        Dementia is diagnosed due to pronounced cognitive impairments and deterioration in daily living,
                                            but pathophysiological changes in the brain usually occur before this critical stage is reached
           Received: 03 March 2021          (Sperling et al., 2011). Mild cognitive impairment (MCI), which is characterized as objective
            Accepted: 07 July 2021          cognitive deficits that are more severe than normal aging would suggest, but mild enough to not
          Published: 11 August 2021
                                            interfere with daily independence, is thought to be a precursor to dementia (Winblad et al., 2004).
                             Citation:      Older adults (OA) with MCI have a higher risk of developing dementia, particularly Alzheimer’s
    Fröhlich S, Kutz DF, Müller K and
                                            disease (AD), compared to healthy OA (Mitchell and Shiri-Feshki, 2009) and show more brain
           Voelcker-Rehage C (2021)
 Characteristics of Resting State EEG
                                            neuropathology linked to dementia in postmortem studies (Petersen et al., 2006) and in studies with
 Power in 80+-Year-Olds of Different        cerebrospinal fluid analysis (Visser et al., 2009). In longitudinal examinations, the development
                     Cognitive Status.      of patients with MCI is heterogeneous. For example, it was reported that 14% of MCI cases
  Front. Aging Neurosci. 13:675689.         reverted back to normal cognition, 35% progressed to dementia, and 51% stayed stable at the 2-year
    doi: 10.3389/fnagi.2021.675689          follow-up (Pandya et al., 2017).

Frontiers in Aging Neuroscience | www.frontiersin.org                             1                                         August 2021 | Volume 13 | Article 675689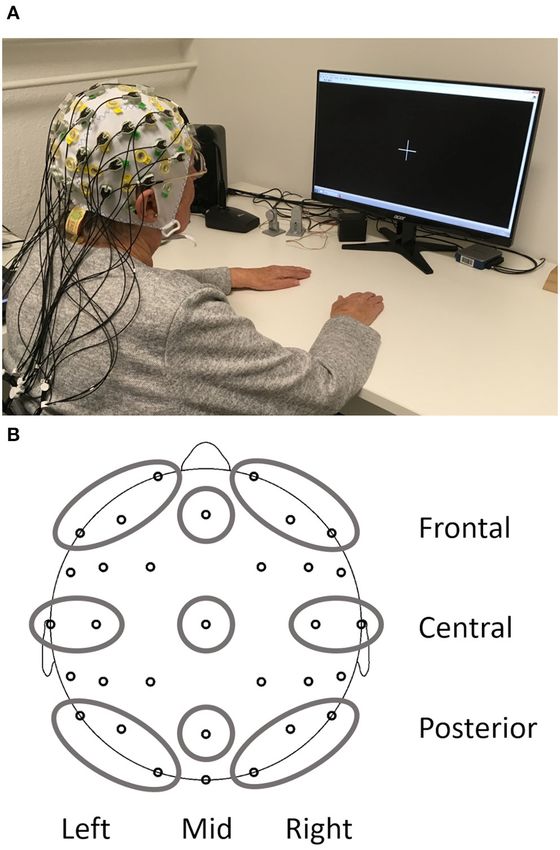
Fröhlich et al.                                                                                                   Resting State EEG of 80+-Year-Olds

    To further understand MCI and its progression to dementia,                Heterogeneity of underlying causes for MCI also means that
it is, important to study brain changes in MCI directly and                only a certain proportion of MCI cases will progress toward
to find biomarkers that better predict progression to dementia.            dementia and, therefore, might be the only ones displaying rsEEG
Resting state electroencephalogram (rsEEG) measures seem to be             patterns similar to those known in dementia. Moreover, many
especially suitable because they are easily obtained (non-invasive,        types of dementia exist with AD being the most common cause.
no special stimuli necessary, short recording time) and can                Longitudinal studies can take this into account and examine
help to understand the connectivity of brain networks (Babiloni            which EEG power parameters at the baseline best predict further
et al., 2019). Differences in rsEEG activity in eyes closed (EC)           cognitive decline or even progression to AD or other types of
conditions between healthy OA and patients with AD have been               dementia in OA with MCI. For example, posterior alpha power
shown consistently (in cross-sectional and longitudinal studies)           was reported to be smaller in progressing MCI compared with
and include decreased alpha and beta power, increased delta                stable MCI cases (age of all MCI cases at the baseline, 65.9 ± 9.6
and theta power, and changes in coherence and other functional             years) and predicted worsening of cognitive function in a 1-year
connectivity measures [for reviews, see Jeong (2004) and Babiloni          period with 75% positive predictive power (Luckhaus et al.,
et al. (2016)]. Similar results were reported for vascular dementia        2008). For a longer follow-up period of 21 months, one study has
(van Straaten et al., 2012) while frontotemporal dementia does             shown that relative alpha power, relative theta power, and mean
not show consistent differences in rsEEG compared with healthy             frequency at the temporo-occipital region in EC conditions at the
OA (Nardone et al., 2018).                                                 baseline (age at baseline, 58.2 ± 5.9 years) were the best EEG
    In contrast, only a few studies compared the rsEEG of healthy          predictors for conversion to AD (Jelic et al., 2000). Accuracy of
OA and OA with MCI during EC. The following studies all                    prediction was raised from only 70%, which was obtained with
included the frequency bands delta, theta, alpha, and beta and             MMSE as the only predictor, to 85% by adding EEG parameters
reported inconsistent results. For example, in two cross-sectional         (Jelic et al., 2000). The best choice of parameters to predict
studies from the same research group, MCI patients (age ∼72                conversion from MCI (age at the baseline, 68.7 years) to AD
years) had less alpha 1 (8–10.5 Hz) power and stronger delta               over a 2-year follow-up period obtained by data mining from
power, while no changes were present in the theta and beta                 177 EEG parameters included predominantly beta frequency
bands (Babiloni et al., 2006b, 2010). Others also reported higher          parameters and reached 88% sensitivity, 82% specificity, and 64%
delta power in MCI (age, 71.9 ± 7.9 years) compared to healthy             positive predictive value (Poil et al., 2013). The classification rates
individuals of the same age and no significant differences in              in all studies so far were not sufficient enough for diagnostic
the other frequency bands (Ya et al., 2015). Alternatively, it             application (Jelic and Kowalski, 2009; Rossini et al., 2020).
was reported that theta power was decreased in OA with mild                   Different causes for MCI also mean that subtypes of MCI
cognitive deficits (age, 70.7 ± 8.8 years) and that changes in other       should be differentiated. Most commonly, this is done by
bands were present only in further cognitively declined groups             distinguishing between amnestic (aMCI) and non-amnestic
(Prichep et al., 1994). Another study with participants of similar         (naMCI) cognitive deficits (Petersen, 2004). The aMCI is thought
age in the MCI group (72.5 ± 6.0 years) reported lower delta and           to be primarily related to AD because the relative incidence
theta band power, but no change in the faster frequency bands              of AD is significantly higher in aMCI compared with naMCI,
(Kwak, 2006). This study included comparable fewer cases of                although other outcomes, such as vascular dementia or mixed
MCI (n = 16) than all other studies mentioned, where the sample            forms, are also possible (Jungwirth et al., 2012). In addition, it
size for MCI ranged from 40 to 155 cases. In a different sample            has been shown that the amnestic subtype of MCI differs from
with a similar small MCI case amount (n = 20, age 74 ± 5 years),           the non-amnestic type and shows lower central alpha and greater
no significant differences between patients with MCI and healthy           occipital theta power at rest compared with naMCI (Babiloni
OA in the theta band were detectable, although theta power of the          et al., 2010). Magnetic resonance imaging (MRI) results also
MCI group fell in-between healthy and OA with dementia (van                support the notion that neuropathological changes are different
der Hiele et al., 2007a). In addition, it was shown that patients          in both types (Guan et al., 2017).
with MCI (mean age, 70.7 years) revealed less alpha and less                  In addition to disease-related changes, EEG oscillations at rest
beta phase-locked synchronization (measured with global field              are also subject to changes during healthy aging. Research on
synchronization instead of power), but no changes in the slower            rsEEG (mostly during EC) in healthy OA consistently reveals
frequency bands (Koenig et al., 2005).                                     changes in the alpha band, which are similar to changes found
    Taken together, no conclusive picture for the typical delta,           in AD, such as reduced power and reduced peak frequency
theta, alpha, and beta power values during rsEEG in EC condition           with increasing age (Rossini et al., 2007). For delta and theta
in the presence of MCI can be obtained from these studies. It              bands, decreases were mostly reported (Babiloni et al., 2006a;
seems that the direction of changes is comparable to findings              Gaál et al., 2010), while activity in the beta band seems to be
in dementia. However, which of these changes are earliest in               more pronounced in OA compared with young adults (Koyama
the transition toward dementia and, therefore, most common                 et al., 1997; Rossiter et al., 2014). Those changes in delta, theta,
in MCI is unclear. This might be due to the limited number of              and beta bands are in the opposite direction of those reported
studies, including preclinical stages of dementia, small sample            due to AD. Research on healthy OA as well as MCI, however,
sizes, heterogeneity in MCI classification, and heterogeneity in           has mainly been conducted within the age range of 60–80 years.
the underlying cause of MCI (Yang et al., 2019).                           Thus, there seem to be no detailed reports about topographical or

Frontiers in Aging Neuroscience | www.frontiersin.org                  2                                     August 2021 | Volume 13 | Article 675689
Fröhlich et al. Resting State EEG of 80+-Year-Olds
frequency specific EEG power characteristics in high-agers (>80 From the current state of research, it can be concluded that
years) during rest or in comparison with younger OA. further studies with adequate sample sizes are needed to better
Most studies so far only analyzed rsEEG data obtained consider healthy aging as a reference point and the transition
while eyes were closed. Studying eyes open (EO) conditions to cognitive decline (Yang et al., 2019), especially data for the
seems appropriate, considering that task-related brain activity is oldest (>80 years) are lacking for neuropsychological as well
dependent on the prior background activity (Başar and Güntekin, as neurophysiological parameters (Slavin et al., 2013). Similarly,
2012), and cognitive tasks in everyday life are usually not solved dementia research should include more of the oldest participants
in EC conditions. It has been shown that the classifications as they also make up the majority of the affected patients (Brayne
between healthy OA and MCI work better with data from EO and Davis, 2012; Richard et al., 2012).
than EC conditions (McBride et al., 2014). For example, alpha The aim of the current study was to investigate the association
activity during EO was reduced in MCI compared with healthy of EEG activity in the delta, theta, alpha, and beta bands during
OA, but alpha activity in EC was not able to discriminate between different rest conditions with the cognitive status of OA, ranging
both groups (McBride et al., 2014). Including both conditions from healthy to MCI (aMCI and naMCI). Since cognitive changes
makes it possible to study states of low and moderate vigilance in the course from healthy aging to early dementia describe a
(Babiloni et al., 2019) and to differentiate between global arousal continuum, the exact diagnostic classification of MCI is difficult
and focal activations (Barry et al., 2007). Investigating the (Petersen, 2004). This might become even more difficult with the
changes from EC to EO conditions, termed EEG reactivity, advancing age of the sample. In order to tackle this uncertainty,
might be promising as well. EEG reactivity describes the power we categorized OA into groups of different cognitive status,
difference in a frequency band between two distinct conditions taking into consideration the level of evidence of cognitive
(Klimesch, 1999). In the following, reactivity will be defined impairments (see Methods) and using the recommendations
as the difference in power between EO rest and EC rest (EO- for diagnosis of MCI in community-based samples (Petersen
EC). Findings for reactivity are often limited to the alpha band. et al., 2018). This resulted in three groups: (1) cognitively
Synchronous alpha activity observed during EC is blocked when healthy individuals (CHI) with strong evidence of no cognitive
eyes are opened, which can be easily detected in the raw data impairments, (2) possible MCI (pMCI) subjects with some
(Berger, 1929). Healthy OA showed decreased alpha reactivity evidence of cognitive impairments, and (3) MCI participants
compared with young adults (Duffy et al., 1984) or a lack of with strong evidence of cognitive impairments (Müller et al.,
reactivity at all (Gaál et al., 2010). Alpha reactivity was found 2020). The MCI group was further subdivided according to type
to be even more decreased in patients with AD compared with of cognitive deficits in aMCI and naMCI. As the prevalence
healthy OA (van der Hiele et al., 2007b; Schumacher et al., 2020). of MCI is positively correlated with age (Kryscio et al., 2006),
In a study with small samples sizes, values of the MCI group (n only high agers (participants in their eighties) were included in
= 11) were between the healthy (n = 12) and demented group (n the study to ensure a sufficient amount of MCI cases in the
= 10), but did not differ significantly from the healthy control volunteer sample. Also, this was supposed to fill the previously
group (van der Hiele et al., 2007b). Alpha reactivity was also identified gap for data from high-agers in the context of
found to be the best predictor of global cognitive performance, MCI research.
memory and language skills across all groups (van der Hiele et al., The main objective was to find out if the rsEEG of 80+-year-
2007b). olds with MCI (pMCI, aMCI, and naMCI) differed significantly
Recently, Barry and De Blasio (2017) have published rsEEG from healthy individuals of the same age. Therefore, differences
data for young adults (age, 20.4; range, 18.8–25.6 years) and between groups in mean absolute and mean relative power of
OA (age, 68.2; range, 59.8–74.8 years), which looked in detail the delta, theta, alpha, and beta bands were studied for EO, EC,
at the topographical characteristics of each frequency band and and reactivity (EO–EC). It was expected that, similar to findings
the changes from EC to EO conditions (reactivity) not only in younger samples of MCI and samples of patients with AD,
in the alpha frequency but also in the delta, theta, and beta MCI would have lower alpha and beta power and stronger delta
bands. Across both groups, delta and theta power in EO and and theta power during EC. In the EO condition, alpha power
EC were midline dominant with a maximum at the vertex was expected to decrease in the MCI groups, while, for the
and a bias toward the right hemisphere (Barry and De Blasio, other bands, no specific predictions could be made according to
2017). For the alpha band, the well-known posterior dominance prior findings. Alpha reactivity was predicted to be smaller in
was reported, and power in the right hemisphere was stronger the MCI groups, while no predictions were made for the other
compared with the left. Activation in the beta band showed frequency bands.
centroparietal dominance. For young adults, changes from EO
to EC included the overall reduction in power for delta, theta,
alpha, and beta bands and a focal frontal increase in the beta METHODS
frequency (Barry et al., 2007). A similar pattern was found
in healthy OA, indicating that the EEG reactivity for delta, This study is part of the SENDA study (Sensor-based systems for
theta, alpha, and beta is maintained in healthy aging (Barry early detection of dementia, registered in the German Clinical
and De Blasio, 2017). No further studies exist that investigated Trials Register under DRKS00013167), which was conducted
EEG reactivity in other frequency bands than alpha in MCI at Chemnitz University of Technology, Germany. The detailed
or dementia. study protocol was published earlier by Müller et al. (2020). Only
Frontiers in Aging Neuroscience | www.frontiersin.org 3 August 2021 | Volume 13 | Article 675689Fröhlich et al. Resting State EEG of 80+-Year-Olds
TABLE 1 | Characteristics of the total sample and groups according to cognitive status.
Total CHI pMCI naMCI aMCI
N (in %) 213 (100) 72 (34) 80 (38) 17 (8) 44 (21)
m/f 109/104 32/40 43/37 12/5 22/22
Age in years M (SD) 82.5 (2.4) 82.1 (2.4) 82.5 (2.1) 83.2 (3.1) 83.0 (2.7)
Education in years M (SD) 14.0 (3.2) 14.4 (3.4) 14.0 (3.3) 14.3 (3.2) 13.3 (2.7)
MoCA (0–30) M (SD) 25.6 (2.6) 27.8 (1.2) 25.8 (2.1) 22.8 (1.6) 22.8 (1.7) *a
Handedness (-100–100) M (SD) 83.3 (38.2) 89.1 (24.4) 81.9 (41.6) 78.2 (39.5) 81.5 (42.6)
GDS Score (0–15) M (SD) 2.8 (2.0) 2.6 (1.9) 2.6 (1.8) 3.6 (2.7) 3.4 (2.1)
NAA Score (20–60) M (SD) 26.3 (3.4) 25.3 (2.7) 25.9 (3.3) 29.5 (4.5) 27.9 (3.0) *b
CHI, cognitively healthy individuals; pMCI, possible mild cognitive impairment; naMCI, non-amnestic MCI; aMCI, amnestic MCI; MoCA, Montreal Cognitive Assessment; GDS, Geriatric
Depression Scale; NAA, Nürnberger-Alters-Alltagsaktivititäten-Skala (Nuremberg Gerontopsychological Rating Scale for Activities of Daily Living).
*p < 0.05.
a Post-hoc Dunn Bonferroni test showed: CHI > pMCI > naMCI = aMCI.
b Post-hoc Dunn Bonferroni test showed: CHI = pMCI< naMCI = aMCI.
information relevant to the current research question will be reduction, stomach acid reduction, and thyroid function. There
described here. were 15 participants taking medication, which might have
influenced EEG activity, such as tricyclic antidepressants (n = 6),
Participants antipsychotics (n = 2), Parkinson medication (n = 2), anti-
The SENDA study sample included 244 participants (123 males; dementia medication (n = 2), and benzodiazepines (n = 5,
age, 79–93 years; M = 82.5; SD = 2.5), which were recruited prescribed for sporadic, not regular use, according to medication
from January 2018 to March 2020. Study participation required plans). These cases were distributed across all four groups (CHI:
walking ability, sufficient German language skills, residence in 3, pMCI: 4, naMCI: 5, and aMCI: 3). Conducting the following
or around Chemnitz, Germany, and self-organized means of analysis without these cases did not result in any differences, and
travel to and from the laboratory. Volunteers were excluded we, therefore, did not remove them from the sample.
before testing if any of the following criteria applied: (1) acute
psychological disorder; (2) diagnosis of any neurocognitive Neuropsychological Testing and MCI
or neurological disorder; (3) past traumatic head injury; (4) Classification
substance abuse; (5) participation in other clinical studies; (6) All the participants went through an intensive
a physician-directed ban from physical activities; (7) severe neuropsychological test battery, which was carried out from
restrictions due to cardiovascular, pulmonary, or orthopedic trained testing staff at the University lab. This included the
diseases; (8) or failure to reach the minimum required score of German version of the MoCA (Nasreddine et al., 2005) and the
19 during screening with the Montreal Cognitive Assessment German version of the Consortium to Establish a Registry for
(MoCA, Nasreddine et al., 2005). Each participant signed a Alzheimer’s Disease Neuropsychological Test Battery (Morris
written informed consent, and all study proceedings were et al., 1989; Memory Clinic Basel, 2005; CERAD-NP). The
approved by the Ethics Committee of Chemnitz University MoCA was used to measure global cognitive functioning and to
of Technology, Germany, Faculty of Behavioral and Social screen for MCI. It is the second most utilized geriatric cognitive
Sciences (V232-17-KM-SENDA-07112017, approved on screening tool after the mini mental status examination but
19.12.2017). Each participant received 25 e compensation for has superior sensitivity to mild cognitive impairments (Breton
his or her participation at three appointments. This included et al., 2019). The CERAD-NP examines the cognitive domains
neuropsychological testing (part of first appointment) and EEG memory, language, executive functions, and visuo-construction.
recordings (part of the second appointment). In addition, information about the level of education (overall
The analysis for this article included 213 participants. years of education) and handedness [a laterality quotient
Exclusion from analysis was due to (1) dropout from the according to Oldfield (1971)] was obtained. The participants
study before all needed testing was completed (n = 17), (2) completed additional questionnaires at home, which included,
signs of severe depressive symptoms [Geriatric Depression among others, the Nürnberger-Alters-Alltagsaktivititäten-Skala
Scale (Gauggel and Birkner, 1999) short version > 8, n = (NAA; Nuremberg Gerontopsychological Rating Scale for
9], (3) technical issues during the EEG recording, (n = 4), Activities of Daily Living; Oswald and Fleischmann, 1995) to
(4) and falling asleep during EEG recording (n = 1). measure basic and instrumental activities of daily living as well
Demographic characteristics are reported in Table 1. In addition, as the German short version of the Geriatric Depression Scale
the participants reported their medication regimens. Due to (GDS; Gauggel and Birkner, 1999) to screen for depressive
the old age of the participants, many of them were following symptoms. The GDS was used to exclude individuals from the
a medication regimen, which most often included medication analysis (GDS > 8) to prevent the inclusion of undetected cases
for high blood pressure, thrombosis prophylaxis, cholesterol of major depression and also as a covariate.
Frontiers in Aging Neuroscience | www.frontiersin.org 4 August 2021 | Volume 13 | Article 675689Fröhlich et al. Resting State EEG of 80+-Year-Olds
MCI classification was based on the recommendations of The score ( 25)
proposed by Petersen et al. (2014). These criteria are also part nor in-depth clinical testing after abnormal testing revealed any
of the Diagnostic and Statistical Manual of Mental Disorders cognitive impairments, we opted to separately analyze this group
(5th ed.; DSM-5; American Psychiatric Association, 2013) for to have high discriminatory power between CHI and MCI.
the diagnosis of mild neurocognitive disorders. The criteria General independence (criteria 3) was presumed for all
were: (1) self—or informant report of cognitive complaints, the participants because we only included community-dwelling
(2) impairments in at least one cognitive domain while taking volunteers in this study. This was further confirmed by the NAA
into consideration age and education, (3) general independence scores, which were below 39 for all individuals and fell within a
in daily activities, and (4) no dementia. Cognitive complaints normal range for this age group (Oswald and Fleischmann, 1995).
(criteria 1) were not included as a criterion of MCI here No dementia (criteria 4) was also ensured due to the exclusion
because there is no consensus on inclusion or operationalization criteria described before.
(Mitchell, 2008). Subjective complaints also seem to be far less
relevant for the prediction of dementia in community-based
samples like ours compared with the participants in memory
EEG Recordings
The actiCHamp system (Brain Products GmbH, Gilching,
clinics (Snitz et al., 2018). In addition, we found subjective
Germany) was used to record 32 active EEG electrodes positioned
complaints to be very common in this age group. In a subgroup of
according to the international 10–20 system (Fp1, Fp2, F7, F3,
our sample (n = 136), 65% of the participants reported memory
Fz, F4, F8, FC5, FC3, FC1, FC2, FC4, FC6, T7, C3, Cz, C4, T8,
complaints when asked to compare their memory performance 5
CP5, CP3, CP1, CP2, CP4, CP6, P7, P3, Pz, P4, P8, O1, Oz, and
years prior.
O2). The setup included a forehead ground electrode at Fpz and
Cognitive impairments (criteria 2) were determined according
an online reference electrode at Fz. All data were acquired with
to performance in MoCA (one sum score) and CERAD-NP
a 500 Hz sampling rate and 24-bit resolution. The electrode-skin
(nine separate test scores). The following CERAD-NP scores
impedance was kept below 25 k.
were used: verbal fluency (number of animals named in 1 min),
The EEG recording during rest only made up a small part of
Boston naming test (number of objects correctly identified),
the complete testing on the day and always took place after gait
phonematic fluency (number of words named with letter “S”
analysis and prior to fine motor testing. Rest periods were offered
in 1 min), constructional praxis (number of correctly copied
during the whole procedure, and all the participants had received
characteristics), word list learning (number of words correctly
a short break prior to EEG recording. EEG measurements took
remembered in third trial), word list recall (savings score), word
place in an electrically shielded and darkened room. To minimize
list recognition (discriminability score), constructional praxis
EEG artifacts and distractions for the subject, all instructions
recall (savings score), and trail making test (quotient B/A). We
were given from an adjacent room via a microphone and a
followed a two-step procedure that is recommended for diagnosis
monitor. The participants sat relaxed, with their backs leaned
of MCI in the general population, which states that, first, a
against the back rest and both hands rested comfortably on the
screening should be used, and, in case of abnormal findings,
table in front of them (see Figure 1A for a photo of the complete
in-depth cognitive testing should follow (Petersen et al., 2018).
setup). They looked at a white fixation cross at the center of a
A MoCA score below 26 points and at least one CERAD-NP
black screen for 4 min (condition EO) and, afterwards, closed
performance below 1.5 standard deviations of the normative
their eyes for 2 min (condition EC). The level of consciousness
mean (taking into consideration age, sex, and education level)
the subject was monitored to annotate changes and other artifacts
resulted in the classification of mild cognitive impairment (MCI).
in the EEG protocol.
Correspondingly, the participants were classified as being healthy
(CHI) if they scored 26 or more points on the MoCA and also
within the normative range (no score below −1.5 SD) in all of Preprocessing of EEG Data
the CERAD-NP scores. Out of the participants classified as MCI, BrainVision Analyzer 2.2 (Brain Products GmbH, Gilching,
amnestic cases (aMCI) were distinguished by deficits in at least Germany) was used for all preprocessing steps. Data were
one of the memory tests (word list learning, word list recall, word filtered (phase shift-free Butterworth infinite impulse response
list recognition, and constructional praxis recall). Accordingly, filter, 1–70 Hz, slope 48 dB/Hz), notch filtered (50 Hz), and
non-amnestic cases (naMCI) presented with deficits only in the down sampled from 500 to 256 Hz. In addition, blink artifacts
other non-memory tests. Due to the application of the two- in the rest condition EO were removed via Independent
step process, an additional class was defined for the participants Component Analysis (Jung et al., 1998) with Fp1 as the reference
who showed cognitive impairments only according to one of channel for vertical eye movements. Continuous EEG data were
the two tests. They were categorized as possibly having MCI then common average re-referenced and segmented into 2-s
(pMCI). This group either included the participants who had epochs for an automatic artifact rejection. Epochs were rejected
deficits in one specific domain of the CERAD-NP, but, overall, from further analysis if at least one channel included voltage
cognitive functioning was normal according to MoCA or the steps >25 µV/ms or if the difference between minimal and
participants that had no strong impairment in any single domain, maximal absolute voltage recorded exceeded 200 µV in any 200
but small deficits in different domains added up to a low MoCA ms interval.
Frontiers in Aging Neuroscience | www.frontiersin.org 5 August 2021 | Volume 13 | Article 675689Fröhlich et al. Resting State EEG of 80+-Year-Olds
right frontal (Fp2, F4, and F8), left central (T7 and C3), mid
central (Cz), right central (T8 and C4), left posterior (P7, P3,
and O1), mid posterior (Pz), and right posterior (P8, P4, and
O2). Reactivity for absolute and relative power was calculated
separately for each frequency band as the difference between EO
and EC (log power EO- log power EC) for each ROI.
In addition, from the same spectrum (relative power, EC
condition, 30 s), we also obtained the individual alpha frequency
(IAF) for each person. All electrodes of the posterior region (P7,
P3, O1, Pz, P8, P4, and O2) were averaged, and the frequency
of the maximum value in the alpha band was extracted with
the MinMax Marker Solution (BrainVision Analyzer 2.2). Six
participants were not included in this analysis because they did
not show clear peaks in the alpha range. This was indicated by
the values of the detected peak being less than 1.96 standard
deviations above the mean value of the alpha range. Visual
inspection of the cases indicated either absence of a peak or a
peak in the theta range.
Statistical Analysis
IBM SPSS Statistics Version 27 (IBM Corp., Armonk, NY, USA)
was used for all statistical analysis. P-values < 0.05 were regarded
as significant and p-values < 0.10 as a trend unless they had to be
adjusted for multiple testing. Effect sizes were reported as partial
eta squares (η2p ). As variables were not normally distributed,
Kruskal–Wallis tests were used to test if covariates age, education,
and depressive symptoms differed between groups. A chi-square
test was used to test if sex and group distributions were
independent. No significant differences between groups emerged
for any of the covariates, which means that potential effects of
cognitive status on EEG parameters should not be due to sex, age,
and education confounding with the group classification.
First, absolute power data were pre-analyzed in order to check
FIGURE 1 | Setup of the resting state EEG measurements (A) and depiction if reactivity was still preserved in the sample of high-agers. For
of the nine regions of interest obtained from the EEG (B). this purpose, a 2 × 3 × 3 × 4 mixed-design ANOVA was carried
out with the three within-subject factors rest condition (EO, EC),
sagittal (left, mid, and right) and coronal (frontal, central, and
posterior) as well as one between-subject factor group (CHI,
At each electrode absolute power (in µV²) and relative power pMCI, naMCI, and aMCI), and the main effect of rest condition
(in %, relative to the total power of the spectrum 1–24 Hz) was was reported for each frequency band.
calculated with a Fast Fourier Transform algorithm for each All the following analyses were run with sex as covariate.
2s epoch resulting in 0.5 Hz resolution. A Hanning window Age and education in years were not included as covariates
(length 10%) and variance correction were applied to correct because there was no significant relationship with any of the
for spectral leakage. Mean absolute power and mean relative EEG parameters, and their inclusion did not improve variance
power were obtained by averaging 15 artifact-free segments for explanation. One-way analysis of covariance (ANCOVA) was
30 s after the start of the condition. One participant did not used to test for differences in IAF between groups. Next, six
have enough artifact free segments for the EO and another 3 × 3 × 4 mixed-design ANCOVAs were carried out with
participant for the EC condition. Therefore, EO and EC analyses the dependent variables (1) absolute EC power, (2) absolute
were carried out with N = 212 and the reactivity analysis with EC power, (3) absolute power reactivity, (4) relative EO
N = 211. Frequency bands included delta (1–3.5 Hz), theta (4– power, (5) relative EO power, and (6) relative power reactivity,
7.5 Hz), alpha (8–13 Hz), and beta (13.5–24 Hz). All data were respectively. Each ANCOVA included two within-subject factors
log-transformed (base 10) to obtain normal distribution and sagittal (left, mid, and right) and coronal (frontal, central, and
variance homogeneity before calculation of regions of interest posterior) as well as one between-subject factor group (CHI,
(ROI) based on Barry and De Blasio (2017). The combination pMCI, naMCI, and aMCI) to find differences between groups
of three sagittal planes (left, mid, and right) and three coronal and topography. Greenhouse-Geisser adjustments were reported
planes (frontal, central, and posterior) resulted in nine different whenever sphericity assumptions were violated. To control for
ROIs (Figure 1B): left frontal (Fp1, F3, and F7), mid frontal (Fz), multiple testing within each frequency band (three tests for
Frontiers in Aging Neuroscience | www.frontiersin.org 6 August 2021 | Volume 13 | Article 675689Fröhlich et al. Resting State EEG of 80+-Year-Olds
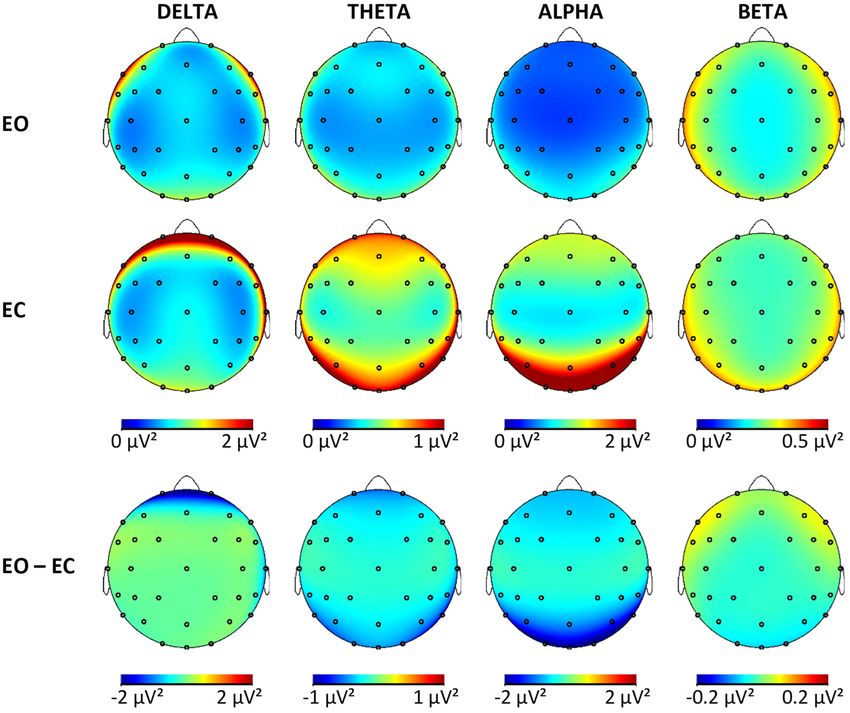
FIGURE 2 | Brain maps showing the mean absolute power in µV² for all frequency bands in both conditions and the difference maps. EO, eyes open; EC, eyes closed.
absolute power and three tests for relative power), the Bonferroni theta [F (1,207) = 144.4, p < 0.001, ηp ² = 0.41], alpha [F (1,207) =
adjusted alpha level of 0.017 was used. Last, the directions of 275.3, p < 0.001, ηp ² = 0.57], and beta bands [F (1,207) = 6.6, p =
the significant main and interaction effects from the 3 × 3 × 0.01, ηp ² = 0.03].
4 ANCOVAs were determined via contrast analysis to describe
the topography in more detail. For the coronal factor, two Cognitive Status
contrasts were used: comparing frontal with posterior (F – P) Classification of participants in the four groups (CHI, pMCI,
and comparing the mean of frontal and posterior against the aMCI, and naMCI) according to the introduced criteria resulted
central ROI (F/P – C). Similarly, two contrasts were included in 72 CHI, 80 pMCI, 17 naMCI, and 44 aMCI cases (Table 1).
for the sagittal factor: comparing left with right (L – R) and The four groups differed significantly according to problems with
comparing the mean of left and right with the mid ROI (L/R – M). daily activities measured with the NAA (CHI = pMCI< aMCI =
Again, Bonferroni adjusted alpha levels were used to control for naMCI). The IAF was fastest in the healthy group (M = 9.3 Hz,
testing multiple contrasts within one effect (main effects: 0.025 SD = 1.1) compared with the groups with cognitive impairments
interaction effect: 0.0125). Only significant effects are reported in (pMCI: M = 9.0 Hz, SD = 0.8, naMCI: M = 9.1 Hz, SD = 0.8,
the text unless stated otherwise. aMCI: M = 9, SD = 0.8). These differences were not significant
[F (3,206) = 1.6, p = 0.19, ηp ² = 0.02].
RESULTS Tables with log-transformed absolute power values for
each frequency band, group, and ROI are available in the
Reactivity Supplementary Material. Results of the mixed ANCOVA for
Results from the 2 × 3 × 3 × 4 mixed-design ANOVA indicated each frequency band for the outcome variables (power EC,
a significant reduction in absolute power from EC to EO across power EC, and reactivity) revealed no significant group effects
the whole sample in delta [F (1,207) = 30, p < 0.001, ηp ² = 0.13], or interactions involving the factor group for neither absolute
Frontiers in Aging Neuroscience | www.frontiersin.org 7 August 2021 | Volume 13 | Article 675689Fröhlich et al. Resting State EEG of 80+-Year-Olds
nor relative power analysis. The p-values for these nonsignificant Topography of Reactivity
effects ranged from p = 0.05 to p = 0.90 (with effect sizes Topographical differences in reactivity were apparent in
between ηp ² = 0.00 and ηp ² = 0.04) for absolute power and the descriptive reactivity data (Supplementary Material)
p = 0.02 to p = 0.98 (with effect sizes between ηp ² = 0.01 and were confirmed by the contrast analysis (Table 4).
and ηp ² = 0.04) for relative power. In this sample, the rsEEG When interpreting the direction of effects, the sign of the
activity in the four frequency bands did not differ significantly reactivity values must be considered. When comparing
according to the cognitive status of the participants when using two negative values, the smaller value is the more negative
absolute or relative power values. As no differences between value and, therefore, indicates the larger change from EC
groups were established, all the participants were pooled together to EO.
to obtain brain maps from the non-transformed absolute power For the delta band, the pattern of reactivity resembled that of
values (Figure 2) for each frequency band and condition for this the EC condition, which means that the greatest changes from EC
sample of OA to illustrate the topographies. The maps for each to EO were present in the areas with the most delta activity during
group separately are available in the Supplementary Material. EC [F < P; F/P < C; L/R < M × F > P; L/R < M × F/P > C].
In the whole sample, the effects were significant for the For the theta, band reactivity was less pronounced in the central
sagittal factor, the coronal factor, and the interaction between regions (F/P < C), specifically the left and right hemispheres
sagittal and coronal for all frequency bands and absolute (L/R > M × F/P < C), which were also the regions with less
power outcomes. The topographical effects will be looked at theta activity in EO and EC. In the alpha band, once again,
in more detail in the following sections only for absolute reactivity was more pronounced in the right compared with the
power. Relative power values are especially useful to control for left hemisphere (L > R), which explained the change from a
person-specific confounding variables, which are less relevant right hemispheric bias during EC to a significant left hemispheric
to within-subject effects. In addition, differences in relative bias during EO. Further considerations of interactions actually
power are less clear to interpret because they can be caused showed that this was only the case in the posterior but not
by changes in the studied frequency band or changes in any the frontal region (L > R × F < P). The change from EC to
of the other bands used in normalization. The results from EO in alpha power was greater in the midline compared with
the topographical analysis of relative power are available in the hemispheres (L/R > M), especially so in the frontal regions (L/R
Supplementary Material. > M × F > P). Reactivity was strongest in the posterior region
and least pronounced in the central regions (F > P, F/P < C),
which reproduces the pattern of alpha activity during EC. In
Topography During EC the beta band, reactivity was more pronounced in the midline
The complete results of the contrast analysis can be seen
compared with the hemisphere (L/R > M) and in the posterior
in Table 2. For all frequency, bands activity was significantly
compared with frontal regions (F > P). This is related to the
smaller at the midline compared to hemispheres (L/R > M).
fact that beta activity in the hemispheres is increasing in the left
There was no effect of lateralization in any of the frequency
and right frontal regions while it is decreasing with the opening
bands (L = R). Both alpha and beta were dominant in the
of eyes in the other regions (L/R > M × F > P). This focal
posterior regions (F < P), while delta band was dominant in
frontoparietal activity with opening the eyes can also be seen in
the frontal region (F > P). For the delta, theta, and alpha
Figure 2 (last column).
bands, central activity was less pronounced compared with the
mean activity from frontal and posterior (F/P > C). In the
delta band, the difference between midline and hemispheres
was more pronounced frontally compared with the posterior DISCUSSION
regions (L/R > M × F > P). For all other bands, this was
In this study, the synchronized activity at rest while eyes are
reversed with stronger differences between midline compared
open and closed in the classical broad bands delta, theta,
with L/R in the posterior regions instead of frontal regions (L/R
alpha, and beta was compared between cognitively healthy
> M × F < P). Although no global effect of lateralization
OA and individuals with MCI of the same age. The sample
was obtained in the alpha band, there was more pronounced
included OA, 80 years or older, which are often not enough
activity in the right hemisphere of the posterior region (L <
represented in studies on early detection of dementia. Groups
R × F < P). The smallest power values for theta and delta
were compared with respect to mean absolute power, relative
were obtained from the mid-central regions (L/R > M × F/P
power, and reactivity to eyes opening separately in each band.
> C).
No significant differences between any of the groups of different
cognitive status (CHI, pMCI, naMCI, and aMCI) were detected.
Topography During EO Overall, specific topographical patterns were present, which will
The topography during the EO was very similar to EC be compared with results from other age groups later. In addition,
topography (Tables 2, 3). The only differences pertained to EEG reactivity was also present in each of the four frequency
lateralization, where theta and alpha both showed greater bands with overall greater power during EC compared with EO
power in the left compared with the right hemisphere (L > and a few focal increases in the beta band. The topography of
R) and no differences in lateralization between frontal and reactivity for the most part related to the topography found in
posterior regions. the EC condition.
Frontiers in Aging Neuroscience | www.frontiersin.org 8 August 2021 | Volume 13 | Article 675689Fröhlich et al. Resting State EEG of 80+-Year-Olds
TABLE 2 | Results of the contrast analysis in each frequency band for absolute power (log-transformed) at rest with eyes closed.
Delta Theta Alpha Beta
F p ηp ² F p ηp ² F p ηp ² F p ηp ²
Main Effects (adj. α-level = 0.025)
L>R 4.1 0.04 0.02 1.9 0.18 0.01 1.1 0.129 0.01 0.0 0.89 0.00
L/R > M 266.5 R × F > P is the same as L < R × F < P). L, left; R, right; M, midline; F, frontal; P, posterior; C, central. Significant
results are printed in bold.
TABLE 3 | Results of the contrast analysis in each frequency band for absolute power (log-transformed) at rest with eyes open.
Delta Theta Alpha Beta
F p ηp ² F p ηp ² F p ηp ² F p ηp ²
Main Effects (adj. α-level = 0.025)
L>R 3.6 0.06 0.02 6.1 0.02 0.03 11.4 0.001 0.05 1.7 0.18 0.01
L/R > M 158.6 P 24.1 P is L < R × F > P). Changing the direction
of both directional indicators within a single effect is equivalent (i.e., L > R × F > P is the same as L < R × F < P). L, left; R, right; M, midline; F, frontal; P, posterior; C, central. Significant
results are printed in bold.
TABLE 4 | Results of the contrast analysis in each frequency band for reactivity (difference of log-transformed absolute power).
Delta Theta Alpha Beta
F p ηp ² F p ηp ² F p ηp ² F p ηp ²
Main Effects (adj. α-level = 0.025)
L>R 21.8 M 9.1 0.003 0.04 18.7 P 18.0 M x F > P 11.5 0.001 0.05 2.83 0.09 0.00 30.6 M x F/P > C 8.9 0.003 0.04 8.0 0.01 0.04 28.3 R × F > P is L < R × F > P). Changing the direction
of both directional indicators within a single effect is equivalent (i.e., L > R × F > P is the same as L < R × F < P). L, left; R, right; M, midline; F, frontal; P, posterior; C, central. Significant
results are printed in bold.
Frontiers in Aging Neuroscience | www.frontiersin.org 9 August 2021 | Volume 13 | Article 675689Fröhlich et al. Resting State EEG of 80+-Year-Olds
No significant differences between any of the groups of values found in a prior study (Hübner et al., 2018) with younger
different cognitive status were found in IAF or resting state power OA (67–83 years).
in EC, and, therefore, it can be concluded that the absolute and The different groups of cognitive status were also compared
relative power distributions were similar in each of the four with regard to resting state power while EO and reactivity
groups (CHI, pMCI, naMCI, and aMCI) for this condition. Thus, (change from EC to EO). Although it had been shown
the hypotheses that MCI is characterized by lower alpha and before that EO conditions might be better suitable to detect
beta power as well as stronger delta and theta power during EC EEG changes in MCI (McBride et al., 2014), this was not
could not be confirmed in our sample. This is not in complete replicated here. The present results indicated no differences
agreement with prior findings of changes in the rsEEG in patients in resting state power with EO or reactivity according to
with MCI. For the rest with EC, it was shown that alpha and cognitive status in any of the frequency bands. Thus, the
beta powers were reduced and theta and delta powers were either hypothesis that MCI is characterized by reductions in alpha
elevated or reduced in MCI compared with healthy OA (Koenig power during EO and reduced reactivity in the alpha band
et al., 2005; Babiloni et al., 2006b, 2010; Kwak, 2006; Ya et al., was not confirmed. In addition, for the first time, analysis of
2015). In fact, when specifying former studies, each study only reactivity was not restricted to the alpha band and included
showed some of the listed changes, but the overlap between also delta, theta, and beta bands. Group comparisons showed
results was often not great even though similar parameters that reactivity in the other bands was also not related to
were studied. cognitive status.
One might assume that the lack of significant differences In addition, we studied the topography and reactivity of each
between MCI and healthy participants in our study was caused frequency band without taking into consideration the cognitive
by an unsuitable resting state measurement protocol. This seems status of the participants to generate knowledge about the rsEEG
to be rejectable as the protocol was very comparable to the ones in a group of non-demented high-agers. The topography of the
used in other MCI and dementia studies (e.g., Alexander et al., slower bands (delta and theta) was described with maximal power
2006; van der Hiele et al., 2007b; Gaál et al., 2010; Toth et al., at the vertex in both rest conditions in healthy OA in prior studies
2014). (Barry and De Blasio, 2017). This topography was not replicated
One major difference between the current findings and that here, as delta power showed frontal dominance with the smallest
of other studies was the overall older age (mean, 82.5 years) power at the vertex. Theta power was also smallest in the central
of the participants. The average age of most study samples was regions. It is unclear why these differences arise and if a small
∼10–20 years below that of the present sample [e.g., 62 years sample size of prior studies, EEG setup or artifacts could be the
(Koenig et al., 2005), 68 years (Barry and De Blasio, 2017), and cause of this. As this pattern was especially pronounced during
72 years (Babiloni et al., 2006b)]. In addition, the number of EC condition, which typically shows very little frontal artifacts
rsEEG studies in this age group is very limited, which means that such as blinking, this should not be the reason. Other studies with
there is limited knowledge of the typical rsEEG in MCI, but it is young participants actually reported a very similar pattern with
also unclear how the rsEEG activity of healthy high-agers looks. prefrontal dominance of delta power (Barry et al., 2007; Chen
Some aging-related changes in the rsEEG, like the reduction in et al., 2008).
alpha power, are probably similar in the aging process and the For the alpha band, topography was similar and, as expected,
neuropathological process of dementia (Rossini et al., 2007), and, showed strongest alpha power in the posterior ROI and smallest
therefore, it might be harder to differentiate between healthy power values centrally. A right hemisphere bias was present in
but far advanced aging and early neuropathological changes. the alpha band during EC conditions and a left hemisphere bias
Postmortem studies also showed that dementia pathology, such in the alpha and theta bands during EO, while, for all other
as neuritic plaques, diffuse plaques, and neurofibrillary tangles bands and conditions, no hemispherical differences were found.
can be found in healthy OA without signs of dementia or In comparison, younger adults showed a right hemisphere bias
MCI during their lifetime (Bennett et al., 2006). In general, the across all frequency bands during rest (EO and EC), which is
overlap in neuropathology between healthy and individuals with assumed to arise from the dominance of the left hemisphere in
dementia seems to increase with age (Richard et al., 2012). Taken right-handed participants (Simon-Dack et al., 2013; Barry and
all together, this suggests that the cognitive status of high-agers as De Blasio, 2017). This difference between our sample and results
determined by neuropsychological testing might not necessarily from younger OA confirms many findings of age-related neural
represent the underlying neurophysiological state. dedifferentiation (Koen and Rugg, 2019).
For EEG measurements, it must also be considered that aging The changes in band power due to eyes opening, in general,
can cause anatomical changes that can dampen the measurable resembled what has been shown in younger adults. Reactivity
EEG signal. It has been shown that cortical thinning with aging was present in all bands and showed the typical pattern of overall
results in smaller measurable EEG amplitudes and that power decreased power in all bands, and only focal frontal increases in
differences between different age groups can be explained by the beta band in EO (Barry and De Blasio, 2017). Even in high-
including cortical thickness into the analysis (Provencher et al., agers, reactivity is maintained in all frequency bands, showing
2016). As a consequence, it might be statistically problematic to intact regulation of arousal and vigilance in the different resting
detect differences if the baseline level of power is very low. On state conditions. The exact topographical pattern for delta, theta,
average, this is not the case in the current sample. The power and alpha bands related to the observed EC pattern in each band,
values at rest with EO in the present data set are comparable with meaning the difference EO – EC was the strongest in ROIs that
Frontiers in Aging Neuroscience | www.frontiersin.org 10 August 2021 | Volume 13 | Article 675689Fröhlich et al. Resting State EEG of 80+-Year-Olds
showed the most activity during EC (delta: frontal, theta: frontal (Koenig et al., 2005; Babiloni et al., 2006b, 2010; Kwak, 2006; Ya
and posterior, alpha: posterior). et al., 2015). They were now applied to a high-ager sample to
study their usefulness in terms of early detection of dementia
Limitations in such age groups. It is possible that early changes in resting
Some limitations of this study must be considered. First, all the state networks are better found with other or more advanced
participants were volunteers, without symptoms of dementia and analysis methods. For example, measures of complexity (i.e.,
no need to live in a nursing home. These constraints resulted in frequency or time domain entropy) or functional connectivity
the sample having a bias toward comparatively healthy and well- (i.e., coherence, phase lag index, and synchronization likelihood,
educated individuals. Education could be an influencing factor, and others) are able to extract different information from the
because it is known as a proxy of a cognitive reserve, and it can signals of resting state networks than absolute and relative
impact the relationship between brain changes and performance power can (Babiloni et al., 2019). Signal complexity seems to
measured in neuropsychological testing (Liu et al., 2013). This be reduced in MCI compared with healthy OA, although there
should not influence the present results because the groups did are only few studies, including MCI, in addition to AD cases
not differ in their levels of education. (Sun et al., 2020). Functional connectivity in MCI has been
In addition, one might assume that the MCI cases found in reported both as increased or decreased compared with healthy
this sample were mostly very mild and far from the progression OA (Lejko et al., 2020). This might be due to pathophysiological
to dementia. However, the range of MoCA scores (19–25) as well as compensational processes present in MCI (Lejko et al.,
and the deficits found in CERAD-NP scores (Fröhlich et al. Resting State EEG of 80+-Year-Olds
Requests to access the datasets should be directed to Claudia resources, writing review and editing, and supervision.
Voelcker-Rehage, (claudia.voelcker-rehage@uni-muenster.de). All authors contributed to the article and approved the
submitted version.
ETHICS STATEMENT
FUNDING
The studies involving human participants were reviewed and
approved by Ethics Committee of the Chemnitz University of This work was supported by the European Social Fund for
Technology, Faculty of Behavioral and Social Sciences (number Germany and the Sächsische Aufbaubank-Förderbank (SAB) of
V-232-17-KM-SENDA-07112017). The patients/participants the Free State of Saxony (Grant No. 100310502). This funding
provided their written informed consent to participate in source had no role in the study design, in the collection, analysis,
this study. and interpretation of data, or in the writing of the report. We
acknowledge support from the Open Access Publication Fund of
AUTHOR CONTRIBUTIONS the University of Münster.
SF: investigation, data curation, formal analysis, writing— SUPPLEMENTARY MATERIAL
original draft, and visualization. DK: conceptualization,
writing review and editing, and supervision. KM: project The Supplementary Material for this article can be found
administration, investigation, data curation, and writing review online at: https://www.frontiersin.org/articles/10.3389/fnagi.
and editing. CV-R: conceptualization, funding acquisition, 2021.675689/full#supplementary-material
REFERENCES Başar, E., and Güntekin, B. (2012). A short review of alpha activity in cognitive
processes and in cognitive impairment. Int. J. Psychophysiol. 86, 25–38.
Albert, M. S., DeKosky, S. T., Dickson, D., Dubois, B., Feldman, H. H., Fox, doi: 10.1016/j.ijpsycho.2012.07.001
N. C., et al. (2011). The diagnosis of mild cognitive impairment due to Bennett, D. A., Schneider, J. A., Arvanitakis, Z., Kelly, J. F., Aggarwal, N. T.,
Alzheimer’s disease: recommendations from the National Institute on Aging- Shah, R. C., et al. (2006). Neuropathology of older persons without cognitive
Alzheimer’s Association workgroups on diagnostic guidelines for Alzheimer’s impairment from two community-based studies. Neurology 66, 1837–1844.
disease. Alzheimers Dement. 7, 270–279. doi: 10.1016/j.jalz.2011.03.008 doi: 10.1212/01.wnl.0000219668.47116.e6
Alexander, D. M., Arns, M. W., Paul, R. H., Rowe, D. L., Cooper, N., Berger, H. (1929). Über das Elektroenkephalogramm des Menschen. Arch.
Esser, A. H., et al. (2006). EEG markers for cognitive decline in elderly Psychiatr. Nervenkr. 87, 527–570. doi: 10.1007/BF01797193
subjects with subjective memory complaints. J. Integr. Neurosci. 5, 49–74. Brayne, C., and Davis, D. (2012). Making Alzheimer’s and dementia research fit for
doi: 10.1142/S0219635206001021 populations. Lancet 380, 1441–1443. doi: 10.1016/S0140-6736(12)61803-0
American Psychiatric Association (2013). Diagnostic and Statistical Manual Breton, A., Casey, D., and Arnaoutoglou, N. A. (2019). Cognitive tests for
of Mental Disorders. Washington, DC: American Psychiatric Association. the detection of mild cognitive impairment (MCI), the prodromal stage
doi: 10.1176/appi.books.9780890425596 of dementia: meta-analysis of diagnostic accuracy studies. Int. J. Geriatr.
Babiloni, C., Barry, R. J., Basar, E., Blinowska, K. J., Cichocki, A., Drinkenburg, Psychiatry. 34, 233–242. doi: 10.1002/gps.5016
W., et al. (2019). International Federation of Clinical Neurophysiology (IFCN) Chen, A. C., Feng, W., Zhao, H., Yin, Y., and Wang, P. (2008). EEG default mode
- EEG research workgroup: Recommendations on frequency and topographic network in the human brain: spectral regional field powers. Neuroimage 41,
analysis of resting state EEG rhythms. Part 1: applications in clinical research 561–574. doi: 10.1016/j.neuroimage.2007.12.064
studies. Clin. Neurophysiol. 6:234. doi: 10.1016/j.clinph.2019.06.234 Dubois, B., Hampel, H., Feldman, H. H., Scheltens, P., Aisen, P., Andrieu,
Babiloni, C., Binetti, G., Cassarino, A., Dal Forno, G., Del Percio, C., S., et al. (2016). Preclinical Alzheimer’s disease: definition, natural
Ferreri, F., et al. (2006a). Sources of cortical rhythms in adults during history, and diagnostic criteria. Alzheimers Dement. 12, 292–323.
physiological aging: a multicentric EEG study. Hum. Brain Mapp. 27, 162–172. doi: 10.1016/j.jalz.2016.02.002
doi: 10.1002/hbm.20175 Duffy, F. H., Albert, M. S., McAnulty, G., and Garvey, A. J. (1984). Age-related
Babiloni, C., Binetti, G., Cassetta, E., Dal Forno, G., Del Percio, C., Ferreri, F., differences in brain electrical activity of healthy subjects. Ann. Neurol. 16,
et al. (2006b). Sources of cortical rhythms change as a function of cognitive 430–438. doi: 10.1002/ana.410160403
impairment in pathological aging: a multicenter study. Clin. Neurophysiol. 117, Gaál, Z. A., Boha, R., Stam, C. J., and Molnár, M. (2010). Age-dependent features
252–268. doi: 10.1016/j.clinph.2005.09.019 of EEG-reactivity–spectral, complexity, and network characteristics. Neurosci.
Babiloni, C., Lizio, R., Marzano, N., Capotosto, P., Soricelli, A., Triggiani, A. I., et al. Lett. 479, 79–84. doi: 10.1016/j.neulet.2010.05.037
(2016). Brain neural synchronization and functional coupling in Alzheimer’s Gauggel, S., and Birkner, B. (1999). Validität und Reliabilität einer deutschen
disease as revealed by resting state EEG rhythms. Int. J. Psychophysiol. 103, Version der Geriatrischen Depressionsskala (GDS). Z. Klin. Psychol. Psychother.
88–102. doi: 10.1016/j.ijpsycho.2015.02.008 28, 18–27. doi: 10.1026//0084-5345.28.1.18
Babiloni, C., Visser, P. J., Frisoni, G., De Deyn, P. P., Bresciani, L., Jelic, Guan, H., Liu, T., Jiang, J., Tao, D., Zhang, J., Niu, H., et al. (2017).
V., et al. (2010). Cortical sources of resting EEG rhythms in mild Classifying MCI subtypes in community-dwelling elderly using cross-sectional
cognitive impairment and subjective memory complaint. Neurobiol. Aging 31, and longitudinal MRI-based biomarkers. Front. Aging. Neurosci. 9:309.
1787–1798. doi: 10.1016/j.neurobiolaging.2008.09.020 doi: 10.3389/fnagi.2017.00309
Barry, R. J., Clarke, A. R., Johnstone, S. J., Magee, C. A., and Rushby, Hu, C., Yu, D., Sun, X., Zhang, M., Wang, L., and Qin, H. (2017). The prevalence
J. A. (2007). EEG differences between eyes-closed and eyes-open resting and progression of mild cognitive impairment among clinic and community
conditions. Clin. Neurophysiol. 118, 2765–2773. doi: 10.1016/j.clinph.2007. populations: a systematic review and meta-analysis. Int. Psychogeriatr. 29,
07.028 1595–1608. doi: 10.1017/S1041610217000473
Barry, R. J., and De Blasio, F. M. (2017). EEG differences between eyes-closed Hübner, L., Godde, B., and Voelcker-Rehage, C. (2018). Older adults reveal
and eyes-open resting remain in healthy ageing. Biol. Psychol. 129, 293–304. enhanced task-related beta power decreases during a force modulation task.
doi: 10.1016/j.biopsycho.2017.09.010 Behav. Brain Res. 345, 104–113. doi: 10.1016/j.bbr.2018.02.028
Frontiers in Aging Neuroscience | www.frontiersin.org 12 August 2021 | Volume 13 | Article 675689You can also read