BOLD signatures of sleep - bioRxiv
←
→
Page content transcription
If your browser does not render page correctly, please read the page content below
bioRxiv preprint first posted online Jan. 26, 2019; doi: http://dx.doi.org/10.1101/531186. The copyright holder for this preprint
 (which was not peer-reviewed) is the author/funder, who has granted bioRxiv a license to display the preprint in perpetuity.
                              It is made available under a CC-BY-NC-ND 4.0 International license.

     BOLD signatures of sleep

     Chen Song1,2, Melanie Boly1,3, Enzo Tagliazucchi4, Helmut Laufs5,6, Giulio Tononi1

     1. Department of Psychiatry, University of Wisconsin-Madison, Madison, USA
     2. Cardiff University Brain Research Imaging Centre, Cardiff University, Cardiff, UK
     3. Department of Neurology, University of Wisconsin-Madison, Madison, USA
     4. Brain and Spine Institute, Paris, France
     5. Department of Neurology and Brain Imaging Center, Goethe University, Frankfurt, Germany
     6. Department of Neurology, University Hospital Schleswig Holstein, Kiel, Germany

     Correspondence:
     Giulio Tononi
     University of Wisconsin-Madison
     6001 Research Park Blvd
     Madison 53719
     USA
     gtononi@wisc.edu

                                                                                                                                    1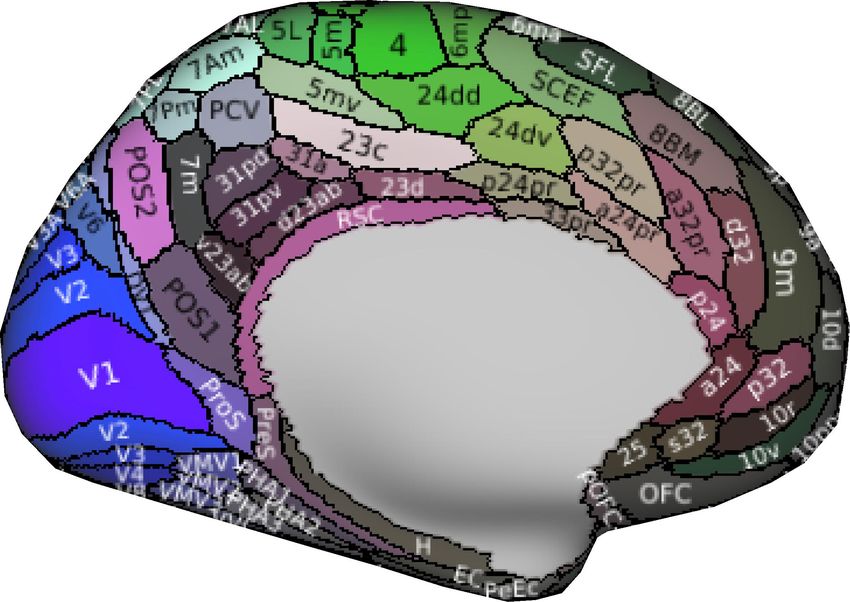
bioRxiv preprint first posted online Jan. 26, 2019; doi: http://dx.doi.org/10.1101/531186. The copyright holder for this preprint
 (which was not peer-reviewed) is the author/funder, who has granted bioRxiv a license to display the preprint in perpetuity.
                              It is made available under a CC-BY-NC-ND 4.0 International license.

     ABSTRACT

     Sleep can be distinguished from wake by changes in brain electrical activity, typically assessed using
     electroencephalography (EEG). The hallmark of non-rapid-eye-movement sleep are two major EEG
     events: slow waves and spindles. Here we sought to identify possible signatures of sleep in brain
     hemodynamic activity, using simultaneous fMRI-EEG. We found that, during the transition from
     wake to sleep, blood-oxygen-level-dependent (BOLD) activity evolved from a mixed-frequency
     pattern to one dominated by two distinct oscillations: a low-frequency (~0.05Hz) oscillation
     prominent in light sleep and a high-frequency (~0.17Hz) oscillation in deep sleep. The two BOLD
     oscillations correlated with the occurrences of spindles and slow waves, respectively. They were
     detectable across the whole brain, cortically and subcortically, but had different regional distributions
     and opposite onset patterns. These spontaneous BOLD oscillations provide fMRI signatures of basic
     sleep processes, which may be employed to study human sleep at spatial resolution and brain
     coverage not achievable using EEG.

     HIGHLIGHTS
        •   spontaneous BOLD oscillations differentiate sleep from wake
        •   low-frequency BOLD oscillation tracks sleep spindles
        •   high-frequency BOLD oscillation tracks sleep slow waves
        •   BOLD oscillations provide fMRI signatures of key sleep processes

                                                                                                                                    2
bioRxiv preprint first posted online Jan. 26, 2019; doi: http://dx.doi.org/10.1101/531186. The copyright holder for this preprint
 (which was not peer-reviewed) is the author/funder, who has granted bioRxiv a license to display the preprint in perpetuity.
                              It is made available under a CC-BY-NC-ND 4.0 International license.

     INTRODUCTION

     Brain activity during sleep is typically assessed using electroencephalography (EEG). The hallmark of
     non-rapid-eye-movement (NREM) sleep, which represents four fifths of human sleep, is the shift
     from high-frequency, low-amplitude EEG activity to low-frequency, high-amplitude EEG dominated
     by spindles and slow waves (Figure 1A). Spindles are characterized by waxing and waning rhythms in
     11~16 Hz frequency range (herein referred to as sigma activity), which last for 1 to 3 seconds and
     occur around twice per minute (Zeitlhofer et al., 1997, Purcell et al., 2017). Slow waves are
     characterized by sharp negative deflections in 0.5~4 Hz frequency range (herein referred to as delta
     activity), which occur around seven times per minute (Mensen et al., 2016). Based on the prominence
     of spindles and slow waves, respectively, NREM sleep can be subdivided into a lighter N2 stage and a
     deeper N3 stage.

     Slow waves and spindles are being actively investigated because they are thought to mediate many of
     the restorative benefits of sleep at both a cellular and a systems level, including memory consolidation
     and integration (Rasch and Born, 2013, Tononi and Cirelli, 2014). Intracranial recordings have
     established that slow waves are associated with the near-synchronous transition in large populations
     of neurons between two distinct states, an up state of membrane depolarization and intense firing, and
     a down state of membrane hyperpolarization and silence (Steriade et al., 2001, Chauvette et al., 2011).
     Slow waves are generated primarily in the cortex (although the thalamus is required for their full
     expression), and affect virtually all cortical neurons, as well as neurons in several subcortical
     structures (Crunelli et al., 2015). By contrast, spindles are associated with cycles of hyperpolarization
     and depolarization triggered by interactions between reticular thalamic nucleus and specific thalamic
     nuclei, and further amplified by thalamo-cortico-thalamic circuits (Steriade et al., 1987). In natural
     sleep, slow waves may occur at different times in different cortical regions (Nir et al., 2011) and they
     can travel at a speed of a few meters per second over the cortical surface (Massimini et al., 2004,
     Murphy et al., 2009). Similarly, spindles exhibit regional specificity and show evidence of traveling
     (Andrillon et al., 2011, Piantoni et al., 2017, Hagler et al., 2018). Spindles and higher frequency EEG
     activities are often nested by underlying slow waves, and slow waves in turn can be grouped by infra-
     slow fluctuations (Steriade, 2000).

     Although EEG has good temporal resolution, its spatial resolution is limited, strongly affected by
     volume conduction, and largely insensitive to neural activity in cortical and subcortical regions far
     away from the scalp. Here we sought to complement EEG recordings of human sleep by employing
     functional magnetic resonance imaging (fMRI) to investigate, with fuller brain coverage and greater
     spatial resolution, possible signatures of sleep in blood-oxygen-level-dependent (BOLD) activity.
     Spindles and slow waves are grouped by infra-slow fluctuations within the frequency range of
     hemodynamic responses (Chen and Glover, 2015, Lewis et al., 2016, Trapp et al., 2018). Therefore,
     while previous fMRI studies of sleep have mostly examined changes in BOLD amplitude (Schabus et
     al., 2007, Dang-Vu et al., 2008, Fukunaga et al., 2008, Picchioni et al., 2011, Schwalm et al., 2017) or
     functional connectivity (Laufs et al., 2007, Horovitz, et al., 2009, Larson-Prior et al., 2009, Boly et al.,
     2012, Duyn, 2012, Tagliazucchi et al., 2012, Liu et al., 2014, Picchioni et al., 2014), we investigated
     if the frequency content of BOLD activity shows systematic changes from wake to sleep, using
     simultaneous fMRI and polysomnographic EEG recordings.

     We found that, during the transition from wake to sleep, BOLD activity evolved from a mixed-
     frequency pattern to one dominated by two distinct oscillations: a low-frequency (~0.05 Hz)
     oscillation that was prominent in light sleep and tracked the occurrence of spindles, and a high-
     frequency (~0.17 Hz) oscillation that was prominent in deep sleep and tracked the occurrence of slow
     waves. The low-frequency BOLD oscillation was strongest in sensory cortices and weaker in
     prefrontal cortex and subcortical regions, and it propagated from sensory to prefrontal cortices at the
     onset of sleep. By contrast, the high-frequency BOLD oscillation was strongest in prefrontal cortex
     and subcortical regions and weaker in sensory cortices, and it propagated from prefrontal to sensory
     cortices at sleep onset. The two spontaneous BOLD oscillations reported here provide fMRI

                                                                                                                                    3
bioRxiv preprint first posted online Jan. 26, 2019; doi: http://dx.doi.org/10.1101/531186. The copyright holder for this preprint
 (which was not peer-reviewed) is the author/funder, who has granted bioRxiv a license to display the preprint in perpetuity.
                              It is made available under a CC-BY-NC-ND 4.0 International license.

     signatures of basic sleep processes. They may be employed to study the occurrence, modulation, or
     function of sleep with higher spatial resolution than EEG and with the ability to probe deep brain
     structures.

     RESULTS

     Simultaneous fMRI and polysomnographic EEG recordings were acquired from 58 non-sleep-
     deprived participants and constituted part of a larger dataset reported previously in (Tagliazucchi and
     Laufs, 2014). Recordings started at around 20:00 and lasted for 50 minutes. 36 out of 58 participants
     displaying sustained epochs of N2 and N3 sleep were included in subsequent analyses. The average
     time they spent in sleep was 33.27 minutes, and in N2 or N3 sleep was 22.80 minutes. The sleep
     architecture of all participants is summarized in Table S1.

     Changes in BOLD frequency content from wake to sleep

     Representative EEG and BOLD time series from simultaneous fMRI-EEG recordings are displayed in
     Figure 1. Visual inspection of EEG time series suggested a shift from high-frequency, low-amplitude
     background during wake to low-frequency, high-amplitude background dominated by spindles and
     slow waves during sleep (Figure 1A). Visual inspection of BOLD time series suggested similar,
     frequency-specific changes starting at the transition from wake to sleep (Figure 1B). During
     wakefulness, mixed-frequency, low-amplitude BOLD activity was observed. By contrast, during N1
     then N2 sleep, BOLD activity evolved into a high-amplitude background with prominent low-
     frequency oscillation. Low-frequency BOLD oscillation attenuated when reaching N3 sleep, where
     most brain regions started to display spontaneous oscillations of higher frequency.

     To quantitatively assess the progressive changes in BOLD frequency content from wake to sleep, Fast
     Fourier Transform (FFT) analysis was applied to BOLD time series in sliding windows of 104
     seconds (50 volumes) and step sizes of 2.08 seconds (1 volume, see Methods for details). The BOLD
     power spectrogram (Figure 1C) derived from FFT analysis confirmed our visual detection of a low-
     frequency BOLD oscillation emerging during N1 and N2 sleep, which progressively attenuated when
     transitioning to N3 sleep. It also revealed that the high-frequency BOLD oscillation visually detected
     in N3 sleep was already present, although at a lower power, during N2 sleep.

     Based on the BOLD power spectrogram, we calculated the BOLD power spectrum for wake, N1, N2
     and N3 sleep (Figure 1C). The BOLD power spectrum during wakefulness was relatively even,
     confirming visual impression of a mixed-frequency pattern. By contrast, the BOLD power spectrum
     during NREM sleep displayed two distinct and relatively sharp peaks: a first peak in lower-frequency
     range with a mean value of 0.05 Hz across participants (Table S2), and a second peak in higher-
     frequency range with a mean value of 0.17 Hz across participants (Table S3). The low-frequency peak
     appeared during the transition from wake to N1 sleep, became maximal in N2 sleep, and markedly
     attenuated in N3 sleep. By contrast, the high-frequency peak appeared in N2 sleep, and became
     maximal during N3 sleep. Consistent changes in BOLD frequency content from wake to sleep were
     observed across the whole brain, with the emergence of two distinct peaks in the power spectrum
     during sleep (Figure 2).

                                                                                                                                    4
bioRxiv preprint first posted online Jan. 26, 2019; doi: http://dx.doi.org/10.1101/531186. The copyright holder for this preprint
(which was not peer-reviewed) is the author/funder, who has granted bioRxiv a license to display the preprint in perpetuity.
It is made available under a CC-BY-NC-ND 4.0 International license.
(A) EEG time series
Amplitude (au)
Amplitude (au)
Amplitude (au)
Amplitude (au)
1 1 1 spindle 1 slow wave
0 0 0 0
-1 -1 -1 -1
1 2 3 4 1 2 3 4 1 2 3 4 1 2 3 4
Time (sec) Time (sec) Time (sec) Time (sec)
(A) EEG time series Sleep stage
W N1 N2 N3 N2 N1 W N1
Amplitude (au)
1
0
-1
82 348 824 1530 1964 1996 2384 2900
Time (sec)
(B) BOLD time series Sleep stage
W N1 N2 N3 N2 N1 W N1
Amplitude (au)
1
0
-1
82 348 824 1530 1964 1996 2384 2900
Time (sec)
(C) BOLD power spectrogram Sleep stage 0 1
W N1 N2 N3 N2 N1 W Power (au) N1
Frequency (Hz)
0.24
0.03
82 348 824 1530 1964 1996 2384 2900
Time (sec)
1 1 1 low-frequency oscillation 1 high-frequency oscillation
0.8 0.8 0.8 0.8
Power (au)
Power (au)
Power (au)
Power (au)
0.6 0.6 0.6 0.6
0.4 0.4 0.4 0.4
0.2 0.2 0.2 0.2
0 0 0 0
0.1 0.2 0.1 0.2 0.1 0.2 0.1 0.2
Frequency (Hz) Frequency (Hz) Frequency (Hz) Frequency (Hz)
Figure 1. EEG and fMRI signatures of NREM sleep. (A) Representative EEG time series from simultaneous fMRI-EEG recording of
sleep were plotted, illustrating the shift from high-frequency, low-amplitude wake EEG to low-frequency, high-amplitude sleep EEG
dominated by spindles and slow waves. (B~C) Representative BOLD time series, power spectrogram and power spectrum from
simultaneous fMRI-EEG recording of sleep were also plotted, illustrating the changes in BOLD frequency content from wake to sleep.
During wakefulness, mixed-frequency, low-amplitude BOLD activity was observed. By contrast, during N1 then N2 sleep, BOLD activity
evolved into a high-amplitude background with prominent low-frequency oscillation. Low-frequency BOLD oscillation attenuated when
reaching N3 sleep, where most brain regions started to display spontaneous oscillations of higher frequency. The figure shows the data of
participant S25.
(A) BOLD time series Sleep stage (B) BOLD power spectrum Sleep stage
W N1 N2 N3 N2 N1 W N1 W N1 N2 N3
superior frontal superior frontal
pars orbitalis pars orbitalis
pars triangularis pars triangularis
pars opercularis pars opercularis
rostral middle frontal rostral middle frontal
caudal middle frontal caudal middle frontal
precentral precentral
postcentral (S1) postcentral (S1)
paracentral paracentral
inferior temporal inferior temporal
middle temporal middle temporal
superior temporal superior temporal
superior temporal sulcus superior temporal sulcus
transverse temporal (A1) transverse temporal (A1)
inferior parietal inferior parietal
supra marginal supra marginal
superior parietal superior parietal
precuneus precuneus
fusiform fusiform
Amplitude (au)
lateral occipital lateral occipital
Power (au)
cuneus (V2) cuneus (V2)
lingual (V2) lingual (V2)
pericalcarine (V1) pericalcarine (V1)
isthmus cingulate isthmus cingulate
posterior cingulate posterior cingulate
caudal anterior cingulate caudal anterior cingulate
rostral anterior cingulate rostral anterior cingulate
parahippocampal parahippocampal
entorhinal entorhinal
medial orbitofrontal medial orbitofrontal
lateral orbitofrontal lateral orbitofrontal
insula insula
cerebellum cerebellum
striatum striatum
thalamus thalamus
hippocampus hippocampus
amygdala amygdala
basal forebrain basal forebrain
hypothalamus hypothalamus
midbrain midbrain
pons pons
medulla medulla
82 348 824 1530 1964 1996 2384 2900 0.10 0.20 0.10 0.20 0.10 0.20 0.10 0.20
Time (sec) Frequency (Hz) Frequency (Hz) Frequency (Hz) Frequency (Hz)
Figure 2. Whole-brain changes in BOLD frequency content from wake to sleep. Representative ROI-level BOLD time series and power
spectrum (each color reflecting one ROI, see Figure 3A for color scales) were plotted, illustrating the consistency across different brain
regions in the changes in BOLD frequency content from wake to NREM sleep. The figure shows the data of participant S25.
5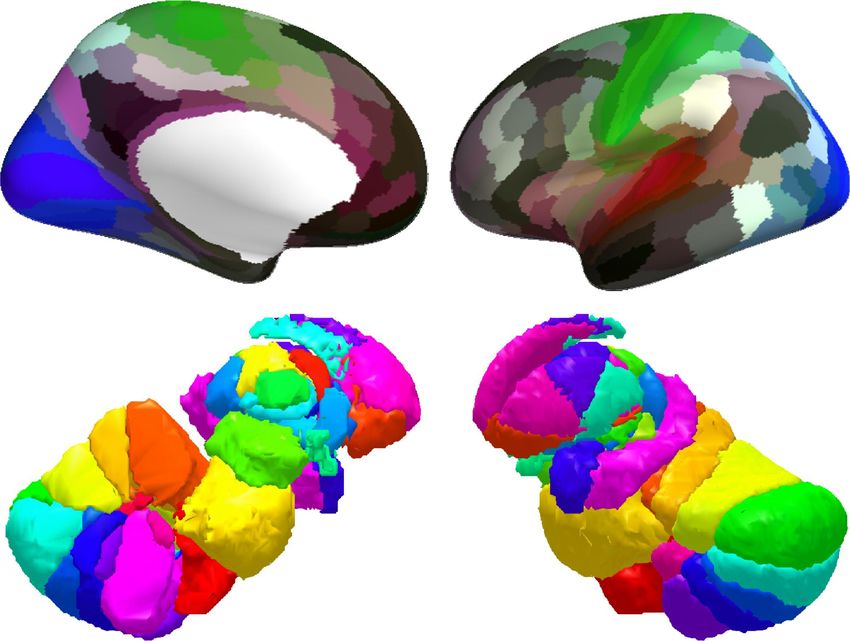
bioRxiv preprint first posted online Jan. 26, 2019; doi: http://dx.doi.org/10.1101/531186. The copyright holder for this preprint
(which was not peer-reviewed) is the author/funder, who has granted bioRxiv a license to display the preprint in perpetuity.
It is made available under a CC-BY-NC-ND 4.0 International license.
Power topography of BOLD oscillations during sleep
To investigate the distribution of BOLD oscillations across the brain, we parcellated the cortex into 32
regions (Desikan et al., 2006) and the subcortex into 10 regions: cerebellum, striatum, thalamus,
medulla, pons, midbrain, hypothalamus, basal forebrain, amygdala and hippocampus (Fischl et al.,
2002, Zaborszky et al., 2008, Baroncini et al., 2012, Iglesias et al., 2016). In addition to this coarse
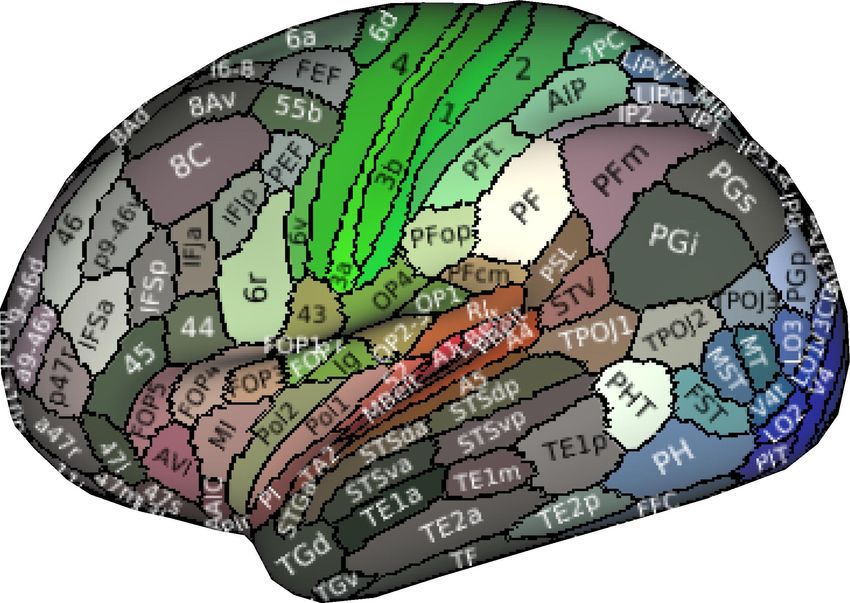
atlas of 42 regions of interest (Figure 3A), we used a fine atlas of 217 regions of interest (Figure 3A),
where the brain was parcellated into 180 cortical regions (Glasser et al., 2016), 11 cerebellum lobules
(Diedrichsen et al., 2009), 7 striatum divisions (Tziortzi et al., 2014), 12 thalamic subregions (Figure
S1; Morel et al., 1997, Krauth et al., 2010), medulla, pons, midbrain, hypothalamus, basal forebrain,
amygdala and hippocampus (Fischl et al., 2002, Zaborszky et al., 2008, Baroncini et al., 2012, Iglesias
et al., 2016). The number of voxels in individual regions of interest (ROIs) are listed in Table S4.
We derived the power spectrogram of each ROI by applying FFT analysis on a voxel-level and
calculating the average power spectrogram across all voxels within the ROI (see Methods for details).
Representative ROI-level BOLD time series and power spectrum are displayed in Figure 2. On a
participant-by-participant, ROI-by-ROI basis, we identified the spectral peaks in lower-frequency and
higher-frequency ranges, traced the time courses of oscillation power, and calculated the increase in
oscillation power from wake to sleep. The power of low-frequency and high-frequency BOLD
oscillations both showed a two to three-fold increase from wake to sleep. Such an effect size is
substantial, considering that the changes in BOLD amplitude evoked by stimuli or tasks during
wakefulness are usually less than 10% of the baseline amplitude (Cohen et al., 2002, Sirotin et al.,
2009). While they both increased several-fold from wake to sleep, we found that low-frequency
(Figure 3B, Table S2) and high-frequency (Figure 3C, Table S3) BOLD oscillations had very
different power topographies.
Within the cortex, low-frequency BOLD oscillation was strong in sensory and posteromedial regions
(including visual areas V1, V2, V3, V3A, MT, V6, V6A, V7, V8, ProS, auditory areas A1, MBelt,
LBelt, PBelt, RI, somatosensory areas 3a, 3b, precuneus and posterior cingulate area where the
oscillation power increased by 304%, 266%, 230%, 244%, 248%, 348%, 273%, 237%, 225%, 257%,
259%, 293%, 282%, 269%, 230%, 207%, 209%, 250% and 261% from wake to sleep), but generally
weak in prefrontal and parahippocampal regions (including Brodmann areas 8, 9, 10, 11, 32, 44, 45,
46, 47 and entorhinal cortex, where the oscillation power increased by 133%, 139%, 140%, 147%,
133%, 157%, 163%, 143%, 150% and 149%). By contrast, high-frequency BOLD oscillation was
strong in prefrontal and parahippocampal regions (including Brodmann areas 10, 47 and entorhinal
cortex, where the oscillation power increased by 285%, 266% and 303%), but weaker in sensory and
posteromedial regions (including visual areas V2, V3, V3CD, MT, V4, V4t, V6, auditory areas A5,
RI, somatosensory areas 2, 3a, 3b, precuneus and posterior cingulate area, where the oscillation power
increased by 210%, 205%, 199%, 197%, 204%, 180%, 209%, 213%, 200%, 193%, 185%, 208%,
188% and 191%). Despite these differences in power topography, the subgenual area (an orbitofrontal
region), had the strongest low-frequency BOLD oscillation (405% increase in oscillation power) as
well as the strongest high-frequency BOLD oscillation (344% increase in oscillation power) among
all cortical regions.
Within the subcortex, low-frequency BOLD oscillation was generally weaker than high-frequency
BOLD oscillation. However, the two oscillations had similar power topography. Low-frequency
BOLD oscillation was strongest in hypothalamus, basal forebrain and intralaminar, anterior, medial
dorsal, lateral dorsal thalamus (where the oscillation power increased by 217%, 192%, 211%, 215%,
203% and 199%). Similarly, high-frequency BOLD oscillation was strongest in hypothalamus, basal
forebrain and intralaminar, anterior, medial dorsal, lateral dorsal thalamus (where the oscillation
power increased by 340%, 268%, 428%, 342%, 307% and 365%).
6
bioRxiv preprint first posted online Jan. 26, 2019; doi: http://dx.doi.org/10.1101/531186. The copyright holder for this preprint
(which was not peer-reviewed) is the author/funder, who has granted bioRxiv a license to display the preprint in perpetuity.
It is made available under a CC-BY-NC-ND 4.0 International license.
(A) Atlas
paracentral
su Coarse atlas superior Fine atlas
pe parietal
caudal
l
rio
s
tra
l
tra
r fr
l
eu
ina
posterior ca on middle
en
cun
u
cen
da tal
arg
cingulate
nta le
stc
cin l ante frontal
fro midd
pre
pre
ram
cin mus
po
gu
late
late rior inferior
l
sup
pars
isth
l
gu
tra
parietal
cuneus
r
opercularis
ros
tem erio
sulc oral
l
arine rostra pars
ral
us
pericalc parahippocampal A1 l
sup
p
r
anterio triangularis
ula late ital
ins ora ip
lingual entorhinal cingu
late
l
pars m p occ
fronta orbitalis l r te l ral
dial orb
ito ra rio ora po
fus
late tal pe mp
iform
me
n su te r tem
o dle rio
rbitofr mid infe
o
thalamus thalamus cerebellum striatum thalamus
striatum striatum HIIV limbic network anterior
HV occpital network lateral dorsal
mid s mid s HVI parietal network lateral posterior
bra pu bra pu CrusI central network lateral geniculate
in
d ala am in
d ala c am
basal forebrain yg p oc basal forebrain yg po CrusII temporal network pulvinar
am hip am hip HVIIb frontal network parafascicular
po hypothalamus po hypothalamus HVIIIa default mode network centromedian
n s n s
cerebellum cerebellum HVIIIb ventral posterior
HIX ventral lateral
me me HX ventral anterior
du du dentate medial dorsal
lla ll a
medial geniculate
(B) Power topography of low-frequency BOLD oscillation
Coarse atlas 338.0% Fine atlas 405.4%
Increase in oscillation power from wake to sleep
Increase in oscillation power from wake to sleep
197.5% 206.1%
177.0% 184.6%
160.1% 161.3%
133.7% 132.6%
(C) Power topography of high-frequency BOLD oscillation
Coarse atlas 340.2% Fine atlas 428.2%
Increase in oscillation power from wake to sleep
Increase in oscillation power from wake to sleep
236.1% 236.2%
209.5% 214.1%
194.6% 200.1%
180.9% 168.5%
Figure 3. Power topography of BOLD oscillations. (A) Illustrated are the atlases used in our study, where the brain was parcellated into
42 coarse ROIs, including 32 cortical regions, cerebellum, striatum, thalamus, medulla, pons, midbrain, hypothalamus, basal forebrain,
amygdala, hippocampus, or 217 fine ROIs, including 180 cortical regions, 11 cerebellum lobules, 7 striatum divisions, 12 thalamic
subregions, medulla, pons, midbrain, hypothalamus, basal forebrain, amygdala, hippocampus. (B~C) Regional increases in BOLD
oscillation power from wake to sleep were calculated. The power of low-frequency and high-frequency BOLD oscillations both showed a
three-fold increase from wake to sleep. However, low-frequency BOLD oscillation (B) was generally strong in sensory and posteromedial
cortices and weak in prefrontal and subcortical regions, whereas high-frequency BOLD oscillation (C) was strongest in prefrontal and
subcortical regions and weaker in sensory and posteromedial cortices. Despite these differences, the subgenual area (an orbitofrontal region)
had the strongest low-frequency BOLD oscillation as well as the strongest high-frequency BOLD oscillation among all cortical regions. The
figure shows the average results across two hemispheres and participants S1 to S36.
7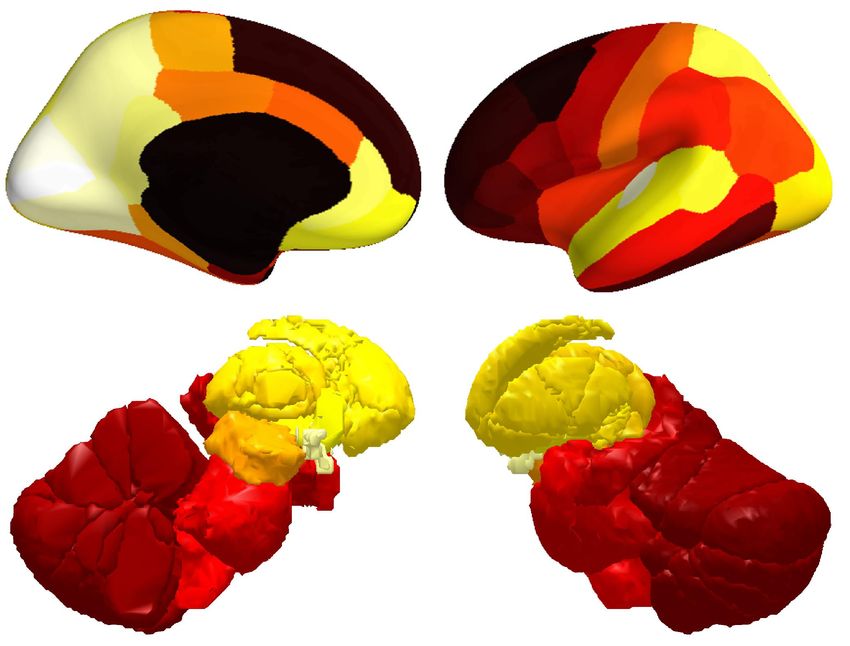
bioRxiv preprint first posted online Jan. 26, 2019; doi: http://dx.doi.org/10.1101/531186. The copyright holder for this preprint
 (which was not peer-reviewed) is the author/funder, who has granted bioRxiv a license to display the preprint in perpetuity.
                              It is made available under a CC-BY-NC-ND 4.0 International license.

     BOLD oscillations track sleep spindles and slow waves

     The two spontaneous BOLD oscillations observed during sleep, a low-frequency oscillation
     prominent in N2 sleep and a high-frequency oscillation in N3 sleep, seemed to mirror the well-known
     patterns of sleep EEG, with spindles (sigma activity) being prominent in N2 sleep and slow waves
     (delta activity) in N3 sleep (Figure 1). Moreover, the frequency of the two BOLD oscillations, 0.05
     Hz and 0.17 Hz, was similar to the reported periodicity of spindles (about 2 times per minute,
     corresponding to 0.05 Hz, Zeitlhofer et al., 1997, Purcell et al., 2017) and slow waves (about 7 times
     per minutes, corresponding to 0.17 Hz, Mensen et al., 2016). Because of these similarities, we
     hypothesized that low-frequency and high-frequency BOLD oscillations might track spindle (sigma)
     and slow wave (delta) activities, respectively.

     To test this hypothesis, we detected individual occurrences of spindles and slow waves using methods
     described in (Ferrarelli et al., 2007, Riedner et al., 2007). The time course of spindle or slow wave
     activity was calculated as the integral of their occurrence and duration in consecutive windows of 2.08
     seconds (matching fMRI temporal resolution), and was correlated against the time course of low-
     frequency (Figure 4A) or high-frequency (Figure 5A) BOLD oscillation power, on a participant-by-
     participant, ROI-by-ROI basis. Since the intensity of spindle and slow wave activities can be
     approximated by the power of sigma (11~16 Hz) and delta (0.5~4 Hz) activities, respectively, we
     further derived sigma and delta power from EEG power spectrogram, and correlated the time course
     of sigma or delta activity against the time course of low-frequency (Figure 4B) or high-frequency
     (Figure 5B) BOLD oscillation power, on a participant-by-participant, ROI-by-ROI basis. The
     distributions of correlation coefficient across all participants and ROIs were plotted, where each value
     reflected the result from a single participant and a single ROI.

     The analysis revealed a strong correlation between low-frequency BOLD oscillation power and
     spindle activity (Figure 4C, within sleep only, r = 0.482, N = 1000 time points, T = 17.379, p < 10-20,
     across sleep and wake, r = 0.581, N = 1500 time points, T = 27.629, p < 10-20). It also revealed a
     strong correlation between high-frequency BOLD oscillation power and slow wave activity (Figure
     5C, within sleep only, r = 0.579, N = 1000 time points, T = 22.434, p < 10-20, across sleep and wake, r
     = 0.651, N = 1500 time points, T = 33.193, p < 10-20). Moreover, low-frequency BOLD oscillation
     correlated more strongly with spindle than with slow wave activity (Figure S2A, within sleep only, ∆r
     = 0.302, N = 1000 time points, Z = 10.849, p < 10-20, across sleep and wake, ∆r = 0.313, N = 1500
     time points, Z = 15.061, p < 10-20), whereas high-frequency BOLD oscillation correlated more
     strongly with slow wave than with spindle activity (Figure S2C, within sleep only, ∆r = 0.357, N =
     1000 time points, Z = 13.742, p < 10-20, across sleep and wake, ∆r = 0.334, N = 1500 time points, Z =
     17.362, p < 10-20).

     Similar results were obtained for correlations between low-frequency BOLD oscillation power and
     sigma activity (Figure 4D, within sleep only, r = 0.462, N = 1000 time points, T = 16.457, p < 10-20,
     across sleep and wake, r = 0.548, N = 1500 time points, T = 25.356, p < 10-20), and between high-
     frequency BOLD oscillation power and delta activity (Figure 5D, within sleep only, r = 0.528, N =
     1000 time points, T = 19.641, p < 10-20, across sleep and wake, r = 0.550, N = 1500 time points, T =
     25.489, p < 10-20). Again, low-frequency BOLD oscillation correlated more strongly with sigma than
     with delta activity (Figure S2B, within sleep only, ∆r = 0.256, N = 1000 time points, Z = 9.184, p <
     10-20, across sleep and wake, ∆r = 0.195, N = 1500 time points, Z = 9.543, p < 10-20), whereas high-
     frequency BOLD oscillation correlated more strongly with delta than with sigma activity (Figure S2D,
     within sleep only, ∆r = 0.368, N = 1000 time points, Z = 13.451, p < 10-20, across sleep and wake, ∆r
     = 0.272, N = 1500 time points, Z = 12.879, p < 10-20).

     In contrast to the frequency content, the amplitude of BOLD activity did not show significant
     correlation with spindle activity (Figure 4E, within sleep only, r = 0.001, N = 1000 time points, T =
     0.032, p = 0.975, across sleep and wake, r = 0.002, N = 1500 time points, T = 0.077, p = 0.938) or
     sigma activity (Figure 4F, within sleep only, r = 0.003, N = 1000 time points, T = 0.095, p = 0.925,
     across sleep and wake, r = 0.006, N = 1500 time points, T = 0.232, p = 0.816), or with slow wave

                                                                                                                                    8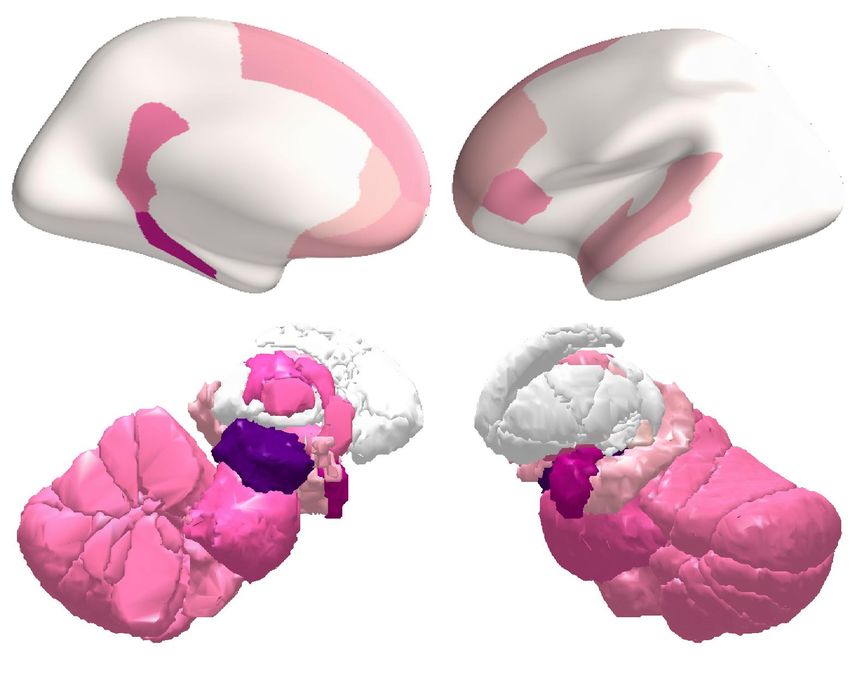
bioRxiv preprint first posted online Jan. 26, 2019; doi: http://dx.doi.org/10.1101/531186. The copyright holder for this preprint
(which was not peer-reviewed) is the author/funder, who has granted bioRxiv a license to display the preprint in perpetuity.
It is made available under a CC-BY-NC-ND 4.0 International license.
activity (Figure 5E, within sleep only, r = -0.0007, N = 1000 time points, T = 0.022, p = 0.982, across
sleep and wake, r = 0.0003, N = 1500 time points, T = 0.012, p = 0.991) or delta activity (Figure 5F,
within sleep only, r = 0.003, N = 1000 time points, T = 0.095, p = 0.925, across sleep and wake, r =
0.004, N = 1500 time points, T = 0.155, p = 0.877). There was also no significant correlation between
BOLD oscillation power and cardiac or respiratory activity (derived from respiration and pulse
oximetry data), or cardiac or respiratory oscillation power (derived from FFT analysis to cardiac and
respiratory time series) (Figure S3).
(A) Low-frequency BOLD oscillation tracks spindle activity (B) Low-frequency BOLD oscillation tracks sigma activity
Sleep stage Sleep stage
W N1 N2 N3 N2 N1 W N1 W N1 N2 N3 N2 N1 W N1
1 1 1 1
Low-frequency BOLD
Low-frequency BOLD
oscillation power (au)
oscillation power (au)
Spindle activity (au)
Sigma activity (au)
0.5 0.5 0.5 0.5
0 0 0 0
82 348 824 1530 1964 1996 2384 2900 82 348 824 1530 1964 1996 2384 2900
Time (sec) Time (sec)
(C) Correlation between low-frequency BOLD oscillation and spindle activity (D) Correlation between low-frequency BOLD oscillation and sigma activity
mean correlation coefficient = 0.581 mean correlation coefficient = 0.482 mean correlation coefficient = 0.548 mean correlation coefficient = 0.462
500 T = 27.63 380 T = 17.38 500 T = 25.36 360 T = 16.46
-20
p < 10 p < 10-20 p < 10-20 p < 10-20
375 285 375 270
Histogram
Histogram
Histogram
Histogram
250 190 250 180
125 95 125 90
0 0 0 0
0 0.25 0.5 0.75 1 0 0.25 0.5 0.75 1 0 0.25 0.5 0.75 1 0 0.25 0.5 0.75 1
Correlation coefficient (across sleep and wake) Correlation coefficient (within sleep only) Correlation coefficient (across sleep and wake) Correlation coefficient (within sleep only)
(E) Correlation between BOLD amplitude and spindle activity (F) Correlation between BOLD amplitude and sigma activity
mean correlation coefficient = 0.002 mean correlation coefficient = 0.001 mean correlation coefficient = 0.006 mean correlation coefficient = 0.003
7200 T = 0.077 6400 T = 0.032 5400 T = 0.232 5000 T = 0.095
p = 0.938 p = 0.975 p = 0.816 p = 0.925
5400 4800 4050 3750
Histogram
Histogram
Histogram
Histogram
3600 3200 2700 2500
1800 1600 1350 1250
0 0 0 0
-1 -0.5 0 0.5 1 -1 -0.5 0 0.5 1 -1 -0.5 0 0.5 1 -1 -0.5 0 0.5 1
Correlation coefficient (across sleep and wake) Correlation coefficient (within sleep only) Correlation coefficient (across sleep and wake) Correlation coefficient (within sleep only)
Figure 4. Low-frequency BOLD oscillation tracks sleep spindles. (A~B) Representative time courses of low-frequency BOLD
oscillation power (colored lines, each color reflecting one ROI, see Figure 3A for color scales) and spindle or sigma activity (black
lines) from simultaneous fMRI-EEG recording of sleep were plotted, illustrating the correlation between low-frequency BOLD
oscillation and spindle or sigma activity. The figure shows the data of participant S25. (C~F) The time course of low-frequency BOLD
oscillation power or BOLD amplitude was correlated against the time course of spindle or sigma activity, on a participant-by-
participant, ROI-by-ROI basis, across sleep and wake (N = 1500 time points), or within sleep only (N = 1000 time points). The
distributions of correlation coefficient across all participants and ROIs were plotted, where each value reflected the result from a
single participant and a single ROI. At a data length of 1500 and 1000 time points, the threshold correlation coefficient for
establishing statistical significance are 0.051 and 0.062 (before correction for multiple comparisons) or 0.136 and 0.166 (after
Bonferroni correction for 374976 comparisons), respectively. The correlations between low-frequency BOLD oscillation power and
spindle (C) or sigma (D) activity were much larger than the threshold correlation coefficient, and corresponded to T > 16.455, p < 10-
20
. By contrast, the correlations between BOLD amplitude and spindle (E) or sigma (F) activity were much smaller than the threshold
correlation coefficient, and corresponded to T < 0.233, p > 0.815. The figure shows the average results across two hemispheres and
participants S1 to S36.
9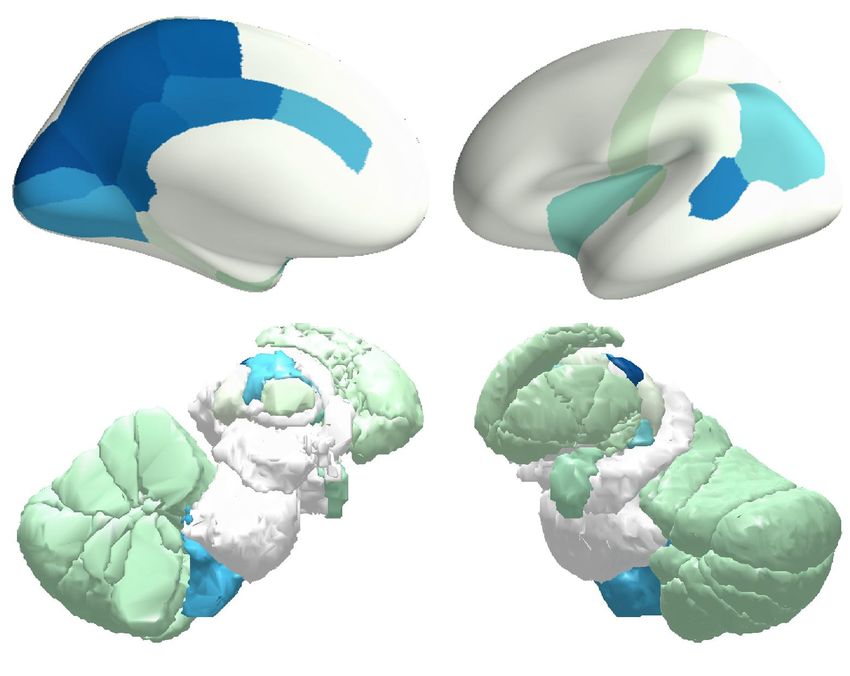
bioRxiv preprint first posted online Jan. 26, 2019; doi: http://dx.doi.org/10.1101/531186. The copyright holder for this preprint
(which was not peer-reviewed) is the author/funder, who has granted bioRxiv a license to display the preprint in perpetuity.
It is made available under a CC-BY-NC-ND 4.0 International license.
(A) High-frequency BOLD oscillation tracks slow wave activity (B) High-frequency BOLD oscillation tracks delta activity
Sleep stage Sleep stage
W N1 N2 N3 N2 N1 W N1 W N1 N2 N3 N2 N1 W N1
1 1 1 1
Slow wave activity (au)
High-frequency BOLD
High-frequency BOLD
oscillation power (au)
oscillation power (au)
Delta activity (au)
0.5 0.5 0.5 0.5
0 0 0 0
82 348 824 1530 1964 1996 2384 2900 82 348 824 1530 1964 1996 2384 2900
Time (sec) Time (sec)
(C) Correlation between high-frequency BOLD oscillation and slow wave activity (D) Correlation between high-frequency BOLD oscillation and delta activity
mean correlation coefficient = 0.651 mean correlation coefficient = 0.579 mean correlation coefficient = 0.550 mean correlation coefficient = 0.528
460 T = 33.19 400 T = 22.43 600 T = 25.49 600 T = 19.64
-20 -20 -20 -20
p < 10 p < 10 p < 10 p < 10
345 300 450 450
Histogram
Histogram
Histogram
Histogram
230 200 300 300
115 100 150 150
0 0 0 0
0 0.25 0.5 0.75 1 0 0.25 0.5 0.75 1 0 0.25 0.5 0.75 1 0 0.25 0.5 0.75 1
Correlation coefficient (across sleep and wake) Correlation coefficient (within sleep only) Correlation coefficient (across sleep and wake) Correlation coefficient (within sleep only)
(E) Correlation between BOLD amplitude and slow wave activity (F) Correlation between BOLD amplitude and delta activity
mean correlation coefficient = 0.0003 mean correlation coefficient = -0.0007 mean correlation coefficient = 0.004 mean correlation coefficient = 0.003
7200 T = 0.012 6400 T = 0.022 6000 T = 0.155 5400 T = 0.095
p = 0.991 p = 0.982 p = 0.877 p = 0.925
5400 4800 4500 4050
Histogram
Histogram
Histogram
Histogram
3600 3200 3000 2700
1800 1600 1500 1350
0 0 0 0
-1 -0.5 0 0.5 1 -1 -0.5 0 0.5 1 -1 -0.5 0 0.5 1 -1 -0.5 0 0.5 1
Correlation coefficient (across sleep and wake) Correlation coefficient (within sleep only) Correlation coefficient (across sleep and wake) Correlation coefficient (within sleep only)
Figure 5. High-frequency BOLD oscillation tracks sleep slow waves. (A~B) Representative time courses of high-frequency BOLD
oscillation power (colored lines, each color reflecting one ROI, see Figure 3A for color scales) and slow wave or delta activity (black
lines) from simultaneous fMRI-EEG recording of sleep were plotted, illustrating the correlation between high-frequency BOLD
oscillation and slow wave or delta activity. The figure shows the data of participant S25. (C~F) The time course of high-frequency BOLD
oscillation power or BOLD amplitude was correlated against the time course of slow wave or delta activity, on a participant-by-
participant, ROI-by-ROI basis, across sleep and wake (N = 1500 time points), or within sleep only (N = 1000 time points). The
distributions of correlation coefficient across all participants and ROIs were plotted, where each value reflected the result from a single
participant and a single ROI. At a data length of 1500 and 1000 time points, the threshold correlation coefficient for establishing
statistical significance are 0.051 and 0.062 (before correction for multiple comparisons) or 0.136 and 0.166 (after Bonferroni correction
for 374976 comparisons), respectively. The correlations between high-frequency BOLD oscillation power and slow wave (C) or delta (D)
activity were much larger than the threshold correlation coefficient, and corresponded to T > 19.640, p < 10-20. By contrast, the
correlations between BOLD amplitude and slow wave (E) or delta (F) activity were much smaller than the threshold correlation
coefficient, and corresponded to T < 0.155, p > 0.876. The figure shows the average results across two hemispheres and participants S1 to
S36.
Onset and offset of BOLD oscillations at wake-sleep transitions
Our findings suggest that low-frequency and high-frequency BOLD oscillations provide fMRI
signatures of sleep spindles and slow waves, respectively. As such, the onset and offset of these
BOLD oscillations may reflect which brain regions initiate the process of falling asleep and which
brain regions are the first to wake up. To measure the onset and offset patterns of BOLD oscillations,
we applied cross-correlation analysis to the time course of BOLD oscillation power and calculated the
temporal lag between each pair of brain regions (see Methods for details, Mitra et al., 2014). The
analysis was applied in sliding windows of 104 seconds and step sizes of 2.08 seconds, to capture the
moment-to-moment changes in the lag structure. The average temporal lag that a brain region had
with the rest of brain regions at the transition from wake to sleep (from 62.4 seconds before to 62.4
seconds after sleep onset) and at the transition from sleep to wake (from 62.4 seconds before to 62.4
seconds after sleep offset) indicated the relative timing of each region in the onset and offset of
10bioRxiv preprint first posted online Jan. 26, 2019; doi: http://dx.doi.org/10.1101/531186. The copyright holder for this preprint
(which was not peer-reviewed) is the author/funder, who has granted bioRxiv a license to display the preprint in perpetuity.
It is made available under a CC-BY-NC-ND 4.0 International license.
BOLD oscillations, respectively. The analysis revealed that the onset (Figure 6, Table S5) and offset
(Figure 7, Table S6) of BOLD oscillations took place over a gradual course of about 10 seconds.
(A) Onset of low-frequency BOLD oscillation
Leading regions 12.52 sec Lagging regions
7.05 sec
Lead time
Lead time
5.38 sec 5.38 sec
3.35 sec
0 sec
(B) Onset of high-frequency BOLD oscillation
Leading regions 9.41 sec Lagging regions
5.52 sec
Lead time
Lead time
3.86 sec 3.86 sec
2.62 sec
0 sec
Figure 6. Onset of BOLD oscillations. The temporal lag between different brain regions in the onset of BOLD oscillations, at the transition from
wake to sleep, was projected onto cortical and subcortical surfaces. Low-frequency (A) and high-frequency (B) BOLD oscillations had very different
onset patterns: low-frequency BOLD oscillation first appeared in sensory thalamus, and propagated cortically from sensory to prefrontal regions; by
contrast, high-frequency BOLD oscillation first appeared in midbrain, and propagated cortically from prefrontal to sensory regions. The figure shows
the average results across two hemispheres and participants S1 to S36.
(A) Offset of low-frequency BOLD oscillation
Leading regions 0 sec Lagging regions
3.92 sec
Lag time
Lag time
5.13 sec 5.13 sec
6.36 sec
10.03 sec
(B) Offset of high-frequency BOLD oscillation
Leading regions 0 sec Lagging regions
2.67 sec
Lag time
Lag time
4.80 sec 4.80 sec
6.16 sec
7.82 sec
Figure 7. Offset of BOLD oscillations. The temporal lag between different brain regions in the offset of BOLD oscillations, at the transition from
sleep to wake, was projected onto cortical and subcortical surfaces. Low-frequency (A) and high-frequency (B) BOLD oscillations had similar offset
patterns: they both disappeared first from intralaminar thalamus, and their offsets propagated cortically from prefrontal to sensory regions. The figure
shows the average results of two hemispheres across participants S1 to S36.
11bioRxiv preprint first posted online Jan. 26, 2019; doi: http://dx.doi.org/10.1101/531186. The copyright holder for this preprint
(which was not peer-reviewed) is the author/funder, who has granted bioRxiv a license to display the preprint in perpetuity.
It is made available under a CC-BY-NC-ND 4.0 International license.
At the transition from wake to sleep, low-frequency BOLD oscillation first appeared in sensory
thalamus (lateral geniculate and medial geniculate thalamus, where the oscillation led by 12.52 and
11.83 seconds), and then in other thalamic subregions (pulvinar, lateral posterior and ventral lateral
thalamus, where the oscillation led by 8.88, 8.53 and 8.25 seconds). Soon after, the oscillation
appeared in the cortex and propagated from sensory regions (V1, V2 and LOC, where the oscillation
led by 7.87, 7.56 and 8.12 seconds) to prefrontal regions (superior frontal, middle frontal,
orbitofrontal areas, pars triangularis and pars opercularis, where the oscillation led by 2.68, 2.74, 2.50,
2.32 and 0.99 seconds). By contrast, high-frequency BOLD oscillation first appeared in midbrain
(9.41 seconds lead), followed by other subcortical regions (medial geniculate, lateral dorsal, medial
dorsal, anterior, ventral lateral thalamus, amygdala, pons, medulla, basal forebrain and hypothalamus,
where the oscillation led by 7.91, 6.44, 6.09, 6.19, 5.22, 7.63, 6.19, 5.55, 5.89 and 4.99 seconds). The
oscillation then appeared in the cortex and propagated from prefrontal regions (isthmus cingulate, pars
triangularis, superior frontal, middle frontal and orbitofrontal areas, where the oscillation led by 5.52,
5.17, 4.77, 4.29 and 4.52 seconds) to sensory regions (V1, inferior temporal, middle temporal areas,
precuneus and entorhinal cortex, where the oscillation led by 2.34, 2.12, 1.01, 1.98 and 1.49 seconds).
Whereas low-frequency and high-frequency BOLD oscillations had nearly opposite onset patterns,
they had similar offset patterns. At the transition from sleep to wake, low-frequency BOLD oscillation
disappeared first from intralaminar thalamus (where the oscillation lagged by 0 seconds), and then
from other thalamic subregions (anterior and medial geniculate thalamus, where the oscillation lagged
by 1.62 and 3.11 seconds). Soon after, the oscillation disappeared in the cortex, along the direction
from prefrontal regions (orbitofrontal, middle frontal areas, pars orbitalis, pars triangularis and pars
opercularis, where the oscillation lagged by 2.22, 3.36, 2.81, 2.87 and 3.21 seconds) to sensory
regions (V1, V2, superior temporal sulcus, posterior cingulate, isthmus cingulate, paracentral area and
precuneus, where the oscillation lagged by 6.72, 7.74, 7.05, 7.44, 7.53, 7.54 and 7.65 seconds).
Similarly, high-frequency BOLD oscillation disappeared first from intralaminar thalamus (0 seconds
lag), followed by other thalamic subregions (lateral posterior, ventral posterior, lateral geniculate,
medial dorsal and lateral dorsal thalamus, where the oscillation lagged by 0.83, 1.32, 1.99, 2.17 and
2.19 seconds). The oscillation then disappeared in the cortex, also along the direction from prefrontal
regions (orbitofrontal, middle frontal, super frontal areas and pars orbitalis, where the oscillation
lagged by 3.29, 2.54, 3.17 and 2.42 seconds) to sensory regions (inferior parietal area, superior
temporal sulcus, paracentral area, precuneus, V2 and V1, where the oscillation lagged by 6.71, 6.86,
6.94, 7.04, 7.43 and 7.82 seconds).
DISCUSSION
During the transition from wake to sleep, BOLD activity evolved from a mixed-frequency pattern to
one dominated by two distinct oscillations: a low-frequency (~0.05 Hz) oscillation prominent during
light sleep and a high-frequency (~0.17 Hz) oscillation prominent during deep sleep. The power of the
two BOLD oscillations fluctuated within sleep and correlated with the fluctuations in spindle (sigma)
and slow wave (delta) activities, respectively.
During sleep, low-frequency and high-frequency BOLD oscillations were detected across the whole
brain, both cortically and subcortically, but with different power topographies: low-frequency BOLD
oscillation was more prominent in sensory cortices, whereas high-frequency BOLD oscillation was
strongest in subcortical regions and in prefrontal cortex. The two BOLD oscillations also had different
onset patterns during the falling asleep process: low-frequency BOLD oscillation started in thalamus,
then spread to sensory cortices, and finally to frontal cortex, whereas high-frequency BOLD
oscillation started in midbrain, then spread to thalamus and frontal cortex, and finally to sensory
cortices. The two oscillations had a similar offset pattern during the waking up process, disappearing
first in thalamus, then in frontal cortex, and finally in sensory cortices.
The low-frequency and high-frequency BOLD oscillations reported here provide fMRI signatures of
basic NREM sleep processes, which may be employed to study the mechanism and function of sleep
at a higher spatial resolution and a fuller brain coverage than is achievable using EEG.
12bioRxiv preprint first posted online Jan. 26, 2019; doi: http://dx.doi.org/10.1101/531186. The copyright holder for this preprint
(which was not peer-reviewed) is the author/funder, who has granted bioRxiv a license to display the preprint in perpetuity.
It is made available under a CC-BY-NC-ND 4.0 International license.
A low-frequency BOLD oscillation is associated with sleep spindles
Our analysis revealed the emergence of a low-frequency BOLD oscillation during light sleep, which
was correlated with the intensity of spindle activity. The peak frequency of this BOLD oscillation
(~0.05 Hz) was similar to the reported periodicity of sleep spindles in the EEG (about 2 times per
minute, corresponding to 0.05 Hz, Zeitlhofer et al., 1997, Purcell et al., 2017). While some distinguish
between “fast” and “slow” spindles (Molle et al., 2011), this distinction remains controversial (de
Genaro and Ferrara, 2003, D’Atri et al., 2017). Because BOLD signal displayed a single low-
frequency peak in light sleep, we correlated its time course to broadband EEG spindle activity.
Previous studies have reported low-frequency BOLD oscillations during light sleep in human sensory
cortices (Horovitz et al., 2008, Davis et al., 2016). The power of such BOLD oscillations was found to
increase from birth to 1-2 years of age and correlate with the improvements in cognitive performance
(Alcauter et al., 2015). Although previous studies did not examine the relations between such BOLD
oscillations and sleep spindles, it is intriguing that sleep spindles emerge during the same age range
(1-2 years old, Tanguay et al., 1975, Dan and Boyd, 2006). The co-emergence of low-frequency
BOLD oscillation and EEG spindles during sleep in infancy may reflect the development of thalamo-
cortical circuits key to both spindle generation (Steriade, 2000, D’Atri et al., 2017) and cognitive
function (Alcauter et al., 2014).
Low-frequency BOLD oscillation was detected during sleep in all cortical and subcortical regions
examined, consistent with the widespread detection of sleep spindles in intracranial recordings
(Bazhenov et al., 2000, Andrillon et al., 2011, Nir et al., 2011). The power topography of low-
frequency BOLD oscillation also mirrored that of spindle activity, with large-amplitude spindles
reported intracranially in thalamus, sensory and orbitofrontal cortices (Bazhenov et al., 2000,
Andrillon et al., 2011, Nir et al., 2011, Piantoni et al., 2017), and reduced occurrence of spindles in
parahippocampal cortex (Andrillon et al., 2011). Moreover, the prominence of low-frequency BOLD
oscillation in thalamus and sensory cortices is in line with previous EEG-fMRI studies of sleep
spindles (Schabus et al., 2007, Caporro et al., 2012) and with a proposed role of spindles in sensory
disconnection during sleep (Schabus et al., 2012).
A high-frequency BOLD oscillation is associated with sleep slow waves
Spectral analysis of BOLD signal further revealed the emergence of a high-frequency BOLD
oscillation during deep sleep, which was correlated with the intensity of slow wave activity. The peak
frequency of this high-frequency BOLD oscillation (~0.17 Hz) was similar to the reported periodicity
of EEG slow waves (about 7 times per minute, corresponding to 0.17 Hz, Mensen et al., 2016). A
modulation of EEG slow waves can also occur at other slow EEG frequencies (Achermann and
Borbely, 1997), but we did not find corresponding BOLD signal peaks during sleep.
Using direct current EEG recordings, a previous study demonstrated large-scale oscillations in the
frequency range of 0.02 to 2 Hz during human sleep, which were synchronized with the occurrence of
K complexes (Vanhatalo et al., 2004). Moreover, previous EEG-fMRI study reported correlations
between slow BOLD fluctuation (bioRxiv preprint first posted online Jan. 26, 2019; doi: http://dx.doi.org/10.1101/531186. The copyright holder for this preprint
(which was not peer-reviewed) is the author/funder, who has granted bioRxiv a license to display the preprint in perpetuity.
It is made available under a CC-BY-NC-ND 4.0 International license.
2016). The power topography of high-frequency BOLD oscillation also mirrored that of slow wave
activity, and some of the regions showing the strongest high-frequency BOLD oscillation, including
medial prefrontal cortex, parahippocampal cortex, and brainstem, were also highlighted in previous
EEG-fMRI studies of sleep slow waves (Dang-Vu et al., 2008, Jahnke et al., 2012). The subgenual
area, an orbitofrontal region, is notable for showing an especially strong sleep BOLD oscillation in
both the low-frequency and the high-frequency range. Intriguingly, intracranial studies suggested that
orbitofrontal cortex has among the highest amplitudes of sleep spindles and is involved in their
propagation (Piantoni et al., 2017). Moreover, high-density EEG studies showed that orbitofrontal
cortex is a hot spot for the origin and the propagation of sleep slow waves (Massimini et al., 2004,
Murphy et al., 2009).
The power topography of high-frequency BOLD oscillation may already be interpreted with respect
to several basic brain functions that can be influenced by the occurrence of slow waves. EEG slow
waves reflect the synchronous down states across large populations of cells, which impairs neuronal
responsiveness (Tononi and Massimini, 2008). Accordingly, the strong high-frequency BOLD
oscillation in prefrontal cortex, which mirrors the large frontal slow wave activity, may explain the
lack of responsiveness that is a hallmark of normal sleep (Boly et al., 2017). By contrast, the weak
BOLD oscillation in several regions of the posterior cortex is consistent with the role of a posterior
hot zone in supporting dream consciousness during two thirds of NREM sleep (Siclari et al., 2017). In
turn, a strong BOLD oscillation in hippocampus and parahippocampal cortex may explain why most
of these sleep dreams are quickly forgotten after awakening (Siclari et al., 2013). Based on the
transient local decreases in high-frequency BOLD oscillation power, it may be possible to investigate
which brain regions support specific contents of consciousness during sleep with much better spatial
resolution than EEG. It will also be important to determine whether high-frequency BOLD oscillation
may be present in primary sensory-motor areas during REM sleep (Chow et al., 2013), consistent with
the recent demonstration of slow waves in these areas in both humans and animals (Funk et al., 2017,
Baird et al., 2018) and potentially accounting for sensory-motor disconnection during an activated
brain state.
Onset and offset of low-frequency and high-frequency BOLD oscillations
The low-frequency and high-frequency BOLD oscillations observed during sleep differed not only in
their power topography but also in their propagation patterns. At the transition from wake to sleep,
thalamus was the first brain region to display low-frequency BOLD oscillation. This result is
reminiscent of the intracranial finding that the inactivation of thalamus precedes that of the cortex
during the falling asleep process (Magnin et al., 2010). In animals, reticular thalamic neurons have
pacemaker properties that allow them to generate spindle-frequency oscillations through interactions
with principal thalamic cells, especially within sensory relay thalamic nuclei (Sheroziya and
Timofeev, 2014). The thin reticular thalamic nucleus could not be resolved in our fMRI data (Figure
S1, Table S4), but the early onset of low-frequency BOLD oscillation in sensory thalamus (Figure 6,
Table S5) is fully consistent with the cellular mechanism of spindle generation. Future studies using
higher resolution EPI sequences are warranted to further investigate the differences in BOLD
oscillatory behavior between different thalamic nuclei.
At the transition from wake to sleep, high-frequency BOLD oscillation was first initiated in the
midbrain. Intriguingly, a unit recording study of midbrain reticular formation neurons in sleeping cats
has found rhythmic fluctuations in neuronal firing rates with a modal period of 11 seconds (Oakson
and Steriade, 1982, 1983), corresponding exactly to the BOLD oscillation frequency of ~0.17 Hz
observed here during sleep. Such rhythmic fluctuations in midbrain firing rates were found to be
phase-locked to increases in the amplitudes of cortical slow waves during sleep, but not during wake
(Oakson and Steriade, 1983). Although we could not delineate midbrain reticular formation with our
fMRI data, the frequency of the observed BOLD oscillation (~0.17 Hz) and its correlation with EEG
slow wave activity are fully consistent with these unit recordings studies in cats. The fact that
midbrain regions were the first to manifest high-frequency BOLD oscillation is also consistent with
the central role of upper brainstem reticular formation in the regulation of normal arousal (Moruzzi
14bioRxiv preprint first posted online Jan. 26, 2019; doi: http://dx.doi.org/10.1101/531186. The copyright holder for this preprint
(which was not peer-reviewed) is the author/funder, who has granted bioRxiv a license to display the preprint in perpetuity.
It is made available under a CC-BY-NC-ND 4.0 International license.
and Magoun, 1949). An important issue is whether fluctuations in the firing of this midbrain region
are responsible for modulating the excitability of the entire forebrain, thereby providing a common
input that affects the likelihood of local and global slow waves (Bernardi et al., 2018). Another
question is whether these midbrain firing fluctuations are generated endogenously and through which
mechanisms.
Whereas low-frequency and high-frequency BOLD oscillations had very different onset patterns, they
had similar offset patterns. At the transition from sleep to wake, intralaminar thalamus was the first
brain region to show the offset of both low-frequency and high-frequency BOLD oscillations. During
sleep, intralaminar thalamus also displayed a strong oscillation in both the low-frequency and the
high-frequency range. In animals, electrical or chemical stimulation of intralaminar thalamic nuclei
can reliably produce awakenings from sleep (Steriade and Demetrescu, 1960, 1961). During sleep,
instead, the intralaminar thalamus is inhibited (Steriade et al., 1993). Human data also indicate that
intralaminar thalamus is involved in the regulation of arousal as part of an anterior forebrain
mesocircuit involving both subcortical and frontal regions (Saalmann, 2014, Schiff, 2010). In addition
to intralaminar thalamus, other brain regions involved in arousal, such as hypothalamus and basal
forebrain (Saper and Fuller, 2017, Scammel et al., 2017, Liu et al., 2018), were also among the first to
show an offset of both low-frequency and high-frequency BOLD oscillations around the time of
awakening.
Potential mechanisms underlying BOLD oscillations in sleep
Overall, the present findings are highly consistent with previous evidence, obtained using several
different approaches, about brain regions showing marked spindle activity or marked slow wave
activity during sleep, respectively. They are also consistent with previous data about the onset and
offset of spindles and slow waves. Our results suggest that the time courses of low-frequency and
high-frequency BOLD oscillations were largely independent during sleep, with low-frequency BOLD
oscillation correlating strongly with spindle activity and high-frequency BOLD oscillation with slow
wave activity, but not the other way around. At the EEG level, an inverse temporal relationship
between spindle activity and slow wave activity has often been reported, and their topography is also
different (Werth et al., 1997, Tinguely et al., 2006, Purcell et al., 2017). On the other hand, sleep
spindles are partly nested by sleep slow waves (Steriade, 2000), and both can be nested within lower
frequency fluctuations. Thus, it is possible that the overall low-frequency and high-frequency
fluctuations of excitability may have different, largely independent generators, but that the occurrence
of individual slow wave up states may still increase the likelihood of spindle occurrence (Steriade,
2005).
The low-frequency and high-frequency BOLD oscillations were observed across the whole brain and
provide fMRI signatures of sleep spindles and slow waves, respectively. However, it should be
emphasized that the detection of local BOLD oscillation during sleep within a brain region cannot be
expected to have a one-to-one correspondence with the occurrence of local EEG spindles or slow
waves, but at best to reflect the grouping of spindles and slow waves by lower frequency fluctuations.
In our study, both low-frequency and high-frequency BOLD oscillations were detected in subcortical
regions, such as cerebellum and brainstem, where spindles and slow waves have not previously been
recorded using either local EEG or unit recordings. Three main possibilities should be considered.
First, it is possible that the presence of a BOLD oscillation is a signature of the occurrence of spindles
or slow waves that had not been investigated or detected. This possibility is most likely for cortical
regions whose sleep-related activity has not yet been documented, especially in the human brain.
Slow fluctuations in BOLD signal can relate to local fluctuations in neuronal firing (Kim et al., 2004,
Nir et al., 2007), and in isoflurane-anesthetized rats BOLD signal traced neuronal firing time-locked
to EEG slow waves (Schwalm et al., 2017). Conceivably, the reduced energy needs during slow wave
down states, related to reduced glial energetic demands for the repolarization cell membranes after
action potentials (Wells et al., 2015), may be partly responsible for the correlation between the power
of BOLD oscillation and the occurrence of sleep slow waves.
15You can also read