Spatial Genetic Structure and Demographic History of the Dominant Forest Oak Quercus fabri Hance in Subtropical China - Frontiers
←
→
Page content transcription
If your browser does not render page correctly, please read the page content below
ORIGINAL RESEARCH
                                                                                                                                           published: 04 February 2021
                                                                                                                                         doi: 10.3389/fpls.2020.583284

                                             Spatial Genetic Structure and
                                             Demographic History of the
                                             Dominant Forest Oak Quercus fabri
                                             Hance in Subtropical China
                                             Xiao-Dan Chen 1† , Jia Yang 1† , Yu-Fan Guo 1 , Yue-Mei Zhao 2 , Tao Zhou 3 , Xiao Zhang 1 ,
                                             Miao-Miao Ju 1 , Zhong-Hu Li 1 and Gui-Fang Zhao 1*
                                             1
                                              Key Laboratory of Resource Biology and Biotechnology in Western China (Ministry of Education), College of Life Sciences,
                                             Northwest University, Xi’an, China, 2 School of Biological Sciences, Guizhou Education University, Guiyang, China, 3 School
                                             of Pharmacy, Xi’an Jiaotong University, Xi’an, China

                                             Oak trees (Quercus L.) are important models for estimating abiotic impacts on the
                                             population structure and demography of long life span tree species. In this study,
                                             we generated genetic data for 17 nuclear microsatellite loci in 29 natural populations
                         Edited by:          of Quercus fabri to estimate the population genetic structure. We also integrated
                     Susann Wicke,           approximate Bayesian computation (ABC) and ecological niche analysis to infer the
        Humboldt University of Berlin,
                           Germany           population differentiation processes and demographic history of this oak species. The
                      Reviewed by:           genetic analyses indicated two genetic clusters across the 29 populations collected,
        Antonio Gonzalez-Rodriguez,          where most approximately corresponded to the intraspecific differentiation among
      National Autonomous University
                   of Mexico, Mexico
                                             populations from western and eastern China, whereas admixed populations were mainly
        Hernando Rodriguez-Correa,           found in central mountains of China. The best model obtained from hierarchical ABC
      National Autonomous University         simulations suggested that the initial intraspecific divergence of Q. fabri potentially
                   of Mexico, Mexico
                                             occurred during the late Pliocene (ca. 3.99 Ma) to form the two genetic clusters, and
                   *Correspondence:
                        Gui-Fang Zhao        the admixed population group might have been generated by genetic admixture of
                   gfzhao@nwu.edu.cn         the two differentiated groups at ca. 53.76 ka. Ecological analyses demonstrated clear
     † These   authors have contributed      differentiation among the Q. fabri population structures, and association estimations
                    equally to this work
                                             also indicated significant correlations between geography and climate with the genetic
                   Specialty section:        variation in this oak species. Our results suggest abiotic influences, including past
         This article was submitted to       climatic changes and ecological factors, might have affected the genetic differentiation
     Plant Systematics and Evolution,
               a section of the journal
                                             and demographic history of Q. fabri in subtropical China.
            Frontiers in Plant Science
                                             Keywords: ecological differentiation, evolutionary history, intraspecific divergence, Quercus, subtropical China
            Received: 14 July 2020
      Accepted: 22 December 2020
       Published: 04 February 2021          INTRODUCTION
                             Citation:
          Chen X-D, Yang J, Guo Y-F,        Historical and ecological factors have left complex imprints on the genetic structure and
Zhao Y-M, Zhou T, Zhang X, Ju M-M,          demographic history of extant species (e.g., Petit et al., 2002; Chen et al., 2008; Zhang et al., 2019).
  Li Z-H and Zhao G-F (2021) Spatial        These factors include geographical and/or climatic processes, such as the uplift of the mountains,
 Genetic Structure and Demographic          morphological reconstruction, and climatic oscillations associated with ice ages. The interactions
  History of the Dominant Forest Oak
                                            among these processes over varying temporal scales may have led to the non-random distributions
  Quercus fabri Hance in Subtropical
  China. Front. Plant Sci. 11:583284.
                                            of plant species within or throughout landscapes (Eiserhardt et al., 2011). Indeed, spatial and
      doi: 10.3389/fpls.2020.583284         temporal changes in these abiotic factors could have influenced genetic variation and population

Frontiers in Plant Science | www.frontiersin.org                                    1                                        February 2021 | Volume 11 | Article 583284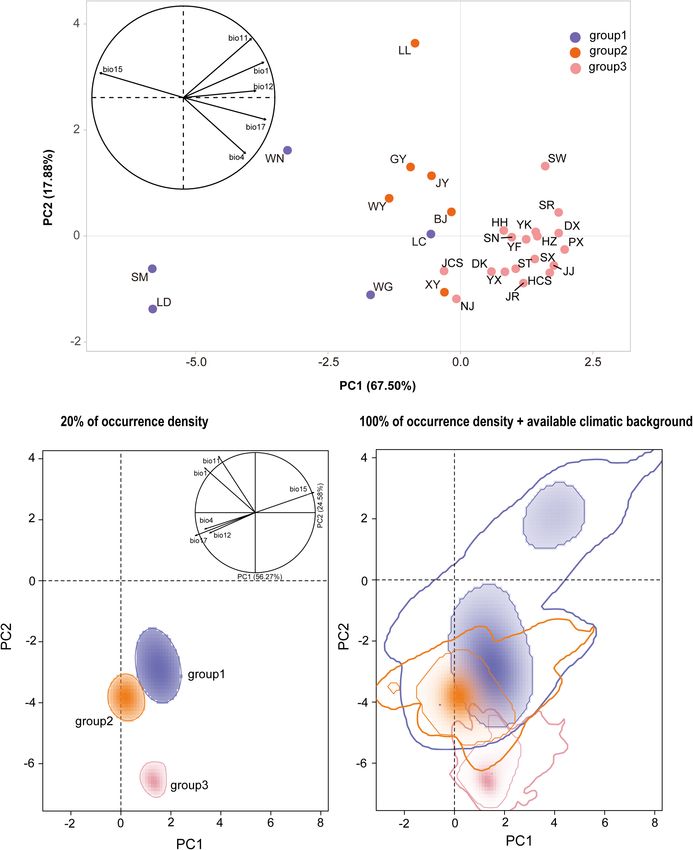
Chen et al.                                                                                                      Evolutionary History of Deciduous Oak

structures by creating physical barriers and novel ecological                 deciduous tree species distributed in subtropical China. The
niches during the evolutionary history of species (e.g., Harmon               hardwood obtained from Q. fabri is an excellent material for
et al., 2008; Ortego et al., 2012, 2015; Liu et al., 2013; Sun                constructing furniture and flooring. This species is regarded as
et al., 2015; Du et al., 2017; Liu et al., 2019a,b). Previous                 a pioneer species during secondary succession in the recovery of
studies have suggested that local adaptation to varying climate               EBLF in China due to its ability to grow in barren soils, as well
or ecological niches was a major driver of the geographical                   as its high capacity for sprouting and tolerance of environmental
patterns and current genetic structure of plant species (Ortego               disturbance. In addition, Q. fabri is used to control soil erosion
et al., 2015; Hipp et al., 2018). In addition, various ecological             in mountainous areas of subtropical China (Wu et al., 2005;
factors such as precipitation and temperature may have been                   He et al., 2008; Shi et al., 2019). Moreover, Q. fabri is an
responsible for driving intraspecific differentiation (Yang et al.,           important component of urban landscapes in China because of its
2018; Li et al., 2019).                                                       colorful leaves. Thus, Q. fabri is an ecologically and economically
   In China, the subtropical zone covers the area from 22 to                  important tree species, but its populations occur in patches of
34◦ N, and it is characterized as a heterogeneous environment                 forests fragmented by agriculture and human disturbance, and
with complex topography (Qiu et al., 2011). It is considered that             thus, there is an urgent need to conserve this endemic oak
this region was not influenced by the massive ice sheet during                species in China.
the glaciation period, but it was affected by episodic uplifts of                 A previous phylogeographic study showed that Q. fabri might
the Qinghai–Tibet Plateau (QTP) during the late Pliocene to                   have contracted into refugia during the glacial period and
the early Pleistocene and associated glaciation events during the             expanded in the warm period (Chen et al., 2020). Evolutionary
Quaternary (Shi et al., 1986; Fu et al., 2014). In fact, the rise of          simulations based on several chloroplast makers also suggested
the QTP dramatically modified the global climate (Ruddiman                    that the intraspecific differentiation of this oak species may
and Kutzbach, 1989; Shi et al., 1999), including triggering and               date back to the late Pliocene but with a weak phylogeographic
intensifying the Asian monsoon, furthermore, and this process                 structure (Chen et al., 2020). However, previous research into
also significantly affected the evolution of plants (Liu et al., 2013).       the evolutionary history of this species was limited by the
In addition, the rise of QTP remodeled the geomorphology of                   sample size employed (293 individuals). Due to the widespread
China and changed the terrain into a hypsographic ladder in three             distribution and dominant position of subtropical deciduous
steps ranging from high in the west to low in the east, thereby               forests in China. Q. fabri may be useful model for evaluating
causing the climatic heterogeneity between western and eastern                the impact of the stepped geomorphology in subtropical China
China and the longitudinal differentiation of the flora in this               on the spatial genetic structure and demographic history of
region (e.g., Sun et al., 2014; Zhang et al., 2018).                          deciduous tree species.
   More recent climatic fluctuations during the Quaternary                        In the current study, we used 17 nuclear simple sequence
may also have affected intraspecific differentiation because                  repeat (SSR) loci to assess the genetic variation in Q. fabri based
populations could have contracted into refugia during glacial                 on 29 populations (490 individuals) sampled throughout its
periods. These climate oscillations influenced the population                 distribution range in subtropical China. The special goals of this
demography by causing range shifts and possibly driving                       study were to (1) determine the genetic diversity and population
local adaptation (Ye et al., 2019). Phylogeographic analyses at               structure of Q. fabri, (2) infer its intraspecific evolutionary
intraspecific levels have suggested that the population genetic               history and evaluate the effects of geological and/or past climatic
structure and demography were also profoundly affected by                     factors, and (3) test whether environment factors (geography and
the complex geographical, climatic, and ecological factors in                 climate) contributed to the current distribution.
subtropical China (Shi et al., 2014; Sun et al., 2014; Gong et al.,
2016; Ye et al., 2019). However, these previous studies focused
on the evergreen broad-leaved forest (EBLF) because of its high               MATERIALS AND METHODS
abundance, and thus our understanding is unclear regarding how
the interplay between topography and climatic events led to the               Population Sample and DNA Extraction
intraspecific differentiation of deciduous tree species in this area          We sampled leaf material from 29 populations covering the range
and their evolutionary patterns.                                              of Q. fabri in subtropical China. At each site, mature foliage was
   Quercus species are regarded as powerful models for studying               sampled from 6 to 21 individuals spaced > 100 m apart and
the adaptation of forest trees to variable environments because               dried rapidly with silica gel, before storing at −10◦ C until DNA
of their wide geographical range and the large variations in the              isolation, where 490 individuals were sampled in total (Table 1
climatic and edaphic conditions in the areas that they occupy                 and Figure 1). Voucher specimens of each population were
(Gailing et al., 2009; Sork et al., 2010; Lagache et al., 2013;               stored in the Evolutionary Botany Lab of Northwest University.
Cavender-Bares, 2019). The genus Quercus comprises more than                  Total genomic DNA was isolated using a Plant Genomic DNA
400 species, and the highest diversity is observed in the Americas            Extraction Kit (Tiangen, Beijing, China).
(ca. 220 species), particularly in Mexico (ca. 161 species) and
Southeast Asia (ca. 130–160 species) (Menitsky, 1984; Luo and                 PCR Amplification and Simple Sequence
Zhou, 2000; Valencia-Ávalos, 2004). Section Quercus accounts                  Repeat Genotyping
for most of the species in North America and about 30 species                 All 490 samples were amplified at 17 SSR nuclear loci
in Eurasia (Denk et al., 2017). Quercus fabri belongs to section              (see details in Supplementary Note 1 and Supplementary
Quercus, and it is an economically important and dominant                     Table 1). PCR amplification was performed in a total volume

Frontiers in Plant Science | www.frontiersin.org                          2                                  February 2021 | Volume 11 | Article 583284
Chen et al.                                                                                                                         Evolutionary History of Deciduous Oak

of 20 µl comprising 11 µl of 2 × Taq PCR MasterMix,                                      populations, H S ; total genetic diversity, H T ) were obtained for
0.3 µl of each primer, 1 µl of primer template (10–50                                    each microsatellite locus with FSTAT v2.9.3 (Goudet, 2001).
ng), and 7.4 µl double-distilled H2 O. All amplifications                                We also calculated the observed heterozygosity (H O ), expected
were conducted using a PTC-2000 thermal cycler (MJ                                       heterozygosity (H E ), and polymorphism information content
Research) as follows: 5 min at 94◦ C, followed by 32 cycles                              for each microsatellite locus with CERVUS v3.0.7 (Marshall
at 94◦ C for 40 s, at the specific annealing temperature                                 et al., 1998). GENALEX v6.5 (Peakall and Smouse, 2012)
(Tm) for each marker (Supplementary Table 1), and at                                     was employed to estimate the population genetic diversity,
72◦ C for 90 s, with a final extension at 72◦ C for 10 min.                              including the number of different alleles (Na), number of
The final PCR products were sequenced using an ABI                                       effective alleles (Ne), H O , and H E . The within-population
3730 XL Analyzer (Applied Biosystems, Foster City, CA,                                   inbreeding coefficient F IS was estimated with GENEPOP v4.2
United States) and analyzed with GENEMARKER v2.2.0                                       (Raymond and Rousset, 1995). Associations among the genetic
(Holland and Parson, 2011).                                                              diversity indices (H O and H E ) with population locations
                                                                                         (latitude and longitude) were investigated using a simple linear
Genetic Diversity Analysis                                                               regression analysis.
MICROCHECKER v2.2.3 (Van Oosterhout et al., 2004) was                                        The inverse distance weighted (IDW) interpolation function
used to test the presence of null alleles for all loci. Linkage                          implemented in the Geographic Information System (GIS)
disequilibrium (LD) and departure from Hardy–Weinberg                                    software ArcGIS 9.3 (ESRI, Redlands, CA, United States) was
equilibrium were evaluated using POPGENE v1.32 (Yeh                                      used to estimate the geographic patterns of H O and H E for all
et al., 1999). Genetic diversity indices (genetic diversity within                       29 Q. fabri populations.

TABLE 1 | Genetic diversity of 29 populations of Quercus fabri estimated based on 17 microsatellite loci.

Pop           Location                      Latitude      Longitude        N         Na         Ne           I         HO          HE        PPL (%)         F IS       Qp
                                              (◦ N)           (◦ E)

LD            Luding, Sichuan                29.57          102.02         19      4.824       2.972      1.083       0.383      0.533        94.12        0.306       0.95
WN            Weining, Guizhou               26.86          104.28         20      5.176       2.833      1.044       0.350      0.497        94.12        0.319       0.95
LC            Enshilichuan, Hubei            30.27          108.70         20      5.706       3.606      1.278       0.444      0.609        94.12        0.296       0.95
SM            Shimen, Hunan                  29.94          110.78         20      6.176       3.878      1.312       0.370      0.601        94.12        0.406       0.80
WG            Wugang, Henan                  33.33          113.54         20      4.941       3.123      1.108       0.341      0.548        88.24        0.400       0.95
BJ            Baojing, Hunan                 28.60          109.49         20      6.412       3.771      1.317       0.400      0.604        94.12        0.361       0.70
LL            Longlin, Guangxi               24.79          105.03         16      5.529       3.959      1.288       0.419      0.609        94.12        0.341       0.56
GY            Guiyang, Guizhou               26.61          106.69         20      6.176       3.780      1.289       0.380      0.591        94.12        0.379       0.10
XY            Xinayang, Henan                31.83          114.08         20      5.294       3.390      1.189       0.367      0.570        100.00       0.378       0.60
WY            Wanyuan, Sichuan               31.80          107.68         12      4.176       2.527      0.954       0.329      0.482        88.24        0.356       0.75
JY            Jinyun, Sichuan                29.83          106.40         17      5.294       3.086      1.160       0.349      0.562        94.12        0.407       0.47
HH            Huaihua, Hunan                 27.56          109.96         20      6.000       3.615      1.236       0.384      0.574        100.00       0.355       0.80
SN            Suining, Hunan                 26.42          110.06          6      3.353       2.609      0.902       0.373      0.484        82.35        0.314         1
DK            Hongjiangdongkou,Hunan         27.13          110.56         17      5.529       3.285      1.139       0.397      0.525        94.12        0.273       0.88
HCS           Changsha, Hunan                28.18          112.93         17      6.118       3.617      1.207       0.360      0.538        94.12        0.357       0.88
PX            Pingxiang, Jiangxi             27.84          113.89         20      6.353       3.490      1.186       0.339      0.528        100.00       0.380       0.95
YF            Yifeng, Jiangxi                28.48          114.55          9      4.471       2.904      1.015       0.373      0.494        94.12        0.300         1
YX            Yongxiu, Jiangxi               29.10          115.59         18      5.706       3.313      1.161       0.344      0.538        94.12        0.386       0.89
JJ            Jiujiang, Jiangxi              29.61          115.91         21      6.235       3.519      1.191       0.454      0.541        100.00       0.185         1
ST            Shitai, Anhui                  30.21          117.49         16      6.176       3.919      1.239       0.441      0.555        94.12        0.236       0.94
DX            Dexing, Jiangxi                28.93          117.72         19      5.059       3.251      1.058       0.380      0.499        94.12        0.261         1
SR            Shangrao, Jiangxi              28.45          117.98          8      4.765       3.147      1.100       0.390      0.532        88.24        0.328         1
SW            Shaowu, Fujian                 27.08          117.27         19      6.118       3.702      1.208       0.410      0.547        94.12        0.277         1
NJ            Nanjiang, Jiangsu              32.08          118.85         15      5.294       3.398      1.172       0.319      0.559        100.00       0.458       0.93
JR            Jurong, Jiangsu                32.13          119.09         20      5.824       3.520      1.175       0.281      0.535        94.12        0.494       0.95
HZ            Hangzhou, Zhejiang             30.28          120.20          8      3.824       2.804      0.949       0.309      0.479        94.12        0.413       0.88
SX            Shaoxing, Zhejiang             29.71          120.23         18      5.706       3.501      1.137       0.383      0.518        94.12        0.287         1
YK            Yongkang, Zhejiang             28.88          120.03         19      5.294       3.105      1.069       0.312      0.495        94.12        0.393         1
JCS           Changshu, Jiangsu              31.66          120.72         16      5.353       3.372      1.203       0.365      0.575        94.12        0.393       0.81
Mean                                                                               5.410       3.345      1.151       0.371      0.542        94.12        0.346

N, sample size; Na, the number of alleles; Ne, number of effective alleles; I, Shannon’s Information Index; HO , observed heterozygosity; HE , expected heterozygosity; PPL,
percentage of polymorphic loci; FIS , inbreeding coefficient; Qp, proportion of genetically pure individuals in each population.

Frontiers in Plant Science | www.frontiersin.org                                     3                                         February 2021 | Volume 11 | Article 583284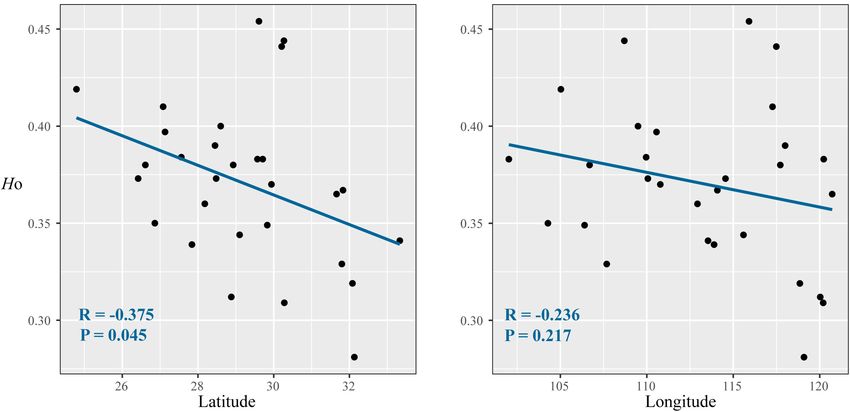
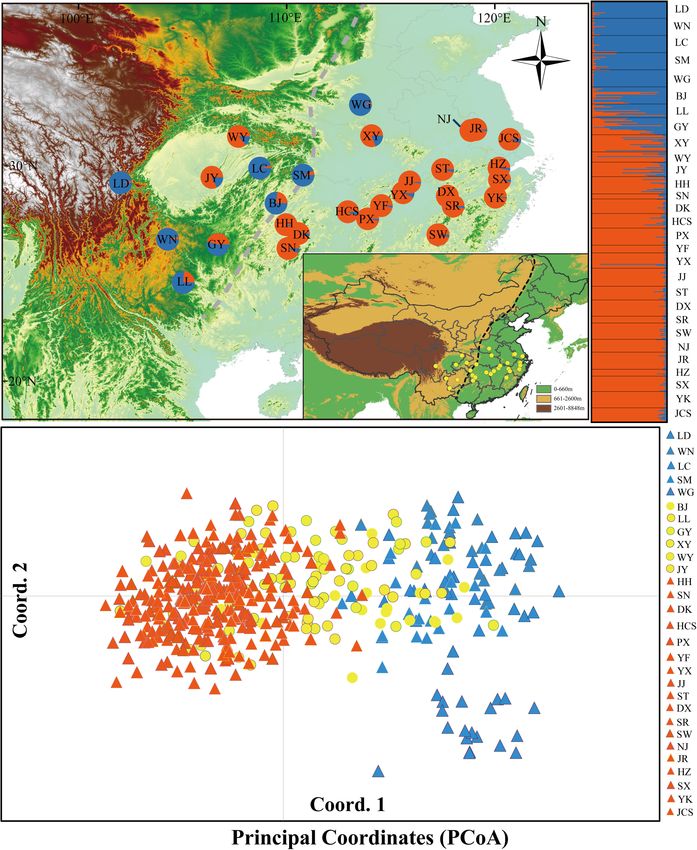
Chen et al.                                                                                                                  Evolutionary History of Deciduous Oak

  FIGURE 1 | (A) Color-coded groupings of 29 Quercus fabri populations according to the structure with the most likely group number, K = 2. (B) Principal
  coordinates analysis (PCoA). The dashed line represents the boundary between the second steppe region and the third steppe region in China. The blue and orange
  triangles represent the populations of group 1 and group 3, respectively; the yellow circles represent the populations of group 2.

Frontiers in Plant Science | www.frontiersin.org                                4                                       February 2021 | Volume 11 | Article 583284
Chen et al.                                                                                                    Evolutionary History of Deciduous Oak

   We also conducted principal coordinates analysis (PCoA) with            population at time (ta). Scenario 2 and Scenario 3: hierarchical
GENALEX v6.5 (Peakall and Smouse, 2012), where a pairwise,                 divergence models where population group 2 merged with group
individual-by-individual genetic distance matrix was calculated            1 (or group 3) at t1 and then group 3 with group 1 at ta. Scenario
using the genetic distance option. Analysis of molecular variance          4 and Scenario 5: hierarchical divergence models where admixed
(AMOVA) was performed using R-statistics in ARLEQUIN                       population group 2 merged with group 1 (or group 3) at t1 and
v3.11 to infer the genetic differentiation among populations.              then group 3 (or group 1) with the admixed group (group 2) at
The significance of fixation indices was tested based on 1,000             ta. Scenario 6: isolation with admixture model where population
permutations for the AMOVA results (Excoffier et al., 2005).               group 2 was considered to be a genetic admixture, and this group
                                                                           was hypothesized to be the admixture of group 1 and group 3
Genetic Structure and Gene Flow                                            at t1, and the two pure groups (groups 1 and 3) then merged at
Analysis                                                                   ta. Scenario 7 and Scenario 8: mysterious group 4 (referred to as
                                                                           the ghost ancestor) was assumed to have existed, where admixed
The STRUCTURE v2.3.4 software (Pritchard et al., 2000)
                                                                           group 2 was considered to be the admixture of group 1 (or group
was used to examine the range-wide genetic structure among
                                                                           3) and mysterious group 4 at t1, and group 3 then merged with
populations of Q. fabri. Eight independent runs were performed
                                                                           group 1 and mysterious group 4 at ta.
for each K from 1 to 15 with 200,000 burn-in steps followed
                                                                               We performed 100,000 simulations for each scenario in DIY-
by 500,000 Markov chain Monte Carlo (MCMC) steps. The
                                                                           ABC. To identify the most likely model, we selected 1% of
STRUCTURE output was analyzed and visualized by using
                                                                           the stimulated data sets closest to the observed data by logistic
Structure Harvester1 , and the optimal number of clusters (best
                                                                           regression and estimated the relative posterior probability (PP)
K) was estimated according to Pritchard et al. (2000) and Evanno
                                                                           with 95% confidence intervals (95% CI) for each scenario. In
et al. (2005). Graphics were displayed with the DISTRUCT
                                                                           order to estimate type I and type II errors in the power of
program (Rosenberg, 2004).
                                                                           model selection, we simulated 500 pseudo-observed data sets
   In order to infer historical gene flow (Nm) patterns,
                                                                           for the plausible scenarios. For the best supported scenario,
MIGRATE-N v3.6 (Beerli, 2006) was used to estimate the effective
                                                                           we estimated the posterior distributions of all parameters and
population sizes (θ) and mutation scaled immigration (M) among
                                                                           evaluating the relative median of absolute errors (RMAE) using
the groups identified by STRUCTURE. In this analysis, we
                                                                           500 pseudo-observed data sets from the simulated data sets. We
used a maximum likelihood procedure and a Brownian motion
                                                                           also estimated the goodness of the fit for 1,000 simulated pseudo-
microsatellite model with 10 short chains following 5,000 steps
                                                                           observed data sets by principal component analysis (PCA)
and three long chains of 50,000 iterations. We sampled every 100
                                                                           (Cornuet et al., 2010) for model assessment.
steps under a constant mutation model and discarded the first
10,000 records as a burn-in.
                                                                           Isolation-by-Distance and
Approximate Bayesian Computation                                           Isolation-by-Environment Analyses
                                                                           We analyzed the isolation-by-distance (IBD) and isolation-by-
(ABC) of Species Demography                                                environment (IBE) patterns among Q. fabri populations with
Based on the inferred STRUCTURE result (optimal K = 2,
                                                                           Mantel tests to evaluate the correlations between genetic and
Supplementary Figure 1), we proposed a hierarchical population
                                                                           geographical/ecological distances. To evaluate the ecological
structure for the three population groups of Q. fabri according to
                                                                           distance, we selected six bioclimatic factors (we focused on
the following steps. For K = 2, we checked the q-value for inferred
                                                                           the temperature and precipitation because these two factors
ancestry in the data set for each individual in the two genetic
                                                                           have important effects on growth and flowering in tree
clusters, and samples where q ≥ 0.9 and q < 0.9 were regarded
                                                                           species) that contributed to the phylogenetic patterns and
as genetically pure and introgressed individuals, respectively
                                                                           geographic distribution of Quercus species (Xu et al., 2013,
(Lepais et al., 2009; Peñaloza-Ramírez et al., 2010; Besnard et al.,
                                                                           2016; Qian and Sandel, 2017; Yang et al., 2018): annual mean
2014; Tsuda et al., 2015). We then calculated the proportion
                                                                           temperature (BIO1), temperature seasonality (BIO4), mean
of pure individuals (Qp) for each collected population and
                                                                           temperature of coldest quarter (BIO11), annual precipitation
employed a threshold of 0.80 to partition Q. fabri populations,
                                                                           (BIO12), precipitation seasonality (BIO15), and precipitation
where those with Qp-values ≥ 0.8 were treated as relatively
                                                                           of the driest quarter (BIO17). Climatic variables at 2.5 arc-
“pure” populations, and populations with Qp-values < 0.8 were
                                                                           min resolution were obtained from the WorldClim version
regarded as “admixed” populations. Given this threshold, the 29
                                                                           22 . The pairwise population F ST distance was generated as
oak populations were partitioned into three population groups
                                                                           the genetic distance with ARLEQUIN v3.11 (Excoffier et al.,
comprising two “pure” population groups and an “admixed”
                                                                           2005). The geographical distance and bioclimatic distance
population group for demographic simulation with the ABC in
                                                                           matrices were estimated using the Euclidean method in
DIYABC v2.0.4 (Cornuet et al., 2014).
                                                                           PASSaGE v2 (Rosenberg and Anderson, 2011). Correlations
   Eight alternative demographic history scenarios were
                                                                           among distance matrices were then estimated using a two-
simulated for the three Q. fabri population groups
                                                                           tailed Mantel test with 999 permutations. After detecting a
(Supplementary Table 2 and Supplementary Figure 2). Scenario
                                                                           significant correlation between the distances for geographical and
1: three population groups diverged from a common ancestral
                                                                           bioclimatic factors (r = 0.637, p = 0.001), we also performed
1                                                                          2
    http://taylor0.biology.ucla.edu/structureHarvester/                        http://www.worldclim.org/

Frontiers in Plant Science | www.frontiersin.org                       5                                   February 2021 | Volume 11 | Article 583284
Chen et al. Evolutionary History of Deciduous Oak
a partial Mantel test between the genetic differentiation and SSR loci yielded 217 alleles in 490 Q. fabri individuals, and
geographical distances/bioclimatic factors where the bioclimatic the other genetic diversity parameters are summarized in
or geographical matrix was controlled individually. These Mantel Supplementary Table 4. Estimates of genetic diversity showed
tests were implemented in PASSaGE v2. that these populations had higher values than the means in
Redundancy analysis (RDA) and partial RDA were performed all populations, e.g., LC, BJ, LL, GY, HH, ST, and SW (H O :
using the R package “vegan” (Oksanen et al., 2018) to test ranged from 0.380 to 0.444; H E : ranged from 0.547 to 0.609)
the effect of geography and climate factors on the genetic (Table 1). IDW analysis suggested that these populations were
variations. In total, 200 allele frequencies were obtained as mostly located in mountainous regions (e.g., Yunnan–Guizhou
response variables according to the methods described by Li Plateau, LL; Xuefeng Mountain and Wuling Mountain, LC, BJ,
et al. (2019). The principal coordinates of neighbors matrices HH, DK; Wuyi Mountains and Tianmu Mountain, SW and
(PCNMs) were obtained as geographic variables from a truncated ST) (Supplementary Figure 3). Correlation analysis indicated
matrix comprising the great circle distances between sample a marginal significant decline in H O along increasing latitudes
populations with the pcnm function in the R package “vegan” and (R = −0.375, p = 0.045), but the variations in H O were not
the distVincentyEllipsoid function in the R package “geosphere” significantly correlated with longitude in the species distribution
(Hijmans, 2017). We selected equal numbers of geographic (p = 0.217) (Figure 2). In addition, non-significant linear
variables and climate variable to avoid bias for the IBD and correlations were determined between latitude/longitude and
IBE analyses. Finally, a total of 12 predictors (Supplementary H E (latitude: R = −0.009, p = 0.964; longitude: R = −0.264,
Table 3) were applied in the full RDA model. Partial RDA was p = 0.167).
conducted for the geographic variables with the climatic effects
controlled and for the climatic variables with the geographic Genetic Variation and Population
effects controlled in order to determine the proportions of genetic
variation explained by geographic and climatic variables. Model
Structure
significance was tested after 999 permutations. AMOVA detected significant genetic differentiation among the
three groups (RCT = 0.10, p < 0.001), but only 9.56% of
Niche Analyses on Environment Space the genetic variation was partitioned. At the population level,
Ecological niche comparisons were performed to test whether 16.30% of the variation was partitioned among populations and
the different climatic niches contributed to the population 83.70% within populations (RST = 0.16, p < 0.001) (Table 2).
differentiation. First, a PCA (hereafter standard PCA) was Bayesian analysis of the population structure suggested an
conducted to examine the climatic variability in the actual niches optimal structure of two genetic clusters (K = 2) among Q. fabri
of the genetic populations across the total climatic space. Second, populations based on delta K simulations (Supplementary
we estimated the partial environment space (E-space) using Figure 1). At K = 2, all Q. fabri populations were assigned to
PCA-env approach developed by Broennimann et al. (2012), two genetic clusters, including the “blue” and “orange” genetic
where we employed the R scripts provided by Herrando-Moraira clusters (Figure 1A). According to the threshold (Qp-value)
et al. (2019). The ecological backgrounds of the three defined employed in our ABC simulations, the 29 oak populations
population groups (group 1, group 2, and group 3 in the ABC were classified into three population groups corresponding to
simulation) were selected from a minimum convex polygon with the STRUCTURE results: five populations (LD–WG shown in
a buffer size of 0.3 degrees, as recently proposed by Silva et al. “blue”) were identified as “genetically pure” population group
(2016). The values of the six climatic factors were extracted 1, mainly located in western and central China, and WG was
from the background to construct the available environmental concentrated at the eastern edge of the Qinling Mountains;
space for the two principal axes, and a kernel smoothing method 18 populations (HH–JCS shown in “orange”) were located in
was utilized to calculate the density of population occurrences. eastern and middle China at relatively low altitudes, and they
For the new dimensional surface, multiple range PCA-env plots were identified as “genetically pure” population group 3; and six
were obtained representing all available climates and occupied populations (BJ–JY) belonging to “admixed” population group
conditions simultaneously for occurrence densities of 20 and 2 were located in the contact regions (Figure 1A). Similarly,
100%. Niche overlaps were evaluated using Schoener’s D metric, PCoA suggested that individuals in the two genetic clusters
which ranges from 0 (no overlap) to 1 (complete overlap) were mostly separated, but individuals from mixed population
(Schoener, 1970). group 2 overlapped with samples from the two “genetically pure”
population groups (Figure 1B).
RESULTS Demographic History
ABC analyses showed that scenario 6 had the highest PP and
Microsatellite Genotyping and Genetic 95% CI compared with other scenarios (Supplementary Table 5
Diversity and Supplementary Figure 4). Analyses conducted to estimate
After Bonferroni correction, four SSR loci (FIR004, the confidence of the scenario selection based on 500 pseudo-
PIE102, PIE267, and QrZAG7) deviated significantly from observed data sets indicated that type I and type II errors were
Hardy–Weinberg equilibrium in most populations due to the low for the best supported scenario (Supplementary Table 5).
deficiency of homozygotes in these populations. In total, 17 The RMAE values for most of the parameters were also low
Frontiers in Plant Science | www.frontiersin.org 6 February 2021 | Volume 11 | Article 583284Chen et al. Evolutionary History of Deciduous Oak FIGURE 2 | Correlations between diversity parameters (HO ) with latitude (A) and longitude (B) at 17 nuclear microsatellite loci for Quercus fabri populations. (
Chen et al. Evolutionary History of Deciduous Oak
populations (RE = 0.5109, p = 0.003), whereas IBD was not
significant (RD = 0.0662, p = 0.378). For the defined population
groups, Mantel tests showed that both IBD and IBE had no
significant effects on the genetic divergence of group 1 and group
2. By contrast, significant IBD was observed for population group
3 (RD = 0.4007, p = 0.002) (Supplementary Table 7).
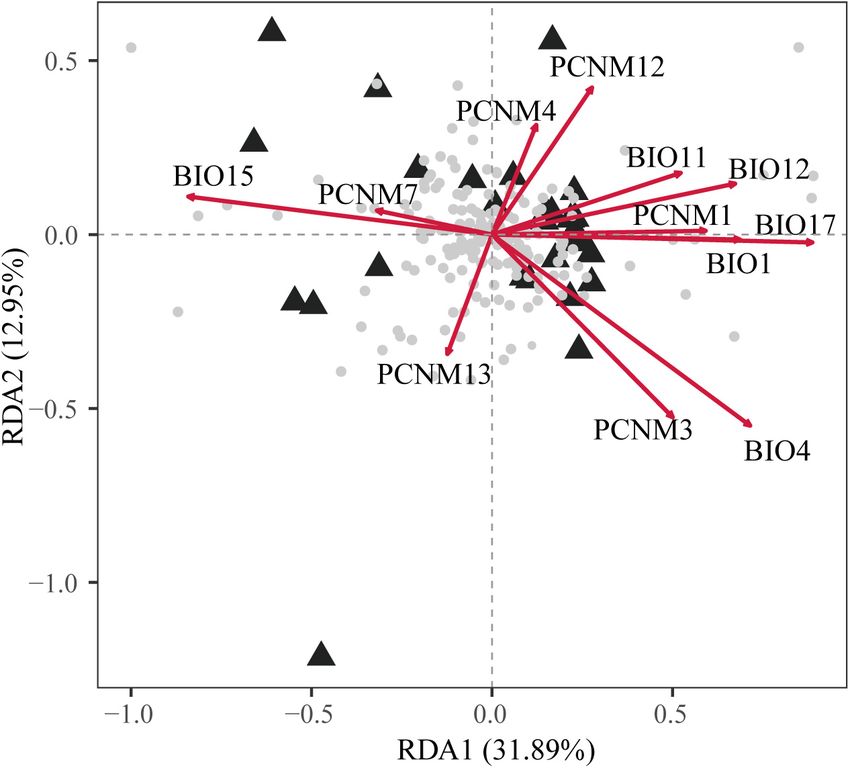
The full RDA model (df = 12, F = 1.761, Radj 2 = 0.246,
P = 0.001) and both partial RDA models were significant with
respect to climate (df = 6, F = 1.344, Radj 2 = 0.071, P = 0.007)
and geography (df = 6, F = 1.413, Radj 2 = 0.085, P = 0.002).
The full model explained 56.91% of the total variation and
partial RDA demonstrated that climate and geography explained
21.71% and 22.84% (Supplementary Table 8), respectively.
About 12.36% of the overall genetic variation was explained by
the collinearity between geographic and climatic variables. In
the full model, five spatial descriptors and one climatic climate
predictors were significant (Supplementary Table 3). Among all
of the variables, BIO17 (precipitation of driest quarter) BIO4
FIGURE 3 | Biplot obtained by redundancy analysis (RDA) showing the
(temperature seasonality) and PCNM4 had the highest scores on
associations between genetic variations at 17 nuclear microsatellite loci with
the first three axes (Figure 3 and Supplementary Table 3). geographic and climatic variables. The gray dots at the center represent the
allelic variables. The principal coordinates of neighbor matrices (PCNMs) were
used as geographic variables comprising PCNM1, PCNM3, PCNM4, PCNM7,
Niche Analyses Based on Environment PCNM12, and PCNM13 and six climatic variables comprising BIO1, BIO4,
Space BIO11, BIO12, BIO15, and BIO17. The proportion of the total genetic variation
According to standard PCA, the first three principal explained by each axis is shown in parentheses.
components accounted for 96.41% of the total climatic
variation (PC1 = 67.50%, PC2 = 17.88%, and PC3 = 11.03%,
Supplementary Table 9 and Figure 4A). The first principal BIO11 (mean temperature of coldest quarter) (Supplementary
component (PC1) was mainly explained by BIO15 (precipitation Figure 7). Multiple niche plots for the occurrence density of 20%
seasonality), the second (PC2) by the BIO11 (mean temperature (Figure 4B) showed that group 2 was clearly separated from
in the coldest quarter), and the third (PC3) by BIO12 (annual population group 1 and group 3. When the occurrence density
precipitation) (Supplementary Table 9 and Figure 4A). The of 100% was plotted in the PCA-env space, partial overlaps
niche distribution of group 2 in the climatic PCA space partially in climatic space were detected among all the three groups
overlapped with those of group 1 and group 3. Group 1 had (Figure 4C). Group 1 and group 3 shared their climate niche to a
a wider climatic niche distribution than group 2 and group low degree, whereas high overlapping was found for group 1 and
3 (Figure 4A). group 2. In addition, the overlap D values between the groups
According to PCA-env analysis, the first two axes explained compared were generally low (group 1 with group 3, D = 0.02;
80.85% of the total variation in the climatic conditions across group 1 with group 2, D = 0.07; group 2 with group 3, D = 0.02).
the population distributions of Q. fabri (PC1 = 56.27% and
PC2 = 24.58%), where the first component (PC1) was mainly
explained by BIO1 (annual mean temperature) and the second by DISCUSSION
Environmental Effects on Genetic
TABLE 3 | Mutation-scaled effective population size (θ) and mutation-scaled Diversity
effective immigration rate (M) for three groups of Quercus fabri estimated Genetic diversity is a consequence of long-term historical
using MIGRATE-N.
evolution in populations (Zhang et al., 2019). Our genetic
Migrate θ M (m/µ) survey of Q. fabri revealed several distinctive features relative to
reported patterns for other tree species distributed in subtropical
Group 1→ Group 2→ Group 3→ China. We detected moderate nSSR gene diversity (17 nSSRs,
H E = 0.542), and it was higher than the nuclear gene diversity
Group 1 5.02 – 5.26 4.28
(4.84–5.23) (5.05–5.48) (4.09–4.48) of Populus adenopoda (10 nSSRs, H E = 0.418; Fan et al.,
Group 2 2.01 8.45 – 11.24 2018) and Loropetalum chinense [amplified fragment length
(1.90–2.10) (8.07–8.85) (10.77–11.99) polymorphism (AFLP), H E = 0.263] (Gong et al., 2016) but
Group 3 2.09 11.77 7.37 – lower than those in Q. acutissima (12 nSSRs, H E = 0.760;
(2.03–2.15) (11.37–12.18) (7.05–7.69) Zhang et al., 2013). In addition, the populations located in
Ninety percent confidence intervals are presented in parentheses; θ, 4Neµ; →, mountainous areas (e.g., Wuyi Mountain, Wuling, Tianmu, and
source populations; µ, mutation rate. Yungui plateau) exhibited higher genetic diversity than those
Frontiers in Plant Science | www.frontiersin.org 8 February 2021 | Volume 11 | Article 583284Chen et al. Evolutionary History of Deciduous Oak FIGURE 4 | (A) Standard principal component analysis (PCA) performed with climatic values for Quercus fabri populations. (B) Climatic space constructed over all background areas and actual niches of all populations in this study, where the solid line represents an occurrence density of 20%, and (C) an occurrence density of 100% is denoted by the thin line and 100% of available climatic background by the thick line. Frontiers in Plant Science | www.frontiersin.org 9 February 2021 | Volume 11 | Article 583284
Chen et al.                                                                                                     Evolutionary History of Deciduous Oak

located in lowlands (Supplementary Figure 3). It is possible that            that the boundary between the second and third Chinese steppes
these mountains provided a diverse range of thermal, hydric,                 played an important role in shaping the genetic structure of
and edaphic conditions, as well as complex and mesic habitats                deciduous tree species in subtropical China. ABC and MIGRATE
for Q. fabri during glacial periods in the Pleistocene. Thus,                analyses both provided evidence of intraspecific bidirectional and
mountains are likely to have served as important refugia for                 asymmetric gene flow among the three defined population groups
Q. fabri in a similar manner to many other plants, according to              (Table 3 and Supplementary Table 6). These heterogeneous
previous studies (e.g., Gavin et al., 2014; Tian et al., 2015; Zhang         environments actually provided the necessary preconditions for
et al., 2019).                                                               the adaptive divergence of fragmented populations (e.g., Liu
                                                                             et al., 2013). Moreover, the effects of geographical isolation and
                                                                             environmental heterogeneity on the genetic patterns of Quercus
Ancient Divergence and Admixture                                             species, have been reported in previous studies for example,
Triggered by Heterogeneous                                                   Quercus engelmannii (Ortego et al., 2012), Quercus chrysolepis
Environments                                                                 (Ortego et al., 2015), Quercus kerrii (Jiang et al., 2018), and
Genetic structure patterns are produced by evolutionary and                  Quercus acutissima (Gao et al., 2020).
demographic processes at different temporal scales (Morris et al.,              Our analysis detected a recent intraspecific admixture event
2008). In the present study, STRUCTURE analysis indicated                    in Q. fabri between group 1 and group 3, which was estimated
the existence of two genetic structures (K = 2; Figure 1A)                   to have occurred during the following 53.76 ka (90% CI 8.16–
that roughly corresponded to western and eastern China. In                   228 ka) (Supplementary Table 6) when the late Pleistocene
addition, ABC analyses suggested that the divergence time among              glacial–interglacial cycles comprised the dominant climatic
groups (group 1 and group 3) could have occurred in the                      regime, i.e., the population expansion during interglacial periods
late Pliocene (ca. 3.99 Ma, 1.22–6.63 Ma). The differentiation               would provide opportunities for population contacts in different
time was similar to previous results obtained based on three                 regions (Mayol et al., 2015). Expansion of Q. fabri during the
chloroplast DNA regions (ca. 2.73 Ma, 1.15–5.21 Ma) (Chen et al.,            interglaciation was further supported by the previous ENM
2020). Compared with other deciduous oak species in China, this              analysis (Chen et al., 2020). Paleoclimatological studies suggested
initial divergence time is similar to that for Q. acutissima (2.96           that the last glacial interglacial (LGI, 75–100 ka, MIS 5; Cui
Ma) (Zhang et al., 2018) but earlier than those for Q. variabilis            et al., 2011) had a climate as warm as or warmer than today
(1.45 Ma) (Chen et al., 2012) and Q. mongolica (1.38 Ma)                     (Kukla et al., 2002). Therefore, Q. fabri populations could have
(Zeng et al., 2015).                                                         migrated from the different regions to track their optimal
   In the present study, the margins of the eastern and western              ecological conditions during the warm periods and expand to
populations were determined along the boundary of the second                 larger areas of suitable habitat, which triggered the occurrences
and third Chinese steppe regions, which correspond to the                    of genetic admixture. Overall, our results indicate that the
eastern margin of Yunnan–Guizhou Plateau (Committee of                       geography and climate jointly shaped the genetic structure of
Chinese Academy of Sciences for Physical Geography of China,                 Q. fabri.
1985). The accelerated uplift of the QTP during the period
from 3.4 to 2.6 Ma leads to an increase in the activity in                   Ecological Variation
the adjacent areas (Li and Fang, 1999; Liu et al., 2013), such               Ecological processes play an important role in species
as the uplift of the west Qinling Mountain and formation of                  differentiation (Gao et al., 2020). Ecological niche partitioning
fault basins on the Yunnan–Guizhou Plateau (An et al., 1999).                would have reinforced the divergence of the lineages following
Moreover, the rise of the QTP dramatically modified the global               their initial spatial isolation, and it may have led to some
and East Asian climate by triggering and intensifying the Asian              degree of differential adaptation to varying environmental
monsoon. In addition, Wuyi and Naling Mountains gradually                    conditions (Liu et al., 2013). Thus, it is plausible that the
uplifted in the late Pleistocene (Chen and Zhou, 1993; Luo et al.,           current distribution of Q. fabri is primarily determined by
2010). These physical features could have reduced the gene flow              the QTP uplift (∼3.4–2.6 Ma), which is proposed to have
among different regions. In particular, the great difference in              associated with past geographical and climatic fluctuations. Our
topography (average altitude, second step: 1,260 m; third step:              niche models produced based on the Broennimann method
251 m) had major effects on environmental factors (Yang et al.,              (Broennimann et al., 2012) suggested that the three defined
1989; Qi et al., 2017). An obvious climatic difference occurs                population groups of Q. fabri might have occupied different
between west and east China, with a moist maritime climate                   climate niches (Figure 4B), although some niche overlaps may
in the east but a seasonal inland climate in west China. The                 have occurred among lineages according to simulation with
precipitation is generally low in the west but higher in the                 100% occurrence (Figure 4C). In addition, the standard PCAs
east (Li et al., 2014; Gao et al., 2020). Therefore, the variable            provided evidence for the roles of ecological factors in triggering
climate conditions and heterogeneous habitats caused by regional             population differentiation in Q. fabri (Figure 4A). E-space
geological events drove the isolation of the western and eastern             analyses suggested that the annual mean temperature (BIO1),
lineages. A similar west–east pattern has been found in the EBLF             mean temperature of coldest quarter (BIO11), and precipitation
in subtropical China, such as for Castanopsis fargesii (Sun et al.,          seasonality (BIO15) were potential ecological factors associated
2014), Castanopsis eyrei (Shi et al., 2014), and Castanopsis carlesii        with intraspecific differentiation (Supplementary Figure 7
(Sun et al., 2016). Our investigation of Q. fabri also suggests              and Figures 4B,C). The temperature seasonality (BIO4)

Frontiers in Plant Science | www.frontiersin.org                        10                                  February 2021 | Volume 11 | Article 583284
Chen et al. Evolutionary History of Deciduous Oak
also contributed significantly to the geographic patterns of manuscript. JY, Z-HL, and G-FZ revised the manuscript.
climatically genetic variation (Figure 3 and Supplementary All authors contributed to the article and approved the
Table 3). Climate seasonality (e.g., temperature and precipitation submitted version.
seasonality) is among the most important ecological factors
that affect phenology (e.g., flowering time and growing season)
(Quintero et al., 2014). Thus, it is possible that the gene flow
between populations in group 1 and group 3 might have been FUNDING
limited due to potential genetic barriers caused by asynchronous
phenology, thereby resulting in population differentiation. This study was financially supported by the National Natural
Further research based on sufficient genomic data related Science Foundation of China (31770229, 31901077, and
to environmental selection and phenological observations is 31900273), the Project funded by China Postdoctoral Science
necessary to improve our understanding of divergent adaptation Foundation (2018M641011), the Shaanxi Postdoctoral Science
and environment isolation processes during Q. fabri population Foundation, and the Natural Science Basic Research Program of
differentiation. The contributions of environmental variables Shaanxi (No. 2019JQ-718).
to the genetic differentiation in Q. fabri were also supported
by the IBE and IBD analyses. It should be noted that the
spatial Mantel tests did not detect the IBE patterns within
groups to a large degree, and thus the genetic structure within
SUPPLEMENTARY MATERIAL
groups might have been less correlated with the ecological
variables. However, our results suggest that the distribution The Supplementary Material for this article can be found
of Q. fabri populations in different regions was mediated online at: https://www.frontiersin.org/articles/10.3389/fpls.2020.
by the perturbation of abiotic environment factors, which 583284/full#supplementary-material
might have influenced the genetic variation and population
differentiation. Supplementary Figure 1 | Distribution of mean log probability of the data (ln Pr(X|
K)) and Delta K values are presented for K = 1–15 (eight replicates) in populations
of Quercus fabri.
CONCLUSION Supplementary Figure 2 | Scenarios tested using approximate Bayesian
computation (ABC). In these scenarios, Pop 1, Pop 2, and Pop 3 represent group
In this study, we used genetic methods and niche analyses to 1, group 2, and group 3, respectively, t# represents the time in generations, N#
investigate the spatial genetic structure and demographic history denotes the effective population sizes of the different populations, and r# is the
immigration rates from donor populations.
of Q. fabri, which is an endemic tree species in subtropical China.
Our genetic results suggest that the observed patterns of genetic Supplementary Figure 3 | Inverse distance weighted (IDW) interpolation of
variation and structure among populations of Q. fabri could observed heterozygosity (HO ) and expected heterozygosity (HE ) for 29 Quercus
fabri populations (black triangle) in subtropical China.
be explained by a combination of both geological and climatic
events in the late Pliocene/Quaternary. In addition, ecological Supplementary Figure 4 | Comparison of posterior probabilities for eight
analyses indicated clear ecological differentiation among the simulated scenarios obtained by logistic regression from 1% of the closest
data set in DIYabc.
population structures of Q. fabri. Initial topological constraints
reinforced by subsequent differential ecological adaptations may Supplementary Figure 5 | (A) Estimate posterior distributions for parameters
have resulted in intraspecific differentiation and the formation and (B) model checking in DIYabc for the best-supported (scenario 6).
of genetic patterns in this oak species. Thus, heterogeneous Supplementary Figure 6 | Principal component analysis results obtained
environmental factors may have affected the spatial genetic along the first three axes for the pre-evaluate scenarios and prior distributions
variation, structure, and demographic history of this deciduous in DIYabc.
tree species in subtropical China. Supplementary Figure 7 | Contribution of each environmental variable to spatial
distribution of the PCA-env.
Supplementary Table 1 | PCR primers used in this study.
DATA AVAILABILITY STATEMENT
Supplementary Table 2 | Prior distributions of the parameters used in DIYabc.
The original contributions presented in the study Supplementary Table 3 | Scores for the six geographic variables and six climatic
are publicly available. This data can be found here: variables on the first three RDA axes (RDA1–RDA3) in the full RDA model, and
https://datadryad.org/stash/share/NCuKCzVN_yl9MikUBvD8_ both partial RDA models corresponding to pure geography and pure climate.
e41QndMma9daCr6iLe5Z_M. Significance tests were performed based on 999 permutations for each
constrained axis and each constraining variable.
Supplementary Table 4 | Genetic diversity parameters estimated at 17 nuclear
AUTHOR CONTRIBUTIONS microsatellite loci in 29 populations.
Supplementary Table 5 | Posterior probability and 95% confidence intervals (CI)
X-DC, JY, and G-FZ designed the research. X-DC and Y-FG for each scenarios based on the logistic regression approach for approximate
performed the experiments. JY, TZ, Y-MZ, XZ, and M-MJ Bayesian computation analyses (ABC). Type I and type II errors are indicated for
contributed materials and data analysis. X-DC wrote the the best supporting scenarios (in bold).
Frontiers in Plant Science | www.frontiersin.org 11 February 2021 | Volume 11 | Article 583284Chen et al. Evolutionary History of Deciduous Oak
Supplementary Table 6 | Posterior distributions of parameters for the best due to the collinearity between geographic and climatic variables (climate +
supported scenario (scenario 6) of the demographic history of Quercus fabri with geography) is also shown.
approximate Bayesian computation. Relative median absolute errors (RMAE)
based on 500 pseudo-observed data are also indicated for each parameter. Supplementary Table 9 | Descriptive statistics based on principle components
analysis (PCA) of the selected variables. The variables that mainly explained each
Supplementary Table 7 | Results of Mantel tests between genetic (GeD) and axis are shown in bold.
geographical (GD) distance, and genetic (GeD) and ecological (ED) distances for
Quercus fabri and three groups based on nuclear microsatellite data. Supplementary Note 1 | Microsatellite genotype dataset used in this study.
Supplementary Table 8 | Partitioning of the genetic variation in Quercus fabri Supplementary Note 2 | Principal component analysis results obtained along the
purely associated with climate and geography using redundancy analysis (RDA) first three axes for the pre-evaluate scenarios and prior distributions in DIYabc
and partial RDA. The proportion of genetic variation that could not be partitioned (based on alternative parameters).
REFERENCES Du, F. K., Hou, M., Wang, W., Mao, K., and Hampe, A. (2017). Phylogeography
of Quercus aquifolioides provides novel insights into the Neogene history of
An, Z. S., Wang, S. M., Wu, X. H., Chen, M. Y., Sun, D. H., Liu, X. M., et al. (1999). a major global hotspot of plant diversity in south-west China. J. Biogeogr. 44,
Eolian evidence from the Chinese loess plateau: the onset of the late cenozoic 294–307. doi: 10.1111/jbi.12836
great glaciation in the northern hemisphere and Qinghai-Xizang plateau uplift Eiserhardt, W. L., Svenning, J., Kissling, W. D., and Balslev, H. (2011). Geographical
forcing. Sci. China Ser. D. 42, 258–271. doi: 10.1007/BF02878963 ecology of the palms (Arecaceae): determinants of diversity and distributions
Beerli, P. (2006). Comparison of bayesian and maximum-likelihood inference across spatial scales. Ann. Bot. 108, 1391–1416. doi: 10.1093/aob/mcr146
of population genetic parameters. Bioinformatics 22, 341–345. doi: 10.1093/ Evanno, G., Regnaut, S., and Goudet, J. (2005). Detecting the number of clusters of
bioinformatics/bti803 individuals using the software STRUCTURE: a simulation study. Mol. Ecol. 14,
Besnard, G., Dupuy, J., Larter, M., Cuneo, P., Cooke, D., and Chikhi, L. (2014). 2611–2620. doi: 10.1111/j.1365-294X.2005.02553.x
History of the invasive african olive tree in Australia and Hawaii: evidence for Excoffier, L., Laval, G., and Schneider, S. (2005). Arlequin ver. 3.0: an integrated
sequential bottlenecks and hybridization with the Mediterranean olive. Evol. software package for population genetics data analysis. Evol. Bioinform. 1,
Appl. 7, 195–211. doi: 10.1111/eva.12110 47–50. doi: 10.1177/117693430500100003
Broennimann, O., Fitzpatrick, M. C., Pearman, P. B., Petitpierre, B., Pellissier, L., Fan, L. Q., Zheng, H. L., Milne, R. I., Zhang, L., and Mao, K. S. (2018).
Yoccoz, N. G., et al. (2012). Measuring ecological niche overlap from occurrence Strong population bottleneck and repeated demographic expansions of Populus
and spatial environmental data. Global Ecol. Biogeogr. 21, 481–497. doi: 10. adenopoda (Salicaceae) in subtropical China. Ann. Bot. 121, 665–679. doi:
1111/j.1466-8238.2011.00698.x 10.1093/aob/mcx198
Cavender-Bares, J. (2019). Diversification, adaptation, and community assembly Fu, Z. Z., Li, Y. H., Zhang, K. M., and Li, Y. (2014). Molecular data and ecological
of the American oaks (Quercus), a model clade for integrating ecology and niche modeling reveal population dynamics of widespread shrub Forsythia
evolution. New Phytol. 221, 669–692. doi: 10.1111/nph.15450 suspensa (Oleaceae) in China’s warm-temperate zone in response to climate
Chen, D. M., Zhang, X. W., Kang, H. Z., Sun, X., Yin, S., Du, H. M., et al. (2012). change during the Pleistocene. BMC Evol. Biol. 14:114. doi: 10.1186/1471-2148-
Phylogeography of Quercus variabilis based on chloroplast DNA sequence in 14-114
East asia: multiple glacial refugia and mainland-migrated island populations. Gailing, O., Vornam, B., Leinemann, L., and Finkeldey, R. (2009). Genetic and
PLoS One 7:e47268. doi: 10.1371/journal.pone.0047268 genomic approaches to assess adaptive genetic variation in plants: forest trees as
Chen, J. Y., and Zhou, X. D. (1993). Relationship between palaeoenvironmental a model. Physiol. Plant. 137, 509–519. doi: 10.1111/j.1399-3054.2009.01263.x
change and soil development in Wuyi Mountains. Geol. Fujian 12, 228–231. Gao, J., Liu, Z. L., Zhao, W., Tomlinson, K. W., Xia, S. W., Zeng, Q. Y., et al.
Chen, K. M., Abbott, R. J., Milne, R. I., Tian, X. M., and Liu, J. Q. (2008). (2020). Combined genotype and phenotype analyses reveal patterns of genomic
Phylogeography of Pinus tabulaeformis carr. (Pinaceae), a dominant species of adaptation to local environments in the subtropical oak Quercus acutissima.
coniferous forest in northern China. Mol. Ecol. 17, 4276–4288. doi: 10.1111/j. J. Syst. Evol. 1–16. doi: 10.1111/jse.12568
1365-294X.2008.03911.x Gavin, D. G., Fitzpatrick, M. C., Gugger, P. F., Heath, K. D., Rodríguez-Sánchez,
Chen, X. D., Yang, J., Feng, L., Zhou, T., Zhang, H., Li, H. M., et al. (2020). F., Dobrowski, S. Z., et al. (2014). Climate refugia: joint inference from fossil
Phylogeography and population dynamics of an endemic oak (Quercus fabri records, species distribution models and phylogeography. New Phytol. 204,
Hance) in subtropical China revealed by molecular data and ecological niche 37–54. doi: 10.1111/nph.12929
modeling. Tree Genet. Genomes 16:2. doi: 10.1007/s11295-019-1383-0 Gong, W., Liu, W. Z., Gu, L., Kaneko, S., Koch, M. A., and Zhang, D. X.
Committee of Chinese Academy of Sciences for Physical Geography of China (2016). From glacial refugia to wide distribution range: demographic expansion
(1985). Physical Geography of China: Pandect. Beijing: Science Press. of Loropetalum chinense (hamamelidaceae) in chinese subtropical evergreen
Cornuet, J. M., Pudlo, P., Veyssier, J., Dehne-Garcia, A., Gautier, M., Leblois, broadleaved forest. Org. Divers. Evol. 16, 23–38. doi: 10.1007/s13127-015-
R., et al. (2014). DIYABC v2.0: a software to make approximate bayesian 0252-4
computation inferences about population history using single nucleotide Goudet, J. (2001). FSTAT, a Program to Estimate and Test Gene Diversities and
polymorphism, DNA sequence and microsatellite data. Bioinformatics 30, Fixation Indices, Version 2.9.3.
1187–1189. doi: 10.1093/bioinformatics/btt763 Harmon, L. J., Melville, J., Larson, A., and Losos, J. B. (2008). The role of geography
Cornuet, J., Ravigné, V., and Estoup, A. (2010). Inference on population history and ecological opportunity in the diversification of day geckos (Phelsuma). Syst.
and model checking using DNA sequence and microsatellite data with the Biol. 57, 562–573. doi: 10.1080/10635150802304779
software DIYABC (v1.0). BMC Bioinformatics 11:401. doi: 10.1186/1471-2105- He, B. H., Zhao, X. L., and Qi, D. H. (2008). Biodiversity of tree populations in a
11-401 soil and water conservation forest during ecological restoration. J. Central South
Cui, Z. J., Chen, Y. X., Zhang, W., Zhou, S. Z., Zhou, L. P., Zhang, M., et al. (2011). Univer. Forestry Technol. 28, 113–117.
Research history, glacial chronology and origins of Quaternary glaciations in Herrando-Moraira, S., Nualart, N., Herrando-Moraira, A., Chung, M. Y., and
China. Quat. Sci. 31, 749–764. López-Pujol, J. (2019). Climatic niche characteristics of native and invasive
Denk, T., Grimm, G. W., Manos, P. S., Deng, M., and Hipp, A. L. (2017). “An Lilium lancifolium. Sci. Rep. 9:14334. doi: 10.1038/s41598-019-50762-4
updated infrageneric classification of the oaks: review of previous taxonomic Hijmans, R. J. (2017). Geosphere: Spherical Trigonometry. R package version 1.5-7.
schemes and synthesis of evolutionary patterns,” in Oaks Physiological Ecology. Hipp, A. L., Manos, P. S., González-Rodríguez, A., Hahn, M., Kaproth, M., McVay,
Exploring the Functional Diversity of Genus Quercus L, eds E. Gil-Pelegrín, J. J. J. D., et al. (2018). Sympatric parallel diversification of major oak clades in
Peguero-Pina, and D. Sancho-Knapik (Berlin: Springer), 13–38. doi: 10.1007/ the Americas and the origins of Mexican species diversity. New Phytol. 217,
978-3-319-69099-5_2 439–452. doi: 10.1111/nph.14773
Frontiers in Plant Science | www.frontiersin.org 12 February 2021 | Volume 11 | Article 583284Chen et al. Evolutionary History of Deciduous Oak
Holland, M. M., and Parson, W. (2011). GeneMarker R HID: a reliable software Petit, R. J., Csaikl, U. M., Bordacs, S., Burg, K., Coart, E., Cottrell, J., et al.
tool for the analysis of forensic STR data. J. Forensic Sci. 56, 29–35. doi: (2002). Chloroplast DNA variation in European white oaks phylogeography
10.1111/j.1556-4029.2010.01565.x and patterns of diversity based on data from over 2600 populations. Forest Ecol.
Jiang, X. L., An, M., Zheng, S. S., Deng, M., and Su, Z. H. (2018). Geographical Manag. 156, 5–26. doi: 10.1016/S0378-1127(01)00645-4
isolation and environmental heterogeneity contribute to the spatial genetic Pritchard, J. K., Stephens, M., and Donnelly, P. (2000). Inference of population
patterns of Quercus kerrii (Fagaceae). Heredity 120, 219–233. doi: 10.1038/ structure using multilocus genotype data. Genetics 155, 945–959.
s41437-017-0012-7 Qi, W., Liu, A., and Zhang, W. (2017). Object-oriented quantitative segmentation
Kukla, G. J., Bender, M. L., Beaulieu, J. L. D., Bond, G., Broecker, W. S., Cleveringa, for China’s tree Terrain Grades. Remote Sens. Inf. 32, 43–48.
P., et al. (2002). Last interglacial climates. Quaternary Res. 58, 2–13. doi: Qian, H., and Sandel, B. (2017). Phylogenetic structure of regional angiosperm
10.1006/qres.2001.2316 assemblages across latitudinal and climatic gradients in North America. Global
Lagache, L., Klein, E. K., Guichoux, E., and Petit, R. J. (2013). Fine-scale Ecol. Biogeogr. 26, 1258–1269. doi: 10.1111/geb.12634
environmental control of hybridization in oaks. Mol. Ecol. 22, 423–436. doi: Qiu, Y. X., Fu, C. X., and Comes, H. P. (2011). Plant molecular phylogeography in
10.1111/mec.12121 China and adjacent regions: tracing the genetic imprints of quaternary climate
Lepais, O., Petit, R. J., Guichoux, E., Lavabre, J. E., and Gerber, S. (2009). Species and environmental change in the world’s most diverse temperate flora. Mol.
relative abundance and direction of introgression in oaks. Mol. Ecol. 18, 2228– Phylogenet. Evol. 59, 225–244. doi: 10.1016/j.ympev.2011.01.012
2242. doi: 10.1111/j.1365-294X.2009.04137.x Quintero, I., Gonzalez-Caro, S., Zalamea, P. C., and Cadena, C. D. (2014).
Li, C., Sun, Y., Huang, H. W., and Cannon, C. H. (2014). Footprints of divergent Asynchrony of seasons genetic differentiation associated with geographic
selection in natural populations of Castanopsis fargessii (Fagaceae). Heredity variation in climatic seasonality and reproductive phenology. Am. Nat. 184,
113, 533–541. doi: 10.1038/hdy.2014.58 352–363. doi: 10.1086/677261
Li, J. J., and Fang, X. M. (1999). Uplift of the Tibetan Plateau and environmental Raymond, M., and Rousset, F. (1995). GENEPOP (version 1.2): population genetics
changes. Chin. Sci. Bull. 44, 2117–2124. doi: 10.1007/BF03182692 software for exact tests and ecumenicism. J. Hered. 86, 248–249. doi: 10.1093/
Li, Y., Zhang, X., and Fang, Y. (2019). Landscape features and climatic forces shape oxfordjournals.jhered.a111573
the genetic structure and evolutionary history of an oak species (Quercus chenii) Rosenberg, M. S., and Anderson, C. D. (2011). PASSaGE: pattern analysis, spatial
in East China. Front. Plant Sci. 10:1060. doi: 10.3389/fpls.2019.01060 statistics and geographic exegesis. version 2. Methods Ecol. Evol. 2, 229–232.
Liu, J., Möller, M., Provan, J., Gao, L. M., Poudel, R. C., and Li, D. Z. doi: 10.1111/j.2041-210X.2010.00081.x
(2013). Geological and ecological factors drive cryptic speciation of yews in a Rosenberg, N. A. (2004). DISTRUCT: a program for the graphical display of
biodiversity hotspot. New Phytol. 199, 1093–1108. doi: 10.1111/nph.12336 population structure. Mol. Ecol. Resour. 4, 137–138. doi: 10.1046/j.1471-8286.
Liu, M. L., He, Y. L., López-Pujol, J., Jia, Y., and Li, Z. H. (2019a). Complex 2003.00566.x
population evolutionary history of four cold-tolerant Notopterygium herb Ruddiman, W. F., and Kutzbach, J. E. (1989). Forcing of late cenozoic northern
species in the Qinghai-Tibetan Plateau and adjacent areas. Heredity 123, 242– hemisphere climate by plateau uplift in southern Asia and the American West.
263. doi: 10.1038/s41437-019-0186-2 J. Geophys. Res. 94, 18409–18427. doi: 10.1029/JD094iD15p18409
Liu, Y. Y., Jin, W. T., Wei, X. X., and Wang, X. Q. (2019b). Cryptic speciation Schoener, T. W. (1970). Nonsynchronous spatial overlap of lizards in patchy
in the Chinese white pine (Pinus armandii): implications for the high species habitats. Ecology 51, 408–418. doi: 10.2307/1935376
diversity of conifers in the Hengduan mountains, a global biodiversity hotspot. Shi, M. M., Michalski, S. G., Welk, E., Chen, X. Y., and Durka, W. (2014).
Mol. Phylogenet. Evol. 138, 114–125. doi: 10.1016/j.ympev.2019.05.015 Phylogeography of a widespread Asian subtropical tree: genetic east–west
Luo, D., Xiao, Y. F., Zhan, L., and Zhang, L. (2010). The tectogenesis control differentiation and climate envelope modelling suggest multiple glacial refugia.
of Danxia landform in southeast China. J. East China Institute Technol. 33, J. Biogeogr. 41, 1710–1720. doi: 10.1111/jbi.12322
147–153. Shi, X., Wang, S. F., Chen, Y. T., Xu, Q. D., Sun, H. J., An, R., et al. (2019). Tolerance
Luo, Y., and Zhou, Z. K. (2000). Phytogeography of Quercus subg. Cyclobalanopsis. and vegetation restoration prospect of seedlings of five oak species for Pb /Zn
Acta Bot. Yunnanica 23, 1–16. mine tailing. J. Appl. Ecol. 12, 4091–4098.
Marshall, T. C., Slate, J., Kruuk, L. E. B., and Pemberton, J. M. (1998). Statistical Shi, Y. F., Li, J. J., and Li, B. Y. (1999). Uplift of the Qinghai-Xizang (Tibetan)
confidence for likelihood-based paternity inference in natural populations. Mol. Plateau and east asia environmental change during Late Cenozoic. Acta Geogr.
Ecol. 7, 639–655. doi: 10.1046/j.1365-294x.1998.00374.x Sin. Ed. 54, 20–28.
Mayol, M., Riba, M., Gonzalezmartinez, S. C., Bagnoli, F., De Beaulieu, J., Shi, Y. F., Ren, B. H., Wang, J. T., and Derbyshire, E. (1986). Quaternary glaciation
Berganzo, E., et al. (2015). Adapting through glacial cycles: insights from a in China. Quaternary Sci. Rev. 5, 503–507. doi: 10.1016/S0277-3791(86)
long-lived tree (Taxus baccata). New Phytol. 208, 973–986. doi: 10.1111/nph. 80044-0
13496 Silva, D. P., Vilela, B., Buzatto, B. A., Moczek, A. P., and Hortal, J. (2016).
Menitsky, L. L. (1984). Oaks of Asia. St. Petersburg: Leningosed Sciences. Contextualized niche shifts upon independent invasions by the dung beetle
Morris, A. B., Ickert-Bond, S. M., Brunson, D. B., Soltis, D. E., and Soltis, P. S. Onthophagus taurus. Biol. Invasions 18, 3137–3148. doi: 10.1007/s10530-016-
(2008). Phylogeographical structure and temporal complexity in American 1204-4
sweetgum (Liquidambar styraciflua. Altingiaceae). Mol. Ecol. 17, 3889–3900. Sork, V. L., Davis, F. W., Westfall, R., Flint, A., Ikegami, M., Wang, H., et al.
doi: 10.1111/j.1365-294X.2008.03875.x (2010). Gene movement and genetic association with regional climate gradients
Oksanen, J., Blanchet, F., Friendly, M., Kindt, R., Legendre, P., McGlinn, D., et al. in California valley oak (Quercus lobata Née) in the face of climate change. Mol.
(2018). Vegan: Community Ecology Package. R package version 2.5-2. Ecol. 19, 3806–3823. doi: 10.1111/j.1365-294X.2010.04726.x
Ortego, J., Gugger, P. F., and Sork, V. L. (2015). Climatically stable landscapes Sun, Y. S., Li, L. L., Li, L., Zou, J. B., and Liu, J. Q. (2015). Distributional dynamics
predict patterns of genetic structure and admixture in the Californian canyon and interspecific gene flow in Picea likiangensis and P. wilsonii triggered by
live oak. J. Biogeogr. 42, 328–338. doi: 10.1111/jbi.12419 climate change on the Qinghai-Tibet Plateau. J. Biogeogr. 42, 475–484. doi:
Ortego, J., Riordan, E. C., Gugger, P. F., and Sork, V. L. (2012). Influence of 10.1111/jbi.12434
environmental heterogeneity on genetic diversity and structure in an endemic Sun, Y., Hu, H. Q., Huang, H. W., and Vargas-Mendoza, C. F. (2014). Chloroplast
southern Californian oak. Mol. Ecol. 21, 3210–3223. doi: 10.1111/j.1365-294X. diversity and population differentiation of Castanopsis fargesii (Fagaceae):
2012.05591.x a dominant tree species in evergreen broad-leaved forest of subtropical
Peakall, R., and Smouse, P. E. (2012). GenAlEx 6.5: genetic analysis in excel. China. Tree Genet. Genomes 10, 1531–1539. doi: 10.1007/s11295-014-
population genetic software for teaching and research-an update. Bioinformatics 0776-3
28, 2537–2539. doi: 10.1093/bioinformatics/bts460 Sun, Y., Surget-Groba, Y., and Gao, S. X. (2016). Divergence maintained by
Peñaloza-Ramírez, J. M., González-Rodríguez, A., Mendoza-Cuenca, L., Caron, H., climatic selection despite recurrent gene flow: a case study of Castanopsis carlesii
Kremer, A., and Oyama, K. (2010). Interspecific gene flow in a multispecies (Fagaceae). Mol. Ecol. 25, 4580–4592. doi: 10.1111/mec.13764
oak hybrid zone in the Sierra Tarahumara of Mexico. Ann. Bot. 3, 389–399. Tian, S., Lei, S. Q., Hu, W., Deng, L. L., Li, B., Meng, Q. L., et al. (2015). Repeated
doi: 10.1093/aob/mcp301 range expansions and inter-/postglacial recolonization routes of Sargentodoxa
Frontiers in Plant Science | www.frontiersin.org 13 February 2021 | Volume 11 | Article 583284You can also read