HECHO RELEVANTE - Europa Press
←
→
Page content transcription
If your browser does not render page correctly, please read the page content below

HECHO RELEVANTE

       De conformidad con lo previsto en el artículo 17 del Reglamento (UE) nº
596/2014 sobre abuso de mercado y en el artículo 228 del texto refundido de la Ley del
Mercado de Valores, aprobado por el Real Decreto Legislativo 4/2015, de 23 de octubre,
y disposiciones concordantes, eDreams ODIGEO (la “Sociedad”), informa de los
resultados financieros correspondientes al período del ejercicio finalizado el 31 de
diciembre de 2016, que estarán disponibles en la página web de la Sociedad a partir de
hoy (http://www.edreamsodigeo.com/).

       Se adjunta a continuación el Informe de Resultados correspondiente a los
primeros nueve meses del ejercicio y la presentación corporativa preparada por la
Sociedad para conocimiento de sus accionistas.

                                                   Luxemburgo, 28 de febrero de 2017

                                                                  eDreams ODIGEO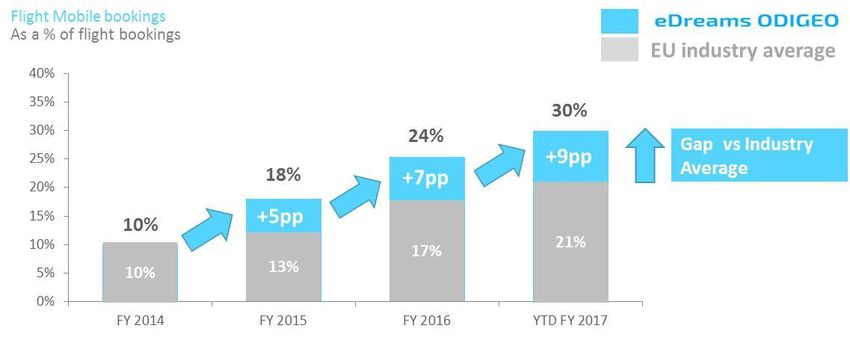
FIRST 9 MONTHS
RESULTS REPORT
FY 2017
Summary Financial Information
                           3 Months                       Year to date

                            +10%       2,678                    +9%       8,504
                   2,437                               7,818

 Bookings (‘000)

                3 Months             3 Months        9 Months           9 Months
              December FY16        December FY17   December FY16      December FY17

                             +5%                                +5%
                   103.1               108.7                              349.7
                                                       333.9

 Revenue Margin
 (€ million)

                3 Months             3 Months        9 Months           9 Months
              December FY16        December FY17   December FY16      December FY17

                                                               +18%       75.9
                             +10%       21.7
                                                       64.1
                   19.7

 Adjusted EBITDA
 (€ million)
                3 Months             3 Months        9 Months           9 Months
              December FY16        December FY17   December FY16      December FY17

                            +19%                               +78%
                                                                          19.4
                                        3.0
                    2.5
                                                       10.9

 Adj. Net Income
 (€ million)
                3 Months             3 Months        9 Months           9 Months
              December FY16        December FY17   December FY16      December FY17

                                                               edreamsodigeo.com |    2
eDreams ODIGEO has built a highly successful travel
business over the past 15 years with well-known global
brands.
#1 750M
monthly searches2
flight retailer in
Europe1; growing
market share
>17M 143
Customers served1 web sites3
44 30%
flight bookings done via
countries where we mobile devices2
operate1
#1
Leading Metasearch
in France1. Present
in 11 countries
1
Reference period FY 2016
2
Reference period Q3 FY 2017
3
Includes sites across all markets, brands, and devices
edreamsodigeo.com | 3Index
Results Highlights
Quote from CEO
Business Review
1. By Geography
2. By Business
KPIs - NEW –
Outlook
Financial Review
Other information
Condensed Consolidated Interim
Financial Statements and Notes
Glossary & reconciliation -NEW
edreamsodigeo.com | 4Solid First nine months with continued growth in Bookings, Revenue
Margin and Adjusted EBITDA; Adjusted Net Income +78% y-o-y; Cash
Flow before financing €27.6 million
Results Highlights
Solid growth in bookings (+9%), revenue margin (+5%) and Adjusted EBITDA (+18%);
Adjusted net income of €19.4 million, representing a 78% increase;
Solid cash flow with cash position of €77 million (up 18%);
Solid performance in all Core Markets: Bookings (+11%) and revenue margin (+8%)
Revenue diversification strategy in non-flight products: Bookings (+7%) and revenue
margin (+11%)
Strategic initiatives continue to boost performance;
Further investment in the business to build scale, be more agile, improve business model,
and create a better customer experience;
Increased transparency with new KPIs introduced to measure operational performance;
Acquired budgetplaces.com, a leading hotel bookings site, in line with acquisition strategy;
Full year guidance raised; Bookings: 11.2-11.5 million (5-8% growth y-on-y), Revenue margin
€465-475 million (0-2% growth y-on-y); Adjusted EBITDA €105-107 million (10-12% growth
year-on-year).
Quote from the CEO
“We have had a good nine months of the financial year to date with continued growth in bookings,
revenue margin and Adjusted EBITDA. The strategic initiatives that we put in place continue to drive
this performance. In addition we have invested and continue to invest in our business in order to
strengthen our long term competitiveness, growth and customer proposition. In particular, we are
focusing our continued investment around the customer, including the further differentiation of our
offer and the speed with which we can respond to and lead consumer trends. As we have said
previously, this investment of some top line growth in the short term, will, over the long term,
deliver a more compelling and competitive customer proposition and robust, high quality revenue
growth. As a result of these initiatives, we have revised up our expectations towards the upper end
of the guidance we provided at the start of the year.”
edreamsodigeo.com | 5Business review
eDreams ODIGEO delivered a solid financial performance in the first 9 months of fiscal year 2017.
The strategy announced in 2015 continues to drive improvements in the business, and is delivering
positive growth rates in bookings and revenue margin, up 9% and 5% respectively. Adjusted EBITDA
growth rates continue to be very strong, growing by 18% in the first nine months as a result of
growth in bookings and revenue margin combined with a 10% reduction in variable cost per
booking.
Our revenue diversification strategy continues to have a positive impact on our business, with
growth in our flight related ancillaries and non-flight products. Bookings in non-flight businesses
were up 7% and revenue margin up 11% driven by growth in hotels, cars and dynamic packages,
development of our metasearch business, and partially offset by a decrease in our packaged tours
business.
In our flight business, good progress in delivering our strategic initiatives has boosted performance
and is positioning us well for long term growth. We continue to make the planned investments in
our business to build scale, become more agile, improve the business model, and create a better
customer experience.
Our Core markets performed strongly with Bookings up 11% and revenue margin up 8%, driven by
strategic initiatives, our diversification strategy and our continued investment.
The first nine months also saw strong profit growth. Adjusted net income was up significantly to
€19.4 million, representing an 78% increase year-on-year.
In October 2016 the group successfully refinanced its debt, with a full repayment of 2018 Notes and
2019 Notes, and the issuance of 2021 Notes. It increased the Super Senior Revolver Credit Facility
from €130million to €147 million, and switched its new debt to a single maintenance covenant of
6.0x Gross Leverage Ratio, with the terms also improving to allow for efficient repurchases of up to
10% of principal per year. We have successfully reduced our covenant ratio from 5.0x in December
2015 to 4.0x in December 2016, which gives up ample headroom vs our Gross Leverage covenant
ratio. In addition, our Net Leverage Ratio was down from 4.3x in December 2015 to 3.3x in December
2016.
In the first nine months of fiscal year 2017 the group reported a very solid cash flow performance
with a cash position of €77 million (up 18% year-on-year). Cash flow from operations went from -
4.7 million euros to €41.7 million, and Cash Flow before financing from -28.1 million euros to €27.6
million, as a result of improvements in EBITDA, working capital and capex. Overall the Group
delivered a very strong cash flow performance.
edreamsodigeo.com | 6The financial performance for the first nine months demonstrates that the shift in our business
model is delivering positive results. We continue to drive more revenues outside of flight tickets
which are higher margin and generate more cash for the business. Overall we consider this a solid
set of results and in line with where we would expect to be following the start of our
transformation in June 2015.
edreamsodigeo.com | 7OUR MISSION
“We are passionate about travel.
We aim to make travel easier,
more accessible and better value
for our customers through our
consumer insight, innovative
technology and market
leadership”
edreamsodigeo.com | 8Geographical Overview
Bookings (‘000) 3 Months Year to date
+13% 1,361 +11% 4,389
1,206 3,954
Core
3 Months 3 Months 9 Months 9 Months
December FY16 December FY17 December FY16 December FY17
+7% +7%
1,316
1,231
3,864 4,116
Expansion
3 Months 3 Months 9 Months 9 Months
December FY16 December FY17 December FY16 December FY17
Revenue Margin
(€ million)
+10% 8%
60.3
54.6 182.2 196.7
Core
3 Months 3 Months 9 Months 9 Months
December FY16 December FY17 December FY16 December FY17
0% +1%
48.5 48.4 151.7 152.9
Expansion
3 Months 3 Months 9 Months 9 Months
December FY16 December FY17 December FY16 December FY17
edreamsodigeo.com | 9Business review by geography
Our Core markets (France, Italy, Spain) delivered a solid growth in bookings and revenue margin in
the first nine months of fiscal year 2017. Core markets bookings reached 4.4 million, up 11% year-
on-year, as a result of our strategic initiatives, diversification strategy and continued investment.
Revenue margin in our Core segment for the first nine months of fiscal year 2017 also experienced
solid growth rates, up 8% year-on-year, to €196.7 million. While revenue margin per booking fell
3%, the group delivered 8% growth in revenue margin as a result of our continued investment in the
business.
Expansion markets experienced solid growth rates, up 7% year-on-year, in the first nine months of
the year, driven by the strategic initiatives and investments made in our business and revenue
diversification.
Expansion markets revenue margin was up 1% year-on-year for the first nine months to €152.9
million. The performance was driven by booking growth, negative foreign exchange impact, in
particular the depreciation of the pound vs the euro, and revenue margin per booking.
Revenue Margin Breakdown
Q3 FY 2016 Q3 FY 2017
53%
47% 45% 55%
Core Expansion Core Expansion
edreamsodigeo.com | 10Business Evolution
Bookings (‘000) 3 Months Year to date
+9% +9%
2,433 7,762
2,227 7,124
Flight
3 Months 3 Months 9 Months 9 Months
December FY16 December FY17 December FY16 December FY17
+17% 694 +7% 742
245
210
Non-Flight
3 Months 3 Months 9 Months 9 Months
December FY16 December FY17 December FY16 December FY17
Revenue Margin
(€ million)
+3%
+3% 274.3
82.6 85.3 266.1
Flight
3 Months 3 Months 9 Months 9 Months
December FY16 December FY17 December FY16 December FY17
+14% 23.4 +11% 75.4
20.5 67.7
Non-Flight
3 Months 3 Months 9 Months 9 Months
December FY16 December FY17 December FY16 December FY17
edreamsodigeo.com | 11Business review by business line
Progress in strategic initiatives have boosted our performance and position us well for longer term
growth. In the first nine months of fiscal year 2017 we delivered solid growth rates in flight
bookings, up 9% year-on-year. We continue to make investments in order to build scale, become
more agile, improve the business model, and create a better customer experience.
Revenue margin performance in our flight business experienced growth rates of 3%, reaching
€274.3 million for the first nine months of fiscal year 2017. Revenue margin growth was driven by
growth in bookings, which were up 9% year-on-year. Revenue Margin per Booking for flight
products was down 5%, as a result of channel mix re-alignment and price re-orientation, which also
produced reduction in cost per booking and increase in profitability per booking, and the negative
impact of the foreign exchange, already explained. This negative impact was partially offset by the
positive impact from our revenue diversification strategy, which included flight related ancillaries,
which delivered solid results.
Bookings trend in our Non-flight business improved as a result of our diversification strategy, up 7%
in the first nine months of FY 2017, and an increase of 17% for the 3 months to December for FY
2017. The growth was driven by car rentals, hotels and dynamic packages, and was partially offset
by a planned decrease in our packaged tours business.
Non-flight revenue margin grew for the fifth consecutive quarter. The growth was primarily driven
by growth in car rentals, hotels and dynamic packages, and by the development of metasearch.
Revenue growth was partly offset due to the decline in packaged tours. For the first nine months of
FY 2017 these businesses grew revenue margin by 11%.
Revenue Margin Breakdown
Q3 FY 2016 Q3 FY 2017
20%
22%
80% 78%
Flight Non-flight Flight Non-flight
edreamsodigeo.com | 12New KPIs – Full definition and reconciliation at the
glossary in page 49-56
Revenue Diversification ratio Product Diversification ratio
44%
29%
25% 37%
Q3 FY16 Q3 FY17 Q3 FY16 Q3 FY17
Acquisition spend per booking index Customer Repeat booking rate
100 40%
83 39%
77
Q4 FY15 Q3 FY16 Q3 FY17
Baseline Q3 FY16 Q3 FY17
Bookings coming from mobile channels
edreamsodigeo.com | 13Outlook
The focus for the rest of fiscal year 2017 will be investing for the long term sustainability of the
business. We will invest to reinforce our delivery of sustainable profit growth, some of which will
deliver results in the longer term, including adapting our revenue model to respond to changing
customer needs and developing off-line advertising, which we do not expect to generate revenue
immediately.
As a result of the Q3 performance, we have raised on annual targets for fiscal year 2017. All M&A
transactions taking place in fiscal year 2017 has been reflected in the guidance:
Initial Guidance Revised Guidance
(June 2016) (February 2017)
Bookings 11.2-11.5Mn
In excess of 10.7 Mn
(million) 5-8% growth y-on-y
Revenue Margin 465-475 million euros
In excess of 463 million euros
(million euros) 0-2% growth y-on-y
Adjusted EBITDA 103-107 million euros 105-107 million euros
(million euros) 8-12% growth y-on-y 10-12% growth y-on-y
Over the longer term, and as we execute the next phase of our transformation, we will continue to
grow absolute EBITDA with a long-term target of EUR 125-140m EBITDA by 2020.
edreamsodigeo.com | 14Financial Review
Analysis of Income Statement – Full P&L in page 23
3M 3M 9M 9M
Dec Dec Var Dec Dec Var
(in € million) 2015 2016 2015 2016
Revenue margin 103.1 108.7 5% 333.9 349.7 5%
Variable costs -65.4 -64.9 -1% -218.7 -214.6 -2%
Fixed costs -18.0 -22.0 22% -51.1 -59.3 16%
Adjusted EBITDA 19.7 21.7 10% 64.1 75.9 18%
Non recurring items -1.6 -2.7 65% -7.1 -6.9 -3%
EBITDA 18.1 19.0 5% 57.0 69.0 21%
D&A incl. Impairment -4.5 -4.4 -2% -14.1 -14.5 3%
EBIT 13.5 14.6 8% 42.9 54.4 27%
Financial result -11.6 -30.6 163% -34.7 -51.3 48%
Income tax -0.3 1.0 n.a. -1.7 -6.2 n.a.
Net income 1.6 -14.9 n.a. 6.5 -3.0 n.a.
Adjusted net income 2.5 3.0 19% 10.9 19.4 78%
Revenue Margin increased by 5%, to €349.7 million, principally due to an increase in Bookings by
9% and partly offset by a decrease of 4% in Revenue Margin per Booking in line with our strategy to
to improve product, re-orient price and channel performance.
Variable costs decreased by 2% as increased bookings were more than offset by a reduction in cost
per booking of 10% year-on-year. Reductions in variable costs per booking were achieved as a
result of the positive impact of our strategy to re-orient price and channel performance.
Fixed costs increased mainly due to higher personnel costs, primarily related to an increase in
personnel, higher external fees, mainly related to consultancy work, and offset by lower IT costs.
Adjusted EBITDA for the first nine months of fiscal year 2017 amounted to €75.9 million, up 18%
year-on-year.
Non-recurring items decreased by 3% mainly due to employees long term incentive plan (LTI)
expenses and contract terminations.
EBITDA growth was higher than Adjusted EBITDA growth, up 21% year-on-year due to the decrease
in non-recurring items.
edreamsodigeo.com | 15D&A and Impairment in line with previous fiscal year, full detail in the note 8 of our consolidated
accounts.
Financial loss in the first nine months of fiscal year 2017 increased by €16.6 million mainly
reflecting the write off of financing costs capitalized on previous RCF and the 2018 and 2019´s
bonds, and call premium expenses for repayment of old bonds.
Income tax increased by €4.5 million reflecting the increase in taxable profit.
Adjusted Net Income stood at €19.4 million, a 78% improvement year-on-year.
Analysis of Balance sheet – Full Balance Sheet in page 25
Dec Dec
(in € million) 2015 2016
Total fixed assets1 1,029.1 1,033.5
Total working capital2 -218.2 -252.0
Deferred tax -37.7 -42.6
Provisions -13.5 -10.5
Other non current assets / (liabilities) 6.9 3.1
Other current assets / (liabilities)3 0.1 0.0
Financial debt -465.0 -435.1
Cash and cash equivalents 65.5 77.0
Net financial debt -399.5 -358.1
Net assets 367.1 373.3
Compared to last year, main changes relate to:
Increase in total fixed assets, due to:
o An increase of software internally developed
o An increase in the financing fees capitalized due to the new Revolving Credit Facility
o Partially offset by the sale of assets related to the Corporate Travel Business in the
Nordics and Germany, and the impairment of certain assets of the Leisure Travel
Business in the Nordics.
Decrease of provisions due to the expiry of a tax contingency.
Decrease of other non current assets / (liabilities) mainly related to the reversal of a
receivable indemnity linked to the provision that has expired.
Increase of negative working capital due to working capital improvement initiatives.
Increase of deferred tax liability mainly due to technology developed in the US
1
Excluding non-current deposits and guarantees amounting to €3.4 million and €3.1 million in
December 2015 and 2016, respectively.
2
Including non-current deferred revenue amounting to €28.5 million and €23.3 million in December
2015 and 2016, respectively.
3
Including Financial Assets amounting to €0.1 million in December 2015.
edreamsodigeo.com | 16 Decrease of net financial debt, due to:
o Decrease of financial debt following the repurchase of €30m of the 2018 notes.
o Increase of Cash position.
Analysis of Cash Flow Statement – Full cash flow in page 27
3M 3M 9M 9M
Dec Dec Var Dec Dec Var
(in € million) 2015 2016 2015 2016
Adjusted EBITDA 19.7 21.7 10% 64.1 75.9 18%
Non recurring items -1.6 -2.7 65% -7.1 -6.9 -3%
Non cash items 1.6 0.3 NM -0.5 -0.5 NM
Income tax paid -2.3 -3.0 34% -4.7 -6.0 28%
Cash flow from operating activities -27.8 1.8 NM -4.7 41.7 NM
Cash flow from investing activities -6.5 -1.6 -76% -23.4 -14.1 -40%
Cash flow before financing -34.3 0.2 NM -28.1 27.6 NM
Treasury shares 0.0 -1.0 NM 0.0 -1.0 NM
Consent fee on change in covenant 0.0 0.0 NM -0.3 0.0 NM
Repurchase of 2018 Notes 0.0 0.0 NM 0.0 -29.1 NM
Debt issuance/ (repayment) -0.1 -1.5 NM -0.2 -1.8 NM
Bond call premium and other
0.0 -20.5 NM 0.0 -21.7 NM
refinancing flows
Financial expenses (net) -7.3 -10.6 45% -27.6 -28.8 4%
Cash flow from financing -7.4 -33.6 NM -28.2 -82.3 NM
Net increase / (decrease) in cash and
-41.7 -33.4 -20% -56.3 -54.7 -3%
cash equivalents
Cash and cash equivalents at end of
65.4 76.9 18% 65.4 76.9 18%
period (net of bank overdrafts)
Net cash from operating activities increased by €46.4 million, mainly reflecting:
Increased adjusted EBITDA by €11.8 million
Lower non-recurring items (+€0.2 million impact)
Lower change in working capital (+€35.7 million impact) as a result of working capital
improvement initiatives
Partially offset by higher income tax paid
edreamsodigeo.com | 17We have used cash in investments of €14.1 million compared to €23.4 million in the same period of
last year. The decrease in investing activities mainly relates to lower development costs of our
platform vs. last year, as license fees related to our new mid-back office negatively impacted last
year and was partly offset by the reversal of a license fee (amortized) following the end of a white
label agreement that positively impacted last year, and the positive impact as a result of the sale of
the corporate travel business.
As a result of all of the above, cash flow before financing increased from negative €28.1 million
euros to positive €27.6 million in fiscal year 2017.
Cash flow used in financing amounted to 82.4 million euros, compared to 28.2 million euros in the
same period of last year. The main difference is the 29.1 million euros related to the successful
repurchase of €30 million principal amount of our 2018 notes through a tender offer, on April 14th
2016, at a clearing price of 97% for a total of €29.1 million, Bond call premium and other refinancing
flows (€21.7 million), and higher financial expenses (€1.2 million)
Debt
In October 2016 the group successfully refinanced all its debt, with a full repayment of 2018 Notes
and 2019 Notes, and the issuance of 2021 Notes.
Both rating agencies Moodys and S&P re-affirmed our corporate family rating at B2 and B,
respectively, and both with stable outlook. The 2021 notes the rating for Moodys stand at B3 and for
S&P is at B.
As part of the refinancing the group was able to increase its Super Senior Revolver Credit Facility to
€147 million, to ensure it had ample headroom in terms of guarantees as business grows.
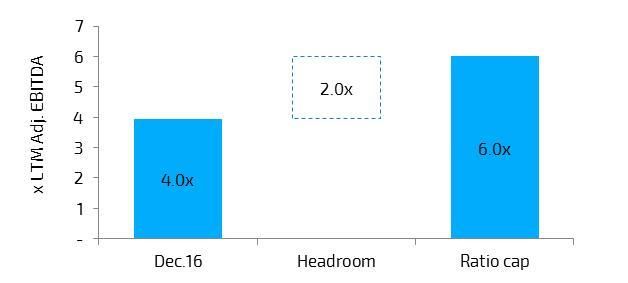
And the single maintenance covenant in our SS RCF was switched from 5.5x Net Debt to LTM
adjusted EBITDA to 6.0x Gross Leverage Ratio. At the end of December 2016 the Gross leverage ratio
was 4.0x, providing us with ample headroom. In addition, our Net Leverage Ratio was down from
4.3x in December 2015 to 3.3x in December 2016.
7
6
x LTM Adj. EBITDA
5 2.0x
4
3 6.0x
2 4.0x
1
-
Dec.16 Headroom Ratio cap
The terms also improved to allow for efficient repurchases of up to 10% of principal per year.
edreamsodigeo.com | 18Other information
Shareholder information
The subscribed share capital of eDreams ODIGEO at December 2016 is €10,584 thousand divided
into 105,835,298 shares with a par value of ten euros cents (€0.10) each, all of which are fully paid.
At December 31, 2016, the Group owns €1,000 thousand of Treasury shares recognised at cost and
deducted from equity.
Branches of the Company
The Company has no direct branches.
Important events that have occurred since December 31, 2016
See a description of the Subsequent events in Note 19 of the Notes to the Consolidated Financial
Statements attached hereafter.
edreamsodigeo.com | 19OUR PURPOSE
“To help people discover their
world through travel”
edreamsodigeo.com | 20Condensed Consolidated Interim
Financial Statements and Notes for
the nine-month period ended
December 31, 2016
and Subsidiaries
Registered office:
1, Boulevard de la Foire
L-1528 Luxembourg
R.C.S. Luxembourg B N° 159 036
As of June 15, 2016 the Board of Directors formally prepared and approved these Consolidated Financial Statements
for the year ended March 31, 2016.Condensed Consolidated Interim Income Statement
(Thousand of euros)
Un-audited Un-audited
Notes December 2016 December 2015
Revenue 6 360,126 351,829
Supplies (10,441) (17,957)
Revenue Margin 6 349,685 333,872
Personnel expenses 7 (58,076) (51,734)
Depreciation and amortization 8 (12,089) (13,462)
Impairment loss 8 & 2.1.5 (2,424) (669)
Gain or loss arising from assets disposals 2.1.5 - (2)
Other operating income / (expenses) 9 (222,655) (225,135)
Operating profit/(loss) 54,441 42,870
Financial and similar income and expenses
Interest expense on debt 10 (39,773) (31,078)
Other financial income / (expenses) 10 (11,498) (3,574)
Profit/(loss) before taxes 3,170 8,218
Income tax (6,169) (1,729)
Profit/(loss) for the year from continuing operations (2,999) 6,489
Profit for the year from discontinued operations net of taxes - -
Consolidated profit/(loss) for the year (2,999) 6,489
Non controlling interest - Result - -
Profit and loss attributable to the parent company (2,999) 6,489
Basic earnings per share (Euro) 5 (0.029) 0.062
Basic earnings per share (Euro) - fully diluted basis 5 (0.027) 0.059
The notes on pages 28 to 46 are an integral part of these Condensed Consolidated Interim Financial
Statements.
edreamsodigeo.com | 23Condensed Consolidated Interim Statement of Other
Comprehensive Income
(Thousand of euros)
Un-audited Un-audited
December 2016 December 2015
Consolidated profit/(loss) for the year (from the income statement) (2,999) 6,489
Income and expenses recorded directly in equity
Exchange differences (2,224) 1,411
For actuarial gains and losses (pensions) - -
Other income and expenses recorded directly in equity - -
Tax effect - -
(2,224) 1,411
Total recognized income and expenses (5,223) 7,900
a) Attributable to the parent company (5,223) 7,900
b) Attributable to minority interest - -
The notes on pages 28 to 46 are an integral part of these Condensed Consolidated Interim Financial
Statements.
edreamsodigeo.com | 24Condensed Consolidated Interim Balance Sheet
(Thousand of euros)
Statement
Un-audited Audited
ASSETS Notes December 2016 March 2016
Non-current assets
Goodwill 11 721,726 728,377
Other intangible assets 12 298,573 294,616
Tangible assets 8,050 7,642
Non-current financial assets 8,254 4,962
Deferred tax assets 254 2,298
Other non-current assets - 3,599
1,036,857 1,041,494
Current assets
Inventory - 800
Trade and other receivables 74,625 66,237
Current tax assets 11,004 10,075
Financial assets - 74
Cash and cash equivalent 13 77,018 132,077
162,647 209,263
TOTAL ASSETS 1,199,504 1,250,757
Un-audited Audited
EQUITY AND LIABILITIES Notes December 2016 March 2016
Shareholder's Equity
Share Capital 10,584 10,488
Share Premium 974,512 974,512
Other Reserves (604,782) (622,543)
Treasury shares (1,000) -
Profit and Loss for the period (2,999) 12,427
Foreign currency translation reserve (2,962) (738)
373,353 374,146
Non controlling interest - -
14 373,353 374,146
Non-current liabilities
Non-current financial liabilities 16 420,901 446,463
Non current provisions 17 3,179 6,659
Deferred revenue 23,349 26,206
Deferred tax liabilities 42,846 43,518
Other non-current liabilities - -
490,275 522,846
Current liabilities
Trade and other payables 305,525 315,211
Current provisions 17 7,324 9,861
Current taxes payables 8,786 12,268
Current financial liabilities 16 14,241 16,425
335,876 353,765
TOTAL EQUITY AND LIABILITIES 1,199,504 1,250,757
The notes on pages 28 to 46 are an integral part of these Condensed Consolidated Interim Financial
Statements.
edreamsodigeo.com | 25Condensed Consolidated Interim Statement Change in
Equity
(Thousand of euros)
Foreign
Profit &
Share Share Other Treasury currency
Loss for the Total Equity
Capital premium Reserves shares translation
period
reserve
Closing balance at March 31, 2016 (Audited) 10,488 974,512 (622,543) 12,427 - (738) 374,146
Total recognized income / (expenses) - - - (2,999) - (2,224) (5,223)
Capital Increases / (Decreases) (Note 14) 96 - (96) - - - -
Dealings with own shares or equity instruments (Note 14 ) - - - - (1,000) - (1,000)
Operations with members or owners 96 - (96) - (1,000) - (1,000)
Payments based on equity instruments (Note 15 ) - - 5,431 - - - 5,431
Transfer between equity items - - 12,427 (12,427) - - -
Other changes - - (1) - - - (1)
Other changes in equity - - 17,857 (12,427) - - 5,430
Closing balance at December 31, 2016 (Un-audited) 10,584 974,512 (604,782) (2,999) (1,000) (2,962) 373,353
Foreign
Profit &
Share Share Other Treasury currency
Loss for the Total Equity
Capital premium Reserves shares translation
period
reserve
Closing balance at March 31, 2015 (Audited) 10,488 974,512 (444,793) (181,306) - (1,530) 357,371
Total recognized income / (expenses) - - - 6,489 - 1,411 7,900
Operations with members or owners - - - - - - -
Payments based on equity instruments - - 1,829 - - - 1,829
Transfer between equity items - - (181,306) 181,306 - - -
Other changes - - 8 - - - 8
Other changes in equity - - (179,469) 181,306 - - 1,837
Closing balance at December 31, 2015 (Un-audited) 10,488 974,512 (624,262) 6,489 - (119) 367,108
The notes on pages 28 to 46 are an integral part of these Condensed Consolidated Interim Financial
Statements.
edreamsodigeo.com | 26Condensed Consolidated Interim Cash Flow Statement
(Thousand of euros)
Un-audited Un-audited
Notes December 2016 December 2015
Net Profit / (Loss) (2,999) 6,489
Depreciation and amortization 8 12,089 13,462
Impairment and results on disposal of non-current assets (net) 8 & 2.1.5 2,424 669
Other provisions (2,951) (2,313)
Income tax 6,169 1,729
Gain or loss on disposal of assets 2.1.5 - 2
Finance (Income) / Loss 10 51,271 34,652
Expenses related to share based payments 15 5,431 1,829
Other non cash items (2,940) -
Changes in working capital (21,023) (56,515)
Income tax paid (6,011) (4,703)
Net cash from operating activities 41,460 (4,699)
Acquisitions of intangible and tangible assets (19,421) (24,235)
Proceeds on disposal of tangible and intangible assets 5,155 1,701
Acquisitions of financial assets (4) (857)
Payments/ Proceeds from disposals of financial assets 349 3
Net cash flow from / (used) in investing activities (13,921) (23,388)
Acquisition of Treasury Shares 14 (1,000) -
Borrowings drawdown 2.1.2 422,553 -
Reimbursement of borrowings 2.1.1 & 2.1.2 (453,405) (227)
Interest paid (28,844) (27,726)
Bond call premium and other refinancing flows (21,677)
Interest received 31 79
Fees paid on debt - (325)
Net cash flow from / (used) in financing activities (82,342) (28,199)
Net increase / (decrease) in cash and cash equivalent (54,803) (56,286)
Cash and cash equivalents at beginning of period 132,038 121,768
Effect of foreign exchange rate changes (325) (75)
Cash and cash equivalents at end of period 76,910 65,407
Cash at the closing:
Cash 13 77,018 65,501
Bank facilities&overdrafts 16 (108) (94)
Cash and cash equivalents at end of period 76,910 65,407
The notes on pages 28 to 46 are an integral part of these Condensed Consolidated Interim Financial
Statements.
edreamsodigeo.com | 27Notes to the Condensed Consolidated Interim Financial
Statements
1. GENERAL INFORMATION
eDreams ODIGEO (formerly LuxGEO Parent S.à r.l.) was set up as a limited liability company (société
à responsabilité limitée) formed under the Laws of Luxembourg on Commercial Companies on
February 14, 2011, for an unlimited period, with its registered office located at 1, Boulevard de la
Foire, L-1528 Luxembourg (the “Company” and, together with its subsidiaries, the “Group”). In
January 2014, the denomination of the Company was changed to eDreams ODIGEO and its corporate
form from an S.à r.l. to an S.A. (“Société Anonyme”).
eDreams ODIGEO and its direct and indirect subsidiaries (collectively the “Group”) headed by
eDreams ODIGEO, as detailed in Note 20, is a leading online travel company that uses innovative
technology and builds on relationships with suppliers, product know-how and marketing expertise
to attract and enable customers to search, plan and book a broad range of travel products and
services.
2. SIGNIFICANT EVENTS
2.1 Significant events during the nine-month period ended December 31, 2016
2.1.1 Repurchase of 2018 Notes
The Group, through its subsidiary Geo Debt Finance S.C.A., has repurchased €30 million of the 2018
Notes on April 14, 2016 at a clearing price of 97% (€29.1 million). All the repurchased Notes have
been cancelled.
The tender offer was made as part of eDreams’ liability management, to decrease its overall level of
debt and was financed out of the company’s cash flows.
2.1.2 Debt Refinancing
On September 20, 2016, the Group successfully priced an offering of €435,000,000 Senior Secured
Notes (“the new Bond”) due 2021 at a coupon of 8.50%. The debt offering was oversubscribed, and
increased from the originally announced amount of €425,000,000, which reflects the bond market’s
support for the company, its strategy and performance under the new leadership.
This transaction allows the company to extend the maturity of its debt from less than two years to
five years and, in addition, gain significant flexibility vs its current financing. In particular, the terms
of the new Bond allows the company to execute on its strategy to continue to reduce its debt in the
future, with contractual options to repurchase 10% of the nominal amount every year at a favorable
price.
edreamsodigeo.com | 28In addition, the company has also refinanced its Super Senior Revolving Credit Facility, increasing
the size to €147,000,000 from the current €130,000,000, and gaining significant flexibility as well
versus the current terms.
eDreams ODIGEO and certain of its subsidiaries guarantee the new Bond, and the new Bond is
secured by certain assets of eDreams ODIGEO. As it is explained in the Note 16 the settlement date
for the offering was October 4, 2016.
2.1.3 Modification of existing LTI Plan
On May 10, 2016, the Group approved a modification of the existing “Long Term Incentive Plan” for
Managers. The new scheme was based on operational performance, measured with stringent
financial and strategic objectives. It will have the benefit of generating long-term company value,
being simple to administer and align management and shareholder interest.
The accounting value of the plan after its modification is €13.1 million, €6.8 million more than before
the change.
This LTIP will last for 2 years and is designed to vest around financial results publications between
November 2016 and November 2017 (See note 15.1).
On November 2016, the First Tranche – First Installment shares have been delivered to the
Participants of the Plan.
2.1.4 New LTI Plan
On September 12, 2016, the Extraordinary Shareholders Meeting, upon proposal from the Board of
Directors, approved amendments to the Articles of Incorporation of the Company, necessary to
execute a new Long Term Incentive Plan for Managers, to ensure that it continues to attract and
retain high quality management and better align the interest of management and shareholders.
(See note 15.2).
The new LTIP is split in half performance shares and half restricted stock units subject to continued
service. Based on operational performance, the new scheme will be linked to stringent financial and
strategic objectives.
Total maximum dilution of the performance stock rights (“PSRs”) and restricted stock units (“RSUs”)
would represent, if fully vested, 6.32% of the total issued share capital of the company, over a
period of 4 years, and therefore 1.58% yearly average on a fully diluted basis.
The new LTIP will last for four years and is designed to vest around financial results publications
between August 2018 and February 2022 (See note 15.2).
edreamsodigeo.com | 292.1.5 Sale of Corporate Travel Business
During December 2016, the Group transferred the corporate travel business of the Travellink brand
in Germany, Sweden, Finland, Norway, and Denmark to Australian group Flight Centre Travel.
The line of business transferred is not a significant part of the Group’s business. As the Corporate
Travel Business of Travellink brand does not represent a separate major line of business or
geographical area of operations, it does not meet the criteria to be considered as discontinued
operation.
The value of the assets linked to this business was impaired before the sale was finalized for an
amount of €1.5 million.
The net assets transferred as part of the transaction are as follows:
December 2016
Goodwill 3,360
Other intangible assets 2,536
Tangible assets 19
Working Capital (1,111)
Total net assets transferred 4,804
As a result of the sale, no gain or loss has arisen.
The Group has reclassified the proportionate share of the cumulative amount of the exchange
differences recognised in other comprehensive income to Profit and Loss for an amount of €0.4
million.
2.1.6 Change in management
Management has decided the appointment of Carsten Bernhard as Chief Technology Officer and
Gerrit Goedkoop as Chief Operating Officer, strengthening our senior management team.
Gerrit Goedkoop, who previously served as Chief Customer Officer for eDreams Odigeo will now
take up position as Chief Operating Officer. Gerrit has been with eDreams since 2014.
Philippe Vimard, who previously served as Chief Technology Officer and Chief Operating Officer is
leaving the business after 6 years.
These management changes were effective from August 1, 2016.
edreamsodigeo.com | 302.2 Significant events during the year ended March 31, 2016
2.2.1 Covenant ratio increase consent from lenders
On June 2015, the Company obtained consent from lenders under the €130 million Super Senior
Revolving Credit Facility (SSRCF) to increase the ratio of Consolidated Total Net Debt to
Consolidated EBITDA from 5.50:1 to 6.00:1 for the Relevant Period ending on 31 December 2015 only.
The purpose of this amendment was to allow the Company to support its strategy with potential
acquisitions, which can be funded from internal cash, but without eating into covenant headroom
during the seasonally low point of December.
2.2.2 Change in management
Effective September 22, 2015, eDreams ODIGEO (“the Company”) accepted the resignation of Mr.
Mauricio Luis Prieto Prieto as an Executive member from the Board of Directors. Mr. Prieto was a
co-founder of the Company.
On July 22, 2015 was announced the appointment of Ms. Amanda Wills and Mr. David Elizaga
Corrales as an Independent and Executive Director, respectively.
2.2.3 Change in Barcelona offices
On July 2015, the Group moved its Barcelona offices from “World Trade Center” to new offices
located in Carrer Bailen and Zona Franca (both located also in Barcelona). The cost of new furniture
and general installations related to the refurbishment amounted to €2.3 million.
3. BASIS OF PRESENTATION
3.1 Accounting principles
The accounting policies used in the preparation of these condensed Condensed Interim
Consolidated Financial Statements as of and for the nine months period ended December 31, 2016
are the same as those applied in the Group’s consolidated annual accounts for the year ended
March 31, 2016, except for the following:
- New IFRS or IFRIC issued, or amendments to existing ones that came into effect as of April
1, 2016, the adoption of which did not had a significant impact on the Group’s financial
situation in the period of application;
- Income tax which, in accordance with IAS 34, is recorded in interim periods on a best
estimate basis.
- The Impairment test performed at March 31, 2016 has not been updated as of December 31,
2016, as no impairment indicator was identified, and therefore the Condensed Consolidated
Interim Financial Statements have not reflected any adjustment related to the impairment
analysis, as at December 2016.
edreamsodigeo.com | 31There is no accounting principle or policy which would have a significant effect and has not been
applied in drawing up these financial statements.
3.2 New and revised International Financial Reporting Standards
The new IFRS and interpretations published as of March 31, 2015 and effective from April 1, 2015
listed in the Note 3.2 – New and revised International Financial Reporting on the Consolidated
Financial Statement for the year ended March 31, 2016, had no material impact on the Group interim
Condensed Interim Consolidated Financial Statements at December 31, 2016.
The Group has not early adopted standards and interpretations that are not yet mandatorily
effective at April 1, 2016.
3.3 Changes in consolidation perimeter
There have been no changes in the consolidation perimeter since March 31, 2016.
3.4 Comparative information
The Directors present, for comparative purposes, together with the figures for the nine months
period ended December 31, 2016, the previous periods’ figures for each of the items on the annual
consolidated statement of financial position (March 31, 2016), condensed consolidated interim
income statement, condensed consolidated interim statement of other comprehensive income,
condensed consolidated interim statement of changes in equity, condensed consolidated interim
cash flow statement (December 31, 2015) and the quantitative information required to be disclosed
in the condensed consolidated interim financial statements.
4. SEASONALITY OF BUSINESS
We experience seasonal fluctuations in the demand for travel services and products offered by
us. Because we generate the largest portion of our revenue margin from flight bookings, and most
of that revenue for flight is recognized at the time of booking, we tend to experience higher
revenues in the periods during which travelers book their vacations, i.e., during the first and second
calendar quarters of the year, corresponding to bookings for the busy spring and summer travel
seasons. Consequently, comparisons between subsequent quarters may not be meaningful.
edreamsodigeo.com | 325. EARNINGS PER SHARE
The basic earnings per share are calculated by dividing the profit attributable to equity holders of
the company by the average number of shares.
The calculation of basic earnings per share (rounded to two digits) for the nine-month period ended
December 31, 2016 and 2015, is as follows:
December 2016 December 2015
Profit Profit
attributable to Average attributable to Average
Basic Earnings Basic Earnings
the owners of Number of the owners of Number of
per Share (€) per Share (€)
the parent (€ shares the parent (€ shares
thousand) thousand)
(2,999) 104,656,796 (0.029) 6,489 104,878,049 0.062
In the earning per share calculation as of December 31, 2016 and 2015 dilutive instruments are
considered for the Incentive Shares granted (See note 15).
The calculation of fully diluted earnings per share for the nine-month period ended December 31,
2016 and 2015, is as follows:
Basic Earnings per Share - fully diluted basis
December 2016 December 2015
Profit Profit
attributable to Average attributable to Average
Basic Earnings Basic Earnings
the owners of Number of the owners of Number of
per Share (€) per Share (€)
the parent (€ shares the parent (€ shares
thousand) thousand)
(2,999) 109,763,039 (0.027) 6,489 109,750,993 0.059
edreamsodigeo.com | 336. SEGMENT INFORMATION
The following is an analysis of the Group’s Profit & loss breakdown by reportable segments, as well
as bookings by reportable segments:
December 2016
Core Expansion TOTAL
Gross Bookings 1,686,507 1,632,204 3,318,711
Number of bookings 4,388,524 4,115,504 8,504,029
Revenue 201,747 158,378 360,126
Revenue Margin 196,736 152,949 349,685
Variable costs (114,652) (99,901) (214,553)
Marginal Profit 82,084 53,048 135,132
Fixed costs (59,277)
Depreciation and amortization (12,089)
Impairment and results on
disposal of non-current assets (2,424)
Others (6,901)
Operating profit/(loss) 54,441
Financial result (51,271)
Profit before tax 3,170
December 2015
Core Expansion TOTAL
Gross Bookings 1,632,228 1,685,138 3,317,366
Number of bookings 3,953,713 3,863,930 7,817,643
Revenue 195,419 156,410 351,829
Revenue Margin 182,183 151,689 333,872
Variable costs (111,434) (107,261) (218,695)
Marginal Profit 70,749 44,428 115,177
Fixed costs (51,058)
Depreciation and amortization (13,462)
Impairment and results on
disposal of non-current assets (671)
Others (7,116)
Operating profit/(loss) 42,870
Financial result (34,652)
Profit before tax 8,218
Gross bookings is an operating and statistical metric that captures the total amount paid by
customers for travel products and services booked through or with us, including taxes, service fees
and other charges and excluding VAT. Gross Bookings include the gross value of transactions
booked under both agency and principal models as well as transactions made under white label
arrangements and transactions where we just act as “pure” intermediary whereby we serve as a
click-through and pass the reservations made by the customer to the relevant travel supplier.
edreamsodigeo.com | 347. PERSONNEL EXPENSES
7.1 Personnel expenses
This item breaks down as follows:
Un-audited Un-audited
December 2016 December 2015
Wages and salaries 39,824 36,338
Social security costs 10,706 10,781
Pensions costs (or employees welfare expenses) 1,122 828
Share-based compensation 5,412 1,829
Other personnel expenses 1,012 1,958
Total personnel expenses 58,076 51,734
8. DEPRECIATION, AMORTIZATION AND IMPAIRMENT
This item breaks down as follows:
Un-audited Un-audited
December 2016 December 2015
Depreciation of tangible assets 1,771 1,763
Amortization of intangible assets (see Note 12) 10,318 11,699
Total Depreciation and amortization 12,089 13,462
Impairment of tangible assets 80 519
Impairment of intangible assets and goodwill (see Notes 11 and 12 ) 2,344 150
Impairment 2,424 669
Amortization of intangible assets primarily related to the capitalized IT projects as well as the
intangible assets identified through the purchase price allocation.
In connection with the sale of our corporate travel business in the Nordics and Germany, we have
impaired the value of the assets linked to this business to the expected value to be received in the
potential sale less the cost to sell for an amount of €1.5 million.
Additionally, fixed assets in relation with the leisure business in the Nordics operated through the
subsidiary Travellink AB have been impaired for an amount of €0.9 million.
For the closing of December 2016, the Company did not update the impairment test performed at
March 31 2016. As per management understanding since that date, there have been no events which
could impact significantly and change the conclusions reached as per the impairment test
performed as of March 31, 2016, other than those mentioned above. Therefore these consolidated
financial statements as of December 2016 have not reflected any adjustment related to the
impairment analysis. An impairment test will be performed before year-end once the financial
projections will be updated and approved by management.
edreamsodigeo.com | 359. OTHER OPERATING INCOME/ (EXPENSES)
This item breaks down as follows:
Un-audited Un-audited
December 2016 December 2015
Marketing and other operating expenses 204,121 206,228
Professional fees 9,536 6,123
IT expenses 4,916 6,117
Rent charges 2,774 2,955
Taxes 925 461
Foreign exchange gains/(losses) (95) (79)
Non-recurring expenses 478 3,330
Total other operating income and expenses 222,655 225,135
Other operating expenses primarily consist in marketing expenses, credit card processing costs
(incurred only under the merchant model), chargebacks on fraudulent transactions, IT costs relating
to the development and maintenance of our technology, GDS search costs and fees paid to our
outsourcing service providers, such as call centers or IT services.
The marketing expenses comprise customer’s acquisition costs (such as paid search costs,
metasearch costs and other promotional campaigns) and commissions due to agents and white
label partners.
A large portion of the other operating expenses are variable costs, either because they are directly
related to the number of transactions processed through us or because they result from
discretionary decisions from our management.
edreamsodigeo.com | 3610. FINANCIAL AND SIMILAR INCOME AND EXPENSE
This item breaks down as follows:
Un-audited Un-audited
December 2016 December 2015
Interest expense on 2019 Notes (7,176) (10,037)
Interest expense on 2018 Notes (11,950) (18,281)
Interest expense on 2021 Notes (9,243) -
Interest expense on Revolving Credit Facilities (372) (306)
Effective interest rate impact on debt (11,032) (2,454)
Interest expense on debt (39,773) (31,078)
Foreign exchange differences 756 (887)
Other financial expense (13,184) (2,773)
Other financial income 930 86
Other financial income / expense (11,498) (3,574)
TOTAL FINANCIAL RESULT (51,271) (34,652)
As detailed in the Note 2.1.1, on April 14, 2016 the Group repurchased €30 million of the 2018 Senior
Notes at a clearing price of 97% (€29.1 million). The impact of the clearing price lower than 100% is
an income in other financial income of €0.9 million.
Additionally, as detailed in the Note 2.1.2, the Group has refinanced its debt repaying the 2018 and
2019 Senior Notes, and obtaining the new 2021 Senior Notes.
Consequently, one-off redemption expenses have been registered amounting to €8.9 million
classified in “Other financial expenses”.
The caption “Effective interest rate on debt” includes €0.6 million and €5.8 million of capitalized
interest recognized directly into expenses in connection with the above mentioned repurchase of
2018 Senior Notes and repayment of the 2018 and 2019 Senior Notes respectively.
edreamsodigeo.com | 3711. GOODWILL
A detail of the goodwill movement for the nine-month periods ended December 31, 2016 and 2015
are set out below:
Balance at March 31, 2016 (audited) 728,377
Exchange rate diferences (1,818)
Impairment (1,472)
Disposals (See Note 2.1.5) (3,360)
Balance at December 31, 2016 (un-audited) 721,726
Balance at March 31, 2015 (audited) 727,820
Exchange rate diferences 1,029
Impairment -
Changes in the scope -
Balance at December 31, 2015 (un-audited) 728,849
As at December 31, 2016, the amount of the goodwill corresponding to the Nordic markets has
decreased due to the evolution of the euro compared to the functional currency of these countries,
with a balancing entry under “Foreign currency translation reserve”.
As we mentioned in the Note 8, the Company has not identified further impairment indicators and
therefore did not update the impairment test performed at December 31, 2016. However, as
explained in note 2.1, the Goodwill linked with the Corporate travel business of Travellink has been
impaired in the period prior to the sale to Australian group Flight Centre Travel.
The goodwill allocation by markets at December 31, 2016 and 2015 was as follows:
December December
2016 2015
Markets
France 326,522 326,522
Spain 49,073 49,073
UK 39,033 39,033
Italy 44,087 44,087
Germany 155,718 155,718
Nordics 43,975 51,098
Metasearch 8,608 8,608
Other 54,710 54,710
Total 721,726 728,849
edreamsodigeo.com | 3812. OTHER INTANGIBLE ASSETS
The other intangible assets at December 31, 2016 and 2015 break down as follows:
Balance at March 31, 2016 (audited) 294,616
Acquisitions 18,174
Amortization (see note 8) (10,318)
Impairment (872)
Disposals (See note 2.1.5) (2,598)
Exchange rate diferences (429)
Balance at December 31, 2016 (un-audited) 298,573
Balance at March 31, 2015 (audited) 282,581
Acquisitions 22,015
Amortization (see note 8) (11,699)
Impairment (150)
Disposal of intangible assets (1,700)
Exchange rate diferences 236
Balance at December 31, 2015 (un-audited) 291,283
“Acquisitions” mainly correspond to the capitalization of the technology internally developed by the
Group which, due to its functional benefits, contributes towards attracting new customers and
retaining the existing ones.
13. CASH AND CASH EQUIVALENT
Shown below is a breakdown of cash and cash equivalent:
Un-audited Audited
December 2016 March 2016
Marketable securities 8 8
Cash and other cash equivalent 77,010 132,069
Cash and cash equivalent 77,018 132,077
At the closing of March, 2016, the majority of the bank accounts and marketable securities were
pledged to secure the obligations in respect of the Group financial indebtedness. At the closing of
December 2016, after the refinancing mentioned in Note 2.1.2, the bank accounts and marketable
securities are no longer pledged.
edreamsodigeo.com | 3914. EQUITY
14.1 Share capital
On November 14th, 2016 the company issued share capital of €95,724.90, represented by 957,249
ordinary shares, of €0.10 each, paid through the incorporation of available reserves of the Group.
These shares have been delivered to management employees as a partial share-based-payment
retribution disclosed in the Note 15.1.
As a result of the new shares’ issuance, the subscribed share capital of eDreams ODIGEO at
December 2016 is €10,584 thousand divided into 105,835,298 shares with a par value of ten euros
cents (€0.10) each, all of which are fully paid.
14.2 Share premium
The share premium account may be used to provide for the payment of any shares, which the
Company may repurchase from its shareholders, to offset any net realized losses, to make
distributions to the shareholders in the form of a dividend or to allocate funds to the legal reserve.
14.3 Foreign currency translation reserve
The foreign currency translation reserve correspond to the net amount of the exchange differences
arising from the translation of the financial statements of eDreams LLC, eDreams Ltd., Liligo
Hungary Kft, Findworks Technologies Bt and Travellink since they are expressed in currencies other
than the euro.
14.4 Equity-settled share-based payments
The amount recognized under “payment based on equity instruments” in the consolidated balance
sheet at December 31, 2016 and March 31, 2016 arose as a result of the Long Term Incentive plan
given to the employees during the current year (see Note 15).
14.5 Treasury shares
Own equity instruments that are reacquired (treasury shares) have been recognised at cost and
deducted from equity.
No gain or loss is recognised in profit or loss on the purchase, sale, issue or cancellation of the
Group’s own equity instruments. Any difference between the carrying amount and the
consideration, if reissued, is recognised in equity.
15. SHARE-BASED COMPENSATION
15.1 Long term Incentive Plan 1b
A Long Term Incentive Plan (“Incentive Plan”) in which certain employees of the Company or any
subsidiaries (the “Participants”) may participate was granted on September 26, 2014. The purpose
edreamsodigeo.com | 40of this Incentive Plan was to enable the Participants to participate in the possible increase in value
of the Company.
The total maximum number of shares that could be acquired by the Participants under the Incentive
Plan represents 4.4% of the total issued share capital of the Company on a fully diluted basis.
The Incentive Plan basically concerns the granting of the right to receive a certain number of shares
in the Company (called Incentive Shares) to the Participants, provided that certain conditions are
met:
Service condition: the Participants must be employed by the Company or any subsidiary
during a certain period of time i.e. he must hold an active employment or services
relationship until a certain future date.
Market–performance condition: the target increase in value of the Company’s shares must
be reached.
The Incentive Plan refers to the ordinary shares issued by eDreams ODIGEO, S.A.
As at March 31, 2016 4,525,591 Incentives Shares were granted under the Incentive Plan.
On May 10, 2016, the Group approved a modification of the existing Long Term Incentive Plan for
Managers. The modified scheme will be based on operational performance, measured with
stringent financial and strategic objectives. It will have the benefit of generating long-term
company value, being simple to administer and align management and shareholder interest.
All currently employed managers that were eligible for the change have been granted the new plan
as an alternative to the existing plan on June 2016.
964,459 Incentives Shares granted under the old Incentive Plan were not modified to the new Plan
as they corresponded to past employees that had already vested part of the old Plan or current
employees that had served notice of resignation.
As a consequence of this modification, the updated accounting value of this plan was €13.1 million,
€6.8 million more than before the change.
This LTIP will last for 2 years and is designed to vest around financial results publications between
November 2016 and November 2017.
As at December 31, 2016 4,401,443 Incentives shares were granted under the new Incentive Plan, of
which 957,249 shares (the First Tranche – First Installment) have already been delivered as shares
in November 2016.
The cost regarding the Long Term Incentive Plans has been recorded in the Income Statement
(Personnel expenses) (see Note 7) and against Equity (see Note 14), amounting €5.4M and €1.8M in
December 31, 2016 and 2015 respectively.
edreamsodigeo.com | 4115.2 Long term Incentive Plan 2
On September 12, 2016, the Extraordinary Shareholders Meeting, upon proposal from the Board of
Directors, approved amendments to the Articles of Incorporation of the Company, necessary to
execute a new Long Term Incentive Plan for Managers, to ensure that it continues to attract and
retain high quality management and better align the interest of management and shareholders.
The new LTIP is split in half performance shares and half restricted stock units subject to continued
service. Based on operational performance, the new scheme will be linked to stringent financial and
strategic objectives.
Total maximum dilution of the performance stock rights (“PSRs”) and restricted stock units (“RSUs”)
would represent, if fully vested, 6.32% of the total issued share capital of the company, over a
period of 4 years, and therefore 1.58% yearly average on a fully diluted basis.
The new LTIP will last for four years and is designed to vest around financial results publications
between August 2018 and February 2022.
2,954,972 Incentive Shares have been granted under this Plan on December 31, 2016, so there has
been no impact in the Financial Statements.
edreamsodigeo.com | 42You can also read