Corporate Presentation September 2021 - Tourmaline Oil

Page created by Dale Cooper
 
CONTINUE READING
Corporate Presentation September 2021 - Tourmaline Oil
Corporate Presentation
   September 2021
Corporate Presentation September 2021 - Tourmaline Oil
Tourmaline Overview                                                                                                                                     2

                                                                                        The Scale, Resource, and Infrastructure Required to Profitably
                                                                                        Grow in the WCSB and Provide Returns to Shareholders Sept 2021

      Tourmaline Overview                                                                                                                3.0 MM Net Acres, 3.3 Billion Boe 2P Reserves(1)
                                                                                                                                        Conroy
      •    Largest natural gas producer in Canada
                                                                                                                                                                                                                                  Drilled to Date
      •    5th largest Canadian gas processing midstream operator               Aitken
                                                                                                     Birley   T95

      •    3.3 Billion Boe 2P Reserves, 15.5 Tcf Gas, 738 MMbbls liquids       Gundy
                                                                                                                                                                                                >75yrs of                         2021 Drilling
      •    Lowest capital cost operator in the basin                                                                                                                                             Drilling
                                                                                                                                                                                               Inventory(1)                       Booked
      •    Lowest net emissions and intensity of Canadian senior producers                                    T85
                                                                                                                                                                                                                                  Locations
            • 39% emission intensity reduction since ‘13(1); rated “A” by MSCI      Montney
                                                                                                                                                                                                                                  Unbooked
                                                                                   Gas/Cond                                                                                                                                       Resource
      •    Peer-leading cash flow growth & free cash flow generation              (Third Largest
                                                                                      Montney                                                                                          Peace                            T75
      •    Investment Grade BBB (High) rated by DBRS                                                                                                                                                                             NE
                                                                                     Producer)                                                                                       River High                                  BC
      •    Largest insider ownership amongst Seniors, 4x peer average                                                                                                                                                                   Alberta
                                                                                                                                                                                  Wapiti
      Tourmaline’s scale in Canada’s premium gas plays, production base and                                                                                                                Alberta Deep Basin
      low cost infrastructure, provide investors a suite of advantages with                                                                                                                  (Largest Deep Basin              T 65
                                                                                    Tourmaline Lands                                                                                              Producer)
      efficiency, profitability, growth, and return on (and of) capital                                     Cutpick
      unparalleled by peers                                                              Three massive operated
                                                                                                                                                                                                                                         T 55
      Current Production                                                                                                                        complexes, derisked by
                                                                                                                                               1,765 wells drilled to date
      •        Q3 production forecast 450,000 – 460,000 boepd                                                                                  with company constructed
                                                                                                                                                 infrastructure in place
      •        2021 Average production forecast 440,000 - 445,000 boepd                                                                                                                                                       Brazeau
                                                                                                                                                                                                                                         T 45

                                                  Financial Position(2)                                                                                              Investment            Proposition(2)

      Market Capitalization (Sept 15th)                                                                               $13.9B                Debt Adj. Cash Flow Per Share Growth 2022/2021                                           >40%
      Net Debt (2021E) / net of TPZ Equity Stake (Sept 15th)                                               $1.0B / $0.1B                    Total Payout Ratio (2021 / 2022)                                                  63% / 38%
      Enterprise Value (2021E)                                                                                   $14.0B                     Free Cash Flow Yield (2021 / 2022)                                                12% / 18%
      Net Debt (2021E) to Cash Flow (2021E)                                                                         0.3x                    2021 Dividend Yield (Base / Base + Special)                                         2% / 3%
      2021 Cash Flow (Guidance)                                                                                          $3.0B              Five Year Plan Cumulative Free Cash Flow                                             $8.1B
(1)       See schedule A in corporate presentation appendix; inventory life at 2021 pace of development (hz locations only), reserves and acreage as of December 31st 2020; Intensity reduction proforma 2019 Pneumatic Devices Program
(2)       DACFPS, liquids growth and FCF per five year plan, see current five year plan slide for definition of FCF, all market data as per September 15th, 2021; EV presented net of TPZ equity value; TPZ equity stake proforma Sept 21 sale.
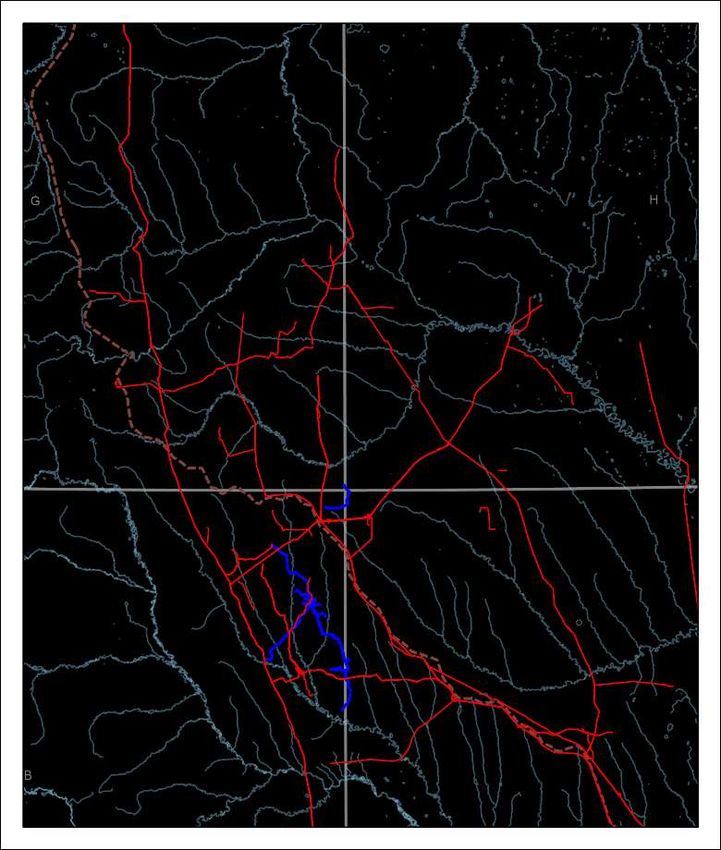
Corporate Presentation September 2021 - Tourmaline Oil
3

                                                              GHG Emissions – Peer Comparison
                                                                                                                                                           May 2021

Tourmaline has the lowest GHG emissions intensity (CO2e/boe) among Canadian Senior E&P peers

                                                             Canadian E&P GHG Emissions 2019

                          30,000,000
                                                                                      Tourmaline has achieved a 31% reduction in C02             0.12
                                                                                        emissions intensity between 2013 and 2019
                                                                                      Pneumatic devices program to reduce intensity to
                          25,000,000                                                                39% effective 2020                           0.10

                                                                                      We are targeting a 25% reduction in total methane
                          20,000,000                                                  emissions by 2023 (on track for 2021) and reduce           0.08

                                                                                                                                                        (tonnes CO2 (e)/boe)
    Gross CO2 Emissions

                                                                                       corporate emissions intensity by 25% by 2027(4)
      (tonnes CO2 (e))

                                                                                                                                                            CO2 Intensity
                          15,000,000                                                                                                             0.06

                          10,000,000                                                                                                             0.04

                           5,000,000                                                                                                             0.02

                                  -                                                                                                              -
                                         CNRL       Suncor      Imperial     Husky         Cenovus     Crescent Point      MEG     Tourmaline
    Q4 2019 Production                 1,156,000   778,000      362,000     311,000        467,000        145,000         95,000    300,000

    Notes:
    1. Based on CDP (Carbon Disclosure Project) data and includes Scope 1 and 2 emissions.                                           Gross CO2 Emissions
    2. Represents 2019 data.                                                                                                         CO2 Intensity
    3. Emission intensity derived by Gross CO2 Emissions divided by total production for the year.
    4. See sustainability report for details; reductions based off 2018 levels, corporate reduction targets on a Scope 1 basis.
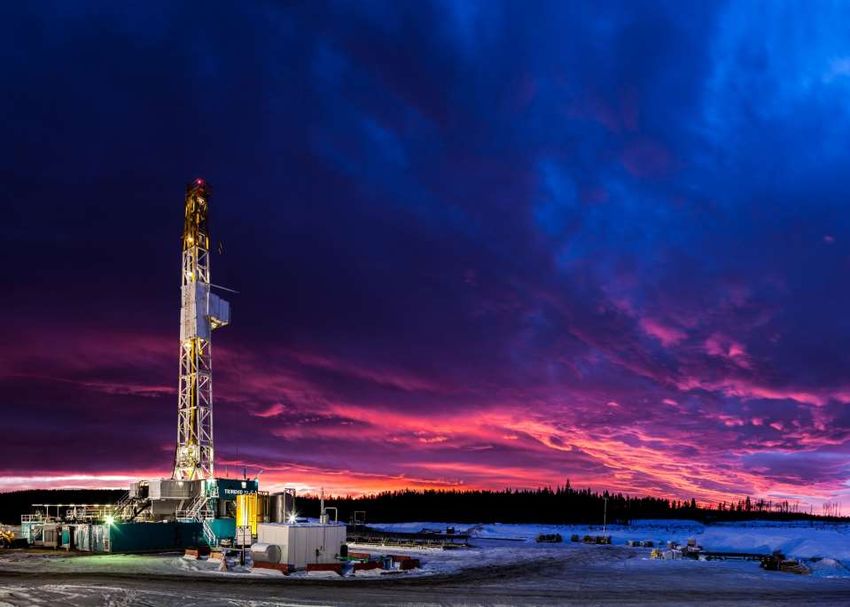
Corporate Presentation September 2021 - Tourmaline Oil
4

                                                                                       A History of Full Cycle Profitability
                                                                                                                                                       Mar 2021
                                   $800                                                                                                                  $5.00
                                                                 Earnings before taxes ($mm)   AECO (CAD$/mcf)      NYMEX (USD$/MMbtu)
                                                                                                                                                         $4.50
                                   $700

                                                                                                                                                         $4.00
                                   $600
Earnings before tax ($ millions)

                                                                                                                                                         $3.50

                                   $500
                                                                                                                                                         $3.00

                                                                                                                                                                 (Gas Price)
                                   $400                                                                                                                  $2.50

                                                                                                                                                         $2.00
                                   $300

                                                                                                                                                         $1.50
                                   $200
                                                                                                                                                         $1.00

                                   $100
                                                                                                                                                         $0.50

                                       $0                                                                                                                $0.00
                                               2012       2013       2014             2015     2016          2017       2018             2019   2020

                                   •        Tourmaline focuses on generating earnings and full cycle profitability/returns.
                                   •        Tourmaline has grown cash flow per share by a 15% CAGR since the November 2010 IPO.
                                   •        The EP strategy focusses on selecting premium subsurface targets and continually reducing
                                            capital and cash costs as the development plans are executed.
                                   •        The focus on economic sweet spots will yield superior returns.
                                   •        Tourmaline has a free cash flow breakeven on a maintenance budget at US$1.50/Mcf.
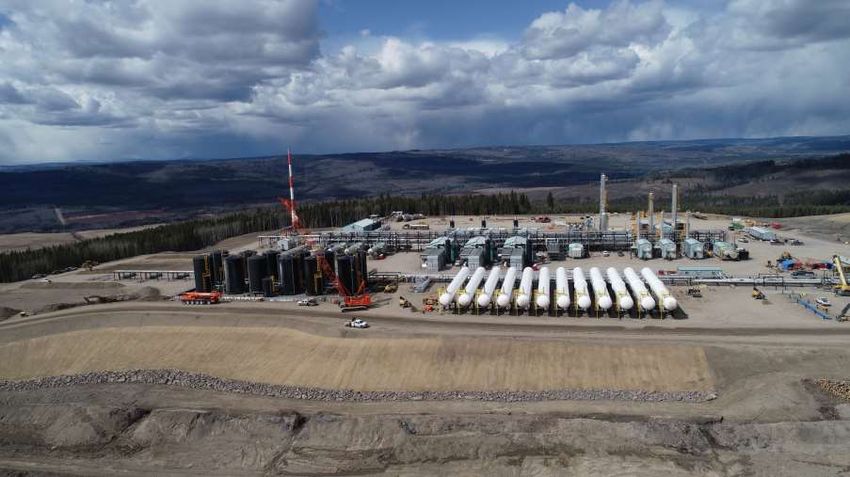
Corporate Presentation September 2021 - Tourmaline Oil
5
                                                                        Largest North American Natural Gas
                                                                        Producers                                                                      Sept 2021

 Tourmaline is the largest natural gas producer in Canada, and the fifth largest gas focused producer in North America
  MMcf/d                                                        2022E Natural Gas Production – Canada & US
   6,000

   5,000
                   Scale is a key component in driving down
                    costs, leveraging transport & marketing
                  opportunities, and remaining relevant in the
   4,000
                          current market environment

   3,000

                 1

   2,000

   1,000

        0
                TOU        CNQ         ARX       OVV CA        CVE         PEY         BIR                    EQT        SWN   COG   CHK   AR   RRC   CNX   CRK

TOU as per guidance, Peer data as per Bloomberg consensus Sept, 2021. OVV Canada 2021 assumes Q2/21 CA/US proportions.
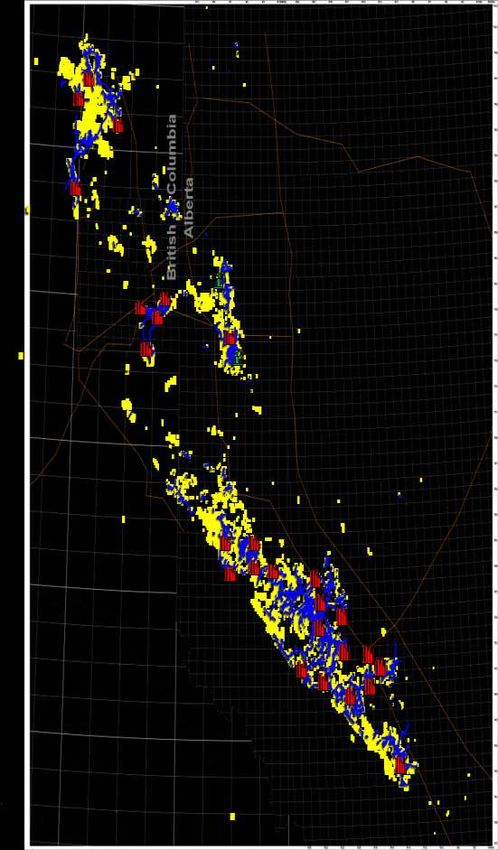
Corporate Presentation September 2021 - Tourmaline Oil
6

                                                                                   Tourmaline: A Significant Canadian Liquids Producer
                                                                                                                                                                                      Sept 2021

   Tourmaline is a significant liquids producer in Canada, with continued peer leading growth
   •        Tourmaline is the 5th largest producer of conventional liquids, the largest producer of NGLs, and
            the second largest condensate producer
   •        Tourmaline has transitioned its previously rapid growing liquids profile towards methodical liquids
            growth at a 3-5% CAGR in the 5 year plan (organically)
               •       Gundy Phase 2, will provide significant liquids growth, another ~15 Mbpd of predominantly condensate and
                       pentanes rich liquids production
               •       Inorganic growth through acquisition continues to accretively add liquids in 2020 and 2021. This is consistent with
                       TOU’s approach of owning more of the supply through A&D, vs rapid drilling to grow supply
                                  Conventional Liquids (Mbpd)                                                                          Tourmaline Liquids Growth (Mbpd)
              219                  Canadian Peer Producers                                                                  2022 Mix
                                                                                                                     C2
                                                           5th Largest Total Conv. Liquids Producer               140                                                         4% CAGR          131
   200                                                                                                                    21%                   Condensate                              126
                                                           2nd Largest Condensate Producer                                             29%                                    120
                                                           Largest NGL Producer                                   120                                                 115

                         144                                                                                                                                   98
   150                               136                                                                          100 23%               8%
                                                                                                                   C3                      Oil
                                                117                                                                                    4%
                                                                                                                   80            15%
                                                            98                                                                             C5           64
   100                                                                 84                                                        C4              55
                                                                                  80                               60
                                                                                                70                                    48
                                                                                                      63                   39
                                                                                                            47     40
       50
                                                                                                                   20

        0                                                                                                           0
              CNQ        CVE*       ARX*       CPG*       TOU*         SU       WCP*           ERF*   BTE   VET           2017     2018         2019   2020   2021E   2022E   2023E    2024E   2025E

                                       Conventional Oil & Condensate                 NGLs                                                                             Gundy Ph 2
Peer data sourced to most recent public filings or 2021 guidance where available                                                                                      +15 mbpd
*ARX, CVE, WCP, ERF, CPG are proforma recent acquisitions. CVE inclusive of heavy oil / EOR.
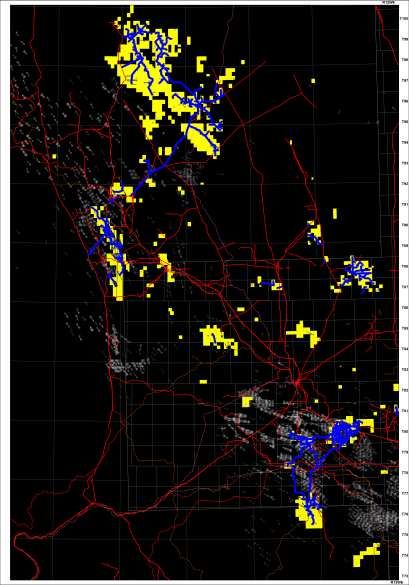
Corporate Presentation September 2021 - Tourmaline Oil
7

                                                                                            Current 5 Year Plan(1)
                                                                                                                                                                                                                       Sept 2021
        600,000

        500,000

        400,000
                                                                                                                                                                                                                         Spirit River
Boe/d

        300,000
                                                                                                                                                                                                                         NEBC
        200,000                                                                                                                                                                                                          Deep Basin

        100,000

                -
                    2016               2017                 2018                2019                2020                2021                2022                2023                2024                2025
                                             After-tax                                                                                                                                     Declared                    Ending
                                                 Cash             After-tax            E&P Capital                Free Cash                   Topaz              Tourmaline                 Special                   Surplus
                            Prod’n               Flow               CFPS -              Program(4)                   Flow(5)             Dividend(6)               Dividend                Dividend              (Net Debt)(3)
                            BOEPD            $MM(2)(3)              Diluted                  $MM                       $MM                    $MM                      $MM                     $MM                      $MM
        2021E            442,500                 $3,000                 $9.49                   $1,375                 $1,587                     ($11)                  ($210)                ($244)                     ($958)
        2022E            500,000                 $3,705               $11.24                    $1,125                 $2,525                             -              ($235)                          -                $1,333
        2023E            515,000                 $3,125                 $9.48                   $1,255                 $1,805                             -              ($235)                          -                $2,903
        2024E            540,000                 $2,520                 $7.64                   $1,395                 $1,055                             -              ($235)                          -                $3,723
        2025E            560,000                 $2,540                 $7.70                   $1,385                 $1,080                             -              ($235)                          -                $4,569
    (1)   5 year plan derived by utilizing, among other assumptions, historical Tourmaline production performance and current cost assumptions inflated at 2.5% annually after 2022. 2023 and beyond provided for illustration only. Budgets and
          forecast beyond 2022 have not been finalized and are subject to a variety of factors including prior year’s results. 5 year plan includes Topaz Energy Corp. (“Topaz”) ceasing to be a fully consolidated subsidiary of Tourmaline Oil
          Corp. during June 2021.
    (2)   Price assumptions: Gas price - $3.77 2021 NYMEX US, $4.27 2022 NYMEX US, $3.33 2023 NYMEX US, $2.96 2024 NYMEX US, $2.92 2025 NYMEX US, $3.77 2021 AECO, $4.08 2022 AECO, $3.23 2023 AECO, $2.89 2024
          AECO, $2.99 2025 AECO. Oil price - $66.22/bbl 2021 WTI US, $67.66/bbl 2022 WTI US, $62.35/bbl 2023 WTI US, $58.39/bbl 2024 WTI US, $55.53/bbl 2025 WTI US.
    (3)   See “Non-GAAP Measures” in Forward Looking Statement Advisories.
    (4)   E&P Capital Program is defined as total capital spending before acquisitions, dispositions and other corporate expenditures.
    (5)   Free Cash Flow is defined as Cash Flow less Total Net Capital Expenditures. Total Net Capital Expenditures is defined as the sum of E&P Capital Program and other corporate expenditures, net of non-core dispositions . Free Cash
          Flow is prior to dividend payments made by Tourmaline and Topaz.
    (6)   Topaz Dividend includes dividends paid out by Topaz, excluding dividends paid to Tourmaline Oil Corp.
Corporate Presentation September 2021 - Tourmaline Oil
8
                                                                                     Tourmaline Free Cash Flow Allocation &
                                                                                     Dividend Growth Track Record         Sept 2021

     The majority of Tourmaline’s free cash flow will be returned to shareholders; special dividends will be
     the preferred method of shareholder returns during periods of high commodity prices
     •      Base dividend will continue to grow alongside the base EP business and will remain sustainable even in sub
            US$2/mcf gas prices
     •      Special dividend offers an instrument for cash return to shareholders during periods of strong commodity prices
     •      Tactical share buybacks remain an opportunistic tool of shareholder return
     •      Alongside dividends, free cash flow will be allocated towards: (1) maintaining the pristine balance sheet, net
            debt $1.0 - $1.2bn (2) high return infrastructure and liquids investment opportunities (3) accretive bolt on M&A
 $/Share                Dividends Per Share – Base & Special                                                            $/Share                   Free Cash Flow per Share
  $0.80                                                                                                                 $8.00                                             $7.75
                                                                                                            $0.75

  $0.70                                                                                                                 $7.00

  $0.60                                                                                                                 $6.00                                                       $5.54
                                                                                                                                                                 $5.06
  $0.50                                                                                                                 $5.00       The majority of future
                                                                                                                                    free cash flow will be
  $0.40                                                                                                                 $4.00     returned to shareholders
                                                                                                                                                                                              $3.24   $3.32
  $0.30                                                                                                                 $3.00

  $0.20                                                                                            $0.17        $0.18   $2.00
                                                                                     $0.16
                                            $0.12                               $0.14
                          $0.10                                                                                                                         $1.01
  $0.10 $0.08                                                                                                           $1.00                $0.51               $0.75
                                                                                                                                  $0.42
                                                                                                                                              $0.46     $0.50    $0.67
                                                                                                                                   $0.37
  $0.00                                                                                                                 $0.00
               1Q 2Q 3Q 4Q 1Q 2Q 3Q 4Q 1Q 2Q 3Q 4Q 1Q 2Q 3Q SP. Q4                                                                2018        2019      2020    2021E     2022E     2023E    2024E    2025E
                  2018            2019           2020          2021
                         Base Raised   Base Maintained Special                                                                             Annual DPS      Announced Special      Excess FCF/Share
For capital and commodity price assumptions and definition of free cash flow please see 5 year plan slide
Corporate Presentation September 2021 - Tourmaline Oil
9

                                                                            Alberta Deep Basin
                                                                                                                                                                          Sept 2021
                                                                     The contiguous Tourmaline interconnected Deep Basin
                                                                     Cretaceous gas asset is effectively Alberta’s Largest Gas Field.
                                   R13          R11    R9     R7       R5     R3       R1W6     R25     R23       R21   R19       R17    R15    R13    R11
 TCPL
                                                                                                                                                                 T71
Main Line
                             1                                                                                •   Current Production           250,000 boepd
                                                                                                              •   Current Reserves             1,475 mmboe (Dec
                                                                                                                                                              T69  31, 2020)
                                                                                   TCPL Main Line             •   Tourmaline Land Base         2.3 million acres (gross)
                                              Elmworth
                             16
                                                                                                              •   Drilling Inventory           13,504 hz locations
                                                                                                                                                              T67
  Chinook
   Ridge                                                           Wapiti
                                                                                                                                                                 T65
                             9
                                                                      Musreau
                                                                      /Kakwa                                                                                     T63
                                  Netook
                         8
                                              Lynx                                                                             The Company has drilled 888  T61 wells to date with a
             Cardium                                                                  Leland            Fir                    future drilling inventory of 13,504 hz locations.
            Dunvegan                              Cutpick                                                                                                        T59
                         1
                                                                                                                        Cecilia
             Viking
                                                                                                                                                                 T57
    Mannville/Notikewin
                         16                                                                                                    Oldman
                                                                     Harley               Wild
                                                                                                                                                                 T55
                                                                                          River                                         TCPL
             Falher
                                                                                                                                    Edson
                                                                                                                                                                 T53
                                         12
                         9
                                                                              Marsh
             Wilrich                                                                                                                                             T51

            Bluesky                                                                                                                            Edson
                                                                                                      Hinton                                                     T49
            Gething                                                                                                                 Ansell
             Gething
                                                  Tourmaline Lands                                            Minehead                                           T47
                                                 Tourmaline Gas Plant                                                                                        TCPL Main    NE Alberta
                                                                                                                                                               Line
                                                                                                                                                                 T45
            Cadomin                               Tourmaline pipelines                                                        Lovett                                      BC

                                                                                                                                                                 T43
            Nikinassin
                                                                                                                                    Brazeau
                                                                                                                                                                 T41
                                                                                        R1W6    R27     R25       R23    R21      R19    R17    R15    R13
Corporate Presentation September 2021 - Tourmaline Oil
10

                                                          NEBC Montney Gas/Condensate Complex
                                                                                                                                                                                          Sept 2021
                                                                                        D-48-C Sour
  Current Prod.           200,000 – 210,000 boepd                                       Gas Plant.
                                                                                        30 MMcfpd
                                                                b-24-H
                                                                Comp/Dehy
  Current Reserves        1,578 mmboe (Jan 1, 2021)             140 MMcfpd.

                          (2021 Acq. not included)
                                                                          Northriver                                                      D-72-F Comp Sta.
  Montney Drilling        In excess of 6,974 horizontal                   North Jedney                                                    50 MMcfpd

  Inventory               locations.
                                                                   12” Sour Gas P/L
                                                                   190MMcfpd Sales
                                                                                                                                                 Tourmaline is one of the largest Montney
                                                                                                                                                 producers in Western Canada with
                                                                                                      Altagas
                                                           C-60-A Gas Plant                           Aitken                                     current N.E. B.C. production of
                                                           200 MMcfpd                                 Creek Hub
Phase 2 Jan 2022
200 MMCF/D                                                 15,000 bpd                                                                            200,000 boepd, a 2021 development
15,000 bpd
                                                             Phase 2 Q1 2022
                                                             200 MMcfpd                                                                          program of 125 wells and a 2021 exit
                                                             15,000 bpd
                                                                                                                                                 production target of 210,000 boepd
                                                                     A-21-I Comp Sta.
                                                                     180 MMcfpd

                                                                                                                                                             13-25 Gas Plant
        C-60-A Gundy Gas Plant                                                                                                                               110 MMcfpd
                                                                                                                                         Westcoast
                                                                                                                                         McMahon
                                                                                                                                         Gas Plant
                                                                                                                                                              Doe              1-32 Comp. Station
                                                                                                                  3-18 Gas Plant                                               TOU 12 MMcfpd
                                                                                                                  80 MMcfpd
                                                                                                                                      Sunrise
                                                                                                                     2-11 Gas Plant                          Dawson
                                                                                                                     60 MMcfpd                                  TCPL
                                                                                                                                                                Mainline
                                                                   TOU Land                                                   Groundbirch
                                                                   TOU Acquisitions                                                Coastal
                                                                   TOU Pipelines                                                   Gaslink P/L

                                                                   TOU Gas Plants                                                  Sundown
                                                                   3rd Party Processing Plants
                                                                                                                               B-67-H Gas Plant
                                                                   Major Pipelines                                             132 MMcfpd
   13-25 West Doe Plant
11
                                                                           NEBC Montney Consolidation
                                                                           Black Swan Energy & Paramount Birch
                                                                                                                                                                                               July 2021
                                                                                                                                                                                    Legend
Black Swan Energy                                                                                                                                                                         Black Swan Lands
▪ Current production ~50,000 boepd                                                                                                                     TOU Conroy D-48-C
                                                                                                                                                                                          Paramount Lands
                                                                                                                                                       Sour Gas Plant.
                                                                                                     Tou/Saguaro b-24-H
▪ Exit 2021 50,000-54,000 boepd, Q2 2022 60,000 boepd                                                140 MMcf/d Comp.
                                                                                                                                                       30 MMCF/D                          TOU Land

▪ ~ 231,000 Net acres of Montney Rights                                                             Tou/Saguaro                                                                           TOU Pipelines
                                                                                                    Water Facility
▪ 492 MMboe (23% liquids) 2020 YE 2P Reserves                                                                                                                                             TOU Facilities
                                                                                                                                                                                          Black Swan Facilities
▪ 50% WI in 2 Gas Plants with current capacity of 270
                                                                                                                                                                 TOU Martin Ck            Competitor Facilities
  MMcf/d Expandable to 360 MMcf/d                                                                                                                                20 MMcf/d
                                                                                                                                                                                          Major Pipelines
                                                                                                                                         B-34-L                  Sour Gas Plant
▪ 2 Water Storage Ponds with a capacity of 108,000 m3                                                                                                                                     TOU Conroy/Birley
                                                                                                                                                                                          Locations
                                                                                                                                                                                          Water Infrastructure
Paramount Birch                                                                         Black Swan Energy
                                                                                        Acquisition
▪ 2,400 boepd, 40 mmboe 2P Reserves                                                                                                                                               TOU Comp. Sta.
▪ 100+ Tier 1 plus locations (8-10 Bcf, 400-500 Mbbl/well)                                                                                                          D-26-K
                                                                                                                                                                                  50 MMcf/d

▪ 20,800 acres of Montney Rights
                                                                                      49km 6” condensate P/L to
                                                                                      AltaGas Truck Terminal.                                H
                                                                                                                                                                                      TOU 12” Sour Pipeline
                                                                                                                             H
                                                                                                                          H HH
                                                                                                                          H      H
                                                                                                                                              H      HH
                                                                                                                                                             H
                                                                                                                                                             H
                                                                                                                                                                                      190 MMcf/d Sales
    Black Swan North Aitken Facilities
                                                                                                                                              H H       H
                                                                                                                                            HH   H
                                                                                                                                                        H
                                                                                                                                                     HHHH
                                                                                                                                                        HH
                                                                                                                                      H HHH
                                                                                       Black Swan 25 MMcf/d                          HHH H   HH HH

    N. Aitken Gas Plant                          Nig Creek Gas Plant
                                                                                                                                                 H
                                                                                                                                                 H                                 Black Swan Aitken Gas Plant
                                                                                       Compressor Stations                       H               HHH
         110 mmcf/d shallow cut                  160 mmcf/d shallow cut                                                                                                            110 MMcf/d
         Expandable to 180 mmcf/d                Expanding to 180 mmcf/d                                                                                                           Black Swan Nig Gas Plant
         (Q2/22)                                 deep cut                                                                                                                          160 MMcf/d
    Strategic Partnership with Altagas
         Aitken core area dedication
         50/50 Ownership in entire processing complex
                                                                                 Enbridge                                                                             Paramount Birch Acquisition
         Buyback provision, NGLs permanently dedicated                           T-North Pipeline
    Processing complex P/L connected to Altagas for NGL transport/export                                                                           Aitken Ck Hub
    Sales gas lines                                                                                                                                Access to Alliance, North Montney, Fortis
         10” to Enbridge Aitken Creek Lateral                                   C-60-A Gas Plant                                                   BC Gas Storage, and Enbridge System
         16” to TCPL NMML                                                       200 MMCF/D                                                         2021 TOU 3D Seismic
    6” Condensate line to Aitken block currently unutilized                     15,000 bpd

                                                                                    Phase 2 Q1 2022
                                                                                    200 MMCF/D                                                   A-21-I Comp Sta.
                                                                                    15,000 bpd                                                   180 MMCF/D                             Alliance
                                                                                                                                                                                        pipeline
12

                                                                                Significant Montney Growth Potential
                                                                                                                                                                                      June 2021

 Tourmaline has access to significant potential Montney growth through fully delineated assets that are economic on
 current strip.

 Mboe/d
                      Tourmaline Montney                                                                            BC and Alberta Montney Peers
  500

  450                                                             >400
              Sundown Full Development                   •
  400                       Aitken Creek                 •
      Conroy with Infrastructure buildout                •

  350                                                                                 340

                                                  300
  300
                                                              •Gundy Ph2
                                                              •Conroy Ph1
  250                                                         •N. Aitken
                                 220                                                             222
                                                               Expansion
                200
  200                                        •    ‘21 EP Program
                                             •    Sundown Ph1

  150                                                                                                        140
                                                                                                                        118
                                                                                                             40
  100          Base                                                                                                                  90            90   84
                                                                                                                                                               83       80
             (Inclusive                                                                                                              12            17
              of A&D)                                                                                                                                   35              30   49     40
    50                                                                                                       100                     78
                                                                                                                                                        49                    5            30
                                                                                                                                                   74                   50          14
                                                                                                                                                                             44            10
                                                                                                                                                                                    26     20
      0
              Q3 Exit        2021 Exit           2022+        Future Dev             Peer        Peer       Peer        Peer       Peer        Peer     Peer   Peer   Peer   Peer   Peer   Peer

     Tourmaline growth projections include development of                                                            Current         Announced Expansions (2021-2026)
   existing assets, all are fully delineated and are economic /
   full cycle profitable on current strip pricing. This analysis
   excludes Red Creek / Attachie, Noel, Tupper, Jedney, new
     pool delineation, and potential additional acquisitions.
Peer data as per most recent disclosure; Accumap, GS research. Expansions include publicly announced growth, and/or 2021 budgeted volume growth.
Peers include AAV, ARX (proforma VII), BIR, CNQ, Mitsubishi (Diamond Gas), MUR, NVA, OVV, PIPE, Petronas JV, SRX, Shell Canada
13
                                                           Peace River High Complex Triassic Oil
                                                           Charlie Lake, Montney and Wapiti Cardium Plays
                                                                                                                                                                            Mar 2021

Peace River High                                                                  Legend                       R. 11                    R. 9                R. 7                        R. 5
                                                                            Tourmaline Lands
• 2,062 Horizontal Locations* along Regional Play
                                                                        Tou UpperCharlie Lake HZ Drills
  Fairways                                                                                                                                                             15-13 Mulligan
                                                                        Tou Lower Charlie Lake HZ Drills                                                               Oil Battery
• Current Reserves of 262 mmboe (Dec 31, 2020)                         Tourmaline Montney HZ
                                                                                                                                                                                          T. 83
• Regional pools defined by 318 hztl and 143 existing                   Tourmaline HZ Well Loc.
  vertical wells                                                        Tourmaline HZ Wells

• 225 - 600 mboe 2P reserves per horizontal Charlie                         Tourmaline Battery Site

  Lk/Montney/Cardium                                                        Tourmaline Gas Plant

• $2.0 - $2.2M Charlie Lk/Cardium horizontal                                Lower Charlie Lake Fairway                                                                       12-6 Mulligan
                                                                                                                                                                             Oil Battery
   Drill/Complete Cost                                                      Upper Charlie Lake Fairway
                                                                                                                                                                                         T. 81
                                                                            Montney Fairway
• Upper Charlie Lake wells are profitable on a full cycle
  basis at $25/bbl (U.S. WTI)
• 13 Upper/Lower Charlie Lake delineation wells in 2021                                                                                                                        6-3 Spirit River
                                                                                                                                                                               Oil Battery

 Wapiti Cardium Complex                                                               Spirit River 6-10-78-8W6M Pad Average’s                                                             T. 79

            R. 9       R. 8     R. 7             R. 6   R. 5. W6M
                                                                                      IP30 production rates (normalized)
                                                                                                         IP30 OIL IP30 GAS   IP30BOED
                                15-32 Pad                           T. 68             (4) Lower CLLK       740      2,395     1,121
                                (3 Crdm wells)                                        (3) Montney          650      5,595     1,542

                                                                    T. 67

                                                                                                                                                                                          T. 77
                                                                                      Spirit River 5-3-76-8W6M Pad Average’s
                                                                                      IP90 production rates (normalized)
                                                                                                         IP90 OIL IP90 GAS   IP90BOED
                                                                    T. 66
                                                                                      (2) Lower CLLK       245      377       310                                              3-10 Spirit River
                                                                                      (1) Upper CLLK       704      1,450     935                                              Gas Plant

                                                                    T. 65                                                                                                                 T. 75

                                                                                                                        IP 30 OIL units bbl/d, IP30 GAS units mscf/d        * See Schedule A
14

                                                                        Tourmaline Mid Stream Assets
                                                                                                                                                 July 2021
                                                            The infrastructure skeleton in all three core operated complexes is now complete.
                                                             This infrastructure is essentially all new and in the ‘growth’ areas of the WCSB.
                           Conroy

                                                                                        • 25 Working interest gas plants, 13 of which are 100% owned
          Montney                                Birley                                   and operated, 4 Topaz interest plants
          Gas/Cond
                                                                                        • 24 compressor stations
                          Gundy
                                                                   Peace River High                      • Current Tourmaline operated gas processing
                                                                    Charlie Lk Oil                         capacity of 2.4 bcf/day. (2.0 bcf/day net)
                                                                      Mulligan/Earring
             Alberta                Sunrise-
                                    Dawson
    British                                                             Spirit River
                                                                                                               Two oil processing batteries with combined
   Columbia                         Sundown                                                                    processing capacity of 50,000 bpd.
                                                          Tupper

   Legend
                                                                                                                         Oil, condensate and ngl storage
       Tourmaline Lands
                                                                                                                         capability of 325,000 bbls.
                                        Chinook                      Musreau/
       Tourmaline Gas Plant Site                                      Kakwa
                                         Ridge
                                                                                                                              16 MW gas fired electrical
       Tourmaline Oil Battery                         Route                                   Alberta Deep                    generating capacity.
                                                                           Leland
       Tourmaline Main Laterals                          Lynx                           Fir      Basin
       Main Sales Pipelines                            Cutpick
                                                                                          Cecilia                                6,900 km of Tourmaline
                                                               Harley
                                                                                          Edson
                                                                                                    Wolf                         Operated Pipelines
                                             H

                                                                     Marsh                          Creek
This revenue is in addition to the
estimated $350MM(+) per year of                                          Hinton                 Ansell
                                                                                                                              Water Infrastructure
cash flow that is effectively preserved                                      Minehead
by owning the operated infrastructure                                                                                         • 10 Major Frac Water
                                                                                       Lovett
and not processing gas through third                                                                                            source/ Recycling Facilities,
party/midstream plants.                                                                          Brazeau
                   B

                                         A                                                                                      550,000 m3 capacity
15

                                                                                           Historical Reserves Summary
                                                                                                                                                                                                   Sept 2021

                                                      Reserves (GLJ)                                                                                       Reserves
                                 2016            2017           2018          2019     2020                                    2013        2014       2015       2016        2017       2018        2019       2020
            3,500
                                                                                                                               (mmboe)    (mmboe)    (mmboe)     (mmboe)    (mmboe)    (mmboe)     (mmboe)    (mmboe)

            3,000                                                                                             PDP              122.3 177.8 263.2 352.1 436.5 473.5 527.4 736.4

            2,500                                                                                             TP               316.5 472.3 644.1 859.2 1,056 1,207 1,294 1,691
    MMBOE

            2,000                                                                                             2P               590.1 855.8 1,108 1,747 2,217 2,458 2,602 3,314

                                                                                                              Finding & Development Costs ($/boe)
            1,500
                                                                                                              2P FDA(i)
                                                                                                                        $11.84 $10.40 $5.89 $5.94 $3.76 $5.15 $4.26 $3.80
            1,000                                                                                            _With FDC
                                                                                                             (i) See March 2021 press release for full FD&A disclosures
             500                                                                                             (ii) Reserves figures include the Company’s working interest share of reserves prior to the deduction of
                                                                                                                  interest owned by others (burdens) and include royalty interest reserves owned by the Company.
                0
                                    PDP                                  TP                     2P
                                                                                                               • Total Proved Reserve life index a reasonable 12
                        2020 BT NPV 10% Reserve vs Market Valuation
                                                                                                                 years.
       $mm                                                                      Owners of TOU continue to
                                                            $17,223             receive future development     • 2P FDC realistic, at approximately 5 years of
                                                                                    value at a discount
                                                                                                                 future projected cash flow. Historically
                                                                                 $13,900          $14,000
                                                $6,812                                                           Tourmaline has systematically converted the 2P
                                  $10,411                                                                        reserves to PDP reserves in the 4 - 5 year time
                     $3,931                                                                                      frame.
        $6,480
                                                                                                               • Positive technical revisions each of the last
                                                                                                                 eight years.
                                                                                                               • Considerable reserve value/NAV increase
            PDP /      PUD           1P       Probable         2P                Market 2021E         EV
            PDNP                                                                  Cap (1) Net Debt
                                                                                                  (1)            opportunity with improving gas prices.
(1) As of Sept 15th 2021, Net debt presented net of Topaz equity value
16
                                                         Development Location
                                                         Inventory and Economics                                                   Sept 2021

                                        AB Deep                      NEBC North      NEBC Gundy      NEBC South        PRH           PRH
                                         Basin       AB Resthaven       MNTN            MNTN            MNTN        Charlie Lake    Montney
                                       Horizontal     Horizontal      Horizontal      Horizontal      Horizontal     Horizontal    Horizontal
Total Well Costs
(Drill, Case, Complete, $ Million)        3.50            4.85           3.20            2.85            2.30           2.20         3.50

Average Reserves/Well (bcfe)               5.4            10.1            7.5             7.6            5.0             2.1          5.1

Year 1 Production Rate                4.0 mmcfepd     7.2 mmcfepd    4.5 mmcfepd     4.4 mmcfepd     3.2 mmcfepd      214 boepd    399 boepd

Development Cost/boe                     $3.90           $2.88           $2.56          $2.25           $2.76           $6.30        $4.13

Operating Expenses/boe (1)               $2.29           $3.41           $5.77          $2.14           $1.96           $8.12        $7.48

Net Present Value @ 10% (000's)         $3,927          $7,145          $6,227          $9,468         $4,745          $2,030       $3,398

Internal Rate of Return (2)               80%            118%            176%           345%            231%            59%          50%

Payback Period (months)                    14              11              8               6              8              18           22

Year 1 Gas Price (3)                     $2.63           $2.48           $2.95          $2.65           $2.63           $2.76        $2.79

Future Development Locations (4)        13,222            282            3,313          2,011           1,650           1,179         631

  Notes:
  (1) Average operating expenses over the initial five years of production.
  (2) Internal Rate of Return calculation is based on monthly cash flows.
  (3) Independent Reserve Engineer Jan 1, 2021 escalated price forecast, adjusted for transportation, quality and heat content.
  (4) See Schedule A.
17

                                                                 The TOU Engineering Execution Machine
                                                                                                                                                Mar 2021
    $mm                                                                                                                  Drill & Complete Costs
     $8                                  Tourmaline has the lowest completed per stage                                   (Equipping not included)
                                         well costs in the overall Montney play in
          6.8
     $7                                  Western Canada and the Alberta Deep Basin.                                        South Deep Basin
                            6.0
     $6         5.7                            5.5                                                                         NEBC (South Complex)
                                  5.3
     $5               4.5                                                                                                  PRH (Charlie Lake SR)
                                        4.1          4.2
     $4                                                    3.5     3.4               3.6               3.4                                3.4
                                                                                                             3.2          3.2
                                                                         2.8               2.7                                  2.7 2.6
     $3                                                                        2.5               2.4               2.6
                                                                                                                                                2.4 2.3
     $2
     $1
     $0
            2013              2014               2015                2016              2017              2018               2019            2020

•     Since Feb 2009, Tourmaline has drilled 1,765 wells across all three core operated complexes.
      (Deep Basin 888 wells, NEBC 560 wells, PRH oil 355 wells)
•     Through continuous engineering design improvements in all aspects of drilling and completions
      operations, Tourmaline has realized a cost reduction of over 50% in all 3 complexes since 2012.
•     Tourmaline has the internal staff capability to efficiently operate 22(+) drilling rigs, the current 5
      year financial outlook assumes a 11/15 rig program.
Realizing the Upside, Accelerating FCF                                                           18

                                                         From Q4 2019 – Q2 2021 Acquisitions
                                                                                                                                              Sept 2021
                                                                                        1.     Utilize the TOU Execution Machine – Lower capital costs,
                 Conroy                                                                        improved well performance, superior long term
                                                                                               integrated development planning models.
     Montney                                                                            2.     Optimize the Existing Base – Enormous inventory of low
                                       Birley                                                  cost, short term production addition opportunities.
     Gas/Cond
                                                                                        3.     Reduce All Aspects of Cash Costs – Full realization of
                                                                                               identified synergies.
                 Gundy
                                                         Peace River High 4.                   Grow the Liquids Business/Optimize Liquids Margins
                                                          Charlie Lk Oil
       Alberta                                              Mulligan/Earring
                          Sunrise-                                                                   Black Swan/Saguaro/Polar Star Assets
                          Dawson                                                                     • 20% reduction in TOU NEBC drill times further
 British
Columbia                                                      Spirit River                              increases the identified Capex reduction on all
                          Sundown
                                                                                                        acquired NEBC assets.
Jupiter/Modern Assets                           Tupper                                               • Laprise drilling costs down to $1.25-1.30M/well.
• >40% D,C,E per well
  capital cost reduction
  realized.                    Chinook                      Musreau/                                          Accelerations of Gundy and Nig Creek Deep
• $0.50/boe opex reduction      Ridge                        Kakwa                                            Cuts/Liquids Growth
  to date, target additional                Route                                   Alberta Deep              • Additional 15,000 bpd by Q1 2022.
                                                                 Leland
  $0.25-0.50/boe reduction                     Lynx                           Fir      Basin                  • Tie-ins to TOU Aitken liquids hub.
  in 2022.                                   Cutpick
                                                                                Cecilia
                                                     Harley
                                                                                Edson
   Optimizing the Deep Basin Base                                                            Wolf     Optimizing the NEBC Base/Margin Improvements
                                   H

                                                           Marsh                             Creek
   • Liquids pipeline connections and                                                                 • North Montney downtime reduced by 45%
     handling capabilities, detailed per well                  Hinton                 Ansell            overall (2021 vs 2019).
     production optimization.                                      Minehead
                                                                                                      • Gas and liquids processing fees reduced by 25%
   • 4,000 boepd production uplift realized in                               Lovett                     on specific acquired assets.
     Q3 2021, incremental 3,000 boepd
                                                                                       Brazeau
     target in 2022.
           B

                               A
19

                                                                           Consolidation Financial Lookback
                                                                                                                                                                                              Sept 2021

   TOU’s acquisitions through 2019 – 2021 were strategic, expansive and very accretive
   •     TOU has acquired ~$2.3bn in assets since 2019, which now generate ~1/3 of TOU’s total free cash flow and
         total cash flow. These acquired assets sum to 1.2 million net acres, 1.4 billion boe net 2P reserves1, and 4,500
         gross drilling locations.
   •     The suite of acquired assets is generating a FCF yield well in excess of the base EP program, a key screening
         criteria
   •     Tourmaline’s consolidation of the Alberta Deep Basin and BC Montney is now essentially complete
   •     With no future large transactions planned, only small asset deals or land purchases are envisioned through the
         remainder of 2021 and into 2022
              Consideration &                                 Acquired Cash Flow                             ‘22 Consideration / Cash                                     ‘22 Free Cash Flow /
                 Funding                                      and Free Cash Flow                                  Flow Multiple                                            Consideration Yield
        ~$2.3bn aggregate consideration
                                                                                                  2.8x                                                   35%
                   since 2019                                                                                        2.7x
         Inf / Land                                          ~$900mm
                                                                                                  2.6x
         / Conroy /            TPZ                                                                                                                                                               30%
          Modern /                                                                                2.4x                                                   30%
          Saguaro
                                                                                                  2.2x                                        2.1x
                                                                                      >$500mm                                                            25%                25%
            Jupiter                                                                               2.0x
                                      TOU
                                     Cash                                                         1.8x
                                       &                                                                                                                 20%
            Black                    Stock                                                        1.6x
            Swan
                                                                                                  1.4x                                                   15%
                                                                                                  1.2x

                                                                                                  1.0x                                                   10%
        Consideration               Funding                    2022 CF                2022 FCF                    Pre TPZ                   Post TPZ                     Pre TPZ               Post TPZ
All cash flow and free cash flow figures as per July15th strip. Consideration inclusive of Q4 2019 Gundy land acquisition; consideration excludes all TPZ historical consolidated activity.
1 All but approximately 140 mmboe of the acquired net 2P reserves have been evaluated by GLJ Petroleum Consultants or Deloitte LLP, independent reserve
evaluators, as at the respective transaction dates. The remaining 140 mmboe has been internally estimated by qualified reserve engineers.
20

                                                                              Continuous Capital Efficiency Improvements
                                                                                                                                                            Sept 2021

          $22,500                                                                                      • 2022 is expected to yield the best capital efficiency
                                 $20,900                                                                 metrics in company history.
          $20,000                                                                                      • 2018 & 2021 are affected by the Gundy Deep Cut gas plant
                                                                                                         expenditures.
          $17,500
                                                     $15,500
          $15,000

          $12,500
$/boepd

                                                                                                        $11,200

          $10,000                                                         $9,500              $9,500
                                                                                                                     $8,650
                                                                                                                                              $7,800
                                                                                                                                 $7,300
            $7,500
                                                                                                                                                             $6,000

            $5,000

            $2,500

                  $-                                                                                                                              (1) (2)             (1)
                                  2014                2015                2016                2017       2018        2019        2020        2021E          2022E

          (1)   Based on 5 Year Plan Guidance released on September 22, 2021
          (2)   Includes $145 million related to major Gundy Phase 2 Deep Cut gas plant expenditures
21

                                                                              Continuous Cost Reduction Strategy
                                                                                                                                                                               Sept 2021

                                    Operating Costs                                                                 General and Administrative Costs

    ($/boe)                                                                                       ($/boe)
    $7.00                                                                                         $1.50
    $6.50     $6.34
                                                                                                            $1.29
    $6.00
                      $5.58                                                                                         $1.02
    $5.50                                                                                         $1.00
                                            $4.87                                                                           $0.79
    $5.00                                                                                                                           $0.74
                              $4.43 $4.35           $4.37
    $4.50                                                                                                                                   $0.60
                                                                                                                                                                                    $0.56
                                                                                                                                                                      $0.49 $0.49
    $4.00                                                                                         $0.50                                             $0.45 $0.44 $0.46

    $3.50                                                   $3.31           $3.33 $3.28
                                                                    $3.19                 $3.14
    $3.00
    $2.50                                                                                         $0.00
              2010 2011 2012 2013 2014 2015 2016 2017 2018 2019 2020                                        2010 2011 2012 2013 2014 2015 2016 2017 2018 2019 2020

•     Tourmaline has the lowest effective interest rate/borrowing costs in the North American energy sector.
       • $450mm of long term public debt issued at ~2.30% maturing in 2028 & 2029
       • 2021 aggregate effective interest rate expected to be ~3%

•     The staff required to effectively operate a 500,000 boepd and growing company already been assembled.
22
                                                                   2021 Natural Gas Transportation
                                                                   and Marketing Overview                                                                         July 2021

                            2021 Exit: 624 mmcf/d of gas will be to US/Other Markets
                            2022 Exit: 860 mmcf/d of gas will be to US/Other Markets
                            2023 Exit: 905 mmcf/d of gas will be to US/Other Markets                                 2021 Average Natural Gas Portfolio
                                                                                                                             Diversification (3)

                                                                                                                                             38%
                     Station 2

                           9%                                                                                                                                      9%

                                                                                                                                       (1)
                                                         AECO                                                                     28%                     25%

                                                       25%
                                                                       TCPL Mainline           Dawn/Iroquois
                                                                                               ~134 Mmcf/d

                                                                                                                                                                         (2)
                                                                                                                US/Other Markets                Hedges           Stn 2          Aeco
                                                 Kingsgate
                                                                                                               (1)   US/Other Markets access 26% physical markets + 2% of Nymex Basis
                                                                                                                     Differentials
                                                                                                               (2)   ~21% of Station 2 exposed at 7A/Hunt
                             California                                           US Midwest/Other
                                                                                                               (3)   Black Swan Hedges are reflected August 1st 2021 Forward
                            ~345 MMcf/d                                             ~84 Mmcf/d
*Average volumes

                   *California exposure increases to 445 Mmcf/d in exit 2022, and 495 Mmcf/d in exit 2023
                   *150 Mmcf/d AB Express/Cheniere LNG starts exit 2022
23

                                       Tourmaline/Cheniere LNG Export Overview
                                                                                                                                               July 2021
    Canada’s Largest Gas Producer and the
   Largest U.S. LNG Company create a unique                                  Overview
                                                                             • Tourmaline is the largest natural gas producer in Canada at 2.1 Bcf/d
      cross border marketing arrangement
                                                                             • Natural gas supplied from Tourmaline’s Alberta Deep Basin and/or B.C
    N. Montney                                                                 North Montney core complexes.
                                                                             • LNG Netback Supply Agreement provides international price exposure
                                                                               to JKM for Tourmaline.
                                                                             • Cheniere export capacity is currently up to ~6.5 Bcf/d
             Deep                                                            • Tourmaline to supply 140,000 MMbtu/d (1 cargo/month), 15 year term
             Basin                                                           • Low emission Tourmaline natural gas will now access Asian markets
                                          TC Energy
       TC Energy                          P/L MAINLINE
       P/L NGTL

                                               TC Energy
                                               P/L GLGT

                                                                                   EXPRESS
Pipeline Pathway           (US$/MMbtu)
TC Energy P/L NGTL
TC Energy P/L Mainline
TC Energy P/L GLGT/ANR
TOTAL Pipeline Tolls            0.86                                                                        TRANSCO
                                                                                                            PIPELINES

                                                             TC Energy
                                                             P/L ANR

Corpus Christi Liquefaction
                                                                                                                                              Corpus
Terminal Overview                                TRANSCO
                                                 PIPELINES
                                                                                                             Cheniere
                                                                                                             Corpus Christi                   Christi
• 3 Trains Complete, 2.4 Bcf/d Capacity                                                                      Pipeline                         Liquefaction
                                                                                                                                              Facility
• Stage 3 Expansion adds 1.6 Bcf/d                                See
  export capacity                                                 Corpus Christi                                        Corpus Christi Area Detail
                                                                  Area Detail
24

                                                           2021 & 2022 Guidance
                                                                                                                                        Sept 2021

                                                                                  2021(1)               2022(1)

            Production – Boe/d                                                   442,500              500,000
            Cash Flow(i) - $MM                                                    $3,000                $3,705

            CFPS - Diluted(i)                                                       $9.49               $11.24

            E&P Capital Program(ii) - $MM                                         $1,375                $1,125

            Total Net Capital Expenditures(iii) - $MM                             $1,413                $1,180

            Free Cash Flow(iv) - $MM                                              $1,587                $2,525

            Exit Net Surplus (Net Debt)(i) - $MM                                   ($958)               $1,333

            Debt to CF                                                                 0.3x                  N/A
(1) Price Assumptions: Gas price - $3.77/mmbtu 2021 NYMEX US, $4.27/mmbtu 2022 NYMEX US, $3.77/mcf 2021 AECO, $4.08/mcf 2022
      AECO; 2021 Oil price - $66.22/bbl WTI US, 2022 Oil price - $67.66/bbl WTI US.
(i) See “Non-GAAP Measures” in the Forward Looking Statement Advisories section of this presentation.
(ii) E&P Capital Program is defined as total capital spending before acquisitions, dispositions and other corporate expenditures.
(iii) Total Net Capital Expenditures is defined as the sum of E&P Capital Program and other corporate expenditures, net of non-core
dispositions.
(iv) Free Cash Flow is defined as Cash Flow less Total Net Capital Expenditures. Free Cash Flow is prior to dividend payments made by
Tourmaline and Topaz.
25
                                                                           Environmental Performance
                                                                           Investment & Returns                                                                                      July 2021

   Focusing on investment opportunities that maximize cost savings & environmental impact
   •         Water: recycling, & pipeline infrastructure; ~100% recycling in NEBC, advancing AB towards 100%
   •         Land: reclamation, well abandonment, road management, pad optimization
   •         Air: diesel displacement, pneumatic / venting reduction, power (highline), energy efficiency, CCUS, RNG
   •         Technology: CCUS, NGIF, RNG, other initiatives

$mm/yr                       Capital Investment                                     $mm/yr
                                                                                                                Annual Cost Savings & Emission Reduction                                     C02e/yr

   $140                                                                               $140                                                                                                    600,000
               $20 - $40mm/yr of capital to be invested in                                        Investments to date have reduced
               environmental performance improvement                                              emissions ~250,000 C02e per year
   $120        initiatives going forward                                              $120
                                                                                                                                                                                              500,000
                                                                                                  Substantial future annual carbon tax
               Investments to date all have made an economic                                      savings secured (~$24mm @ $100/ton)
   $100        return, along with a substantial positive                              $100
               environmental impact                                                                                                                                                           400,000
                                                                                                  >$30mm in yearly operating & capital
                                                                                       $80        cost savings already secured
       $80     Future annual savings per year will far surpass
               investment per year; environmental investment                                                                                                                                  300,000
               is another source of free cash flow                                     $60
       $60

                                                                                                                                                                                              200,000
                                                                                                                                        $24
       $40                                                                             $40                                      $24

                                 $25                                                                            $11                     $11
                        $20                                                                                                     $11                                                           100,000
       $20                       $11                                                   $20
               $11       $6                                                                        $10          $11
                        $11       $8                                                                                            $15     $18
                $8                                                                                  $9          $10
        $-      $3                                                                       $0                                                                                                   0
               2019     2020    2021      2022   2023     2024     2025     2026                   2019         2020        2021       2022       2023        2024       2025       2026

         Water        Land     Emission     Technology / Scalable Investment                            Water          Diesel         Power/Vent           Carbon Tax          C02e / Year (Base) RHS
See Tourmaline Sustainability Report for more detail; forward looking estimates are illustrative only                                        Illustrative Credit / Offset @ $100/ton
26
                                                                                     Tourmaline 2022 Cash Flow Sensitivity
                                                                                     & Allocation                        Sept 2021

  Tourmaline’s low cost structure drives sustainable return on, and of, capital opportunities
  •       TOU’s maintenance budget, dividend, and base EP growth fully funded at US$1.50/mcf
  •       Current strip provides meaningful free cash flow, >$1.0bn per year in every year of the five year plan
            • Allocated to base and special dividends, tactical buybacks, bolt on acquisitions and liquids infrastructure
  ($mm)
  $4,000
                                                                         2022 Cash Flow NYMEX Sensitivity & Allocation
  $3,750
                          >US$4.00/Mcf
  $3,500                   US$4.00/Mcf
                                                                                                                                                     FCF Available For:
  $3,250                   US$3.75/Mcf                     2022 / 2023 Calendar Strip – Recent Trading Range
                                                                                                                                                     (1) Base Div Incr.
  $3,000                   US$3.50/Mcf                                                                                                               (2) Special Div
                           US$3.25/Mcf                                                                                                               (3) Tactical Share
  $2,750
                           US$3.00/Mcf                                                                                                               Buybacks
  $2,500                   US$2.75/Mcf                                                                                                               (4) Bolt on Acq
                           US$2.50/Mcf                                                                                                               (5) Liquids Inf.
  $2,250                                                                                                                                             Investment
  $2,000                   US$2.25/Mcf
                           US$2.00/Mcf
  $1,750
                           US$1.75/Mcf                   Maintenance + Dividend + Growth Coverage at US$1.50/Mcf
  $1,500
                                                                                                                                       $150mm
  $1,250                     Cash Flow at                                                                          $235mm
  $1,000                     US$1.50/Mcf
    $750                                                                  $1,050mm
    $500
    $250
      $0
                        '22 Cash Flow Per                        Maintenance Budget                            TOU Base Dividend   3-5% Production   Available Funds
                       NYMEX Price Level                                                                                           Growth Per Year
                      (Sept 15th Strip WTI)
For sensitivity capital and basis assumptions and definition of free cash flow please see 5 year plan slide.
27
                                                                                    Tourmaline is North America’s Most
                                                                                    Attractive Natural Gas Investment                                                                                               Sept 2021

     TOU offers the most compelling investment proposition amongst large cap North American peers
     • Superior Margin: Stronger sales hub pricing and transport at ~50% the cost of US Appalachia peers
     • Best FCF Offering: ~$6,000/boe capital efficiencies and an investment grade balance sheet combine to create the
       best free cash flow offering which will flow to the benefit of equity holders sooner than deleveraging peers
     • Deep Inventory: Multi decade outlook for return on and of capital, with no ‘exhaustion’ overhang
     • Differentiated Demand Outlook: LNG Canada (+2-4 Bcfpd), Rockies Displacement (+1 Bcfpd), Local (+2 Bcfpd)
     • Leader in ESG: Decade ahead on water recycling, methane capture, emission reduction, plus aligned governance

                                        US$ Cash Flow / Boe(1)
                                2020A                                            2021E                                          2022 FCF/EV Yield(1)                                       Years of Inventory(2)
                                                                                                 20%                                                                            >75 yrs
                         Healthy and organically                            … leading to further
        $12. 00

                                                              US$15                                                  18%                                                                           As resource & inventory depth
                         driven cash flow through                                                18%
                                                                          margin expansion in 2021                                                                                               become a focus, TOU has multiple
                              the pandemic…                                                      16%
        $10. 00

                                                                                                                                                                                                  decades of development and no
                  US$8                                                                                   14%
         $8.00
                                                                                                                                                                                                   need for transformative M&A
                                                                                                         12%
         $6.00
                                                                                                         10%
                                                                                                           8%
                                                                                                           6%
         $4.00

         $2.00
                                                                                                           4%
                                                                                                           2%
         $0.00

                                                                                                         0%
                  TOU     EQT     CNX     AR      RRC           TOU       EQT      CNX        AR       RRC           TOU         EQT         CNX          AR         RRC           TOU        EQT         CNX       AR   RRC

                  Unhedged      Realized Cash Hedge Gain                      2021E Cash Flow /boe                                2022E Strip FCF/EV Yield                                      Years at 2019 Drilling Pace

1. TOU as per guidance, peers as per BMO “Post Q1 Model Book” August 10, 2021. All TOU data is converted to USD at $0.79. TOU FCF/EV as of June 15th, 2021, TOU EV net of Topaz Equity Value.
2. TOU as per Schedule A (Hz wells) – Pace at 2021 basis (accounts for acquired location pacing), peers as per BMO “Who’s Got What, Appalachia Edition” December 16, 2020 (Tier 1, 2, & 3) vs 2019 Drilling Pace.
28
                                                                                                  Growth Discipline Maximizes Margin &
                                                                                                  Free Cash Flow                      Sept 2021

           Our strategy is to pursue gradual organic production growth of 3-5% through the base EP program, and
           continuing adding scale through select, bolt on accretive acquisitions, ultimately owning a larger
           proportion of supply, at a higher margin, with more free cash flow, than we would if rapidly growing
           • Tourmaline remains the largest Canadian natural gas producer and from a market share perspective
              represents:
                • ~13% of current WCSB Receipts
                • ~20% of Canadian gas rig count
                • ~20% of WCSB gas adds in 2020                                      Our Market Share Focus
                • >40% of Aggregate 2022 Free Cash Flow generated by WCSB Natural Gas E&P peers(1)
                   Canadian Gas Drilling Rigs(2)                                         Bcf/d                  WCSB Receipts(2)                   $mm     2022 Peer Gas E&P FCF(1)
                                                                                           19                                                     $3,000            … Higher free cash flow,
           250               Less drilling leads to…                                                 … Less overall supply which leads to…
                                                                                                                                                                  particularly for those with the
                                                                                           18                                                     $2,500                lowest supply cost
           200

                                                                                           17                                                     $2,000
           150
(# rigs)

                                                                                           16                                                     $1,500

           100
                                                                                           15                                                     $1,000

            50
                                                                                           14                                                      $500

             0                                                                             13                                                        $0
                 Jan

                                   Apr

                                                                 Sep
                                                                       Oct
                                                                             Nov
                                                                                   Dec
                       Feb
                             Mar

                                         May

                                                           Aug
                                               Jun
                                                     Jul

                                                                                                Jan Feb Mar Apr May Jun Jul Aug Sep Oct Nov Dec             TOU           Canadian Peers(1)

                                                                                                         2018       2019     2020      2021                  While growing organically at ~5% CAGR,
             2015–20 range                     5-yr avg           2020              2021                                                                      TOU will generate ~$8bn in Free Cash
 1. TOU as per guidance, peers as per Bloomberg consensus Sept 15th 2021; WCSB Nat Gas peers AAV, ARX, BIR, KEL, PEY, POU, SDE
                                                                                                                                                                    Flow over the next 5 years
 2. Charts Sourced to: Peters & Co. and Desjardin
APPENDIX
30
                                                                     Tourmaline / Topaz Deconsolidation
                                                                     Illustrative Reporting Change                                                                            May 2021
Following the second quarter 2021 Topaz equity raise, Tourmaline’s financial treatment of Topaz is expected to shift
from fully consolidated to equity method.
   Illustrative 2020 Net Debt – Consolidated to Equity Method

 Net Debt & Illustrative Topaz Value
                                                  Fully
                                               Consolidated        Changes
                                                                                     Equity
                                                                                     Method
                                                                                                                                        Illustrative equity method 2020 net debt and
  Net Debt (YE 2020)                                   $1,785 $238                       $2,023
                                                                                                                                         cash flow items provided are a useful guide
                                                         Topaz Net Cash                                                                 for post deconsolidation directional modeling
  2021 Topaz Ownership Value (58mm Shares @$13.60/share (Dec 31 Close)                     $791
                                                                                                                                                      & reporting changes

                                                                                                                                                            Key 2021 Items
                    Illustrative 2020 Cash Flow – Consolidated to Equity Method                                                        •    Q1 was reported on a consolidated basis
                                                                                                                                       •    Q2 will be reported on a deconsolidated basis as of
                                                                                                              Netback Change                the close of the TPZ equity raise. This means the
                                                  Fully                              Equity                   Fully     Equity
 Changes to Cash Flow (2020)                   Consolidated        Changes*          Method                  Consol.   Method
                                                                                                                                            cash flow statement will include consolidated
                                                                                                                                            activity before the deconsolidation date (i.e., the
  Revenue Ex Other Income & Unrealized                 $2,224           $1              $2,225 $/boe            $19.56       $19.58         CVE clearwater transaction) but the balance sheet
                                                                 Topaz Hedges                                                               will be presented on a deconsolidated basis (No TPZ
  Other Income                                            $40         -$22                 $18 $/boe              $0.35       $0.16
                                                        Other Income Allocated to Topaz
                                                                                                                                            PP&E or net debt, but TPZ listed as a long term
  Royalties                                               $66          $59                $125 % of Rev             3%           6%         financial asset). Q2 dividends paid will be TOU
                                                               Topaz TOU GORR                                                               dividends only, Q2 TPZ dividends received will be
  Operating Expense                                      $357          $15                $372 $/boe              $3.14       $3.27         included in cash flow from operating activities.
                                                           Topaz TOU Tak e or Pay's
  Transportation Expense                                 $510           $0                $510 $/boe              $4.48       $4.48
                                                                                                                                       •    Q3 will include the impact of the TOU/TPZ NEBC
                                                                                                                                            transaction (July close) on TOU’s statements
  G&A Expense                                             $64          -$5                  $59    $/boe          $0.56       $0.52         ($245mm sale).
  Cash Finance Expense                                    $50          -$1                  $49 % YE ND           2.8%         2.4%
                                                                                                                                           Tourmaline’s 2021 guidance and 5 year plan
  Other Expenses, Net                                     $33           $0                  $33    $/boe          $0.29       $0.29        is now presented on a deconsolidated basis
 Cash Flow before dividends received                   $1,186         -$89               $1,097    $/boe        $10.43        $9.65

  Dividends Received from Topaz                            $0          $47                  $47

 Cash Flow                                             $1,186         -$43               $1,143    $/boe        $10.43       $10.05

 *Amounts added to or subtracted from the fully consolidated balances may not agree to the respective balances of Topaz's published financial statements,
 as some amounts have been reclassified for presentation purposes.
31
                                                                                    Tourmaline Financial Position
                                                                                    Excellent Liquidity, Resiliency & Capacity                                                              Sept 2021
 Tourmaline has ample liquidity and capacity to weather adverse commodity prices
                       Debt Profile & Cash Flow Sensitivities                                                                     Credit Facility & Term Loan Covenants

                               Debt Profile, Term, Capacity                                                             Total Debt / Total Capitalization must not exceed 0.6x
$mm                                                                                                               $mm                                                                    0.6x
  3500                         3,250 3,250 3,250 3,200 3,200 3,200                                               12,000                                                                             0.6x
  3000      2,800
                                                                                                                 10,000                                                      >4x Debt Capacity      0.5x
  2500                                                                                                                                                                           Increase
                      1,785                                                                                       8,000                                                                             0.4x
  2000                                                                                                                                                                       (Equity Held Flat)
                                                                                                                  6,000                                                                             0.3x
  1500                                  Unsecured, highly flexible,                                                                 0.2x                       0.1x
  1000                                    long dated maturities                           450       450
                                                                                                                  4,000                                                                             0.2x
   500                                                                                                    200     2,000                                                                             0.1x
     0
                                                                                                                     0                                                                              0.0x
              YE    Net 2021 2022 2023 2024 2025 2026 2027 2028 2029
                                                                                                                                   YE 2020               2021 Curr. Budget            Covenant
             2020  Debt
                   YE20                                                                                                              Total Debt       Total Capital    Debt to Total Capital
          Public Debt   Credit Facility (2026) Term Loan (2026) Additional Lines

                              2022 Cash Flow Sensitivities                                                                    TTM EBITDA / Interest Expense must exceed 3.0x
        Change in:                                                                                                 $mm
                                                                                                                   3,000                                         52x                                 60x
                                                                        Sensitivity remains
      Oil US$1/bbl                                 $22                                                             2,500                                                                             50x
                                                                           primarily to
                                                                           natural gas                             2,000                                                                             40x
                                                                                                                                      27x                                     >$2bn EBITDA room
          FX $0.01                                                                            $60                  1,500                                                                             30x

                                                                                                                   1,000                                                                             20x

                                                                                                                     500                                                                  3x         10x
Gas US$0.10/Mcf                                                                                           $75
     (NYMEX)                                                                                                              0                                                                          0x
                                                                                                                                    YE 2020               2021 Curr. Budget            Covenant
              $mm $0             $10        $20        $30        $40        $50        $60         $70    $80
                                                                                                                                   EBITDA         Interest Expense     EBITDA to Interest Expense

As per Tourmaline financial disclosure, and the current five year plan; sensitivities are full year.
32
                                                                                 Historical EP Performance
                                                                                                                                                                                    Mar 2021
                                             Production Growth Per Share*                                                                     Reserves Growth Per Share*
                                  500                                                                                             14
 Production per Thousand Shares

                                                                                                      Reserves per Share (BOEs)
                                                                                                                                  12
                                  400
                                                                                                                                  10
                                  300                                                                                              8
             (BOEs)

                                  200                                                                                              6
                                                                                                                                   4
                                  100
                                                                                                                                   2
                                    0                                                                                              0
                                        2010 2011 2012 2013 2014 2015 2016 2017 2018 2019 2020                                         2010 2011 2012 2013 2014 2015 2016 2017 2018 2019 2020

                                                       Op Costs/BOE                                                                                   Cash Flow Per Share
                      $7.00                                                                                                       $6.00

                                                                                                 Cash Flow per Share ($)
                                                                                                                                  $5.00
                      $6.00
                                                                                                                                  $4.00
                      $5.00                                                                                                       $3.00
                                                                                                                                  $2.00
                      $4.00
                                                                                                                                  $1.00
                      $3.00                                                                                                       $0.00
                                        2010 2011 2012 2013 2014 2015 2016 2017 2018 2019 2020                                            2010 2011 2012 2013 2014 2015 2016 2017 2018 2019 2020

• 2010-2020 Production growth per share CAGR of 25%.                                             • 2P Reserve Value of $17.2 billion after 11 years.
• Leading low capital costs and low cash costs allow Tourmaline to grow profitably on a full cycle basis at natural gas prices above US$1.50/mcf.
                                                                                                                                                                                     * Debt adjusted
33

                                                                                 Independently Recognized Canadian 2P Reserves(1)
                                                                                                                                                                                                               Mar 2021

    Tcf                             Natural Gas 2P Reserves                                                            MMbbl                       Conventional Liquid 2P Reserves
     18                                                                                                                1,200

     16            15         Tourmaline has historically converted 2P reserves
                                                                                                                                                  Tourmaline has booked only 13% of existing drilling inventory
                                to PDP reserves in approximately 4 - 5 years.                                          1,000
     14                                                                                                                                                  (2,579 of 20,014 locations – See Schedule A)
                                   YE 2020 2P reserves are 3.3 billion boe.
     12                                                                                                                   800                     738

     10
                                                                                                                          600
      8

      6                                                                                                                   400

      4
                                                                                                                          200
      2

      0                                                                                                                      0
            Peer TOU Peer Peer Peer Peer Peer Peer Peer Peer Peer Peer Peer Peer Peer                                             Peer Peer TOU Peer Peer Peer Peer Peer Peer Peer Peer Peer Peer Peer
             1        2    3    4    5    6    7    8    9    10 11 12 13 14                                                       1    5        13 12     8    14   3    7    2    4    9    11   6

      $bn                                                         2020/2019 Change in Before Tax NPV 10% 2P Value
      $3.0         $2.1
      $2.0
      $1.0
      $0.0
     -$1.0
     -$2.0
     -$3.0
     -$4.0
     -$5.0
                   TOU           Peer 4         Peer 6         Peer 7          Peer 9         Peer 2         Peer 8          Peer 3         Peer 5        Peer 12         Peer 11        Peer 13     Peer 10    Peer 14

(1) Canadian Protocol, most recent disclosure. Peers include Advantage, ARC, Birchcliff, CNRL, Cenovus, Crescent Point, Crew, Kelt, NuVista, Paramount, Peyto, Seven Generations, Suncor, Whitecap
34
                                       EP Growth Plan
                                       (Original Business Plan)
                                                                                           Sep 2008

This is essentially the same business plan that was executed for Duvernay Oil Corp. (2001-2008)

    •       Primary growth mechanism will be a conventional EP Program (including
            Resource plays).

    •       Build 2-3 core EP areas during initial three years of operations.

    •       Strive for large land positions, operatorship and infrastructure control in
            those core areas.

    •       Achieve profitable annual growth via low operating cost/high netback
            properties.

    •       Operate with a relatively small, technically strong staff.

    •       Dispose of non-core assets on a continuous basis, as appropriate.
35
                                                                                 Sundown
                                                                                 NEBC Montney Gas Complex                                                                        Mar 2021

Current Prod.                                    120 mmcf/d
Current Reserves 2P                              984 bcf (2P)                                                                                                              TC Pipeline
                                                                                                                                               Livingstone 2 MS.
Current OPEX                                     $1.20/boe                                                                                     ~12km from CGL
Montney Growth                                   In excess of 857 horizontal locations in inventory,
                                                 only 90 booked in current GLJ report.
                                                 Facility expandable to 250 mmcf/d by 2026
                                                                                                                                                                             Murphy Oil Corp.
                                                                                                                                                                             2019 21 bcf EUR wells
2020/21 Expansion and Land Consolidation:
• Expansion from 60 mmcf/d to 120 mmcf/d using inventoried equipment.
• 2020 land consolidation adds ~40 additional locations off existing TOU
  pads. Allows for optimized 2,000-2,400m lateral development plan.

                                        Reserve Growth and Cost Performance                                                              2020 TOU 9-9 Pad
                                                                                           2P Reserves
                                                                                                                                         5 wells, 1500m lat.
                    2,000                                                                                6.0
                                                                                           D/C/E Cost
2P Reserves (bcf)

                                                                                                               Well Cost ($MM)
                    1,500                                                                                4.5

                    1,000                                                                                3.0                     2020/21 4-4 Pad
                                                                                                                                 5 wells, 2100m lat.
                     500                                                                                 1.5

                         0                                                                               0.0
                                 2015          2016       2017        2018       2019          2020                                         B-67-H Gas Plant
                                                                                                                                            120 mmcf/d

                    10                          Recent Sundown Results
                                                                                        Sundown 7.8 bcf Type                                                                   2019 C-51-H Pad
                                                                                        9-9 Pad (Nov. 2020)                                                                    6 wells, 1350m lat.
                     8
                                                                                        C-51-H Pad (Apr. 2019)
                     6
  mmcf/d

                                                                                                                                 TOU Land
                     4
                                                                                                                                 TOU Pipelines
                     2
                                                                                                                                 TOU Gas Plants
                                                                                                                                                                   New Exploration Drilling in
                     0                                                                                                           Major Pipelines                   Montney C, and E Lobes
                             1     2       3          4   5       6    7     8     9      10      11     12                      2021/2022 Prop Loc.
                                                              Month
36
                                                       Alberta Deep Basin
                                                       Liquids Rich Cardium Fairway
                                                                                                                                                          Nov 2019

Only the initial Cardium delineation          16-20-50-22W5 PAD (2 Hztl)                6-1-51-23W5 PAD (2 Hztl)                    12-36-50-23W5 PAD (1 Hztl)
locations are depicted, the potential     IP 90 – 16.8 mmcfpd                     IP 90 – 21.7 mmcfpd                          IP 90 – 15 mmcfpd
location inventory is significantly       CR - 10.5 mmcfpd, 184 bbls/d            CR - 7.6 mmcfpd, 80 bbls/d                   CR - 4.5 mmcfpd, 60 bbls/d
larger. Note that each depicted
                                          CUM – 3.1 bcf, 72.6 mbbls               CUM – 6.3 bcf, 120.5 mbbls                   CUM – 7.4 bcf, 204 mbbls
surface location represents two hz
                                          EUR – 14.5 bcf, 305 mbbls               EUR – 18.0 bcf, 255 mbbls                    EUR – 13.0 bcf, 296 mbbls
wells (hanging wall/footwall)

                                                       16-30-50-22W5 PAD (1 Hztl)
T59                                                      T59                                           R.24      R.23                 R.22          R.21 Cardium Drilled Wells
                                                                                                                                                Tourmaline
                                                  IP 90 – 8.2 mmcfpd                                                                                                       T52
        Smoky                                                                                                                                   Tourmaline 2019 Cardium Wells
                                                  CR - 2.9 mmcfpd, 70 bbls/d
                                                                                                                                                Tourmaline Cardium Locations
T57
                                                  CUM –T57
                                                         1.1 bcf, 34.6 mbbls
                                                  EUR – 4.3 bcf, 120 mbbls
                                                                                                                                                                           T51
T55                                                       T55
                          Cabin
                          Creek
                                                           T53                                                                                                             T50

                                                                             7-11-51-23W5 PAD (1 Hztl)
                                              Anderson
          R3       R1W6
                                                                       102/2-11 - 11.3 mmcfpd, 120 bbls/d
                                                                       15-10 – 24.1 mmcfpd, 724 bbls/d
                                                                                                                                                                           T49
                                                                       120 hour Average Test Rate Sept. 2019
 ANDERSON DEVELOPMENT 12 Wells                                                         T49

   CR - 86 mmcfpd, 2033 bbls/d
                                                                                                                  10-25-50-23W5 PAD (1 Vert, + 1 Hztl)
   CUM – 44.7 BCF, 1.01 mmbbls                                                                       T47
                                                                                                              IP 90 – 28.5 mmcfpd,
   EUR – 123.0 BCF, 2.53 mmbbls                                                                               CR - 14.5 mmcfpd, 185 bbls/d
                                                                                                     T45
                                                                                                              CUM – 13.5 bcf, 251 mbbls
  The combination of extensive 3D seismic coverage and the
                                                                                                              EUR – 28.0 bcf, 474 mbbls
  lowest cost drilling/completion capability make the liquids
  rich Cardium play a significant new incremental                                                     T43
                                                                                                                 Tourmaline Lands
  opportunity in the overall Tourmaline Deep Basin portfolio.                           Stolberg                 Liquids Rich Cardium Fairway

                                        R24      R22             R20   R18       R16           R14               Cardium Faults
                                  R26
37

                                      Gundy Creek Deep Cut Plant
                                                                                                               Sept 2021

Gundy Phase 1: Plant start-up in May 2019, constructed in 6 months, 200 mmcfpd/15,000 bpd capacity, on budget and
ahead of schedule

Gundy Phase 2: Plant start-up expected exit 2021 / Q1 2022; capacity of 200 mmcfpd/15,000 bpd, $145mm associated
capital expenditure included in 2021 budget
38

                             Tourmaline Environmental Performance

•   Tourmaline strives to continually improve all aspects of environmental performance including the
    impact of its operations on air, land and water.

•   Tourmaline has the lowest CO2 emissions and emission intensity of the Canadian Senior producers.

•   Tourmaline is an industry leader in eliminating the use of diesel in all field operations (new
    technology development, utilization of highline power).

•   Tourmaline is Canada’s largest natural gas producer. Natural gas by far the ‘cleanest’ of the fossil
    fuel group.

•   Tourmaline is at the forefront of multi-well pad drilling in Western Canada, dramatically reducing
    the surface impact of full cycle resource play development in all three core operated areas.

•   Tourmaline has dramatically reduced CO2 and CH4 emissions by conducting all well testing in-line ,
    utilizing low emission controllers, employing waste heat recovery, developing new methane
    measurement and reduction techniques.

•   Tourmaline is an industry leader in non-potable frac water sourcing with eight frac water
    source/recycling facilities (>1,000,000 m3 capacity) avoiding the use of fresh water in frac
    operations. Tourmaline is one of the first operators in B.C to utilize produced water in frac
    operations and is the first company in Alberta to, with approval, employ this practice.
39

                                                                                    Sustainability Performance Highlights
                                                                                                                                                     June 2021
  Tourmaline has been aggressively and successfully pursuing a comprehensive environmental performance
  improvement strategy for over six years. The Company is systematically improving its performance and reducing the
  impact of all aspects of the Company’s activities upon air, land and water.

      Achievements                                     • 31% reduction in CO2 emission intensity since 2013 (39% inclusive of Pneumatics effective 2020)

                                   +289%
                                                       • 95% of completion water recycled from gas operations (~100% elimination of fresh water in NEBC)
                                   Production
                                                       • Initiation of methane reduction retrofit compliance plan in 2019; 3,400 controllers replaced
                                                       • A 50% reduction in the surface area per producing well in the Company’s operating areas
                                    -31%
                                      C02
                                                       • Broad replacement of diesel in Tourmaline’s drilling and completion operations with natural gas
     ‘13                    ‘19

                 Targets
                                                       • Targeting a 25% reduction in total methane emissions from 2018 levels by 2023 (on track for 2021)

                     -25%
                                                       • Reduce corporate emissions intensity by 25% by 2027(1), through the application of new, innovative
                    Methane                              technologies including the electrification of assets
                    Emissions
                     by 2023                           • Targeting elimination of fresh water usage in well stimulation operations (NEBC ✓)
           ‘18                      ‘23

            Initiatives
                                                       • Trial full electric (zero diesel) drilling rig in the Peace River High complex in 1H/2020
                 Work Towards                          • Migrate completion fleet to natural gas turbine technology (Trican JV 1H/2021)

           0
                   Diesel rigs in PRH
                   Diesel Turbines                     • Migrate all field operations towards low bleed, zero venting three phase technology devices that
                   Venting in field ops                  reduces fugitive methane emissions

(1) Scope 1, using 2018 as a baseline. See 2020 sustainability report for details
40

                                                Diesel Displacement Initiatives
                                                                                                                           Sept 2020

 Initiative                                                        Annual Emissions Impact                         Net Savings
Highline Power                                                     • 1.4mm litres/yr fuel displaced              $400,000/yr savings
• PRH rig running on 100% electricity                              • 3,100 tC02e/yr

Natural Gas Fuel Gas Substitution                                  • 15 mm litres/yr fuel displaced with         $10mm/yr savings
TOU owns & operates 15 diesel displacement packages                  Natural Gas                                 3.5 month payout on
• Rigs & Frac spreads achieving ~40% substitution.                 • 9,500 tC02e/yr reduction                    install
• Path towards 100% natural gas powered D+C program
Natural Gas Power Generation
                                                                    • 3,000 litres/d fuel displaced with          ~$50k/pad savings
• 330 kW gas turbines operating across NEBC asset base since          Natural Gas
  July 2019
                                                                    • 50 tC02e/pad reduction
• Two TOU designed natural gas powered electrical packages
                                                                    • 44% emissions reduction
  online in Alberta Completion operations since July 2020
Pad Electrification                                                • Additional 9,000 litres/d to be displaced
                                                                                                                 ~$150k/pad savings
• Working towards total pad electrification through natural gas;     with Natural Gas and 5.5 tC02e/d
  removal of all diesel generation by end of 2021                    reduction once in place.

     TOU diesel displacement with NG                  TOU diesel displacement fleet              TOU Lease Electrification Initiatives
Continuous Environmental Performance Improvement 41
                                    Through Innovative Application of New Technologies

•   Massive reduction in flaring

•   Water recycling for fracs                                     Tech Service

•   Gas fired drilling rigs/fracs

•   Methane leakage elimination across all
    operating regimes

                                                         •   COSIA & NGIF industry technology
                                                             development alliances

                                                         •   Surface footprint reduction/pad drilling

                                                         •   Widespread electrification.
Basic Research
                                                         •   Multiple CO2 mitigation strategies/CCS

                                                         •   Smart pipelines/wellsites

                                CANADIAN OIL & GAS IS THE WORLD LEADER
Tourmaline Environmental Performance                                       42

                                             Improvement Highlights
                                                                                                                June 2019
                  BC Water Management                                           Alberta Water Management

 • 95-100% of all water sourced for stimulation operations is    • 1st, and only, company in Alberta to be licenced to store
   recycled                                                        and recycle produced water from an in-ground storage pit
 • 100% of all water flowed back from completion operations is   • 50-75% of water sourced for stimulation operations is
   recycled                                                        recycled and is growing

         Drilling/Completion Emissions Reductions                             Methane Emissions Reduction

• 30% lower CO2, 75% lower Nox, 99%                               • 487 Tonnes of methane removed due
  lower SOx emissions                                               to modifications to facility controls on
• 90% lower particulate emissions                                   our dehys/refridge units
• Drilling Rigs achieving ~60-70%                                 • 326 controllers replaced to low
  displacement of diesel                                            emission models NOTE: Program
                                                                    continues in 2019 to inventory all
                                                                    natural gas pneumatic controllers
                                                                  • In 2019 waste heat recovery
                                                                    technology was incorporated into our
                                                                    plant design
43
                                     Tourmaline Technology Curve/Future
                                     Concepts, Requirements & Opportunities
                                                                • Cost saving via novel frac water sourcing/recycling
                                                                  • New Waste heat recovery technology
                      • Alternative hz frac programs/processes
                        – Concurrent pairs, delayed flow-backs etc.
                    • Novel drilling technology to reduce time/cost              • Utilizing gas fired turbines to reduce
                      in drilling builds                                           costs for drilling, completions, facilities
                • Refine drilling techniques/cost savings for            • New mud systems to reduce drilling times
                  frontal foothills Wilrich/Notikewin hz drlg
                                                                      • Improved horizontal stimulation techniques, new
                • Ball drop/sliding sleeve completion                   approaches to maximize deliverability and
                  technique in vertical wells                           recovery
                                                                 • Sour frac water sweetening technology
                                                             • Develop predictive reservoir/reserve tools
                                                               for horizontal clastic gas wells

                                                        • Improved Wilrich seismic imaging in strat
• Understanding controls on Wilrich                       settings and Outer Foothills settings
  deliverability/develop predictive tools
                                                • Paleozoic/New Deep Play concepts
• New shale/source rock plays
                                            • AI applications in geophysical interpretation, reservoir
                                              prediction and predictive drilling problem identification.
• Pasquia Hills oil shale recovery
  mechanisms
44

                                                                         Schedule A

                                                       DRILLING LOCATIONS

Estimated Drilling Inventory
This presentation discloses drilling locations in four categories: (i) proved undeveloped locations; (ii) probable undeveloped
locations; (iii) unbooked locations; and (iv) an aggregate total of (i), (ii) and (iii). Of the 22,810 (gross) locations disclosed in this
presentation, 1,675 are proved undeveloped locations, 24 are proved non-producing locations, 1,467 are probable undeveloped
locations, 0 are probable non-producing and 19,644 are unbooked. Proved producing wells, proved undeveloped locations,
proved non-producing locations, probable undeveloped locations and probable non-producing locations are booked and derived
from the Company's most recent independent reserves evaluation as prepared by GLJ and Deloitte LLP as of December 31,
2020, and internal estimates for assets acquired during 2021, and account for drilling locations that have associated proved
and/or probable reserves, as applicable. Unbooked locations are internal estimates based on the Company's prospective acreage
and an assumption as to the number of wells that can be drilled per section based on industry practice and internal review.
Unbooked locations do not have attributed reserves or resources (including contingent and prospective). Unbooked locations
have been identified by management as an estimation of the Company's multi-year drilling activities based on evaluation of
applicable geologic, seismic, engineering, production and reserves information. There is no certainty that the Company will drill
all unbooked drilling locations and if drilled there is no certainty that such locations will result in additional oil and gas reserves,
resources or production. The drilling locations on which the Company will actually drill wells, including the number and timing
thereof is ultimately dependent upon the availability of funding, regulatory approvals, seasonal restrictions, oil and natural gas
prices, costs, actual drilling results, additional reservoir information that is obtained and other factors. While a certain number
of the unbooked drilling locations have been derisked by drilling existing wells in relative close proximity to such unbooked
drilling locations, the majority of other unbooked drilling locations are farther away from existing wells where management has
less information about the characteristics of the reservoir and therefore there is more uncertainty whether wells will be drilled in
such locations and if drilled there is more uncertainty that such wells will result in additional oil and gas reserves, resources or
production.

The following provides additional information on the Company's estimation of unbooked locations.
You can also read