State of the Markets 2020 - Federal Energy Regulatory ...
←
→
Page content transcription
If your browser does not render page correctly, please read the page content below
State of the Markets
                                              2020

                               A Staff Report to the Commission

                                         March 18, 2021

                      FEDERAL ENERGY REGULATORY COMMISSION

                               Office of Energy Policy and Innovation

                              Division of Energy Market Assessments

This report is a product of the Federal Energy Regulatory Commission Staff. The views expressed in
this report, if any, do not necessarily reflect the views of the Commission or the United States of
America.
Preface
The State of the Markets report prepared by the Office of Energy Policy and Innovation’s Division of Energy
Market Assessments summarizes key trends in electricity and natural gas markets, important topics, and
notable developments in 2020. The first section of this report summarizes the effects of major events
including the COVID-19 pandemic (COVID-19), severe weather, and significant changes to energy markets;
the second section then characterizes key fundamentals of the electricity and natural gas markets.

Key Findings
Efforts to mitigate the spread of COVID-19 made 2020 a unique year since this report’s inception in the year
2000. In the spring, social-distancing, work-from-home, travel restrictions, and business closures temporarily
changed energy supply and demand fundamentals. Grid operators encountered and overcame novel
challenges in accurately forecasting electricity demand and ensuring reliable grid operations while also
minimizing the risk of transmitting the highly contagious virus to vital personnel. Oil markets experienced
significant disruptions as contractions in demand led to a dramatic reduction in prices, resulting in delayed or
deferred drilling decisions for new wells in response to deteriorating project economics. After a steady
increase since 2017, oil production in the United States declined approximately 8% year-over-year and in May
fell to its lowest point since January of 2018. Natural gas production, however, recorded only a 2% year-over-
year decline as production and demand for the fuel relative to oil was less elastic.

Extreme heat and wildfires in the West, as well as an active hurricane season in the Gulf of Mexico, highlighted
the critical role of weather in energy market operations and reliability. Each severe weather event presented
distinct challenges causing loss of load and highlighted the importance of market rules regarding dispatch and
settlement in emergency situations. Overall, the United States energy sector undertook these challenges and
sought to protect the integrity of the grid while seeking new opportunities to improve performance of the
energy markets.

In the wholesale electricity markets, electricity prices declined for the second year in a row to record-low prices
in some regions. This decline was due to long-run trends in the resource mix, a mild 2019-2020 winter, and
the effect of the COVID-19 pandemic on electricity demand. Natural gas and renewable generation resources
accounted for most new additions while nuclear and coal generation resources accounted for most
retirements. Overall, capacity markets operated by the eastern Independent System Operators (ISOs)
supported enough capacity to ensure reliable operations, even if localized tight conditions persist in some
regions as shown by high local capacity market prices. In the West, the existing Western Energy Imbalance
Market expanded, and a new Western Energy Imbalance Service, administered by the Southwest Power Pool,
Inc. received approval from the Commission to operate in 2021. Finally, most new transmission lines
scheduled to go into service in 2020 were driven by reliability, aging infrastructure, and load growth needs.

Although 2020 saw low natural gas benchmark prices, annual natural gas demand and production were similar
to 2019 for several reasons. Anticipated large declines in natural gas production due to falling oil production
did not materialize and overall production fell only slightly. At the same time, falling residential, commercial,
and industrial demand for natural gas was more than offset by record demand from the electricity and export
sectors as lower cost natural gas-fired generation displaced other fuel sources and LNG export capacity
continued to grow. Low profitability reduced LNG exports in the summer but a strong recovery by the end
of the year resulted in record net exports. The highest natural gas storage inventories since 2016 and generally
mild winter weather across the U.S. also contributed to lower natural gas prices during 2020.
Major Events
This first section of the report summarizes four major events in 2020 that influenced energy markets: the
COVID-19 pandemic’s effect on electricity and natural gas markets; severe weather events in the Western
United States and Gulf of Mexico; the expansion of wholesale electricity markets in the West; and expansion
and refinement of electricity market products, including ramping, fast-start pricing, and reserves.

COVID-19 Impact on Energy Markets

Electricity Markets and Operations
In 2020, the COVID-19 pandemic changed how Fig. 1 Percent Change in Weather-Adjusted Load
consumers used electricity and forced grid operators in 2020 from Three-Year Historical Average.
to change their operations to address evolving
market conditions while protecting their staff. As
communities and companies implemented social
distancing and stay-at-home measures to combat the
spread of COVID-19 in the spring of 2020, electricity
demand shifted from commercial and industrial uses
to residential consumption. Overall, electricity
demand in the U.S. dropped about 4% in 2020, as
commercial and industrial demand dropped 6% and
8%, respectively, and residential demand rose 1%. 1
The decline in electricity demand was most
significant in April and May. Staff analysis of average
daily load that adjusts for the weather, day of week,
and seasonal trends shows an approximate reduction
                                                                 Source: Hitachi Powergrids Velocity Suite and
of load between 4% and 10% during April of 2020 in
                                                                                   Commission Staff Analysis
the six Commission-jurisdictional ISOs: California
Independent System Operator Corporation (CAISO), Southwest Power Pool, Inc. (SPP), Midcontinent
Independent System Operator, Inc. (MISO), PJM Interconnection, L.L.C. (PJM), New York Independent
System Operator, Inc. (NYISO), and ISO New England Inc. (ISO-NE). 2 During this same period, prices
were at their lowest point in the year. Monthly average day-ahead on-peak nodal prices were between $15
and $20 per megawatt-hour (MWh) in each of these six ISOs.

The decline in commercial and industrial demand and rise in residential use changed daily load patterns as
well, with demand rising more gradually in the mornings than it normally has. Grid operators worked to
adjust their load forecasts – a key element of ensuring efficient market results – as COVID-19’s effect on

1
    See EIA, Short-Term Annual Outlook, at 3 (January 2020).
2
 Throughout this report we use the term ISO to refer to both ISOs and Regional Transmission Organizations
(RTOs) for simplicity. Although ISOs and RTOs are distinct legal concepts, as outlined in Commission
Orders No. 888 and 2000, the distinction is not relevant to the issues discussed herein.

                                                         1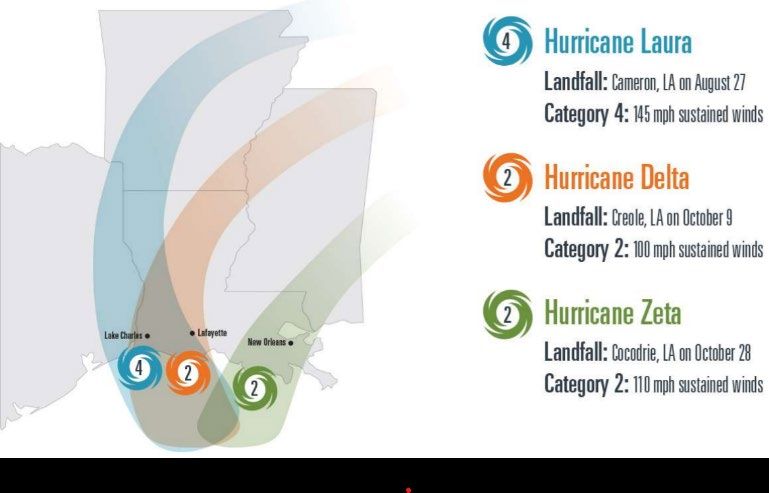
electricity demand evolved with the institution and then easing of restrictions to mitigate the effects of
COVID-19.

The electricity industry successfully operated throughout the year in spite of the COVID-19 pandemic
challenges. The Electricity Subsector Coordinating Council and the North American Electric Reliability
Corporation (NERC) led the electricity industry in identifying and addressing issues arising from COVID-19
pandemic to ensure continuity of operations, such as: protecting control centers and generation facilities;
obtaining access to, and operations in, areas with travel restrictions; developing protocols for mutual
assistance, as are needed in storm restoration; and protecting cyber security and supply chains. 3

Natural Gas and Crude Oil Markets
The COVID-19 pandemic affected every aspect of the natural gas market in the United States, but the ties
between natural gas production and crude oil production in the first six months of 2020 were of particular
interest. Over the last decade, natural gas produced as a co-product of crude oil-focused drilling rigs, often
called “associated natural gas,” has become an important part of the country’s natural gas supply, with 12%
of all domestic natural gas production coming from crude oil wells in 2018, according to the U.S. Energy
Information Administration (EIA). However, in April 2020, U.S. consumption of petroleum fell to its lowest
level in decades as a result of COVID-19 pandemic-related economic disruptions, and a brief crude oil price
war during March 2020 between Saudi Arabia and Fig. 2 West Texas Intermediate (WTI) Crude Oil
Russia after production quota negotiations between Price, 2020
the Organization of Petroleum Exporting Countries
and its partner countries (OPEC+) broke down.
Amid this convergence of downward pressures,
West Texas Intermediate (WTI) crude oil
benchmark futures traded at negative prices for the
first time ever on April 20, 2020. In response, crude
oil production in the United States fell from a record
high of 12.9 million barrels of oil per day (BOPD) in
November 2019 to 10.0 million BOPD in May 2020,
the lowest level in 2.5 years. Oil and natural gas
producers shut in some wells and limited the number
of new wells brought online over that time period.
Total operating oil and natural gas drilling rigs
dropped by 68%, from 790 rigs in January 2020 to                   Source: Federal Reserve Economic Database,
250 rigs in August 2020.                                                     Federal Reserve Bank of St. Louis
The decline in crude oil production was expected to significantly decrease the production of associated natural
gas. However, while crude oil production declined by approximately 8% year-over-year in 2020; natural gas
production declined by 2%. This relatively modest decline for natural gas, given the impacts of the COVID-
19 pandemic and lower prices, was largely due to: a rebound in production from natural gas-focused shale
wells that had been shut-in early in the year, proportionally more natural gas production from older crude oil
focused wells, and production optimizations for new natural gas wells. Reluctance from natural gas and oil

3
 See Electricity Subsector Coordinating Council, Assessing and Mitigating the Novel Coronavirus, Electricity Subsector
Coordinating Council, at 1 (March 2020).

                                                          2
producing companies to invest significant capital into drilling new wells and, at times, well curtailments have
kept production of crude oil below its end of 2019 peak. By October 2020, the latest date for which final
production numbers are available from the EIA, crude oil production had only marginally increased to 10.4
million BOPD. WTI crude oil prices recovered to $40 per barrel by July and began to increase further at the
end of 2020 to almost $50 per barrel with the dual announcements of an OPEC+ agreement to limit
production increases in 2021 and COVID-19 vaccine rollouts.
The effects of the COVID-19 pandemic and low commodity prices also led to an increase in bankruptcy
filings by energy companies, according to S&P Global. 4 In 2020, 69 energy companies filed for bankruptcy
protection, a 33% increase from 2019 and the most to file for bankruptcy protection since 2016. Of the 69
energy company bankruptcy filings, 36 were filed by oil and natural gas exploration and production companies
and 19 were filed by oil and natural gas equipment and services companies. Additionally, 13 of the energy
companies to file for bankruptcy had assets worth over $1 billion at the initial time of filing.
Severe Weather Events
Heatwaves and Wildfires in the West
In August and September 2020, states in the Western Fig. 3 CAISO August 14, 2020
U.S. experienced average temperatures 3 to 5 °F Real-Time System Marginal Energy Cost
above normal. Twice during this time, in the middle Demand Peak: Net Demand Peak:
of August and early September, the Southern part of $1,200
System Marginal Cost ($/MWh)
4:56 PM 6:51 PM
the West experienced sustained extreme heat that $1,000
increased electricity demand. For California, CAISO Controlled
$800
ordered two controlled load shedding events — for Load Shed
two hours on August 14 and for 20 minutes on Duration
$600
August 15. Each load shedding event affected more
$400
than 300,000 customers. On August 14, from around
6:00 PM to 7:15 PM, CAISO invoked shortage $200
pricing, amid Power Balance Constraint violations, $0
and the Real-Time System Marginal Energy Cost was
set to the CAISO offer cap of $1,000/MWh.
Notably, the locational marginal prices (LMPs) paid
Time
by the load serving entities were higher than CAISO’s
System Marginal Energy Cost because of the cost of Source: CAISO OASIS
congestion. The congestion costs along with cost of losses are added to the System Marginal Energy Cost to
calculate the LMPs. The two controlled load shedding events in August exposed evening supply challenges,
among other issues, 5 as solar generation output fell off after the sun set but demand continued to be high.
4
Energy companies as defined by S&P Global includes non-Commission-jurisdictional entities such as oil
field services providers.
5
Other issues exposed by the event included convergence bidding and under-scheduling practices in the day-
ahead energy markets and weather-driven electricity demand exceeding resource adequacy targets. E.g.,
3Currently, CAISO’s resource planning process focuses on ensuring sufficient supply to meet the demand peak
and not the net demand peak. However, during certain periods planning to meet the net demand peak or
when demand for electricity less wind and solar generation is at its highest during the day, may provide a
better measure to use to allow the region to serve load sufficiently. Several weeks later, in early September
2020, another heatwave broke temperature records but CAISO addressed the corresponding demand without
shedding load.
Other than record-breaking heat, the West experienced an exceptionally severe fire season this past year.
According to the California Department of Forestry and Fire Protection, five of the ten largest wildfires on
record in California occurred in 2020. Because sparks from energized electricity lines pose the risk of wildfires
amid extreme weather conditions, California utilities may implement Public Safety Power Shutoffs (PSPS) to
mitigate the risk of wildfires by de-energizing transmission and distribution lines. 6 A PSPS event can impact
thousands of customers for multiple days as life-threatening conditions prevent utilities from assessing the
damages and conducting the necessary repairs. In June 2020, the California Public Utilities Commission
updated and added additional guidelines for de-energizing of electricity facilities and adopted short-term
actions to accelerate microgrid development and related resiliency solutions. 7
Also in California last year, wildfires reduced solar Fig. 4 Daily Solar Generation in CAISO
output. In August and September 2020, CAISO solar
electricity generation declined approximately one- 160
third below July 2020 levels as offshore winds pushed 140
September 4
wildfire smoke into Southern California — where 120
Creek fire started
most of the installed solar capacity resides. The
Gigawatt-hours
100
smoke resulting from the record-setting wildfires 80
reduced the electricity production from installed solar 60
resources. For example, a wildfire triggered by 40 August 16 August 18
lightning between Sacramento and Eureka, August Complex North Complex
20
California, known as the August Complex fire, fire started fire started
0
coincided with a large drop in solar output in the Jul Aug Sep Oct
middle of August. Solar generation output
Months
temporarily returned to normal levels by the month’s
end before the Creek fire, originating near Fresno, Source: Hitachi Powergrids Velocity Suite
caused a similar drop in solar output in September.
California Independent Operator, California Public Utilities Commission, and California Energy Commission,
Final Roost Cause Analysis: Mid-August 2020 Extreme Heat Wave, (January 13, 2021).
6
Typically, utilities initiate temporary power shutoffs in specific areas where intense winds and extreme heat
are present and may cause power lines and equipment to fail.
7
See, Decision 20-05-051, Rulemaking 18-12-005 (California Public Utilities Commission, June 5, 2020)
(Requiring working groups and an advisory board, de-energization exercises, timely notices to affected
populations, community resource centers, and power restoration within 24 hours from the termination of
PSPS events). Decision 20-06-017, Rulemaking 19-09-009 (California Public Utilities Commission, June 17,
2020) (Calling for short-term actions to accelerate microgrid development and related resiliency solutions).
4Hurricanes in the Gulf of Mexico
With 30 named storms, the 2020 Atlantic hurricane Fig. 5 Hurricanes in MISO’s Footprint, 2020
season was the most active on record. The high
winds and storm surge associated with these
hurricanes threatened the reliability of the power
grid and natural gas and crude oil production in the
Gulf of Mexico.
Three hurricanes made landfall in MISO’s footprint
along the Gulf Coast, causing severe damage to local
transmission and distribution systems. Most
significant, on August 27, Hurricane Laura made
landfall in Cameron, Louisiana as a category 4 storm
with wind speeds of 150 mph — the strongest storm
to hit Louisiana since 1856. As it moved through
Entergy Louisiana and Entergy Arkansas, it caused Source: Entergy’s Hurricane Laura Recovery Report
considerable damage to the transmission and
distribution system. Entergy reported 1,459 transmission structures as damaged or destroyed, 316 substations
affected, and 2,792 miles of lines damaged in its Louisiana service territory. Restoration of the transmission
and distribution network took several months and required the deployment of line workers and material from
transmission projects in the surrounding regions.
The destruction of distribution and transmission equipment by Hurricane Laura caused the loss of power for
nearly one million customers in Texas, Louisiana, Arkansas, Tennessee, and Mississippi. The damage was
particularly severe near Lake Charles, Louisiana, where transmission outages created a load pocket in MISO’s
footprint near the border with SPP and the Electric Reliability Council of Texas (ERCOT). With several
generators on outage in anticipation of the storm and others tripped during the event, MISO instructed the
shedding of approximately 570 megawatts (MW) of load in the load pocket to maintain reliability of the grid.
A software limitation prevented MISO from automatically implementing emergency pricing at MISO’s Value
of Loss Load (VOLL) of $3,500/MWh in the load pocket. Instead, during the emergency, the real time LMP
was below $20/MWh on average. Because the price signals were inconsistent with the system’s need,
operators had to manually re-dispatch multiple units. Revised settlements at VOLL after the event included
approximately $90 million in balancing congestion. MISO established proper pricing by the October 10
landfall of Hurricane Delta, which incentivized some generation to return from outage early and units to
switch from ERCOT to MISO as needed. In December 2020, MISO submitted proposed improvements to
its emergency pricing construct to the Commission to address some of the pricing issues that arose during the
Hurricane Laura event. 8
The 2020 hurricane season also affected crude oil and natural gas production. The growth of onshore shale
production in the early 2000s diversified U.S. natural gas supply such that offshore production represents less
than 3% of total US dry gas production, thus mitigating the price effects of major gulf storms. But offshore
production in the Gulf of Mexico remains important because of its proximity to major demand markets in
8
Midcontinent Indep. Transmission Sys. Operator, Inc., Filing, Docket No. ER21-7000 (December 21, 2020).
5the Southeast. The Interior Department’s Bureau of Fig. 6 Hurricanes’ Impact on Natural Gas
Safety and Environmental Enforcement monitored
six storms threatening oil and natural gas offshore
production in the Gulf of Mexico in 2020. Except
during the weeks of major storm events, offshore gas
production remained stable from June through
November, at an average just under 2.3 Billion cubic
feet per day (Bcfd). On average, at their peak, the six
storms caused the temporary shut-in of 49% of
offshore gas production and 65% of offshore crude
oil production, which represents 1.2 million BOPD.
Together, Hurricanes Laura and Marco shut-in more
than 60% of offshore natural gas production for four
days and over 80% of offshore oil production for
about six days. Hurricanes Delta and Zeta came at
the tail end of hurricane season in the beginning and Source: National Hurricane Center; S&P Global Platts;
end of October, respectively. Delta had the Bureau of Safety and Environmental Enforcement
strongest peak impact of all hurricanes for the 2020
season as it shut-in about 62% of offshore gas production and more than 91% of crude oil production for
four days. Zeta peaked at nearly the same levels of supply destruction as Delta, but peak shut-ins were
sustained for only one day.
Regarding LNG facilities, the 2020 hurricane season had longer duration impacts on Gulf Coast LNG facilities
than the storms’ effects on natural gas and crude oil supply. This occurred even as LNG exports were
recovering from low capacity utilization over the summer due to the effects of the COVID-19 pandemic on
foreign import markets. Recorded feedgas, the natural gas that is liquefied for export at LNG terminals,
fluctuated significantly as the storms disrupted operations at the coastal facilities in their paths. The back-to-
back impacts from Hurricanes Laura and Marco caused Gulf Coast LNG feedgas levels to drop 49% over the
week of August 24, 2020, down to the lowest point of the year at 1.57 Bcfd on August 26. Power lines that
supply the Cameron LNG terminal were damaged, while draft restrictions on the Calcasieu waterway also
occurred, preventing Cameron LNG from shipping any LNG from late August until October 5. However,
with improving profitability on shipments to foreign export markets and no further lasting hurricane impacts,
total U.S. Gulf Coast LNG feedgas recovered, peaking at 10.81 Bcfd on December 13, 2020. The many other
factors affecting U.S. LNG will be covered in more detail in the Natural Gas Fundamentals section of this
report.
Expansion and Refinement of Electricity Markets
Expansion of Electricity Markets in the West
Centrally dispatched electricity markets continued to expand in the West in 2020. Two public power utilities
– Salt River Project and Seattle City Light – joined the CAISO-run Western Energy Imbalance Market (EIM)
on April 1, 2020, bringing the number of utilities in the EIM to 11. An additional five utilities are expected
to join or expand their participation in the EIM in 2021: Los Angeles Department of Water & Power, Public
Service Company of New Mexico, NorthWestern Energy, Turlock Irrigation District, Balancing Authority of
Northern California.
6Elsewhere in the West, an SPP-administered Fig. 7 Centrally Dispatched Electricity Markets
Western Energy Imbalance Service market (WEIS) in the West
received Commission approval on December 23,
2020. Like the EIM, WEIS operates as a real-time
wholesale electricity market that balances load and
generation in participating regions, and prices
generation using an LMP model. Initial market
participants include Basin Electric Power
Cooperative, Deseret Power Electric Cooperative,
Municipal Energy Agency of Nebraska, Tri-State
Generation and Transmission Association,
Wyoming Municipal Power Agency, and three
Western Area Power Administration (WAPA)
marketing regions: Upper Great Plains West, Rocky
Mountain Region, and Colorado River Storage.
WEIS successfully launched as of February 1, 2021. Source: Hitachi Powergrids Velocity Suite
Expansion and Refinement of Electricity Market Products
As the technologies underpinning the electrical grid change, so too do the market rules governing electricity
production and compensation. In 2020, most ISOs continued to expand and refine their market products to
better achieve the goal of least-cost, reliable electricity while also addressing new challenges that can emerge
with a growing share of variable resources. Several of these changes to the market rules better encourage, and
more accurately compensate, flexible resources through market commitment and dispatch instead of out-of-
market interventions by the grid operator.
In 2020, the Commission approved a ramping product in SPP intended to directly compensate resources that
are directed to ramp-up or ramp-down generation in the near-term (i.e. 10-minutes). 9 In general, ramping
products help balance short-run fluctuations in supply and demand and are co-optimized with other ancillary
services and the energy market in order to minimize overall system costs. SPP for instance found a ramping
product would have reduced the frequency of historical scarcity events by 84% while also reducing the need
for out-of-market operator interventions. 10 Other regions with a sizeable share of variable resources — MISO
and CAISO — have already implemented Commission-approved ramping products for their markets. 11
Several other market refinements moved forward in 2020. Both SPP and PJM made progress in either
implementing or advancing fast-start pricing reforms so that prices better reflect the marginal cost of serving
load. 12 In addition, PJM revised its pricing of reserves — resources held on reserve to match short-run
9
Southwest Power Pool, Inc., 172 FERC ¶ 61,027 (2020).
10
Sw. Power Pool, Inc., Filing, Docket No. ER20-1617 (April 21, 2020).
11
Midcontinent Indep. Transmission Sys. Operator, Inc., 149 FERC ¶ 61,095 (2014). Cal. Indep. Sys. Operator Corp.,
156 FERC ¶ 61,226, at P 1 (2016).
12
Sw. Power Pool, Inc., 172 FERC ¶ 61,038 (2020). PJM Interconnection, L.L.C., 173 FERC ¶ 61,028 (2020)
7fluctuations in the balance of supply and demand that will be implemented in 2022. 13Finally, MISO’s new 30-
minute short-term reserve product was approved by the Commission in 2020 and is scheduled to be
implemented in late 2021. 14 MISO projects this reserve product will reduce out-of-market operator
interventions, reduce net production costs by $5 million annually, and reduce make-whole payments by $1.6
million annually. 15
Market Fundamentals
This second section of the report summarizes observed trends in electricity and natural gas market
fundamentals during the year 2020 including prices, demand, production, and infrastructure changes.
Electricity
Wholesale Electricity Price
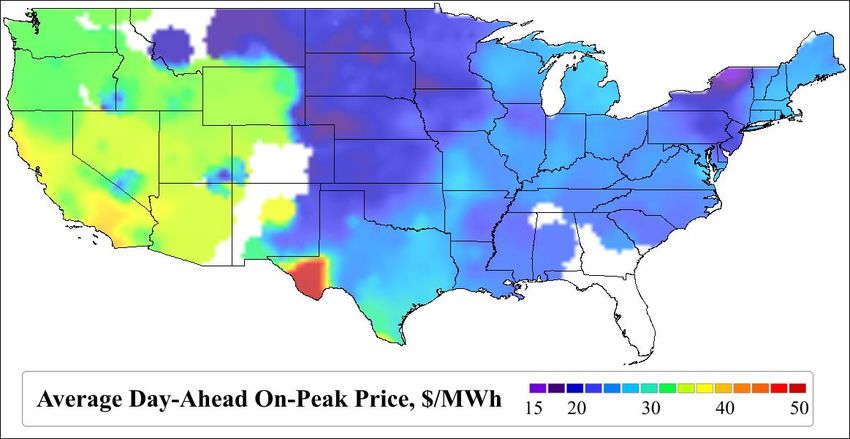
For the second year in a row, wholesale electricity Fig. 8 Change in Annual Average Day-Ahead On-
prices declined from the prior year. Annual average Peak Price from 2019 for Select Nodes
day-ahead on-peak prices declined from 2019 to
2020 at all representative nodal pricing hubs except
for CAISO SP15 and Palo Verde near Southern
California. The greatest price reduction was in
ERCOT, where stressed market conditions in the
summer of 2019 led to high average electricity prices
for that year. Of the remaining ISO trading hubs,
the price declines were greater in the Northeast and
Mid-Atlantic than they were in the Midwest and
Great Plains. For example, prices were 27% lower
at NYISO Zone J in New York City, 14% lower at
MISO Indiana Hub, and 17% lower at SPP North in
Nebraska.
As discussed earlier, lower wholesale electricity Source: S&P Global Market Intelligence
prices in 2020 were due to COVID-19 pandemic-
related demand reductions. Equally important for electricity prices, 2020 was a year of low natural gas prices
and a mild winter. Power plant operations and profitability are influenced by lower wholesale electricity prices
in the energy market. For example, net revenue, which is total revenue less short-run marginal cost, of a new
13
PJM Interconnection, L.L.C., 171 FERC ¶ 61,153 (2020).
14
Midcontinent Indep. Transmission Sys. Operator, Inc., 170 FERC ¶ 61,075 (2020).
15
Midcontinent Indep. Transmission Sys. Operator, Inc, Filing, Docket No. ER20-42, at P 11 (Oct. 4, 2019).
8hypothetical natural gas combined cycle power plant in PJM would have been 23% lower in the first three
quarters of 2020 compared to the same period in 2019. 16
Fig. 9 Annual Average Day-Ahead On-Peak Price at Electricity prices followed similar geographic
ISO and Non-ISO Pricing Nodes in 2020 patterns in 2020 as in previous years. Average
wholesale prices were lower in the Great
Plains, where there was less demand for
electricity, a greater potential for low-marginal
cost wind energy, and greater access to natural
gas. Wholesale electricity prices in the West
remained higher than those in the east, on
average. In the eastern interconnection, Long
Island in New York and the western shore of
Chesapeake Bay experienced consistent
transmission congestion which contributed to
higher wholesale prices compared to
Source: Hitachi Powergrids Velocity Suite neighboring areas. Price separation was also
evident between ISOs such as SPP and MISO
along the Kansas and Missouri border. Here, price separation is due to inefficiencies that prevent the
economic transfer of energy between regions including insufficient transmission capacity.
Electricity Demand
Like last year, total electricity demand declined in every Commission-jurisdictional ISO. Although the effects
of the COVID-19 pandemic on electricity demand made 2020 unique, this year is consistent with a recent
trend of limited-to-no electricity demand growth due to, in part, more efficient energy use. However, as more
state and local governments have promoted additional electrification of transportation and heating in recent
years, 17 this trend of limited-to-no growth may eventually reverse.
Early in 2020, mild winter weather reduced electricity demand below the seasonal average across all
Commission-jurisdictional ISOs. Beginning in March, the spread of COVID-19 and measures to mitigate the
spread of the virus dissociated electricity demand from its historical relationship with temperature. In the late
summer, however, electricity demand was near the seasonal average as temperatures were above average and
the effects of the COVID-19 pandemic on demand attenuated slightly. Towards the end of the year, a
resurgence of COVID-19 cases reduced electricity demand again.
16
See Monitoring Analytics, L.L.C., Quarterly State of the Market Report for PJM: January through September, at 359
(November 12, 2020).
17
See e.g., Kristy Hartman and Laura Shields, State Policies Promoting Hybrid and Electric Vehicle, National
Conference of State Legislatures (Nov. 20, 2020), https://www.ncsl.org/research/energy/state-electric-
vehicle-incentives-state-chart.aspx.
9Fig. 10 Average Hourly Demand, 2016-2020 Two current developments in electricity demand are
likely to transform electricity markets in the coming
years. First, the growth of solar- and wind-based
resources that are variable reorients system planning
towards patterns in demand net of wind and solar
generation. In 2020, this development was most
clear during the summer heatwave in CAISO
discussed earlier, when supply challenges due to
several factors appeared during the rapid increase in
net demand at the end of the day. Second,
technological advances in Distributed Energy
Resources (DERs) can make electricity demand
more flexible. Using a remote signal, these
technologies can increase or decrease the electricity
consumed by some sources of demand, like a space
Source: Hitachi Powergrids Velocity Suite
heater. Several companies are exploring ways to
aggregate sources of electricity demand into a single “virtual power plant” that interfaces with the wholesale
market — as envisioned in Commission Order No. 2222 issued in September 2020 to promote participation
of DER aggregations in wholesale markets — in order to more easily balance demand with weather-based
fluctuations in electricity production as well as provide reliability services when requested. 18
Installed Capacity Changes
In 2020, the continental United States added over 41 Fig. 11 Capacity Additions and Retirements, 2020
gigawatts (GW) of new capacity — 60% higher than
the average capacity additions between 2015 and
2019. Capacity retirements, at nearly 14 GW, were
lower compared to the five-year average of 19 GW.
The largest shares of additions came from renewable
and natural gas resources, at 32 GW and 7.5 GW
respectively, while most of the retirements came
from coal resources at 9.6 GW. In the last decade,
total annual coal retirements peaked at 14.8 GW in
2015 and averaged 8 GW per year since 2010.
Within the Commission-jurisdictional ISOs, MISO
had the largest share of capacity additions including
5.9 GW of wind and 2.4 GW of natural gas
generation. PJM had the largest share of capacity Source: EIA Form 860M
retirements at 2.6 GW, mostly from coal generation.
Over the last year, NYISO was the only jurisdictional ISO to experience a net decrease in capacity with the
retirement in April 2020 of Indian Point Unit 2, a 1 GW nuclear unit. SPP added 5.4 GW of wind generation
18
Participation of Distributed Energy Resource Aggregations in Markets Operated by Regional Transmission Organizations
and Independent System Operators, Order No. 2222, 172 FERC ¶ 61,247 (2020).
10and CAISO added 1.9 GW of solar, 1.4 GW of natural gas, and 626 MW of battery storage capacity. Outside
of the Commission-jurisdictional ISOs, capacity increased by 16.6 GW and retirements accounted for 5.7
GW. The capacity additions primarily came from 8.3 GW of wind, 7 GW of solar, and 1.1 GW of natural gas
capacity. Coal generation accounts for most of the retirements within those regions at 5.2 GW.
The landscape of future battery storage projects is
Fig. 12 Battery Storage Capacity Additions
rapidly evolving as reflected in capacity additions in
2020. Installed and planned battery storage
projects have ramped up amid decreasing storage
costs, 19 state incentives and mandates, and
Commission Order No. 841 issued in 2018 to
promote energy storage participation in wholesale
electricity markets. 20 For battery storage, the
capacity additions almost quadrupled in 2020,
increasing from 152 MW in 2019 to 733 MW in
2020. The largest share of added capacity came
from CAISO (626 MW), where public policy goals
to achieve 100% emissions free energy by 2045
includes additional investments in battery storage.
Between October and November of 2020, for
example, battery storage capacity additions planned
Source: EIA Form 860M for the year 2023 nearly tripled according to the
EIA’s monthly inventory of electricity generators. Data from the November 2020 inventory (released in
January 2021) showed that CAISO plans to add over 3.6 GW, and ERCOT and NYISO each plan to add
over 1.2 GW of battery storage by 2023.
Installed net metering capacity growth in 2020 was similar to the prior years, with 14% annual growth (3.3
GW) concentrated in California, New Jersey, Massachusetts, New York, and Arizona. California accounts for
nearly 40% of total net metering capacity and photovoltaic DERS make up most of the installed technologies
at 94%. As of June 2020, 40 States and DC have adopted mandatory net metering rules. 21 Commission Order
No. 2222 issued in September 2020 is anticipated to increase participation of aggregated DERs in wholesale
markets similar to the way in which Commission Order No. 841 paved the way for energy storage.
19
In the United States, average utility-scale battery storage capacity costs have decreased over 70% since 2015.
See EIA, Utility-scale storage costs decreased nearly 70% between 2015 and 2018, (October 23, 2020),
https://www.eia.gov/todayinenergy/detail.php?id=45596
20
Electric Storage Participation in Markets Operated by Regional Transmission Organizations and Independent System
Operators, Order No. 841, 162 FERC ¶ 61,127 (2018).
21
DSIRE, Net Metering (June 2020), http://ncsolarcen-prod.s3.amazonaws.com/wp-
content/uploads/2020/06/DSIRE_Net_Metering_June2020.pdf
11Operating Capacity and Generation Fuel Mix
The capacity additions and retirements summarized Fig. 13 Nameplate Capacity Fuel Mix
in the prior section changed the proportion of
capacity available for different fuel-types in each
region. Data from the EIA shows the share of
operating capacity available by primary fuel type at
the end of 2019 and 2020 in Commission-
jurisdictional ISO balancing authorities in Figure 13.
Coal and nuclear power plant retirements had a
noticeable effect on those resources’ operating
capacity share in most ISOs. Wind and solar
operating capacity shares increased in all ISOs;
notably the increase of wind operating capacity’s
share increased in SPP and MISO and solar
operating capacity’s share increased in CAISO.
According to hourly data from U.S. balancing Source: EIA-860M
authorities, collected by the EIA, natural gas Fig. 14 Net Generation Fuel Mix
accounted for 39% of electricity net generation 22 in
continental U.S. balancing authorities during 2020 -
an increase from 36% the prior year. In contrast,
coal power plants generated a smaller share in 2020,
down from 24% in 2019 to 20% in 2020. Nuclear
power plant, accounting for 21% of U.S. electricity
in 2019 and 2020, accounted for an equal share in
both years as nuclear capacity retirements were
offset by COVID-19 pandemic-related reductions in
electricity demand. Solar and wind-based resources
generated a greater share of electricity in 2020 than
the year prior; collectively their share of electricity
generation increased from 9% in 2019 to 11% in
2020. Source: EIA-930 and CAISO
Every Commission-jurisdictional ISO except for CAISO experienced a reduction in the share of electricity
generated from both coal plants and nuclear power plants combined. Although capacity retirements
contributed to the decrease of nuclear and coal generation, so too did lower natural gas prices, lower electricity
prices, and COVID-19 pandemic-related challenges in refueling and performing maintenance on power
plants. In PJM, NYISO, and ISO-NE, natural gas made up the difference in nuclear and coal generation from
2019 to 2020. In SPP and MISO, the reduction in coal generation was met in part with an increase of electricity
generated by wind-based resources. Hydropower resources generated noticeably less electricity in CAISO
22
Electricity net generation is the quantity of gross electricity generation a generator produces minus the
electricity used to operate the power plant.
12during 2020 relative to the prior year because less than average snowpack accumulated in the CAISO region
during the 2019-2020 winter. 23
Capacity Markets
A capacity market is a mechanism to procure sufficient resources to meet future energy demand and to
maintain the reliability of the power grid. These markets supplement the energy and ancillary services markets
by providing economic signals that facilitate resource entry, exit, and investment decisions. The proportion
of capacity costs to total costs to serve electricity varies between markets. PJM’s Market Monitor estimated
that capacity payments made up 21.3% of wholesale electricity costs between January and September of 2020,
while ISO-NE estimated capacity made up 41% of wholesale electricity costs for Summer 2020. 24
ISO-New England’s Forward Capacity Auction (FCA), which occurred in February 2020, for the 2023-2024
capacity commitment period had the lowest price in the market’s history. ISO-wide capacity prices cleared at
a weighted average of $2.00 per kilowatt-month (kW-month), which was a decline of 47% from the prior year.
More than 600 MW of new generation received capacity commitments, including 317 MW of capacity with
the new renewable technology resource designation. This renewable technology resource designation allows
a renewable resource to participate in the auction without being subject to the Minimum Offer-Price Rule.
Weighted average capacity prices for Rest of State in NYISO rose 64% from 2019 price levels to $1.40/kW-
month on average. Prices in New York City, which is the ISO’s highest cost zone, experienced a similar price
increase of 52% over the 2019 level to $12.05/kW-month. By comparison, prices in the Lower Hudson Valley
declined by 53%, and prices in Long Island declined by 9%. These price changes were partially the result of
changes in NYISO’s Locational Minimum Installed Capacity Requirements (LCRs), as well as changes in
natural gas prices and installed capacity retirements, including the retirement of the Indian Point Unit 2 at the
end of April.
Historically, MISO’s Planning Resource Auction (PRA) clears at prices much lower than the other ISO
capacity markets. In 2020, most zones in MISO cleared at $0.15/kW-month for the 2020-2021 capacity
commitment period — $0.05 higher than the prior auction. However, Zone 7, representing the Lower
Peninsula of Michigan, showed major price separation, clearing at $7.83/kW-Month. This separation
occurred due to a 123 MW capacity shortfall, 0.53% below the reserve requirement, in Zone 7. This shortfall
marked the first time a zone was short since the inception of the PRA. Contributing to this shortfall were
new, more stringent requirements for participation in the PRA that disqualified units on extended outage
during the Planning Year.
23
EIA-930 data were supplemented with data on hydropower electricity generation from CAISO.
24
Monitoring Analytics, L.L.C., Quarterly State of the Market Report for PJM: January through September, at 14
(November 12, 2020). ISO New England’s Internal Market Monitor, Summer 2020 Quarterly Markets Report¸
at 17 (November 11, 2020).
13PJM did not conduct an auction during 2020 but has scheduled for May of 2021 the next capacity auction
covering the 2022/2023 Delivery Year. PJM plans to hold subsequent auctions in PJM on an accelerated
basis – every six months – through 2024. 25
Transmission
Over 800 line-related transmission projects within Fig. 15 Transmission Projects With 2020 in Service
Commission-jurisdictional transmission planning Dates Within Order No. 1000 Planning Regions
regions were scheduled to go into service in 2020
according to data from The C Three Group, L.L.C.
Most new projects were in MISO and PJM. For
these two regions, the reported cost of all line-
related transmission projects for which data are
available was $2.4 and $3.6 billion, respectively.
Across all regions, reliability, aging infrastructure,
load growth, and new generation were the primary
drivers of most new line-related transmission
projects. Overall, there were twice as many
reliability projects as the second most common
project type. The same data show, in 2020,
economics was the primary driver of seven projects
and public policy was the primary driver of one
project. Source: North American Electric Transmission Project
Database, The C Three Group, L.L.C.
Of all line-related transmission projects scheduled to
go into service during 2020, four were selected as part of a competitive bidding process required by Order
No. 1000, which was issued in 2011 to reform transmission planning and cost allocation. 26 In 2020, four
transmission planning regions – PJM, NYISO, SPP, and ISO-NE – awarded to developers or requested
proposals for new transmission projects as part of a competitive bidding process compliant with Order No.
1000. Data from The C Three Group, L.L.C. reports that only one line-related transmission project scheduled
to go into service in 2020 was completed by a merchant transmission developer: the Harry Allen - Eldorado
Desert Link in WestConnect completed by LS Power.
Two noteworthy interregional developments occurred in 2020. First, in June, MISO’s board approved an
interregional project previously approved by PJM near the Indiana-Michigan border along Lake Michigan.
Second, in September, MISO and SPP announced a Joint Targeted Interconnection Queue Study to find
comprehensive, cost-effective projects along the seam between Nebraska and Kansas in MISO and Iowa and
Missouri in SPP. This study comes after four prior efforts were unable to find projects both regions were
willing to pursue. Otherwise, WestConnect, NorthernGrid, and CAISO continued to collectively evaluate
25
See PJM Reestablishes Capacity Auction Schedule at: https://insidelines.pjm.com/pjm-reestablishes-
capacity-auction-schedule/
26
Transmission Planning and Cost Allocation by Transmission Owning and Operating Public Utilities, Order No. 1000,
136 FERC ¶ 61,051 (2011).
14interregional projects in 2020, like they have since 2015, through their annual Interregional Transmission
Project planning process.
Natural Gas
Natural Gas Prices
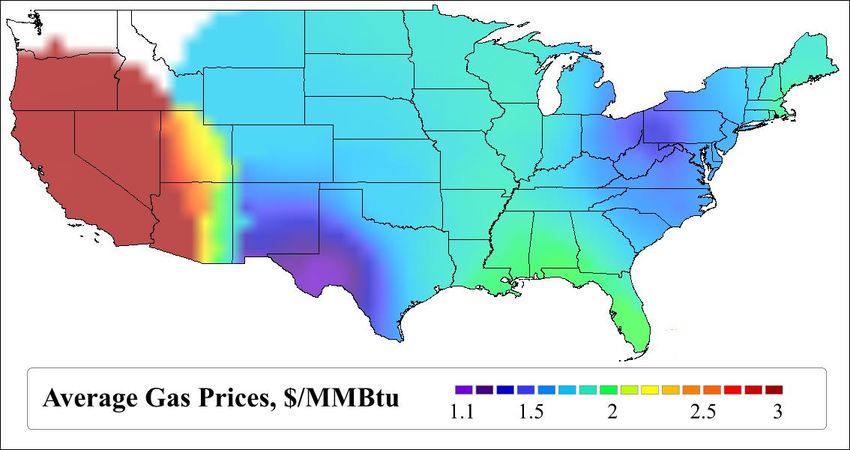
In 2020, the Henry Hub national benchmark Fig. 16 Average 2020 Platts Gas Daily Index Prices at
spot price averaged $1.99 per million British Major Hubs
thermal units (MMBtu), down from
$2.51/MMBtu in 2019, and all major natural gas
trading hubs experienced lower average prices
in 2020 in comparison to the five-year average
for the period 2015-2019. The year began with
relatively low natural gas prices across the U.S.
as a result of reduced demand for space heating
due to mild winter weather. Mitigation efforts
related to the COVID-19 pandemic reduced
natural gas consumption, which resulted in a
general downward pressure on prices through
the first half of the year. A price recovery began Note: Region coloring is based on average prices at the nearest
in the second half of the year with increasing Staff-selected major natural gas hubs and may not exactly
LNG exports and anticipated winter demand, represent local delivered prices.
but price increases were muted due to the Source: S&P Global Platts; Hitachi Powergrids Velocity Suite
resilience of domestic production, with the Henry Hub price averaging $2.21/MMBtu for the last six months
of the year. Some regional hubs did separate from the Henry Hub benchmark at higher prices.
Generally, prices at regional hubs followed the same trends in 2020 as Henry Hub prices which declined
approximately 20% from 2019 but strengthened by year end. However, the Waha hub located in the Permian
Basin, the SoCal City-Gate hub near Los Angeles, and the Algonquin City-Gates hub in New England were
Fig. 17 Trends in Select Platts Gas Daily Index more volatile in the second half of the year as seen
Prices in 2020 in Figure 17. SoCal City-Gate prices recovered
substantially in the second half of 2020, from an
average of $1.80/MMBtu in the second quarter of
2020 to average $4.07/MMBtu in the fourth quarter
of 2020. Average prices declined significantly year-
over-year at the Algonquin City-Gates hub, down
37% to $2.00/MMBtu, and the SoCal City-Gate,
down 26% to $3.01/MMBtu.
Prices at the Waha hub, which is associated with the
Permian Basin production region increased from an
average of $0.83/MMBtu in 2019 to $1.11/MMBtu
in 2020, due to the partial relief of a prior constraint
on takeaway capacity, capacity which allows the
transportation of local production to downstream
Source: S&P Global Platts markets. With increasing natural gas production
15levels in the Permian Basin, prices at the local Waha hub remained depressed into spring 2020. Platts Gas
Daily next-day gas indices at the Waha hub averaged $0.50/MMBtu from January through March, a -
$1.37/MMBtu basis to Henry Hub. However, the basis difference between the Waha hub and Henry Hub
tightened after oil prices collapsed in April and averaged $0.26/MMBtu from May through July. Permian
Basin natural gas production increased in the fall to average an all-time high of 12 Bcfd in October, causing
Waha prices to again decrease and separate from Henry Hub prices. Next-day index prices at the Waha hub
were negative for 10 days over October 2020 and the basis to Henry Hub decreased to as low as -
$3.72/MMBtu on October 24 due to limited takeaway capacity. But this capacity began to increase in late
October when the Permian Highway Pipeline started limited service, alleviating natural gas pipeline constraints
and supporting Waha index prices to average $2.28/MMBtu in November and December. The 2.1 Bcfd
Permian Highway Project officially entered commercial service on January 1, 2021 and is expected to provide
an outlet for continued Permian Basin natural gas production growth moving forward. This pipeline will
allow rising Permian Basin production to seek outlets at Gulf Coast markets.
Natural Gas Production
U.S. natural gas production averaged 91.3 Bcfd in 2020, Fig. 18 U.S. Dry Natural Gas Production
a 1.7 Bcfd or 2% reduction from 2019. 27 The year-
over-year decrease reverses the trend of increasing
natural gas production in the shale era, after record
increases in production of 9.4 Bcfd in 2018 and 8.8 Bcfd
in 2019. These record increases were driven by
production from shale formations, such as the
Marcellus and within the Permian Basin, which offset
production declines from conventional reservoirs. The
decline in natural gas production in 2020 was largely
driven by producers facing mounting debt that was
aggravated by lower crude oil prices and the economic
impacts of the COVID-19 pandemic. Crude oil and
natural gas drilling rigs decreased as much as 68% in
2020, from an average of 790 rigs in February to an
average of 250 rigs in August. The rig count began to Source: Energy Information Administration
recover throughout the last quarter of 2020, and
averaged approximately 340 rigs in December 2020, a 36% increase from their lowest point. The most
pronounced decrease in natural gas production was seen in conventional wells, as production fell by 2.7 Bcfd,
roughly 12%, year-over-year. Some shale plays, such as the Marcellus, Permian, and Haynesville plays, saw
modest increases in production in 2020, but these were much smaller increases as compared to previous years’
growth.
The Permian Basin experienced the largest annual increase among all unconventional resource plays,
increasing 13%, or 1.3 Bcfd, year-over-year to an average of 11.5 Bcfd. However, this is half the 2.8 Bcfd
year-over-year increase the Permian Basin experienced in 2019. Producers in the Permian Basin often drill
for crude oil that has considerable associated natural gas yields. Despite Permian Basin crude oil production
27
These numbers include forecasted December 2020 data.
16declining by 13% over the year as oil prices fell, Permian Basin natural gas production continued to show the
most growth of all U.S. basins. Some of this was due to producers devoting rigs to older wells with higher
natural gas-to-oil ratios than newer wells. In addition, producers that were drilling new wells for crude oil
found ways to optimize associated natural gas production by targeting the right locations and adjusting drilling
and completion methods.
Natural gas production in the Marcellus shale increased by a modest 1.3 Bcfd, or 5.8%, year-over-year while
the Utica shale, also in the Appalachian region, fell by 0.3 Bcfd, a 4% decrease. Production from the
Haynesville shale in northwest Louisiana and east Texas grew by 0.3 Bcfd in 2020, a 3% increase. This is a
major trend reversal from 2019 when the Haynesville shale saw production increase by 1.94 Bcfd, or 28%,
year-over-year, to average 8.8 Bcfd. Production from other, smaller U.S. shale plays fell by 1.7 Bcfd, or 8%,
in 2020 after increasing by 1.4 Bcfd year-over-year in 2019.
International Trade and LNG
The United States averaged 7.5 Bcfd of net natural Fig. 19 Natural Gas Imports and Exports
gas exports in 2020, a 43% increase from 5.2 Bcfd of
net exports in 2019. 28 The U.S. first became a net
exporter of natural gas in 2017, and its net export
balance continued to grow through 2020. LNG
exports were the largest contributor to both the U.S.
net natural gas export balance and net natural gas
export growth, increasing 1.6 Bcfd, or 32%, from 5.0
Bcfd in 2019 to average 6.6 Bcfd in 2020. The
increase in LNG exports was driven by increased
LNG export capacity, which grew from 8.9 Bcfd in
January 2020 to 10.5 Bcfd by December 2020 with
additions at the Elba Island LNG terminal in
Georgia, Cameron LNG terminal in Louisiana, and
Freeport LNG terminal in Texas. Despite the
average annual increase in LNG exports, U.S. LNG Source: Energy Information Administration
export volumes varied significantly over 2020 for the
first time since the U.S. began large-volume LNG exports in 2016. LNG exports averaged 8.1 Bcfd in January
2020 before decreasing over the summer to as low as 3.1 Bcfd in July. Demand increased again in the fall and
into winter as December 2020 saw new highs in both average monthly LNG exports of 10.3 Bcfd and daily
feedgas deliveries of 11.6 Bcf on December 13, as reported by S&P Global Platts. Much of the seasonal
variability in 2020 was due to the effects of the COVID-19 pandemic and low international LNG prices, in
addition to periodic disruptions due to Gulf Coast hurricanes. Prompt month prices in Asia, as measured by
the S&P Global Platts’s Japan/Korea Marker, decreased to as low as $1.83/MMBtu on April 28, 2020,
resulting in uneconomic export conditions at times over the summer. In response, U.S. LNG exporters
28
These numbers include forecasted December 2020 data.
17canceled roughly 130 cargos between April and August, 29 decreasing LNG facility utilization to 48% over the
same period. LNG terminal utilization rates hit their lowest point in August when utilization averaged less
than 33% over the month. The low summer utilization was a significant shift for the U.S. LNG export market
which had an average utilization rate of 93% in 2019. Tight market conditions in Asia and Europe led to the
year-end increase in exports. Colder than usual weather at major international LNG destinations and
unplanned outages at LNG export facilities in Australia, Malaysia, Qatar, Norway, Nigeria, and Trinidad and
Tobago in the second half of 2020 helped to raise global LNG prices and incentivize increased U.S. LNG
exports.
In total, the U.S. exported LNG to 37 different countries through in 2020 for a combined volume of 2.4
trillion cubic feet (Tcf). South Korea was the largest volumetric recipient of U.S. LNG cargoes, taking in a
total volume of 316.2 Bcf. Japan, China, Spain, and the United Kingdom were also leading destinations,
collectively taking in 49% of all U.S. LNG export volumes. Notably, China became the third largest LNG
export destination for U.S. cargos in 2020, with a total of 214.4 Bcf, due to easing trade tensions after only
taking in 6.9 Bcf in 2019.
Cross pipeline exports of natural gas grew as well in 2020, driven by a 0.3 Bcfd increase in exports to Mexico.
Natural gas pipeline exports heading to Mexico averaged 5.4 Bcfd while pipeline exports to Canada decreased
by 0.2 Bcfd to average 2.4 Bcfd in 2020. Canadian natural gas exports are generally regional transfers in the
Midwest and Northeast that often net larger imports into the U.S. from Canada. The U.S. had a net import
balance of 4.3 Bcfd with Canada through November 2020, which is down from 4.8 Bcfd in 2019 over the
same time period.
Despite the growth in natural gas exports, imports remain a vital part of the U.S. supply mix, especially during
winter. Imports from Canada make up most of the natural gas coming into the U.S., contributing 6.8 Bcfd
of the 6.9 Bcfd of total average daily pipeline imports in 2020. Pipeline imports decreased 7%, or 0.5 Bcfd,
in 2020 compared to 2019. LNG also plays a meaningful role in supplying New England during winter
months, though LNG import volumes into the U.S. only averaged 0.15 Bcfd. Because constrained pipelines
may be unable to fully meet market demand on peak winter days, New England accesses additional supply
from the Everett LNG import terminal near Boston, as well as the offshore Northeast Gateway and from the
Canaport terminal in eastern Canada.
29
S&P Global Platts, August Cargo Cancellations at US LNG Terminals Push Summer Total Over 100 (June 22,
2020), https://www.spglobal.com/platts/en/market-insights/latest-news/natural-gas/062220-august-cargo-
cancellations-at-us-lng-terminals-push-summer-total-over-100#article0
18Natural Gas Demand
Fig. 20 Annual Natural Gas Demand by Sector Total natural gas demand in the United States in
2020 averaged 90.8 Bcfd, which is less than 1%
higher than 2019 total demand. 30 However, total
domestic natural gas consumption, which excludes
net exports, declined 2% from the prior year,
averaging 83.3 Bcfd. This is only the second time
since 2009 that domestic consumption has fallen
year-over-year. A decline in Residential and
Commercial natural gas demand comprised most of
this total decline in domestic consumption, as it fell
2.1 Bcfd or 9%. The mild winter of 2019-2020 and
falling commercial demand due to the COVID-19
pandemic are the two primary causes of this decline.
Supported by economic growth and lower natural
gas prices, natural gas demand by industrial
Source: Energy Information Administration customers grew 25% over the last decade, from 18.7
Bcfd in 2010 to 23 Bcfd in 2019. However, in 2020
COVID-19 pandemic-related economic disruptions depressed deliveries to industrial consumers, and demand
fell to 22.6 Bcfd, which is 2% lower than in 2019. This is the first year-over-year decline in industrial demand
since 2015 and only the second since 2009. Natural gas consumption declined from the refining, ethanol, and
primary metals sectors, three of the largest industrial consumers of natural gas.
Offsetting part of those declines was a 3%, or 0.9 Fig. 21 Monthly Natural Gas Power Burn
Bcfd, increase in natural gas demand for electrical
generation, which rose to an average of 31.8 Bcfd.
Natural gas demand for electrical generation, also
known as power burn, varies considerably
throughout the year and usually peaks in the summer
as electrical demand increases. Low-cost natural gas
supplies have supported substantial growth in power
burn over the past decade, and 2019 had the highest
natural gas power burn on record. It is notable that
2020 built even further on that natural gas power
burn record high, despite the COVID-19 pandemic
decreasing overall electricity demand. Low natural
gas prices for much of the year supported continued
demand for natural gas-fired generation, which at
times displaced higher cost energy sources. Source: Energy Information Administration
30
These numbers include forecasted December 2020 data.
19You can also read