VICTORIAN MARKET READINESS TO SUPPORT THE EARLY RETIREMENT OF YALLOURN POWER STATION
←
→
Page content transcription
If your browser does not render page correctly, please read the page content below
VICTORIAN MARKET READINESS
       TO SUPPORT THE EARLY
    RETIREMENT OF YALLOURN
             POWER STATION
           FOR ENVIRONMENT VICTORIA
                     DECEMBER 2019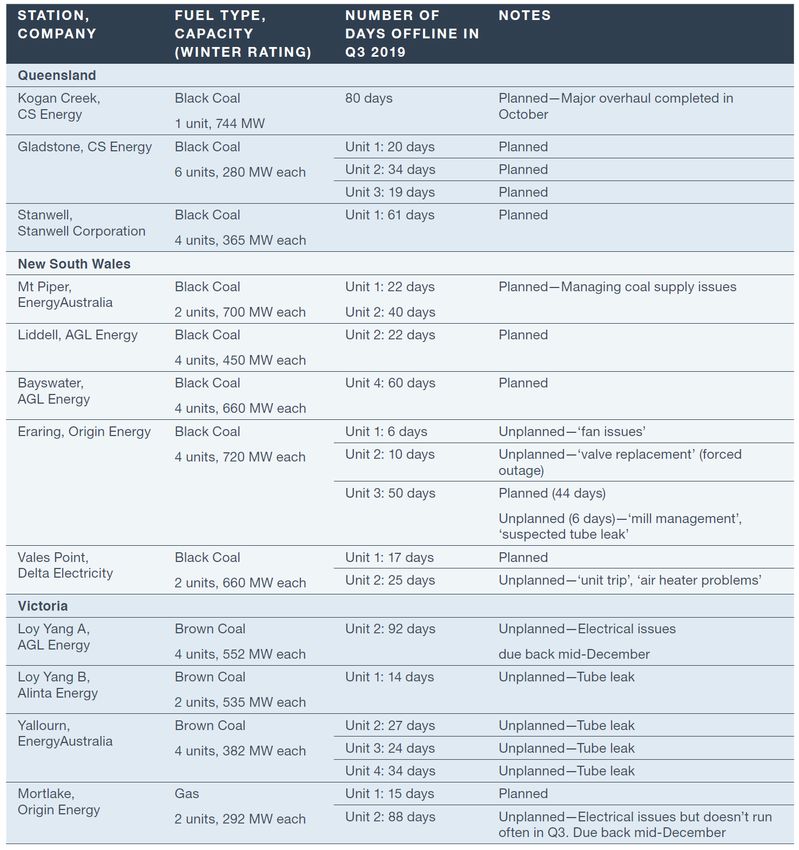
Victorian market readiness to support the early retirement of Yallourn
power station

 Document:                     Final Report
 Pages:                        34
 Date:                         12 December 2019
 Client name:                  Environment Victoria
 Team:                         Electricity advisory
 Sector head:                  Bret Harper, Director of Energy and Carbon Markets
 Revisions:                    Added clarifying charts and text to Section 5.2 Change in Installed Capacity in
                               Victoria.

ABOUT REPUTEX
Established in 1999, RepuTex is a leading provider of advanced modelling services for the Australian electricity,
renewable energy and emissions markets. Our forecasts and analysis have been at the forefront of energy and
climate thinking for over two decades, with a strong history of providing trusted, data-driven analysis for public
and private sector customers in Australia and Asia.

We have worked with over 150 customers across Australia and Asia-Pacific – including government
policymakers, regulators, large energy users and large emitters, project developers and investors.

RepuTex has offices in Melbourne and Hong Kong, with a team of analysts with backgrounds in energy
commodities, policy, meteorology and advanced mathematics. The company is a winner of the China Light and
Power-Australia China Business Award for energy and climate research across Asia-Pacific.

To learn more, please visit www.reputex.com

REPUTEX ENERGY | Victorian market readiness to support the early retirement of Yallourn power station            2
CONTENTS
1. EXECUTIVE SUMMARY ......................................................................................................................... 4
2. BACKGROUND ....................................................................................................................................... 5
3. ABOUT THIS ENGAGEMENT ................................................................................................................ 6
3.1 Scope of Analysis ........................................................................................................................... 6
3.2 Modelling Approach and Key Assumptions .................................................................................... 6
4. REFERENCE CASE................................................................................................................................ 8
4.1 Change in installed capacity in Victoria .......................................................................................... 8
4.2 Energy generation and fuel mix ...................................................................................................... 9
4.3 Energy reliability to meet maximum demand ................................................................................ 10
4.4 Wholesale price implications ........................................................................................................ 12
5. Alternative Scenario: Preparing for the early closure of Yallourn ......................................................... 13
5.1 Additional measures to support energy security ........................................................................... 13
5.2 Change in installed capacity in Victoria ........................................................................................ 15
5.3 Energy generation and fuel mix .................................................................................................... 18
5.4 Energy reliability to meet maximum demand ................................................................................ 19
5.5 Wholesale price implications ........................................................................................................ 20
6. JOBS AND INVESTMENT .................................................................................................................... 22
7. OTHER POLICY OPTIONS .................................................................................................................. 24
8. APPENDIX A - OTHER ASSUMPTIONS .............................................................................................. 25
8.1 Electricity Generation .................................................................................................................... 25
8.2 Other Supply Side Inputs .............................................................................................................. 26
9. APPENDIX B - OUR MODELLING APPROACH .................................................................................. 28
9.1 Our electricity market simulation model ........................................................................................ 28
10. APPENDIX C .................................................................................................................................... 30
10.1 Generator outages ........................................................................................................................ 30
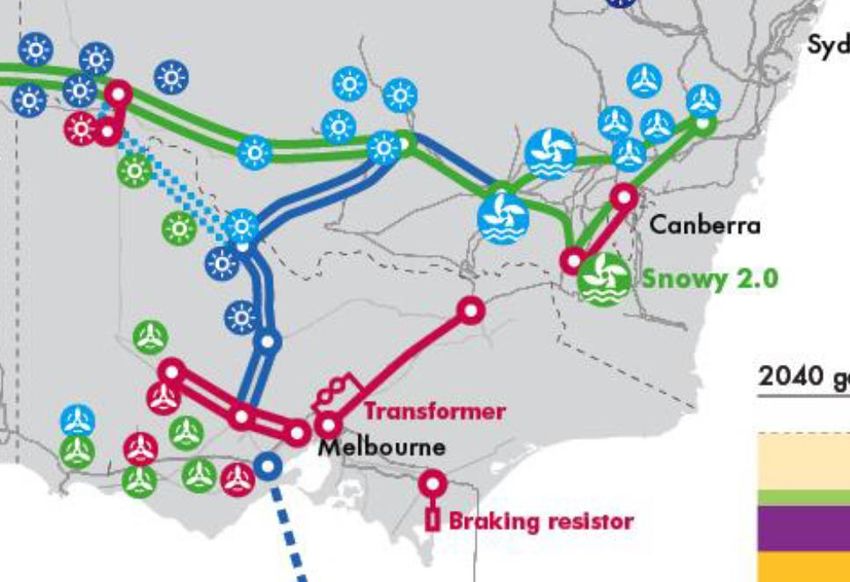
10.2 Map of integrated development plan ............................................................................................ 31
11. APPENDIX D .................................................................................................................................... 32
11.1 List of Indicative New Developments in Victoria ........................................................................... 32
12. CONTACTS ...................................................................................................................................... 34
REPUTEX ENERGY | Victorian market readiness to support the early retirement of Yallourn power station 3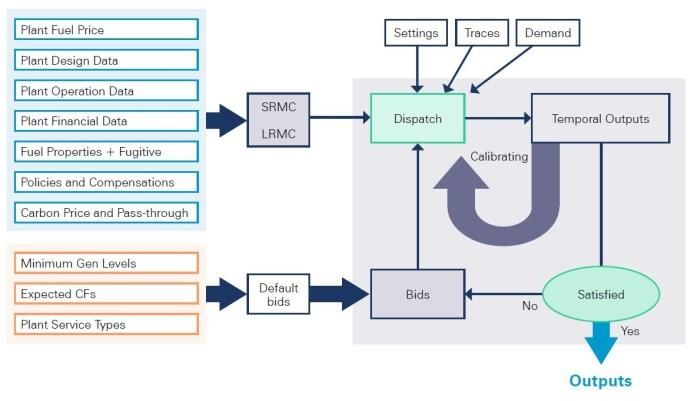
1. EXECUTIVE SUMMARY
     •    RepuTex has been engaged by Environment Victoria to analyse the readiness of the Victorian
          energy system to support the potential early retirement of the Yallourn power station.

     •    Analysis models a Reference Case forecast, which considers Victorian energy reliability and
          wholesale electricity prices in line with the scheduled closure of Yallourn from 2029-32; along with
          an Alternative Case, which models preparing for the ‘earliest possible’ retirement of Yallourn in
          2023, in line with a three-year notice of closure period.

     •    The Alternative Case considers the installation of new capacity that could be built within this three
          year lead-time to prepare for any early retirement of the Yallourn power station, or other sudden
          unavailability of Victorian brown coal units. Although there are many possible combinations of
          capacity additions, this analysis models a reasonable number of additions that are already
          currently in planning or being considered, such as the KerangLink interconnector development, the
          extension of large- and small-scale renewable energy capacity, and new energy storage
          investment.

     •    Findings indicate that under the Reference Case forecast, Victoria is modelled to have a tight
          reserve condition in 2019-20 and is expected to be reliant on import capacity during future ‘one-in-
          two year’ maximum demand events. During a more severe ‘one-in-10 year’ event, Victoria could
          need all brown coal units available to ensure system reliability (with an average of two brown coal
          units modelled to normally be unavailable under such events).

     •    Under the Alternative Case scenario, a combination of large- and small-scale renewable energy
          (an additional 2.6 and 0.3 GW, respectively), along with ‘big battery’ storage (0.6 GW), small
          ‘virtual power plants’ storage (0.5 GW), and other demand-side participation (0.2 GW), can provide
          the available resources necessary to compensate for the absence of Yallourn by the summer of
          2023-24.

     •    This includes both enough annual energy to mitigate wholesale prices rises and maintain regional
          power reliability though heatwaves and other extreme events to prevent ‘blackouts’. Additionally,
          this scale-up of controllable Victorian energy resources is likely to reduce reliance on other states
          to provide power during extreme events.

     •    Under this scenario, modelling indicates that with effective planning the Victorian market can
          compensate for the closure of Yallourn as early as April 2023. Even if Yallourn continues to
          operate beyond this date, these new measures (large- and small- scale renewable energy
          capacity, energy storage and interconnector upgrades) would position Victoria to mitigate future
          capacity failures as existing facilities age.

     •    Building additional electricity generation capacity and storage solutions under the Alternative Case
          is modelled to create 27,000 job-years and bring $6.8 billion in additional state economic activity.

     •    In addition, the early retirement of Yallourn is modelled to reduce Victoria’s electricity sector
          emissions to 60 per cent below 2005 levels, abating approximately 85 million tonnes of carbon
          dioxide between 2023 and 2033 relative to the Reference Case forecast within Victoria.

     •    Investment in replacement electricity supply under the Alternative Case scenario is modelled to
          reduce wholesale power prices compared to the Reference Case forecast. Medium-term wholesale
          electricity prices are modelled to decline from over $100 per MWh in 2018-19, toward $70 per
          MWh by 2022, underpinned by a lower dependence on gas generation, the accelerated installation
          of small-scale rooftop solar PV and distributed energy storage, along with the continued uptake of
          large-scale renewable energy projects over the next three years.

REPUTEX ENERGY | Victorian market readiness to support the early retirement of Yallourn power station         4
2. BACKGROUND
Following the retirement of the Hazelwood power station in 2017, the 1,480 MW Yallourn power station has
become Victoria’s oldest operating coal-fired power station, currently supplying around 20 per cent of the
state's electricity needs. Yallourn has announced a schedule to progressively phase out its four generation
units from 2029, in a staged four-year shutdown that will conclude by 2032.
Assumptions within the Australian Energy Market Operator’s (AEMO’s) ‘central’ scenario suggest that
Yallourn could continue to be profitable through 2032, underpinned by the asset’s low fuel cost structure
and position within the dispatch merit order. While ‘baseload’ generators are expected to come under
increasing competition from low-cost renewable energy supply, and more flexible capacity, Yallourn is not
modelled to be an economically driven closure in the National Electricity Market (NEM).
In 2015, AGL announced the closure of its Liddell coal-fired power station (now scheduled for the
beginning of April 2023), while Queensland’s 700 MW Callide B coal-fired power station has announced a
closure in 2028, ten years ahead of its previously planned closure in 2038-39. Despite competitive
headwinds for the remaining coal-fired generators, the announced retirement of these assets is expected
to improve the profitability of remaining coal plants in the system, with the potential for further closures of
coal-fired generators to potentially extend the economic life of Yallourn. However, short-term economic
benefits are expected to be offset by operating challenges for coal-fired generators, such as:
• the decreasing reliability of aging generation during hotter weather and the timing, extent and cost
of major refurbishments;
• the costs of coal unit ramping (following variable resources) as renewable energy penetration
increases;
• the high emissions intensity of coal-fired generation and uncertainty regarding state and federal
decarbonisation policy;
• commodity price volatility and supply uncertainty; and
• potential cuts in energy consumption, especially decreases in operational demand.
In light of these headwinds, EnergyAustralia has suggested that ‘substantial changes’ to the energy market
could lead it to close Yallourn earlier than anticipated, noting that, "our plans are to run the plant to 2032 or
for as long as policy and regulations permit, and there’s not a substantial change in the market." 1 As a
result, the early retirement of Yallourn remains a live issue for Victorian electricity market participants,
planners and policymakers, suggesting that measures should be taken to prepare the local market for the
potential retirement of the aging coal-fired generation fleet.
1 The Age, Yallourn coal-fired power plant due to shut down from 2029, June 25.
REPUTEX ENERGY | Victorian market readiness to support the early retirement of Yallourn power station 53. ABOUT THIS ENGAGEMENT
3.1 Scope of Analysis
RepuTex has been engaged by Environment Victoria to analyse the potential impact of the early retirement
of the Yallourn power station on the regional energy system. Specifically, analysis seeks to understand the
readiness of the Victorian system to support the retirement of output from Yallourn under a modelled
reference case and possible ‘early’ retirement scenario, for the purposes of understanding the availability
of alternative sources of power supply and potential wholesale price impacts.
To understand the market impact of an early retirement of Yallourn power station on large-scale generation
mix and wholesale electricity prices in Victoria, analysis considers the following cases:
1. A Reference Case: Analysis of market shape and wholesale electricity prices assuming the
phased closure of Yallourn over 2029-32, in line with scheduled timelines.
2. Alternative Case: Analysis of market shape and wholesale electricity prices assuming the
‘earliest’ retirement of the Yallourn power station in 2023 (in line with a three-year notice period)
and the implementation of policy measures within this lead time.
Scenarios are intended to inform how the Victorian market could prepare for any early retirement of the
Yallourn power station, or sudden unavailability of Victorian brown coal units, and the options available to
policymakers on a short lead time of three years. Analysed outputs within this report include:
• What new capacity (or demand reduction) could replace the output from the Yallourn power
station based on a plausible and cost-optimised combination of large-scale renewables, rooftop
solar, energy storage, demand response and energy efficiency within the modelled timeline; and
• What are the resulting impacts on energy prices of the early retirement of the Yallourn power
station and the implementation of measures within this lead time.
3.2 Modelling Approach and Key Assumptions
In delivering this project, we utilise our proprietary National Electricity Market Renewable Energy Simulator
(NEMRES), which calculates annual generation and transmission expansion decisions in each region of
the NEM as well as intra-hourly dispatch modelling to imitate the Australian Electricity Market Operator’s
(AEMO’s) dispatch engine. For more information, refer to Appendix B.
A common set of assumptions is applied in each modelled case, adapted from Australian Energy Market
Operator’s (AEMO’s) Integrated System Plan 2019-20.2 These common assumptions include:
• Average fuel prices (real 2019 dollars). On average, Biomass: $0.53 per Gigajoule (/GJ); Brown
Coal: $0.64/GJ; NEM Gas: $10.75/GJ.
• Capacity additions and closures: Announced retirements are assumed to occur (e.g. last 3 units
of Liddell in April 2023). Economically optimised capacity additions and closures are proposed by
our electricity model based on annual dispatched generation. These proposals are cross-checked
by analysts to find indicative units based on capacities that best meet retirement volume criteria
and RepuTex’s view on the relative economics and forecast profitability of each unit. Many
combinations of technology-type closure patterns could meet these requirements; therefore any
named facility retirements should be treated as indicative only.
• Snowy 2.0: The government’s proposed 2.2 GW Snowy 2.0 pumped hydro project is assumed to
be committed and fully commissioned by March 2025.
2Available at https://www.aemo.com.au/-/media/Files/Electricity/NEM/Planning_and_Forecasting/Inputs-Assumptions-
Methodologies/2019/2019-Input-and-Assumptions-workbook-Sept-19.xlsx
REPUTEX ENERGY | Victorian market readiness to support the early retirement of Yallourn power station 6• Renewable Policy Targets: The Large-scale Renewable Energy Target (LRET) of 33 TWh to
2030 is assumed in continue without changes. New entry renewable capacity required to meet a
target of 40 per cent renewable energy generation as a percentage of total Victorian generation by
2025 and 50 per cent renewable energy generation as a percentage of total Victorian generation
by 2030 targets are met, including a contribution for distributed energy resources.
• Reliability: In our capacity outlook model, each region must have a minimum level of firm capacity
available. Firm capacity is able to be shared across interconnected regions based on
interconnector capabilities and typical coincident available capacities in neighbouring regions.
• Technology costs: Based estimates derived from AEMO’s ISP large-scale renewable build cost
trajectory for CSIRO 4- and 2-degree outlooks from GenCost 2018.3
• Behind the meter (BTM) technologies: Demand Side Participation (DSP), Rooftop PV, PV non-
schedule generation (PVNSG), electric vehicles, distributed (embedded) energy storage, and
aggregated energy storage assumptions correspond to AEMO’s Central and Step Change ISP
scenarios.
• Network assumptions: New network developments are assumed to be undertaken to address
network strength as new capacity comes online, such as augmentation of the western Victoria grid.
This occurs in a staggered way, with actions implemented in stages to match AEMO’s ISP, e.g.
EnergyConnect interconnector between New South Wales (NSW) and South Australia (SA).
Assumptions for energy curtailment and Marginal Loss Factors (MLFs) are estimated and adjusted
to reflect these actions, with short-term bottlenecks and losses assumed to be temporary,
prompting augmentations within the forecast period to 2033.
Please refer to Appendices for further details on our modelling approach and policy settings.
3 Available at https://publications.csiro.au/rpr/download?pid=csiro:EP189502&dsid=DS1
REPUTEX ENERGY | Victorian market readiness to support the early retirement of Yallourn power station 74. REFERENCE CASE
4.1 Change in Installed Capacity in Victoria
Analysis under our Reference Case models around 3.4 GW of new large and small-scale renewable
energy capacity being added to the Victorian system over the next two years, with the current build rate
driven by the high electricity price environment, a rush of developers seeking to access limited
transmission infrastructure, attractive long-term power purchase agreements (PPAs), rapidly falling solar
and energy storage costs, and Commonwealth and state renewable energy targets.
Due to growing delays between initial construction and the full commissioning of Australian renewable
energy projects, modelling indicates around 1 GW of new large-scale renewable capacity entering the
market in 2019-20, with a further 2.4 GW of new capacity in 2020-21, and 1.3 GW in 2021-22. These
delays are largely underpinned by approvals for electrical connection, set against shortening construction
timelines as Australia builds construction experience in utility-scale solar and wind projects.
After 2022, project development is forecast to decline to the mid-2020s, with annual average additions of
about 800 MW of new capacity each year as electricity consumption flatlines in Victoria, while
overdevelopment in some regions becomes apparent as transmission access and marginal loss factors
(MLFs) are forecast to reach their most congested points, and regional wholesale prices decline.
In cumulative terms, around 6.9 GW of large and small-scale renewable capacity is modelled to be
commissioned in Victoria by 2025, growing more slowly to just 7.5 GW by 2030 without additional long-
term energy storage, or national energy and emissions reduction policy. State level support ensures that
the Victorian 50 per cent renewable energy target by 2030 is effectively met five years early, reducing
further capacity growth to just 100 to 200 MW of new renewable capacity per year.
Figure 1: Annual Victorian New Entry / Retired Capacity by Technology to 2033. Note: Brown coal capacity
additions in 2020-21 reflect 45 MW upgrade projects at Loy Yang B1 for completion by November 2020.
3,500
3,000
2,500
2,000
VIC Rooftop PV
1,500 VIC Distributed storage
VIC Utility storage
MW
1,000
VIC Utility Solar
500 VIC Wind
VIC Peaking gas + liquids
- VIC Brown coal upgrades
-500
-1,000
-1,500
Financial Year
Source: RepuTex, 2019.
REPUTEX ENERGY | Victorian market readiness to support the early retirement of Yallourn power station 8Under this forecast, Victoria does not see major thermal generator closures until the end of the decade,
with the scheduled closure of 1,450 MW of brown coal capacity (Yallourn) and 170 MW of gas (Somerton)
between 2029 and 2033. Despite consistently lower prices, brown coal generators are modelled to
continue to find a market for their energy by exporting larger portions of their baseload energy to New
South Wales via an upgraded NSW-VIC interconnector. Only once NEM generation begins to exceed
around 60 per cent renewable energy capacity, and solar energy provides around 15 per cent of Victorian
generation, is there no further profitability in running all of Victoria’s brown coal units.
4.2 Energy Generation and Greenhouse Gas Emissions
Although Victoria’s energy generation and consumption have become relatively balanced, growth in solar
and wind energy production could see Victoria’s energy generation grow by about 10 TWh by 2024,
effectively replacing the energy formerly provided by the brown coal fired Hazelwood power station. This
may see Victoria return to be a major electricity exporter, with low-cost brown coal energy continuing to be
exported to New South Wales and Queensland, which face relatively higher fuel costs, while electricity
consumption in Victoria remains very flat though the mid-2020s.
Figure 2: Annual change in energy generation in Victoria 2020 to 2032.
70,000
60,000
VIC Rooftop PV
50,000 VIC Distributed storage generation
VIC Biomass
40,000 VIC Utility storage generation
VIC Utility Solar
30,000 VIC Wind
VIC Peaking gas + liquids
20,000 VIC CCGT
VIC Hydro
10,000 VIC Brown coal
VIC Black coal
0
Source: RepuTex, 2019.
A new energy balance is achieved in the second half of the 2020s that should see marginal growth in
renewable energy replacing a slow decline in brown coal generation volumes. Modelling forecasts
renewable energy in Victoria will grow from around 27 per cent of generation in 2020 to approximately 49
per cent by 2025, and 55 per cent by 2030.
Despite the rapidly growing penetration of renewable energy generation in the early 2020s, however,
greenhouse gas emissions are not modelled to decline at the same rate if brown coal energy is exported to
other NEM regions. Modelling indicates, however, that as Victoria surpasses around 50 per cent renewable
energy generation at least one brown coal unit could be idled without being needed to meet the state’s
minimum demand profile. Such a closure should correspond with Victorian electricity emissions beginning
to decline to more than 45 per cent below 2005 electricity emission levels.4
4 Assuming electricity emissions in 2005 were 63.5 Mt in Victoria. DELWP: Victorian GHG Emissions Report 2019.
REPUTEX ENERGY | Victorian market readiness to support the early retirement of Yallourn power station 9Figure 3: Victorian electricity sector emissions
45
40
35
30
25
20
15
10
5
0
2019-20 2020-21 2021-22 2022-23 2023-24 2024-25 2025-26 2026-27 2027-28 2028-29 2029-30 2030-31 2031-32 2032-33
VIC Brown coal VIC Hydro VIC CCGT
VIC Peaking gas + liquids 45% below 2005 60% below 2005
Source: RepuTex, 2019.
An independent expert panel recently advised that reducing the state’s total emissions 45 per cent below
2005 levels by 2030 would be an economically and environmentally responsible target on the pathway to
the legislated target of net zero emissions by 2050 consistent with a 2°C trajectory. Reducing emissions 60
per cent below 2005 levels by 2030 would be more consistent with a well-below 2°C trajectory and the
objectives of the Paris Agreement on climate change.5
4.3 Energy Reliability to Meet Maximum Demand
Under our Reference Case, Victoria is modelled to have a tight reserve condition, even after the
anticipated return of Loy Yang A2 (500 MW) and Mortlake 2 (259 MW) 6 units in mid-December 2019. On
average Victoria has two brown coal units unavailable during maximum demand events, which for
illustrative purposes are shown as two units at Yallourn in figure 4. In such a situation, Victoria could be
heavily dependent on import capacity over interconnectors during even a typical ‘one-in-two year’ (50 per
cent Probability of Exceedance or POE7) maximum demand event.
During a more severe ‘one-in-10 year’ event (10 per cent POE), Victoria could need all brown coal units
available to ensure reliability. Although total import capability under normal conditions can be 1,700 MW,
Victoria’s total import capability is often limited during maximum demand events. For example, though New
South Wales (NSW) often has surplus generation capacity, this capacity shares transmission infrastructure
with hydro generation in north-eastern Victoria, which is often de-rated at times of high temperature, while
5 Independent Expert Panel on Interim Emissions Reduction Targets for Victoria (2021-2030): March 2019.
6 Capacity refers to summer 2019-20 rating of unit.
7 POE is the likelihood that a demand forecast will be met or exceeded. A 10% POE maximum demand projection is
expected to be exceeded, on average, one year in 10, while a 50% POE forecast is based on average weather and is
expected to be exceeded, on average, ever second year.
REPUTEX ENERGY | Victorian market readiness to support the early retirement of Yallourn power station 10transmission capacity can be heavily reduced if bushfires are present around the transmission line, which
traverses bushfire-prone areas of regional Victoria. In parallel, imports from South Australia can be limited
by hot summer weather patterns that are often correlated between Victoria and South Australia. As a
result, when Victoria is under stress due to peak demand, South Australia also typically experiences high
demand. Even though imports from Tasmania are not typically limited, outages of key infrastructure such
as the Basslink undersea cable have occurred in the past.
In such circumstances, Victoria can use its robust set of emergency response powers, and the Market
Operator would be able to use its direction powers and the Reliability and Emergency Reserve Trader
(RERT), to make enough capacity from non-market generators available to bridge this shortfall, if required.
However, this was only ever envisioned as an emergency measure. Continuing to rely on this approach
would be expensive for consumers and disruptive to some businesses. For this reason, it is appropriate to
address the shortfall in a timely manner.
Victoria’s reliability target shortfall is forecast to improve as assumptions about a decline in maximum
demand displace the need for some additional capacity in the future, and large capacity additions currently
under construction are fully commissioned (such as Dundonnell and Stockyard Hill wind farms) and
contribute at least some capacity during maximum demand events. The region is also forecast to augment
transmission interconnection capabilities throughout western Victoria and reinforce a small interconnection
at Red Cliffs near Mildura8 as early as 2023-24, which may be able to be linked to a new EnergyConnect
(formerly Riverlink) interconnector between NSW and South Australia (SA).
Figure 4: Maximum demand outlook for the Victoria energy reliability to 2033.
14,000
Yallourn (2 units)
12,000
EnergyConnect
Peak demand and firm capacity (MW)
10,000 Typical import capacity available
during maximum demand
8,000 Demand-side participation
New Utility storage
6,000
Virtual Power Plant
4,000
Capacity contribution from new
wind projects
2,000
Firm capacity: Existing and
committed, -2 brown coal units
- Max demand (1-in-10)
Max Demand (1-in-2)
Summer
Source: AEMO’s Generation Information (Nov 2019) and RepuTex 2019.
8 E.g. 2 x 220 kV new circuits between Red Cliffs and Buronga.
REPUTEX ENERGY | Victorian market readiness to support the early retirement of Yallourn power station 114.4 Wholesale Price Implications
Under our Reference case, long-term Victorian wholesale electricity prices are shown to decline from over
$100 per MWh in 2018-19 toward $80 per MWh, underpinned by the commissioning of large-scale
renewable energy projects. This effect is also supported by the accelerated installation of small-scale
rooftop solar PV and distributed energy storage associated with Victorian Solar Homes Program.
After a brief gap in 2022-23, modelling of current policy settings anticipates continued investment in new
Victorian wind capacity driven by the VRET, brought forward by developers seeking to capitalise on new
investment in transmission infrastructure. This investment is forecast to drive wholesale prices toward $60
per MWh, with other investment limited to growth in smaller ‘rooftop’ PV installations. Wholesale prices are
maintained at low levels as effective energy consumption declines (from the grid’s operational
perspective), powered by increased ‘rooftop’ PV self-generation. Together, these factors could maintain
relatively low wholesale electricity prices throughout decade.
Figure 5 – Reference case Victorian annual wholesale electricity prices.
120
100
80
$ per MWh
60 Central Forecast: FY,
Nov-19-RTX (Vic)
Annual Avg Spot Vic
Wholesale
40
20
0
2015
2029
2010
2011
2012
2013
2014
2016
2017
2018
2019
2020
2021
2022
2023
2024
2025
2026
2027
2028
2030
2031
2032
2033
Financial Year ending
Source: RepuTex, 2019.
Lower prices are also an indication of an increasing supply-to-demand ratio, putting pressure on major
thermal generators. Modelling suggests that these closures are most likely to occur at facilities with higher
fuel costs outside of Victoria, such as gas-fired generation in South Australia and black coal-fired
generation in NSW and Queensland. Such closures would help to maintain remaining coal-fired generator
volumes, including Victoria’s major brown coal-fired units though the 2020s.
As noted, by the end of the decade - as NEM generation begins exceeding around 60 per cent renewable
energy and solar energy starts providing more than 15 per cent of Victorian generation - the scheduled
closure of large brown coal units is modelled to lift the wholesale price back toward $80 per MWh,
particularly after a fourth brown coal unit closes in 2032. This is driven by reduced competition for major
thermal generation in Victoria, and a heavier reliance on dispatchable facilities with higher fuel costs, such
as black coal (from NSW) and gas.
REPUTEX ENERGY | Victorian market readiness to support the early retirement of Yallourn power station 125. ALTERNATIVE SCENARIO: PREPARING FOR
THE EARLY CLOSURE OF YALLOURN
While Victorian brown coal facilities are some of the lowest-cost thermal generators in the NEM, and do not
necessarily face imminent economic closure, headwinds for coal-fired generation - such as the failure of
ageing equipment and expensive maintenance, competition from lower cost renewable energy, and
concerns over large greenhouse gas emissions - suggest that the closure of the Yallourn power station
prior to 2032 is a live issue for the Victorian electricity market. As a result, measures should be taken to
prepare for the potential retirement of Victoria’s aging coal-fired fleet.
To better understand the potential impact of the early retirement of the Yallourn power station on the
regional energy system, we consider an alternative scenario which models the ‘earliest’ retirement of
Yallourn in 2023, assuming a three-year notice period9. This is modelled to reflect a ‘worst case’ scenario
for the Victorian energy system, informing how the risk of severe events and the sudden unavailability of
brown coal units may be minimised though proactive planning on a short lead time.
5.1 Additional Measures to Support Energy Security
As shown in Figure 4 (Section 4.3), while available capacity is modelled to remain tight under our
Reference Case, Victoria is shown to have sufficient local and import capacity to meet ‘one-in-two year
maximum demand over the next five years. However, under more extreme situations - such as ‘one-in-ten
year’ maximum demand - Victoria is dependent on having all its dispatchable market capacity available.
The unavailability of one or two units at Yallourn, or its early closure, therefore, reflects a potential threat to
Victorian energy security during severe maximum demand events.
Should Yallourn’s 1,420 MW of summer capacity be removed from the Reference Case, and no other
initiatives introduced, Victorian total scheduled generation capacity would be reduced to around 7,500
MW10. Even with a limited amount of additional capacity from committed large new renewable projects and
current interconnectors, energy security may be vulnerable during ‘one-in-10 year’ events that could reach
maximum demand of more than 9,600 MW11. In addition, an energy security and/or reliability reserve buffer
is required for different situations that can arise, such as the unavailability of multiple large units, or an
interconnector, and/or peak demand conditions in more than one region at a time.
Victorian policymakers are therefore expected to implement additional measures to support grid reliably in
readiness for the early retirement of a Yallourn sized generator from the local market. Although there are
many combinations of investments that could be constructed to optimise the replacement of a brown coal
generator, the Alternative Case considers the following measures to reduce peak demand and enhance
firm supply within the specified lead time (before the summer of 2023-24):
1. Fast track the development of the KerangLink interconnector. The fast tracking of the
KerangLink interconnector by the end of 2023 is expected to unlock up to 2,200 MW of existing
flexible capacity in New South Wales. A new large interconnector can also facilitate sharing of
Victorian renewable energy supply during high wind periods and incentivise further development of
Victoria’s renewable resources that are currently transmission constrained. Although the
KerangLink interconnector is assumed to be completed by the end of 2023 to contribute to
reliability after the closure of Yallourn, this scenario also includes capacity from the EnergyConnect
interconnector between Robertstown in South Australia and Wagga Wagga in New South Wales
by the beginning of 2024. Without at least one of these new interconnectors, existing excess load-
following capacity in NSW is often unable to access the Victorian market during maximum demand
9 On 8 November 2018 the Commission made a final rule that requires large electricity generators to provide at least
three years notice to the market before closing. This information will help market participants respond to possible future
shortfalls in electricity generation, for example by building replacement capacity. The rule is based on one of the
recommendations in the Finkel Panel review.
10 AEMO: Generation Information, Scheduled Capacities – Summer 2023-24 (2019, November 14); Victorian Region.
11 AEMO’s Central scenario: ISP 2019-20, Operational (Sent-Out) – Summer 2023-24 (10 per cent POE)).
REPUTEX ENERGY | Victorian market readiness to support the early retirement of Yallourn power station 13conditions, which limit flows on existing infrastructure. KerangLink would also allow access to the
committed Snowy 2.0 project after the summer of 2024-25.
2. Double the capacity of Victorian rooftop PV from 2,000 MW in 2019-20 to more than 4,000
MW by the summer of 2023-24. This is equivalent to returning to (and maintaining), around 6,000
rooftop PV installations per month in Victoria, in line with the beginning of the Victorian Solar
Homes policy.12 At only 18 per cent of dwellings with a PV system, there is room for further growth
in rooftop PV in Victoria, with potential for an increase energy generation by around 2.8 TWh in the
next three years, equivalent to the annual output of one unit at Yallourn. Rooftop PV is a cost-
effective source of energy at the ‘point-of-use’, contributing to demand reduction (particularly in
summer), but is not considered ‘available capacity’ during maximum demand given a significant
portion of maximum demand events can occur after sunset.
3. Installation of utility-scale storage. The installation of utility-scale storage from about 55 MW
today to almost 600 MW by the summer of 2023-24 may be in the form of large, two-hour duration
batteries that can be installed in a modular fashion targeted at the point where they are needed,
such as near clusters of large renewable generators and other grid constraints. Although this
capacity could also be provided by pumped hydro storage, the large pipeline of announced battery
projects is considered more realistic under a three year lead timeframe.
4. Installation of distributed battery energy storage. Rapid growth in the installation of distributed
battery energy storage in Victoria, from around 70 MW in 2019-20 to 560 MW by the summer of
2023-24 can regularly contribute between 1.4 and 1.5 GWh of capacity in 2023-24. This occurs
through the daily absorption and discharge of primarily rooftop PV, distributed during evening and
overnight periods when the energy is needed most. Although distributed storage does contribute to
peak demand reduction, it is not necessarily able to be dispatched by the grid operator without
being aggregated into a ‘virtual power plant’.
5. Growth in aggregated sharing models for distributed battery storage systems. The growth of
aggregated sharing models for distributed battery storage systems such as Virtual Power Plants,
operated by a retailer or aggregator to act as an alternative supply source for arbitrage or
emergency response, is modelled to provide approximately 280 MW of capacity by the summer of
2023-24, around half of all distributed battery storage.
6. Increased demand side participation. An increase in demand side participation, where the grid
operator is able rely on entities to reduce peak demand from both aggregated residential and large
industrial sources, is able to provide around 160 MW by the summer 2023-24.
7. Continuation of wind energy growth. There are more than enough proposed wind generation
projects to meet and exceed the capacity modelled in this analysis. However, without final
investment decisions on these projects, there is a risk that they will not proceed. These projects
include 2.6 GW of installed wind capacity beyond what has already been committed for a total of
5.8 GW by the summer of 2023-24.
The impact of these measures is discussed below.
12 The original design of the scheme, which started in July 2019, offered only 3,333 rebates each month, putting an
effective cap on the market below pre-policy installation rates.
REPUTEX ENERGY | Victorian market readiness to support the early retirement of Yallourn power station 145.2 Change in Installed Capacity in Victoria
Under the Alternative Case, enough capacity is built in the next three years to support the possible early
retirement of Yallourn. This involves building almost 6 GW of new large-scale renewable capacity by the
summer of 2023-24, as shown in Figure 6(a),13 with utility-scale wind technologies generally assumed to
continue to outcompete solar in Victoria, owing to a lower initial levelised cost of energy, more favourable
generation profile, and superior wind resource. Almost all this capacity is assumed to be built in the
Reference Case forecast, however, without final investment decisions on these projects there is a risk that
they could be delayed, or not proceed fast enough, to be fully commissioned by the summer of 2023-24.
Figure 6(a): Annual average change in large-scale Victorian New Entry Capacity to 2024.
9.0
8.0
7.0
Utility Storage New
6.0
Utility Storage Committed
5.0 Utility Storage Existing
MW
Utility Solar New
4.0 Utility Solar Committed
Utility Solar Existing
3.0
Wind New
2.0 Wind Committed
Wind Existing
1.0
-
2019-20 2020-21 2021-22 2022-23 2023-24
Financial Year
Source: AEMO Generation Information, 2019 and RepuTex, 2019.
Major differences in capacity between the Alternative Case scenario and Reference Case forecast include
an extra 270 MW of utility storage capacity ahead of Yallourn’s closure in 2023 and another 230 MW of
distributed storage after Yallourn’s retirement. The difference in annual average capacity change between
the Alternative Case and Reference Case are shown in Figure 6(b).
Aside from the closure of Yallourn in 2023 under the Alternative Case, most change in capacity shown in
Figure 6(b) occurs under the Rooftop PV category, adding an average of 320 MW14 of capacity more than
the Reference Case forecast between 2020 and 2024, or an increase of almost 4,000 installations per
month. This would be above the average baseline rate of 210 MW per year or about 2,500 installation per
month in the Reference Case forecast.15 Therefore, the Alternative case scenario’s total Victorian Rooftop
PV additions average 530 MW per year, or about installation rates to approximately 6,500 systems per
month (in line with levels seen under the Victorian Solar Homes policy). By maintaining this accelerated
installation rate, total installed Rooftop PV could grow to more than 4 GW over the next few years, rather
than just 2.7 GW at the lower installation rate as shown in Figure 6(c).
13 In line with AEMO’s existing and committed project pipeline information as of 14 November 2019.
14 For reference, each of the four units at Yallourn are either 350 or 375 MW in nameplate capacity.
15Mostly associated with higher-income residential solar installed by those above the means-tested threshold and
smaller (Figure 6(b): Annual average difference from the Base Case forecast in New Entry and Retired Capacity in
Victoria to 2033.
1,300
800
VIC Rooftop PV
300
VIC Distributed storage
MW
VIC Utility storage
VIC Utility Solar
-200
VIC Wind
VIC Brown coal
-700
-1,200
Financial Year
Note that negative values in 2032-33 do not represent closures, but reflect net differences to the Reference Case forecast, where a
large amount of capacity is added after Yallourn closes (rather than being built ahead of the closure as in the Alternative Case).
Source: RepuTex, 2019.
Figure 6(c): Annual average change in small-scale Victorian New Entry Capacity to 2024.
9.0
8.0
7.0
6.0
Distributed Storage Additional
5.0
Distributed Storage Forecast
GW
Distributed Storage Existing
4.0
Rooftop PV with Solar Homes
3.0 Rooftop PV without Solar Homes
Rooftop PV Existing
2.0
1.0
-
2019-20 2020-21 2021-22 2022-23 2023-24
Financial Year
Source: AEMO ISP, 2019-20 and RepuTex, 2019.
REPUTEX ENERGY | Victorian market readiness to support the early retirement of Yallourn power station 16Although a relatively small proportion of installed capacity, distributed (i.e. small-scale) battery storage will need to grow many times its current level (
Under this scenario, Yallourn is assumed to be removed from the market in April of 2023, retiring 1,450
MW of nameplate capacity. In figure 6(d), this is illustrated as annual change in average capacity by fuel
type, equivalent to around one Yallourn unit in 2022-23 and the remaining three units in 2023-24.

5.3 Energy Generation and Greenhouse Gas Emissions
The amount of energy generated in the modelled Alternative Case remains in broadly line with the
Reference Case, with Victoria resuming its role as an electricity exporter from the beginning of the 2020s.
Energy generation is slightly higher than the Reference Case in the initial years due to increased PV
installations. After Yallourn’s closure in 2023, energy generation is shown to be lower than the Reference
Case, however Victoria remains a net electricity exporter until the end of the decade, even as brown coal
generation falls from about 30 TWh per annum to closer to 20 TWh per annum.

Figure 7: Alternative Case energy generated in Victoria.

          70,000

          60,000
                                                                                              VIC Rooftop PV
                                                                                              VIC Distributed storage generation
          50,000
                                                                                              VIC Biomass

          40,000                                                                              VIC Utility storage generation
    GWh

                                                                                              VIC Utility Solar
          30,000                                                                              VIC Wind
                                                                                              VIC Peaking gas + liquids
          20,000                                                                              VIC CCGT
                                                                                              VIC Hydro
          10,000
                                                                                              VIC Brown coal
                                                                                              VIC Black coal
              0

Source: RepuTex Energy, 2019

The decline in brown coal generation results in a decline in Victorian electricity sector emissions, shown in
Figure 8. In line with reduced brown-coal capacity, we model Victoria’s electricity sector emissions falling
from around 40 Mt in 2020 to approximately 26 Mt in 2023-24, 60 per cent below 2005 levels. This is
around 8 Mt lower each year than the Reference Case, or 85 Mt of emissions abatement by 2033.

REPUTEX ENERGY | Victorian market readiness to support the early retirement of Yallourn power station                              18
Figure 8: Alternative case, Victorian electricity sector emissions.
45
Million tonnes of carbon dioxide equivalent
40
35
30
25
20
15
10
5
0
Financial Year
VIC Brown coal VIC Hydro VIC CCGT
VIC Peaking gas + liquids 45% below 2005 60% below 2005
Source: RepuTex Energy, 2019
5.4 Energy Reliability to Meet Maximum Demand
Whereas under the Reference Case forecast Victoria may be reliant on yet-to-be approved import projects,
in the Alternative Case, Yallourn’s capacity is largely replaced by a fleet of energy storage capacity. As
shown in Figure 9, the closure of four brown coal units at Yallourn from April 2023 is offset by the inclusion
of new renewable energy capacity, along with energy storage and interconnector upgrades. Victoria is
shown to more readily maintain energy reliability during typical ‘one-in-two year’ maximum demand events
through the end of the decade. In more extreme ‘one-in-10 year’ events, demand-side participation
combined with current levels of import capacity from existing interconnectors ensure enough power supply.
New interconnector projects, such as EnergyConnect16 and KerangLink17, could provide additional energy
reliability as early as the summer of 2023-24 to back up other capacity that may become unavailable.
While technically feasible, these interconnectors are yet unapproved, and would likely be delayed if not
expedited though the co-operation of relevant entities. As such, this case focuses on the scale-up of
Victorian utility-scale storage and virtual power plant capacity to reduce reliance on new import
transmission being built by the summer of 2023-24.
Despite the closure of Yallourn as early as April 2023, modelling indicates that the Victorian market can
compensate for the loss of available capacity through effective planning within a three year lead time. Even
ahead of an official closure decision, Victoria could be better prepared to address capacity failures by
increasing the current rate of projects already committed or in planning stages, such as large- and small-
scale renewable energy capacity, energy storage and interconnector upgrades.
16 Formerly Riverlink.
17 Also known as Snowy Hydro South.
REPUTEX ENERGY | Victorian market readiness to support the early retirement of Yallourn power station 19Figure 9: Cumulative VIC New Entry / Retired Capacity by Technology (MW).
14,000 Yallourn (2 units)
KerangLink
12,000
EnergyConnect
10,000
Typical import capacity
available during maximum
demand
8,000 Demand-side participation
MW
New Utility storage
6,000
Virtual Power Plant
4,000
Capacity contribution from
new wind projects
2,000 Firm capacity: Existing and
committed, -2 brown coal units
Max demand (1-in-10)
-
Max Demand (1-in-2)
Source: RepuTex, 2019.
In addition to maximum demand events, this capacity combination also performs adequately during high
export, high wind, and minimum demand days. Although Victorian operational demand is normally much
lower during these conditions, the sum of total available Victorian generation capacity can also be much
lower due to increased levels of planned maintenance scheduled in ‘shoulder’ seasons (e.g. April and
October). This necessitates enough capacity flexibility to be able to respond to changing conditions, such
as ramping down to reduce supply during high hydro and wind generation and ramping up to replace
variable generation such as solar as the sun sets.
5.5 Wholesale Price Implications
In this scenario, medium-term wholesale electricity prices are shown to decline from over $100 per MWh in
2018-19 toward approximately $70 per MWh by 2022, underpinned by a lower dependence on high priced
gas generation (particularly during the more expensive winter quarter), the accelerated installation of small-
scale rooftop solar PV and distributed energy storage, along with the continued uptake of large-scale
renewable energy projects commissioned over the next three years.
Strong growth in rooftop PV and interconnection upgrades with other markets combine to dampen the
price increase associated with removing 10 TWh of brown coal generation in 2023. Continuing strong
growth in rooftop PV is shown to reduce operational grid demand, while seasonal energy storage provided
by Snowy 2.0 balances periods of renewable over- and under-supply. Utility-scale energy storage provides
competitively priced frequency control services, while distributed storage shifts Victoria’s evening peak
lower, and later into the night, better aligning with Victoria’s wind resource on sunny days. In addition,
virtual power plants and demand response mechanisms provide key peaking capacity to reduce the
frequency of extreme wholesale prices. Overall these effects suggest a steady and sustainable decrease in
prices below $60 per MWh without closing another major thermal generator in Victoria before 2033.
REPUTEX ENERGY | Victorian market readiness to support the early retirement of Yallourn power station 20Figure 10 – September 2019: Annual Forecast (Victoria)
120
100
80
Closure scenario: FY, Nov-19-
RTX (Vic)
60 Central Forecast: FY, Nov-19-
RTX (Vic)
Annual Avg Spot Vic Wholesale
40
20
0
2021
2010
2011
2012
2013
2014
2015
2016
2017
2018
2019
2020
2022
2023
2024
2025
2026
2027
2028
2029
2030
2031
2032
2033
Source: RepuTex, 2019
Although this scenario presents a generally similar wholesale price outcome to the Reference Case, after
2028 we see a divergence in prices as Yallourn is decommissioned and Reference Case prices increase
by over $20 per MWh. This is due to the delayed timeline for KerangLink (or other interconnectors) in the
Reference Case, which are not built ahead of Yallourn’s closure, leaving the Victorian market much tighter
and more dependent on gas-fired generation at Newport and Jeeralang to replace the supply from Yallourn
(particularly when black-coal from NSW is constrained). In addition, under the Alternative Case we see an
additional 1.6 TWh of energy from rooftop PV, supporting lower prices and reduced demand.
REPUTEX ENERGY | Victorian market readiness to support the early retirement of Yallourn power station 216. JOBS AND INVESTMENT
Building additional electricity generation capacity and storage solutions to prepare for an early closure of a
brown coal facility is modelled to create 27,000 job-years by 2033, averaging over 1,900 jobs per year over
the 14 year period, and provide certainty and investor confidence for the energy industry, driving an
additional $6.8 billion in economic activity in Victoria.
Figure 11: Difference in Victorian energy job creation from Reference Case forecast.
4,000
3,500
Full-time equivalent jobs in Victoria in the installation,
operation, and maintance of renewable energy
3,000
2,500
Other infrastructure
2,000 Rooftop PV
Distributed Sorage
1,500 Utility Storage
Utility Solar
1,000 Wind
500
-
2020 2021 2022 2023 2024 2025 2026 2027 2028 2029 2030 2031 2032 2033
-500
Financial Year ending
Source: RepuTex, 2019
Two-thirds of job creation is associated with increasing installation rate of rooftop PV. Whereas
employment of rooftop solar slows to an average of less than 800 full-time equivalent jobs per year (FTE)
under the Reference Case, in line with forecast lower electricity prices, under the Alternative Case
employment in rooftop PV doubles to more than 2,000 FTE, underpinned by government policy. Over 14
years this represents nearly 27,000 jobs, or 18,000 more than the Reference Case forecast.
Additional construction also leads to an increase in ongoing operations and maintenance (O&M) jobs
associated with the development of new infrastructure, averaging over 1,700 ongoing jobs per year, or
more than 1,400 above the Reference Case forecast.
Similarly, increased investment in rooftop PV represents around 43 per cent of the modelled increase in
economic activity in Victoria. Even as residential PV installations in Melbourne fall below $1 per watt after
2020, at an average installation rate of 30,000 kW per month the increase in economic activity represents
more than $200 million each year.
Over 14 years this represents nearly $3.0 billion in new economic activity over the Reference Case
forecast. Other major economic activity is also associated with new transmission infrastructure ($1.6
billion) and additional wind energy development ($0.9 billion).
REPUTEX ENERGY | Victorian market readiness to support the early retirement of Yallourn power station 22Figure 12: Difference Victorian investment from the Reference Case forecast.
$1,200
Millions
$1,000
$800
$600
$400 Other infrastructure
Rooftop PV
$200
Distributed Sorage
$- Utility Storage
2020 2021 2022 2023 2024 2025 2026 2027 2028 2029 2030 2031 2032 2033
-$200 Utility Solar
Wind
-$400
-$600
-$800
-$1,000
Financial Year ending
Source: RepuTex, 2019
Most new investment is concentrated over the next five years as capital-intensive infrastructure is put into
place before the summer of 2023-24. Note that the difference in investment is lower in the final year
(relative to the Reference Case), where investment in new capacity is deferred until 2033, after all of the
units of Yallourn have closed.
REPUTEX ENERGY | Victorian market readiness to support the early retirement of Yallourn power station 237. OTHER CAPACITY OPTIONS
While modelling assumes that the Victorian energy system is largely supported by increased investment in
battery storage and demand side measures (including rooftop PV), policymakers may also have a wider
range of policy options available in the event of a longer closure lead time, after 2023-24 modelled in this
analysis. These include:
Initiative Available Capacity Pros and Cons
MarinusLink 600-750 MW by • Addresses Tasmanian and Victorian energy security in
interconnector from 2026-27 the event of an extended outage of Basslink;
Tasmania to • Allows increased exports of dispatchable hydro and wind
Victoria energy to Victoria during periods of high demand;
• Defers 450-600 MW of thermal generator investment in
the NEM;
• Enhance the capability for Tasmanian water storage and
hydro facilities to be used as a large battery for flexibly,
sending out or absorbing power to and from Tasmania;
• Provides a market for the further development of strong
Tasmanian wind resources, with anti-correlation to
Victorian wind resources particularly during high-pressure
weather systems (i.e. sunny days)18.
Offshore wind, e.g. 55 MW available • Construction jobs and investment in a region adjacent to
Star of the South, capacity by 2025- the Latrobe Valley;
2.2 GW total 26, 2,200 MW • First power not anticipated before summer 2024-25;
available capacity • Relatively higher capacity factor than onshore wind.
by 2028-29.
• Utilise existing Latrobe Valley transmission infrastructure.
Open Cycle Gas 200-500 MW by • Although an OCGT plant could theoretically be
Turbine (OCGT) 2024 constructed quickly, associated feasibility and/or market
generators study updates may take up to three years;
• Another large gas generator could primarily displace
older gas generation in Victoria;
• Pricing is dependent on internationally influenced gas
spot prices;
• Existing OCGT proposals already exist at Mortlake
(Origin) and Tarrone (AGL) in western Victoria;
• The business case for adding another peaking generator
ahead of the closure of a Latrobe Valley generator is
being eroded by the falling cost of firmed renewable
energy.
18 RepuTex, How do weather patterns impact REZ correlations? Link.
REPUTEX ENERGY | Victorian market readiness to support the early retirement of Yallourn power station 24You can also read