Work Package 5 Policy Brief Series: Italy - eCREW PROJECT
←
→
Page content transcription
If your browser does not render page correctly, please read the page content below
Work Package 5 Policy Brief Series: Italy
establishing Community Renewable Energy Webs
                - Rolling out a business model and operational tool creating webs of
                    households that jointly manage energy to improve efficiency and
                                                                 renewables uptake

Authors:
Alessandro Sciullo1
Anna Grignani1
Anna Maria Porporato1
Dario Padovan1
Edoardo Ferrero1
Davide Mainero2
Viviana Negro2
Johannes Reichl4
Mehmet Efe Biresselioglu3
Muhittin H. Demir3

__________________________________________________________________________________________
1 University of Turino
2 Acea Pinerolese Industriale S.p.a.
3 Izmir University of Economics
4
  Energieinstitut an der Johannes Kepler Universität Linz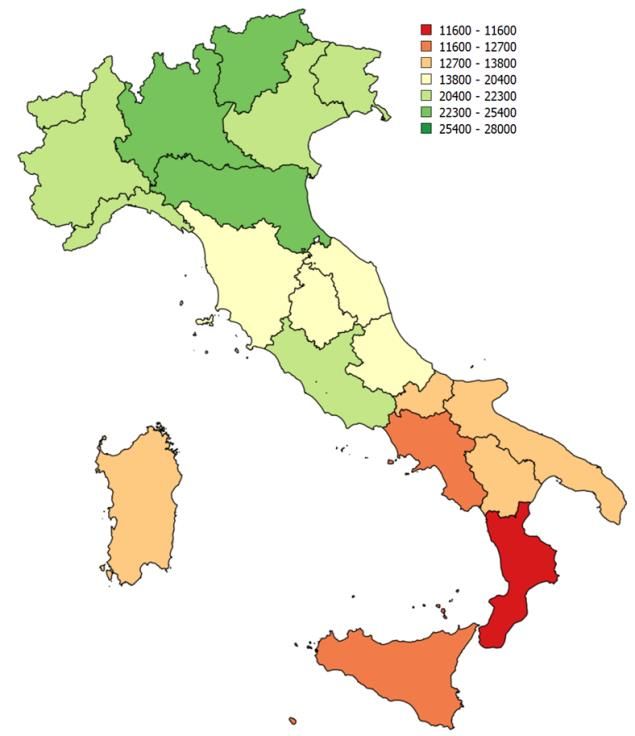
Disclaimer
The opinions expressed in this document reflect only the authors’ view and reflect in no way the European
Commission’s opinions. The European Commission is not responsible for any use that may be made of the
information it contains.

eCREW Policy Brief #1 (December 2020)                                                         Page 2 of 25
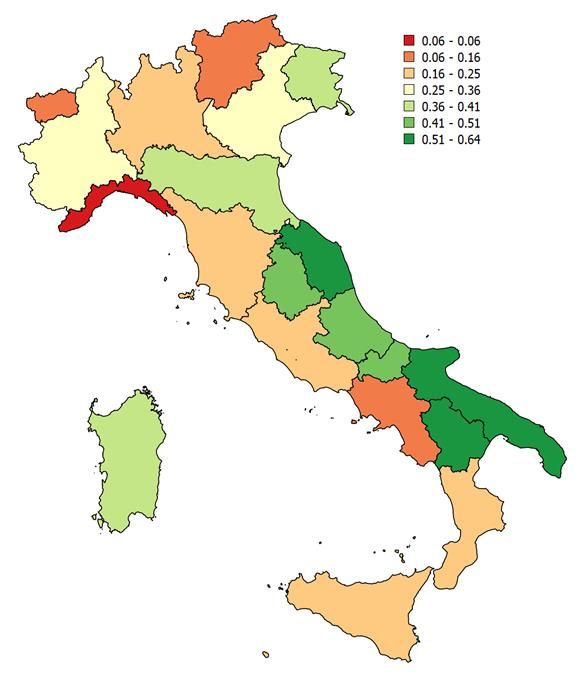
Table of Contents
1      Introduction ..................................................................................................................................................... 5
2      eCrew approach .............................................................................................................................................. 5
3      Country profile ................................................................................................................................................. 6
    3.1     Social and Economic ............................................................................................................................. 6
       3.1.1 Demographic structure ...................................................................................................................... 6
       3.1.2 Income and education ....................................................................................................................... 6
       3.1.3 Labour market and economic structure ............................................................................................. 8
    3.2     Energy.................................................................................................................................................... 8
       3.2.1 Energy profile .................................................................................................................................... 8
       3.2.2 Energy infrastructure ....................................................................................................................... 10
4      Analysis of the legislative and administrative framework .............................................................................. 12
    4.1     A review of Revised Renewable Energy Directive (RRED) 2018/2001/EU (defining “renewable energy
    communities”) .................................................................................................................................................... 12
       4.1.1 Current progress .............................................................................................................................. 12
       4.1.2 Evidence from implementations....................................................................................................... 13
       4.1.3 Barriers & Motivators ....................................................................................................................... 13
       4.1.4 Other national legislation related with RRED ................................................................................... 13
       4.1.5 Conformity to existing legislative framework .................................................................................... 13
       4.1.6 Practical issues with legislation and adaption .................................................................................. 13
    4.2     A review of Revised Energy Market Directive (REMD) 2019/944 (defining “citizen energy communities”)
            13
       4.2.1 Current progress .............................................................................................................................. 13
       4.2.2 Evidence from implementations ....................................................................................................... 14
       4.2.3 Barriers & Motivators ....................................................................................................................... 14
       4.2.4 Other national legislations related with REMD................................................................................. 14
       4.2.5 Conformity to existing legislative framework .................................................................................... 15
       4.2.6 Practical issues with legislation ....................................................................................................... 15
    4.3     General overview of how the legislative and administrative framework conforms with the eCrew
    approach ........................................................................................................................................................... 16
5      Practical framework....................................................................................................................................... 16
    5.1      Energy behaviours of citizens and how they would associate with the eCrew approach, barriers,
    motivators.......................................................................................................................................................... 16
       5.1.1 Attitudes towards environmental issues and energy........................................................................ 16
       5.1.2 Energy consumption and use .......................................................................................................... 17
    5.2      Current status of communities in terms of energy-related endeavours ................................................ 18
    5.3      Role of central government in energy transition – with special emphasis on their positions with respect
    to the eCrew approach ...................................................................................................................................... 20
    5.4      Role of local administrations (e.g. regional, municipalities) in energy transition – with special emphasis
    on their positions with respect to the eCrew approach, barriers, motivators ..................................................... 20
6      Conclusion .................................................................................................................................................... 21
    6.1     Country Profile (based on inference from previous sections, aspects to be considered with respect to
    the eCrew approach) ......................................................................................................................................... 21
    6.2     A quick SWOT analysis of the legislative and administrative framework with respect to the eCrew
    approach ........................................................................................................................................................... 21
       6.2.1 Pointers from legislation .................................................................................................................. 21
       6.2.2 Pointers from administrative framework .......................................................................................... 21

eCREW Policy Brief #1 (December 2020)                                                                                                                    Page 3 of 25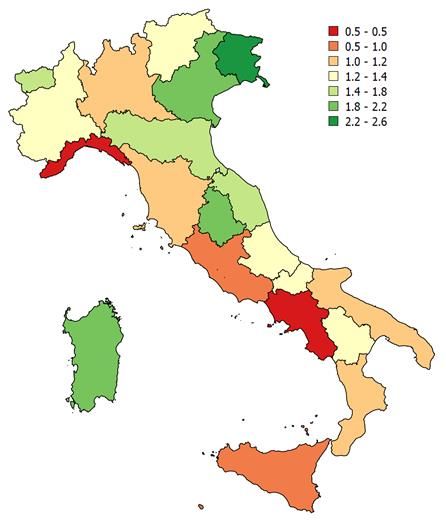
6.3     A quick SWOT analysis for the practical framework with respect to the eCrew approach ................... 22
  6.4     Suggestions for the wider uptake and further development of the eCrew approach ............................ 23
     6.4.1 References ...................................................................................................................................... 23
     6.4.2 Data sources ................................................................................................................................... 23
     6.4.3 Legislation ....................................................................................................................................... 24

eCREW Policy Brief #1 (December 2020)                                                                                                           Page 4 of 25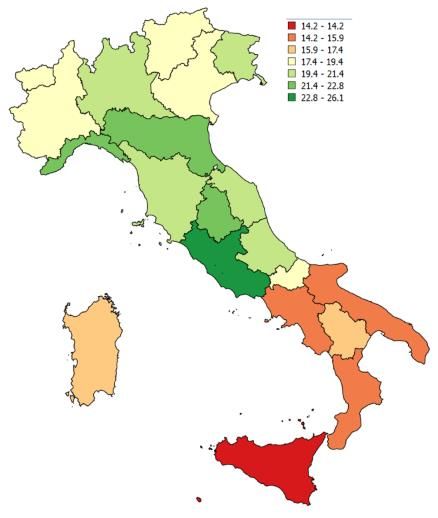
1    Introduction
This is the first of the six eCREW Policy briefs analysing the regulatory and administrative setups in Italy, Austria,
Greece, Turkey, Spain and Germany, with emphasis on how well the existing regulatory and administrative
infrastructures can be expected to enhance the implementation of the eCREW approach in the European Union
and Turkey.
These policy briefs aim at specific topics relevant for member states in enabling an appropriate framework for
energy communities in the sense of the Renewable Energy Directive (RED II) 2018/2001/EU (Renewable Energy
Community) and Internal Electricity Market Directive (ED 2019) 2019/944 (Citizen Energy Community) and the
wider goals of the Clean Energy for All Europeans Package.
This Policy Brief delivers the country profile from the eCrew perspective and identifies regulatory and administrative
barriers as well as potentials for the development of eCREWs in Italy.
The research reported in this Policy Brief was undertaken as a part of eCREW’s Work Package 5, coordinated by
Izmir University of Economics, Turkey.

2    eCrew approach
The eCREW project aims at activating and fostering the inherent, and so far, underused forces of community-driven
collective actions initiatives (CAI). Empowering citizens and giving them the tools needed to produce, store and
consume energy for a) their own benefits, b) the prosperity of the (local) economy, and for c) tackling climate change
is an important and indispensable step on our road to a stable, secure, energy-efficient and climate-neutral future
energy system. Recent European legislation has paved the way for unleashing the potentials of such initiatives by
granting them a certain degree of support and has set the scene for the establishment of Citizen Energy
Communities (CECs) and Renewable Energy Communities (RECs). Unleashing the potentials of such CAIs
requires new business models, financially viable solutions, reliable ICT tools and low, or no, entry barriers, in order
to engage as many citizens as possible. We define a CREW (Community Renewable Energy Web) as a group of
citizens jointly utilizing household level renewable electricity generation and storage capacities and establish
CREWs as the third pillar of citizens’ energy-related cooperation, complementing CECs and RECs. Joining requires
simply signing a CREW contract, and no up-front investment or need to establish a legal entity, and minimal or no,
opportunity costs. CREWs can come in sizes, from small neighbourhood groups to whole city districts. For this
purpose, the project considers the legal, administrative and other relevant operational and infrastructural
requirements for eCREW. The administration of the CREWs, including the billing of participants and provision of
the smart phone app as the operational tool of the households’ cooperation, is provided by local energy retailing
companies (the Community Administering Entity – CAE), who implement the eCREW approach as a new business
model. Hence, eCREW provides an impactful way to cooperation for those households that have no access to
CECs and RECs. The core assumption of a CREW (most participants are households, but a CREW is generally
open also to other entities, e.g. industrial companies with PV) is that some entities/households with PV have excess
electricity generation. Usually, this excess is sold to a retailer/grid (depending on national legislation) for a fixed low
feed-in tariff (e.g. 3 cent/kWh), while each kWh purchased from the grid costs at least double (e.g. 6 cent/kWh,
energy only costs). The CREW approach is facilitated through a “CREW contract” that participants establish with
their CAE. In this contract, participants (e.g. prosumers, households owning storage capacities, and households
only consuming electricity) have some standard electricity tariff for consumption and production (e.g. a flat tariff; or
a spot-market tariff). In addition, the CREW contract stipulates that whenever CREWs members, have excess
electricity, others who need electricity at this time (i.e. households without PV) are first offered the excess electricity
at lower than grid prices (e.g. 5 cents/kWh) and only when this supply is entirely absorbed by the community
members, further quantities are purchased from the grid as required. The energy sharing in the eCREW is facilitated
through the public grid. Thereby, customers’ electricity costs in this tariff are lower than buying from the grid only.
At the same time, those with excess electricity (i.e. households with PV) obtain a higher rate than they would by

eCREW Policy Brief #1 (December 2020)                                                                         Page 5 of 25
selling to the grid (e.g. 4 cent/kWh). The margin between these two prices are the revenue of the CAE (in this
example 1 cent/kWh). The cooperation within a CREW is enabled through a software system that is hosted by
GreenPocket, and a smartphone app serves as the easy-to-use interface for the CREW members. Data of the
customers are transmitted from the pre-system of the CAEs and processed at GreenPocket, in order to finally
display them in the eCREW app. The data records are stored on the database server of GreenPocket according to
DSGVO guidelines. The CREW monitor is the central information hub within the smartphone app, which provides
CREW members different aggregates of e.g. electricity flows from/to the CREW as total of all participants’ individual
flows, and monetary savings achieved by high community-level share of self-consumption. The CREW monitor
requires the members’ electricity load profiles as an input for the provision of these aggregates. The CAE serves
as the regular electricity supplier for the CREW members, and as such, it either already has access to the members’
electricity load profiles in the granularity (e.g. hourly figures from smart meters) required for billing of the electricity
supply contract, or, if not, guarantees to the collection of this data in the CREW contract. No additional data is
required by the CAE for executing its special role of providing the CREW members with information regarding the
members’ individual electricity consumption, the CREW’s performance in consuming shares of electricity produced
within the CREW, or the members’ individual monetary benefits through their participation.
3 Country profile
3.1 Social and Economic
Based on EUROSTAT (2019) data, Italy is a country characterized by considerable territorial and socio-economic
heterogeneity, so that a territorial breakdown is needed to provide a meaningful description of its main
characteristics. In the following, we consider three macroareas1: North, Center and South (+ Islands). Next sections
clearly show that while the North – Center areas are characterized by values of socio-economic indicators always
in line (and often above) the average of the EU27, the South is still affected by a historical delay in socio-economic
development .
3.1.1 Demographic structure
Italy’s population density doubles the EU average, and almost half of the population is concentrated in the North
(Table 1).
Table 1 – Population by macroarea, 2019
Macroarea Surface (km2) Surface (%) Population Population (%) Density
North 123.664 40,9 27.746.113 46,0 224,4
Center 75.227 24,9 12.016.009 19,9 159,7
South & Islands 103.180 34,2 20.597.424 34,1 199,6
ITALY 302.072 100,0 60.359.546 100,0 199,8
EU27 4.233.262 - 447.706.209 105,8
3.1.2 Income and education
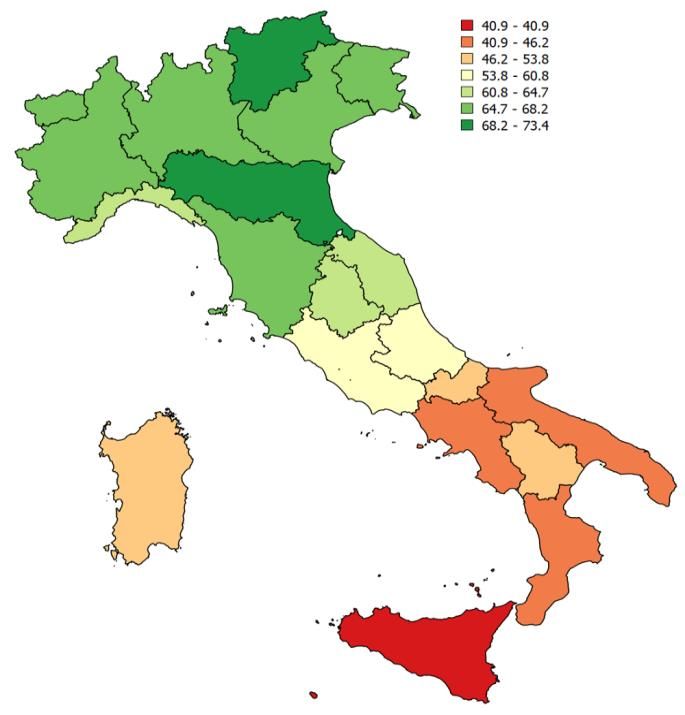
Although the average income is in line with the rest of EU, this a statistical effect hides enormous differences among
regions and macroareas (Eurostat, 2019a). People in the ‘richest’ region (Lombardia, 25.400€) account for an
average income more than double (+218%) than the ‘poorest’ region (Calabria, 11.300€). See Figure 1 for details.
Figure 1 – Households income by macroarea and region, 2019
1
Statistically speaking’ Italian NUTS 1 regions are 5 : North West, North East, Center, South and Islands. Here we
decided to simplify by aggregating (for reasonable historical and socio-economics trajectories) the 5 into 3
macroareas: North = Piemonte, Valle d'Aosta, Liguria, Lombardia, Trentino Alto Adige, Veneto, Friuli-Venezia
Giulia, Emilia-Romagna; Center = Toscana, Umbria, Marche, Lazio; South & Islands = Abruzzo, Molise, Campania,
Puglia, Basilicata, Calabria, Sicilia, Sardegna
eCREW Policy Brief #1 (December 2020) Page 6 of 25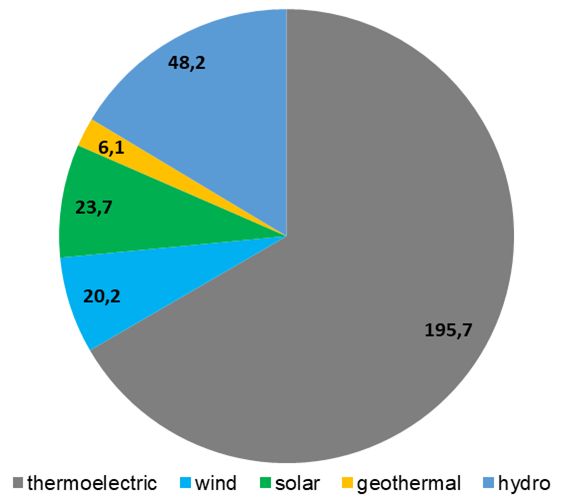
Average
 Macroarea
                    income (€)
 North              23501
 Center             20168
 South & Islands    12895
 ITALY              19218
 EU27               19300

Source: Eurostat. 2017
Excluding the outliers, a dramatic educational gap is shown by overall the percentage points that separate Italy
from the EU27 average for primary and tertiary education (respectively 37.8% vs 21.6% and 19.6% vs 31.6%).
Figure 2 – Tertiary education attainment by region (age 25-64), 2019

Source: Eurostat, 2019b

eCREW Policy Brief #1 (December 2020)                                                               Page 7 of 25
3.1.3 Labour market and economic structure
The situation of the labour market, and the territorial gap is illustrated by the decreasing employment rate moving
away from the industrial North towards the agricultural south. The territorial gap is made even wider by the gender
gap, with an employment rate for males in the north (75%) that is more than double (i.e., 2.3 times) that of women
in the south (33%) (see Figure 3).
Figure 3 – Employment rate by macroarea and region (age 15-64), 2019
Employment rate
Macroarea
Total Males Females
North 67,7 74,9 60,3
Center 63,3 70,4 56,3
South &
44,6 56,2 33,1
Islands
ITALY 58,8 67,5 50,0
EU27 67,6 72,7 62,4
Source: Eurostat, 2019c
The North is home to half of the enterprises, and almost the 60% of the entire workforce (3 times the number of
employees in the South, that accounts for the 23.4% of the entire population). When it comes to the most strategic
economic sectors for the innovation and competitiveness of the socio-economic system, there are even wider
regional gaps, in particular, for manufacture (ISTAT, 2018).
3.2 Energy
3.2.1 Energy profile
In this section, firstly, data are reported about the Italian energy balance and its evolution over the past 6 years
(from 2014 to 2019), before focusing on electricity production and consumption.
Table 2 reports the Italian energy balance in 2019 and 2014. Between 2014 and 2019, the Gross Available Energy
increased from 165.97 to 169.08 (+ 1.9%) and the energy mix has evolved with a noticeable increase of the share
of gas from 30.5% to 36.1%. Small decreases characterized the consumption of electricity (from 5.8% to 4.97%)
and solid fuels (from 8.25% to 3.91%), while consumption of oil (from 34.51% to 34,.19%) and renewables (from
20.89% to 20.86%) remained stable.
National production decreased from 44.58 Mtoe to 42.59 Mtoe (-4,46%), with important decreases in the share of
solid (-34.3%), gases (-32.25%) and oil (-25.82%) and a slight increase in the share of renewables (+ 4.6%). Net
Imports have slightly increased from 121.28 Mtoe to 126.94 Mtoe (+4.7%), rising from 73.07% in 2014 to 75.07%
in 2019 of the Gross Available Energy, a proxy of the overseas dependence of the national energy system. This
increase is particularly relevant for gases (+ 27.4%), while oil imports have remained relatively stable (+ 3.6%) and
renewables showed an important decrease (-38.5%).
eCREW Policy Brief #1 (December 2020) Page 8 of 25In terms of final consumption, the distribution among the final uses has remained stable, with a slight increase for
transport and households (rising respectively from 31.8% to 32.1%, and from 36,3% to 37.7%), and a slight
reduction of the industrial sector (from 23.3% to 21.4%).
Table 2 – Italian energy balance, 2014 – 2019 (MToe)
2014 2019
renewa electrici renewa electric
solid gases oil total solid gases oil total
bles ty bles ity
1.Production 0,35 5,86 5,77 32,61 44,58 0,23 3,97 4,28 34,11 0 42,59
2.Import 13,46 45,67 71,19 2,22 10,28 142,83 6,84 58,2 80,62 1,55 9,68 156,89
3.Export 0,24 0,19 20,31 0,14 0,67 21,55 0,23 0,27 27,9 0,27 1,28 29,95
4.Stocks -0,12 0,62 -0,63 0,02 -0,11 0,23 0,92 -0,82 0,12 0 0,45
5. Gross Available
energy (1+2-3-4) 13,69 50,71 57,27 34,67 9,62 165,97 6,61 60,99 57,81 35,27 8,4 169,08
6.Losses -0,12 -1,68 -3,55 -0,01 -40,84 -46,2 -0,1 -1,97 -3,7 0 -37,52 -43,29
7.Transformation in
Electricity -10,65 -14,65 -2,34 -27,79 55,43 -4,26 -21,85 -1,63 -26,42 54,15 0
8. Available for final
consumption 2,93 34,39 51,38 6,87 24,21 119,7 2,25 37,18 52,48 8,85 25,03 125,7
(5+6+7)
- industry 2,85 11,87 3,98 0,03 9,2 27,93 2,2 12,44 2,92 0,11 9,23 26,9
- transport - 0,86 35,33 1,03 0,9 38,12 - 0,96 37,16 1,28 1,02 40,42
- private
households 0,00 21,02 2,94 5,8 13,65 43,42 0 22,99 2,7 7,42 14,28 47,39
- agricolture 0,12 2,13 0,01 0,46 2,72 0 0,14 2,21 0,04 0,49 2,89
- others 0,08 0,51 7,0 0 - 7,6 0,06 0,64 7,5 0 - 8,19
Source: Ministry of Economic Development (2020)
As for electricity, in 2019, the gross domestic production of electrical energy was equal to 289.9 TWh. The
production of the latter has represented, for over 10 years, the largest share of thermoelectric energy production,
favoured over time also by the replacement of outdated oil conventional cycles with innovative natural gas combined
cycles plants, Figure 4.
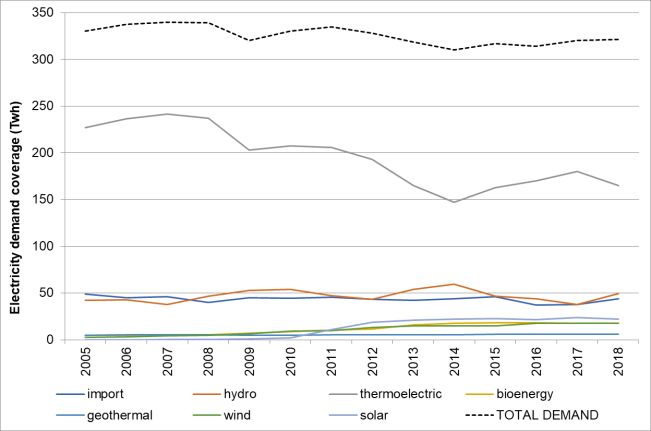
eCREW Policy Brief #1 (December 2020) Page 9 of 25Figure 4 – Electricity Production by sources: trend 2000-2019 (left) and the share in 2019 (right) (Source : TERNA, 2020 ) The demand for electricity in 2019 was of 318.6 TWh (provisional data). In 2019, 88.0% of the electricity demand was met by domestic production, which equalled to 280.4 TWh. Figure 5 – Electricity Demand coverage: trend 2005-2018 and consumption 3.2.2 Energy infrastructure In terms of capacity, the gross generation power installed in Italy, as of 2020, was 119.3 million kW. 53.6% of this capacity is represented by thermoelectric plants (64 GW), 19.2% by hydroelectric plants (23.0 GW), and finally, 27.2% by wind, photovoltaics and geothermal plants (around 32,4 GW). (MISE p. 19) Figure 6 – Power installed by technology: trend 2000-2019 (left) and the share at 2019 (right) (Source: TERNA, 2020 ) eCREW Policy Brief #1 (December 2020) Page 10 of 25
According to the Ministry of Economic Development (2019), the transmission grid in Italy in 2017 is composed of
         861 stations for total 66000 km of cables and lines.
         The overload of the network in the north-west of the country is related to the lines that import energy from
         Switzerland and France and to the hydroelectric power plants in Liguria and Lombardy. In the North-East this risk
         has been moderated by the construction of the new power line between Redipuglia and Udine.
         As for the central Italy, structural problems are detected in particular on the Adriatic Coast that plays a crucial role
         for the transmission of power from the south. Recently, more capacity has been installed from conventional and
         renewables sources whose further increase is at the centre of future policy in the energy field. The concentration
         of production from renewable sources in the areas of Avellino, Foggia and Benevento and from traditional sources
         in Apulia and Calabria show greater energy transference in the direction south – central southern region,
         predominantly on the Adriatic coast, and along the high-voltage lines extending northwards from Calabria.
         In the south, the production from renewable sources is particularly relevant in the areas of Avellino, Benevento and
         Foggia while traditional sources while in Calabria and Apulia traditional sources are still the most relevant basis of
         the transference of energy along the direction south- central south with a crucial role played by high-voltage
         infrastructures that from Calabria extend towards the North.
         Transmission criticalities can be detected for Sardinia for some problems with the 150 Kv network in Gallura and
         fro the structural lack of plants able to guarantee more flexible services. In Sicily also the situation is critical due to
         the reduced transfer capacity between the west and east sides and the inability of properly exploiting the potential
         of the submarine connections with Calabria.
         As for the distribution (264,000 GWh in 2016), Italian network is made up of 391,000 km of medium-voltage network
         (MV) and 865,000 km of low-voltage (LV) network, with 154 distributors, supplying more than 29 million domestic
         users and 7.4 million non-domestic users.
         Likewise, 743,000 plants were connected to the distribution networks, including 731,000 PV, with a total of 30.6
         GW and gross production of 62.9 TWh, including 78.2% RES, and an average self-consumption share of 22.4%.
         As for the production of electricity from renewables plants, Table 3 shows an overview of the Italian endowment.
         Table 3 – Renewables plant in Italy by macroarea, 2020
             Number of Plants                                                     Power installed (MW)
              bio bio         geo                                                 bio  bio        geo
Values                 wind         hydro         solar    waste other    total            wind         hydro solar waste other total
              gas mass      thermal                                               gas mass      thermal
 North       1477    565    124     0     2903    431380    34    1177 437660     994    733   107    0     6173    8320    1021   3296 20643
Center        204    162    197    24     442     135485    10    224 136748      157    134   216    729   1082    3383     92    224    6017
South &
              240    105    4484    0     192     211433    11    94     216559   161    1708 9095    0      530    6716     82    479    18770
Islands
ITALY        1921    832    4805   24     3537    778298    55    1495 790967 1312 2575 9417          729   7785 18419 1195        3999 45431
 IT %         0,24   0,11   0,61   0,00   0,45    98,40    0,01   0,19    100      2,9   5,7   20,7   1,6    17,1   40,5     2,6   8,8    100

              bio     bio        geo                                              bio bioma        geo
  %                       wind         hydro       solar   waste other    total             wind         hydro      solar   waste other   total
              gas    mass      thermal                                            gas   ss       thermal
 North        77      68     3      0      82       55      62    79       55      76    28     1     0      79      45      85    82      45
Center        11      19     4     100     12       17      18    15       17      12     5     2     100    14      18      8      6      13
South &
              12      13     93     0      5        27      20     6       27      12    66    97     0       7      36      7     12      41
Islands
ITALIA                                      100                                                              100
         (Source: GSE, 2020)

         eCREW Policy Brief #1 (December 2020)                                                                        Page 11 of 25
Figure 7 – Regional distribution of PV plants: number of plants per 100 inhabitants (left) and Power installed (Kw
per capita), right.
(Source: Agrillo et al., 2019; GSE, 2020)
In 2017, 9,600 km of national natural gas network and 22,900 km of regional natural gas network was in operation.
Natural gas is distributed by 261,000 km of network, 57.5% at low pressure, 41.8% at medium pressure and 0.67%
at high pressure, 21% of which is owned by the municipalities.
According to ARERA, there are 21.7 million domestic users, 219,000 landlords, 97,000 public service activities and
1.5 million other uses with total consumption of 31.8 billion m3. Total net consumption was 75.2 billion m3 (Ministry
of Economic Development, 2019)
4 Analysis of the legislative and administrative framework
4.1 A review of Revised Renewable Energy Directive (RRED) 2018/2001/EU (defining “renewable
energy communities”)
4.1.1 Current progress
There is an experimental and transitory regulation in view of the complete transposition of Articles 21 and 22 of the
Directive EU 2018/2001 of the European Parliament and of the Council of 11 December 2018 on the promotion of
the use of energy from renewable sources. Notably, the Italian legislator adopted Article 42-bis of Legislative
Decree December 30, 2019, n. 162, converted with Law February 28, 2020, n. 8, that allows small-scale collective
self-consumption of renewable energy plants below 200 kW for customers linked to the same low voltage
distribution sub-grid. The current definition by Italian regulatory context is the same as Renewable Energy
Community introduced by Directive EU 2018/2001.
To date, this directive has not yet been completely transposed by the Italian legislator.
eCREW Policy Brief #1 (December 2020) Page 12 of 254.1.2 Evidence from implementations
The aforementioned Article 42-bis defines the methods and conditions for activating collective self-consumption
from renewable sources and for the creation of renewable energy communities.
In addition, some regions adopted a specific discipline on the subject. For instance, Piedmont
adopted the L.R. August 3, 2018, n. 12 in order to promote the establishment of energy communities.
4.1.3 Barriers & Motivators
With reference to “motivators”, the aforementioned Article 42-bis provides for a support mechanism for energy
communities, defined by the Ministry of Economic Development through the adoption of a specific act.
Furthermore, the Regional Law Piedmont n. 12/2018 provides for public funding aimed at promoting the
establishment of the energy communities, which are granted by the Region following an evaluation of the proposal.
Also envisaged are tax incentives linked to the nature of an innovative start-up company if the energy community
takes this form, then the investment entitles you to a 30% tax credit if participation is continued for at least three
years in compliance with Article 29 of Law Decree n. 179/2012, converted by Law n. 221/2012, and Article 1,
comma 218 of Law n. 145/2018. Moreover, Article 16-bis of Decree of President of the Republic n. 917/1986
provides for tax deductions for construction of plants instrumental to energy communities.
Regarding to “barriers”, under the Italian law there is no possibility for ordinary citizens to distribute the energy
produced to other citizens without the intermediation of a professional retailer.
4.1.4 Other national legislation related with RRED
The matter of renewable energy is governed by Legislative Decree n. 28/2011, which establishes the objectives
and purposes of the energy policy. This decree also provides for the administrative paths for the issue of permits
to produce renewable energy, and it establishes certain economic incentives.
4.1.5 Conformity to existing legislative framework
As well as the reference to the aforementioned Article 42-bis, the regulations on start-up companies and on the
production of renewable energy can be cited. Indeed, both are compliant with the regulatory changes to be
introduced as a result of the implementation of the RRE Directive.
4.1.6 Practical issues with legislation and adaption
The support mechanism for energy communities defined by the Ministry of Economic Development under the
aforementioned Article 42-bis are notably different from the support envisaged in general for renewable energy.
These incentives must not be an additional cost for the State because they will replace an existing facilitation, the
so-called “scambio sul posto”. As an alternative to the “scambio sul posto” mechanism, the intention explained by
the Energy Independent Autority (ARERA) through the Deliberation n. 318/2020/R/eel is to define an incentive rate
for the remuneration of the plants, which will be provided by a public company called GSE.
4.2 A review of Revised Energy Market Directive (REMD) 2019/944 (defining “citizen energy
communities”)
4.2.1 Current progress
To date, the Directive EU 2019/944 has not yet been implemented by the Italian legislator.
Therefore, the Italian Parliament has set up the procedure for the transposal of the REM Directive at the beginning
of 2020 and, at the present time, the Draft Law of European Delegation for the years 2019-2020 was approved by
eCREW Policy Brief #1 (December 2020) Page 13 of 25the Senate Chamber on 29 October 2020 and has been under examination by the Chamber of Deputies since 11 November 2020. The Draft Law contains the delegation to the Government for the implementation of the Directives EU 2018/2001, 2019/944 and 2019/943. In particular, Article 12 of the Draft Law provides for principles and guiding criteria for the implementation of the Directive EU 2019/944. 4.2.2 Evidence from implementations According to the version approved by the Senate Chamber (Draft Law n. 1721), the Government is required to: a. define the discipline regarding the Citizen Energy Community; b. update and simplify the legislative framework concerning the final self-consumption and the distribution systems; c. define the legislative framework for the development and the diffusion of storage systems; d. establish harmonized and simplified authorization procedures for the construction and the exercise of energy build-ups; e. define the mechanisms for long-term market solutions in order to provide stability to investments; f. define a single discipline for energy communities, collective self-consumption, energy build-ups and forecast the beginning of experimentation for a gradual shift to a self-dispatching system designed to promote a more active role of the operators; g. update and reorganize the legislative framework of the measures designed for the protection of vulnerable costumers and those suffering of energy poverty; h. reorganize the discipline regarding the national transmission network development plan and coordinate it with the authorization procedures; i. introduce administrative pecuniary sanctions in case of non-respect of the obligations under the Directive EU 2019/944 by the electricity companies. 4.2.3 Barriers & Motivators It is uncertain whether the Italian Government, through the decrees issued mostly by the Ministry of Economic Development, will be able to put into effect the content of the three aforementioned Directives. One of the most significant barriers is represented by the extensive reorganization that these measures will require; in particular, it will be necessary to widely revise the legislation concerning the production, transmission, distribution and sale of electricity. Furthermore, as explained below, the implementation of all these measures will necessarily imply the availability of economic resources. 4.2.4 Other national legislations related with REMD The Italian regulatory framework provides for the involvement of various public authorities in accordance with the principles of subsidiarity and adequacy. The Ministry of Economic Development (MISE) is tasked with adopting the Italian National Energy Strategy (SEN), a ten–year plan drawn up by the Italian government to anticipate and manage the shift in the national energy system. On 21 January 2020, the Ministry of Economic Development announced the submission of the final version of the Integrated National Energy and Climate Plan (NCEP) for the years 2021-2030 to the European Commission. The eCREW Policy Brief #1 (December 2020) Page 14 of 25
Plan was drafted by the Ministry of the Economic Development in accordance with the Ministry of Environment and
protection of the Territory and Sea (MATTM) and the Ministry of Infrastructure and Transport (MIT).
The most important objectives of the Italian NCEP (Chamber of Deputy, 2020b ) are:
- a 30% percentage of renewable energy sources in the Final Gross Consumption of energy, in accordance with
the objectives established for Italy by the European Commission;
- a 22% share of renewable energy sources in the Final Gross Consumption of energy in transports, compared to
the 14% established by the European Commission;
- a 43% reduction of primary energy consumption compared to the PRIMES 2007 scenario;
- a 33% reduction of “greenhouse gases” by compared to 2005, for all the non-ETS (buildings, transport, agriculture
and industry) sectors.
Moreover, within the framework of a low-carbon economy, the NCEP prospects carbon “phase out” in electric
generation by around 2025.
In addition to the NECP, the Legislative Decree n. 47 of 9 June 2020, in accordance to the delegation contained in
art. 23 of the European Delegation Law 2018, the Law n. 117/2019, was transposed into national law the Directive
EU 2018/410, which establishes the functioning of the European Emissions Trading System during the phase IV of
the System (2012-2030).
The following Legislative Decree, n. 48 of 10 June 2020, also adopted in accordance with the delegation contained
in Law n. 117/2019, was transposed into national law the Directive 2018/844 regarding the energy performance of
buildings.
Lastly, the Legislative Decree n. 73 of 14 July 2020, in accordance to the delegation contained in Law n. 117/2019,
was transposed the Directive EU 2018/2002 regarding the energy-efficiency.

4.2.5    Conformity to existing legislative framework
The Legislative Decree n. 102 of 14 July 2014 was transposed into national law the former Directive concerning
energy-efficiency, the Directive EU 2012/27, which was repealed by the Directive EU 2019/944.
The Legislative Decree n. 102/2014 points out that the national energy savings target consists in the reduction,
before 2020, of primary energy consumption by 20 million tons of oil equivalent.
One of the most important provisions of the aforementioned Legislative Decree is provided in the art. 9, which is
dedicated to “Metering and billing the energy consumption” and establishes that the individual counting of heat
must become mandatory on the whole national territory from 1 January 2017 onwards.

4.2.6    Practical issues with legislation
In the Reading Notes drawn up for the Budgetary Service of the Senate Chamber in April 2020, it is underlined that
the transposition of the Directive EU 2019/944 was not expected to have direct effects on the national budget.
Nevertheless, it is pointed out that currently it is not possible to exclude economic indirect effects which could derive
from the complexity of the delegated subjects.
However, it is also said that the uncertainty related to the possible indirect effects will not weigh exclusively on the
tariff system, hence on taxpayers.

eCREW Policy Brief #1 (December 2020)                                                                      Page 15 of 25
4.3      General overview of how the legislative and administrative framework conforms with the
         eCrew approach

Beginning in 2009, Brondi et al. (2014 argued that “the significant rise in installed capacity of renewable energy
was driven by the rapid growth of photovoltaic production. This was the result of the introduction in 2005 of a very
generous feed-in tariff (FiT) scheme, together with a net-metering system, for solar electricity (called Conto
energia)”.
This ended in June 2013, nevertheless a remaining quota of plants admitted to the fifth FiT scheme was installed
from July 2013 to 2016. With Conto Energia, annual installations raised from 6.5 MW (0.0065 GW) in 2006 to 3.64
GW in 2012, with a compound annual growth rate (CAGR) of 120%. This continued market placement was
accompanied by a noteworthy discount in PV system prices, especially from 2008 onwards (Politecnico di Milano,
2014).
Unsurprisingly, most Italian energy communities developed between 2008 and 2013, when FiT were implemented
to support deployment and cost reduction of photovoltaic systems. The strong policy support, combined with
remarkable reductions in costs of photovoltaic modules and installation since 2010, has increased the profitability
and reduced the risks of photovoltaic investments in the wider context of the Italian energy sector. With the reduction
of FiT support in 2013 the Italian PV market has shrunk (moving from 3.5 GW/year of installed PV between 2008
and 2013 to 385 MW/year in the period between 2013 and 2018) and the Italian CE sector with it (Candelise and
Ruggieri, 2020).

5      Practical framework
5.1      Energy behaviours of citizens and how they would associate with the eCrew approach,
         barriers, motivators

This section is divided into two parts.
In the first, there is an assessment of the attitudes of Italians towards environmental issues, climate change and
energy transition using results from Eurobarometer special surveys (490– Climate Change, 492- European
attitudes on Energy Policy and 501 - Attitudes of European citizens towards the environment)..
In the second, data from the Italian Statistical Institute are provided to describe various aspects of electricity use
and consumption.

5.1.1      Attitudes towards environmental issues and energy2
As for the concerns about environmental issues (Eurobarometer, 2019c), Italians seem to be aware of the
relevance, but slightly less concerned than other EU citizens. 94% of Italian respondents to the Special 501
declared that protecting environment (QA1) is important, very important for 43% (Vs 53% of EU citizens) and fairly
important for 51% (vs 41% of EU citizens). Asked to identify the most effective solutions for environmental problems
(QA10) Italians seem to feel less confident in the role that citizens can directly play in driving changes (28% Vs EU
33% identify changing the way we consume as an option), while, in comparison with EU citizens, they are more
prone to rely on public interventions in demanding more information, stricter legislation and related fines and
stronger enforcement of legislation
When it comes to energy policy (Eurobarometer, 2019b), in line with EU citizens, Italians consider it mainly as a
tool to shift from fossil fuels to renewables (QB1, the highest share among the available modalities with a 37% of
respondents, in any case less than 41% of other EU citizens), but a substantial proportion consider it also as a
way to contribute to economic growth and innovation (QB4, 34%, a share consistently higher than the EU 24%).

2
    For each of the question considered the code is reported in brackets.

eCREW Policy Brief #1 (December 2020)                                                                    Page 16 of 25
In terms of the prioritizing of energy issues by the EU (QB9), Italians are in line with the EU citizens identifying the
development of clean energy technologies as the main driver (42% Vs EU 47%), followed by energy costs (34% vs
EU 37%). Quite surprisingly, they are more in favor of better information to increase awareness in energy choices
(providers, savings, etc.) (30% vs EU 26%).
Regarding energy consumption, if we take the knowledge about the energy efficiency EU label (A to G classes) as
a proxy of awareness, Italians are less consumer aware than the rest of EU citizens (QB6). Only 67% of the Italian
respondents declare that they understand labels and meanings (vs EU 79%) while 19% declare that they
understand labels but ignore meanings (vs EU 14%) and 13% (vs EU 7%) do not understand it. Surprisingly, but
it sounds as an additional evidence of a relative low level of awareness, the EU label seems to affect purchasing
choices of Italians, 85% of who (vs EU 79%) declare to take into consideration the label when i choosing electric
appliances.
Finally, regarding Climate Change (Eurobarometer, 2019a) more than eight in ten of those surveyed in Italy
consider climate change to be a ‘very serious’ problem (QB2, 84%, above the EU average of 79%). Almost one in
five believe it is the single most serious problem facing the world (19%, under the EU average of 23%), an increase
of 12 percentage points (pp) since the last survey in 2017. Just over half say that they have taken personal action
to fight climate change in the past six months (QB5, 52% vs the EU average of 60%), a significant increase of 18
pp since 2017. The proportion increases to 88% (QB6, vs the EU average of 93%) when given specific examples
of climate actions. There has been an increase in the number of respondents who take lower energy consumption
into account when buying new household appliances (an increase of four pp since 2017 to 39%, though less than
the EU average of 48%), and that regularly use environmentally-friendly alternatives to private cars (an increase
of six pp to 19%, though this remains below the EU average of 37%). The proportion who agree that adapting to
the adverse impacts of climate change can have positive outcomes for citizens is 62%, lower than the EU average
of 70%. Those surveyed in Italy are more likely now than they were in 2017 to agree with the importance of their
national government supporting improved energy efficiency by 2030 (up five pp to 91% vs the EU average of 89%).
Most importantly, 92% of respondents (equal to the EU average) support the aim of a climate-neutral EU by 2050.
5.1.2 Energy consumption and use
In comparison with the EU average (Euro Area and EU27) Italian households overall consume less energy, they
have a relatively higher share of consumption for space heating and cooking and a relatively lower share of
consumption for water heating and lighting, Table 4.
Table 4 – Households energy consumption by final use, (2018)
Total (TJ) Uses (% of total)
Area lighting and
Total per 100 space water other end
space heating cooking electrical
consumption people cooling heating use
appliances
Italy 1.342.115 2,224 66,55 0,67 12,35 6,56 12,49 1,38
Euro area 7.900.556 2,305 63,48 0,43 14,52 6,01 14,75 0,81
EU27 10.281.989 2,297 63,61 0,37 14,77 6,10 14,15 1,00
(Source: Eurostat, 2018)
Here in the following and in Table 5 and Table 6 are reported the main results of the survey carried out by the Italian
National Institute of Statistics in 2014
- Almost all families reside in homes equipped with heating systems, while cooling systems are less widespread
(only 3 out of 10 families)
- There are wide territorial differences in the diffusion of air conditioning equipment: only 1.5% of families residing
in the Aosta Valley, and nearly 50% of those residing in Sardinia
eCREW Policy Brief #1 (December 2020) Page 17 of 25- The main energy source for the home heating systems is methane, used by over 70% of families.
- In 2013, households spent a total of over 42 billion euros on energy consumption, with an average expenditure
per family of 1,635 euros.
- Household energy consumption expenditure is higher in the North and more contained in the South, with a
differential exceeding 400 euros (30% more than the expenses incurred in the South).
- Average annual expenditure grows with the number of family members and with age. A young single-member
family spends on average around 650 euros less than a couple with 3 or more children.
- The heating systems in the home is in use almost every day during the winter season for 87% of families, with
significant territorial differences (98% in Bolzano and 62% in Sicily).
- Several years after the retirement of traditional light bulbs from the market, energy saving light bulbs already
represent almost three quarters of the light bulbs used.
- Families declare that they have made investments in energy saving in the last 5 years: over half of all families, to
reduce electricity costs, 21%, for home heating costs, 15% for home water costs, and, finally, 10% for air
conditioning (ISTAT, 2014).
Table 5 – Households yearly expenditure for energy consumption, by source (%) (2014)
Area Electricity Methan Diesel LPG Wood Total (€)
North 30,25 57,1 5 3,9 3,7 1831
Center 36,8 48,4 3,3 5,9 5,5 1527
South & Islands 45,5 35,3 2,6 9,6 7 1387
ITALY 35,5 49,8 4 5,8 4,9 1635
(Source: ISTAT,2014)
Table 6 – Households endowment with electrical appliances (% of total households) (2014)
Air conditioning Light bulbs Other appliances
Hours per day Energy saving traditional Dishwas
of which… Freezer Dryer
Area % of in summer bulbs bulbs her
households Heating & Almost Only if
Cooling every day needed
North 31,3 61,3 28,5 38,8 4,9 69,90 30,1 28,7 46,65 5,3
Center 24,0 68,6 27,7 39,4 4,2 74,60 25,4 26 43,5 3,4
South &
32,2 77,6 31,0 35,0 4,3 73,1 26,9 21 25,5 1,3
Islands
ITALY 29,4 68,1 29,2 37,6 4,5 71,8 28,2 25,3 39,3 3,3
(Source : ISTAT ,2014)
5.2 Current status of communities in terms of energy-related endeavours
In Italy, self-consumption in 2019 amounted to 4,718 GWh, equal to 19.9% of the total production of photovoltaic
systems and 38.6% of the production of only systems that self-consume. The highest level of self-consumption is
registered in July, while the highest self-consumption rates are found in the winter months (Ministry of Economic
Development, 2020). Table 7 shows the heterogeneity of self-consumption in Italy by region and macroarea. In
absolute value, the highest self-consumption is in Lombardy and the lowest in the Aosta Valley while the ratio
between self-consumption and the net production of self-consuming plants was highest in the provinces of Trento
and Bolzano, and is generally higher in Northern Italy.
eCREW Policy Brief #1 (December 2020) Page 18 of 25Table 7 – Electricity self-consumption by macroarea and region, 2019 (GwH).
Macroarea Gwh Macroarea Region Gwh Macroarea Region Gwh
North 2622,7 North Piemonte 376,5 Center Marche 190,8
Center 781,5 North Valle d'Aosta 7,8 Center Lazio 251,7
South &
1313,7 North Lombardia 785,6 S&I Abruzzo 121,4
Islands
ITALY 4717,9 North Trentino A.A. 161,3 S&I Molise 19,4
North Veneto 584,3 S&I Campania 235
North Friuli Venezia Giulia 141,9 S&I Puglia 295,1
North Liguria 39,6 S&I Basilicata 42,3
North Emilia Romagna 525,7 S&I Calabria 124,4
Center Toscana 243,4 S&I Sicilia 268,3
Center Umbria 95,6 S&I Sardegna 207,8
Although all the households owning photovoltaic systems are self-consuming, the highest percentages of self-
consumption are found in the tertiary and industrial sectors. Out of the 23,689 GWh produced in Italy in 2019, 52%
is generated by the industrial sector (which also includes photovoltaic power plants), 20% by the tertiary sector,
15% by the domestic sector and 13% by the agricultural sector. The industrial sector is characterized by the highest
self-consumption (34% of the 4,718 GWh self-consumed in Italy in 2019), followed by the tertiary sector (30%), the
domestic sector (26%) and the agricultural sector (10%) (Ministry of Economic Development, 2020).
Regarding the community endeavour projects in the energy fields, Magnani and Osti (2016) provided a wide study
about the involvement of civil society in the production and management of renewable energy that dates back to
the first half of the 20th century, although in a limited area of the country in Trentino Alto Adige, a small region in
the northern-east alps. The so called "historic hydroelectric cooperatives" were established at that time in that area
to support the social and economic development of the alpine region through the provision of electricity produced
from hydroelectric plants. The regulatory framework favoured this process since the nationalization of the electricity
grid allow these cooperatives to retain ownership of the local grid. Today thirty cooperatives still exist in this area
after decades of development they have become big organizations selling energy to thousands of customers. In
addition to hydroelectric production, in this area can be found also many communities built upon the use of wood
biomass for producing heat that sometimes developed towards the construction of district heating systems. Behind
the success of the community based model in this area (an exception in Italy) there is a long tradition of local
cooperation that took advantage of a contingent regulatory framework, a combination of enabling factors that is not
easily replicable elsewhere (Magnani and Osti, 2016).
In more recent years, Candelise and Ruggeri (2020) noticed that following quite a while of inaction, the CE sector
in Italy has encountered another wave of development around 2010 with the improvement of activities focused on
people engagement in the energy field. Small local energy communities were the main actors of this development,
mostly focused on production of electricity from PV plants below 100kW while wider initiatives able to develop
megawatt size plants were very few. The pivotal leverage for this new wave was the Feed in Tariffs scheme,
implemented in Italy in the first decade of 2000 that made investments in PV development at the same time
profitable and low risk, thus paving the way for people to share ownership of small local projects. But the
discontinuity of incentive mechanisms such as the Feed in Tariff and the reintroduction of more market-oriented
and auction-based mechanisms, affected the possibility of the sector to scaling-up to the development of large
plants or the replication of the smaller projects and showed that new approaches were needed.
At present, in Italy there are around 35 Ecovillages (https://ecovillaggi.it/), around 60 Alpine Coops (a heritage of
the historic hydroelectric cooperatives, see www.sev.bz.it) and around 20 2nd wave Energy communities described
by Candelise and Ruggeri (2020), the most relevant of which are reported in Table 8.
eCREW Policy Brief #1 (December 2020) Page 19 of 25Table 8 - Energy Communities in Italy, 2020
Initiatives Start Date Primary Activtiy Technology Geographical scope
Electricity Production &
Retenergie 2008 PV National
Services
Dosso Energia 2010 Elctricity Production PV Local
Electricity Production &
Società LEDRO 2007 PV Local
Services
èNostra 2014 Electricity Supply National
Electricity Production &
Melpignano 2011 PV Local
Services
Kennedy Energia 2013 Elctricity Production PV Local
Sole per tutti 2011 Elctricity Production PV Local
Comunità Energetica
2011 Elctricity Production PV Local
San Lazzaro
Comunità Solare Electricity Production &
2011 PV Local
Locale Services
Un ettaro di cielo 2008 Elctricity Production PV Local
Impianto Eolico Monte
2014 Elctricity Production Wind Local
Mesa
Energyland 2011 Elctricity Production PV Local
Masseria del Sole 2013 Elctricity Production PV National
Fattoria del Sole 2015 Elctricity Production PV National
Fattorie del Salento 1 2017 Elctricity Production PV National
Fattorie del Salento 2 2017 Elctricity Production PV National
PV, wind, hydro,
Energia Positiva 2016 Elctricity Production National
energy saving
Source: Candelise and Ruggeri (2020)
5.3 Role of central government in energy transition – with special emphasis on their positions
with respect to the eCrew approach
As widely described in section 4, due to the combination of the Decreto Milleproroghe (art42. L.8/2020), the scheme
of incentives approved by the Ministry of Economic Development (DM 16/09/2020) and the regulation provided by
the national authority ARERA (318/2020), at present, in Italy is permissible to launch a citizen or renewables energy
community .
A negative effect was caused by the interruption of Feed in Tariffs scheme. After the cancellation in 2013, only a
few CE initiatives have developed renewable energy plants, those that were larger and with a national scope in
their activities, or those promoted by commercial actors. In addition, very few of those still operating after 2013
developed new renewable energy plants, and have mostly focused their activity on acquiring operating PV plants
on the secondary market, which are still benefiting from the FiT support (Candelise and Ruggieri, 2020).
5.4 Role of local administrations (e.g. regional, municipalities) in energy transition – with
special emphasis on their positions with respect to the eCrew approach, barriers,
motivators
Presently only few regions adopted a specific discipline on the subject.
For instance, Piedmont adopted the L.R. August 3, 2018, n. 12 in order to promote the establishment of energy
communities. From the point of view of the administrative bodies involved, some functions are assigned to the
eCREW Policy Brief #1 (December 2020) Page 20 of 25Regional Council and others to a permanent technical table for the coordination between the Region and the Energy
Communities.
Shortly after, Puglia adopted the L.R. August 9, 2019, n. 45 and Liguria the L.R. July 6, 2020, n. 13.
6 Conclusion
6.1 Country Profile (based on inference from previous sections, aspects to be considered with
respect to the eCrew approach)
Italy is a considerably heterogeneous country, therefore, to ensure eCREW success, the implementation strategy
should take into account:
-age and education of population (eCREW is a high-tech project)
- income and energy consumption and use (eCREW requires awareness about energy)
- economic profile of the target area (as a proxy of technological readiness of the area)
For instance, implementation in Emilia Romagna, with its highly paid well-educated employees in manufacture is
different than in Calabria or Sicily.
Renewables have gained relevance in recent years, but Italy is still a fossil-based energy system with a strong
dependence on gas imports, which, jointly with oil, feed the thermoelectric power production that continues to
provide around 65% of the total power installed.
6.2 A quick SWOT analysis of the legislative and administrative framework with respect to the
eCrew approach
6.2.1 Pointers from legislation
Strengths: the implementation of RRED and REMD into Italian law is being examined by the Italian Parliament and
should be concluded by the end of 2020.
Weaknesses: both national and regional law (e.g. Piedmont law n. 12/2018) concerning energy communities have
strict boundaries regarding the provision of economic incentives.
Opportunities: The Ministry of Economic Development could take inspiration from other European legislations of
those countries that have already adopted measures to promote the creation and development of energy
communities.
Threats: presently only four regions (Calabria, Liguria, Piedmont, Puglia,) out of twenty have adopted a specific
regional law concerning energy communities.
6.2.2 Pointers from administrative framework
Strengths: the cooperation between the Ministry of Economic Development and ARERA (Italian authority
responsible for the regulation of energy) in the definition of measures and strategies designed to establish
favourable administrative, economic and social conditions to develop energy communities.
Weaknesses: presently, the dispositions to implement energy communities do not sufficiently take the stakeholders’
role into consideration.
Opportunities: the European resources that will be given to implement projects aiming to increase the use of
renewable energies within the Next Generation EU Program.
eCREW Policy Brief #1 (December 2020) Page 21 of 25You can also read