Solar Photovoltaic Electricity Generation: A Lifeline for the European Coal Regions in Transition - MDPI
←
→
Page content transcription
If your browser does not render page correctly, please read the page content below
sustainability

Article
Solar Photovoltaic Electricity Generation: A Lifeline
for the European Coal Regions in Transition †
Katalin Bódis, Ioannis Kougias , Nigel Taylor and Arnulf Jäger-Waldau *
 European Commission, Joint Research Centre (JRC), Via E. Fermi 2749, I-21027 Ispra (VA), Italy
 * Correspondence: Arnulf.Jaeger-Waldau@ec.europa.eu
 † The scientific output expressed is based on the current information available to the authors, and does not
   imply a policy position of the European Commission.

 Received: 21 May 2019; Accepted: 2 July 2019; Published: 5 July 2019

 Abstract: The use of coal for electricity generation is the main emitter of Greenhous Gas Emissions
 worldwide. According to the International Energy Agency, these emissions have to be reduced by
 more than 70% by 2040 to stay on track for the 1.5–2 ◦ C scenario suggested by the Paris Agreement.
 To ensure a socially fair transition towards the phase-out of coal, the European Commission introduced
 the Coal Regions in Transition initiative in late 2017. The present paper analyses to what extent the use
 of photovoltaic electricity generation systems can help with this transition in the coal regions of the
 European Union (EU). A spatially explicit methodology was developed to assess the solar photovoltaic
 (PV) potential in selected regions where open-cast coal mines are planned to cease operation in the
 near future. Different types of solar PV systems were considered including ground-mounted systems
 developed either on mining land or its surroundings. Furthermore, the installation of rooftop solar
 PV systems on the existing building stock was also analysed. The obtained results show that the
 available area in those regions is abundant and that solar PV systems could fully substitute the current
 electricity generation of coal-fired power plants in the analysed regions.

 Keywords: solar photovoltaics; PV potential; coal power plant; Paris Agreement

1. Introduction
     In 2017, coal provided 26.8% of the worldwide total primary energy supply and was used to
generate 9848 TWh of electricity representing 38.4% of the total production [1]. At the same time,
the use of coal was responsible for 14.5 Gt of energy-related carbon dioxide (CO2 ) emissions (44.3% of
the total). To limit the global temperature increase below 2 ◦ C, as envisaged by the Paris Agreement,
CO2 emissions from coal have to be reduced from 10.5 Gt in 2017 to about 1 Gt by 2040, according to
the International Energy Agency (IEA).
     In addition to the CO2 emissions mentioned above, coal-fired power plants emit methane (CH4 )
and are the largest source of sulphur dioxide (SO2 ) from human activities. SO2 is a major contributor
to the production of acid rain and due to its transformation into particulates in the atmosphere, it is
responsible for significant health problems like chronic bronchitis, aggravated asthma, and it can
cause premature death. The particulate formation that also happens with nitrogen oxides is key to
ground-level ozone (O3 ) and causes smog and respiratory illnesses. Further pollutants from coal-fired
power stations include arsenic (As), cadmium (Cd), carbon monoxide (CO), hydrocarbons, lead (Pb),
mercury (Hg), volatile organic compounds (VOCs) and other toxic heavy metals [2].
     Besides the air polluting effects of coal-fired power plants, the consequences for the local water
supply have s to be considered as well. Coal mining, be it open-pit mining, mountain top mining
or deep ground mining can have severe environmental impacts on groundwater levels and also

Sustainability 2019, 11, 3703; doi:10.3390/su11133703                         www.mdpi.com/journal/sustainability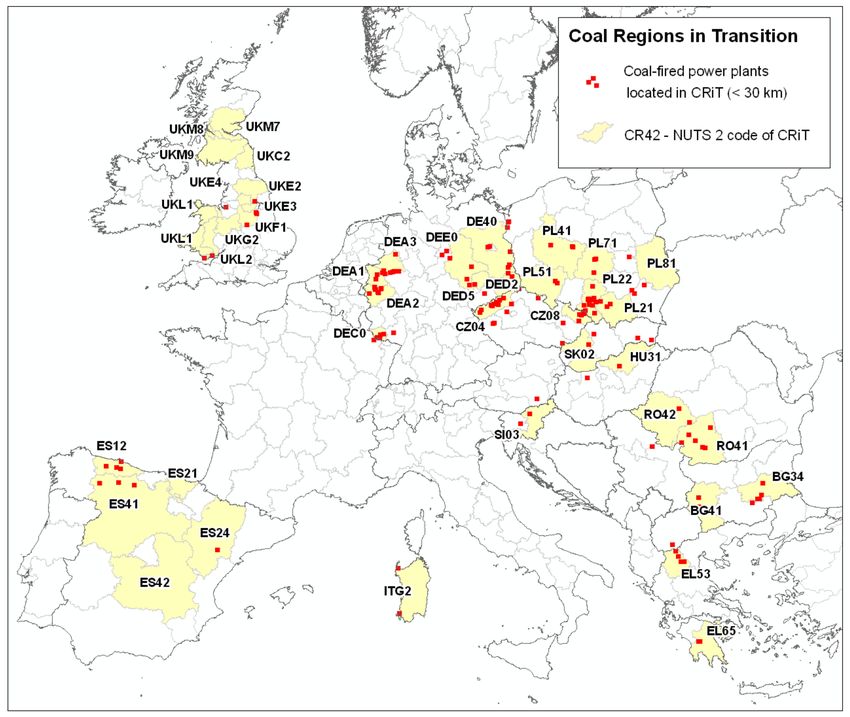
Sustainability 2019, 11, 3703                                                                       2 of 14

contaminates nearby water resources like rivers, lakes or aquifers [3]. The contamination is caused by
highly acidic water pumped from the mines, which contains heavy metals like As, copper (Cu) and Pb.
     Another concern is coal ash, which remains after coal is burned. Coal ash contains significant
amounts of toxic elements such as, Hg and Pb. The actual concentrations and composition of these
toxic elements are determined by the type of coal used. Parts of the ash may be re-used, for example,
to produce cement, but most of it is stored in landfills or ponds, which represent a safety risk if not
maintained properly. In the latter case, heavy metals contained in the ash can diffuse into waterways
nearby and lead to contamination of drinking water. Human exposure to coal ash is related to an
increased risk for a number of serious health problems like cancer, heart damage, neurological disorders
and reproductive problems [4].
     Last but not least, coal-fired power stations need a vast amount of water for their operation.
On one hand, water is needed to generate steam to drive the generator turbine, and on the other, water
is needed to cool the plant. Three modes of cooling can be distinguished:

•     Once through: These systems use water from nearby sources like aquifers, lakes, rivers or
      the ocean to cool the condensers and discharge the warm water back into the original source.
      The discharge of “heated” water has an impact on local aquatic species and can, for example,
      decrease fertility or reduce the oxygen content of the water. During heat waves, the extraction of
      water from such local sources can be limited in order to mitigate the temperature increase and
      protect the aquatic species.
•     Wet-recirculation or closed-loop: In general, these systems use cooling towers where the water
      is exposed to ambient air. As some of the water evaporates before it is sent back to the power
      plant condenser, such systems take less water but have higher water consumption than plants
      using once-through cooling systems.
•     Dry-cooling: In these systems, air is used to cool the steam from the turbine. Such systems can
      decrease the water consumption by up to 90%; however, this comes at higher costs and lower
      efficiencies in general, which require more coal and result in an increased environmental impact
      per unit of electricity produced.

      All these factors are increasing the pressure on governments and private investors to end the
use of coal for energy purposes. Since 2013, the number of financial institutions divesting from fossil
energy companies is increasing. The funds committed to fossil fuel divestment increased to more than
USD 6 trillion, according to an article in the Guardian, dated 10 September 2018 [5]. At the United
Nations Framework Convention on Climate Change (UNFCCC) Conference of the Parties (COP)
23, the Powering Past Coal Alliance was formally launched, whereby nations and states committed
to move from burning coal to cleaner power sources. Their founding declaration states: “To meet
the Paris Agreement, analysis shows that coal phase-out is needed no later than by 2030 in the
OECD and EU28, and no later than by 2050 in the rest of the world” [6]. Six new members joined
the Alliance on the occasion of the COP24 in December 2018 and the Alliance currently includes
80 members, which represent 30 national governments, 22 sub-national governments and 28 businesses
or organisations.
      Just before the COP24 meeting in Katowice in December 2018, the European Commission published
its strategic long-term “Vision for 2050–A Clean Planet for All,” which outlines its ambition to realise a
climate neutral economy [7]. To realise its goals, the share of renewable energy sources (RES) in EU has
to exceed 60% by 2050 and the use of coal has to be drastically reduced.
      Coal is still mined in 42 regions across 12 EU countries and represents the most available local
fuel in the EU with significant economic activity [8]. Coal-fired power stations still operate in 21 EU
Member States (MS) and represent about a quarter of the EU’s electricity production. The 248 coal
power plants that are operational in the EU (as of February 2019), have a total power capacity of
152.5 GW. Approximately two-thirds of these plants use hard coal (170 plants with a total capacity of
97.1 GW) and the remaining plants use lignite as fuel (78 plants with a total capacity of 55.4 GW) [9].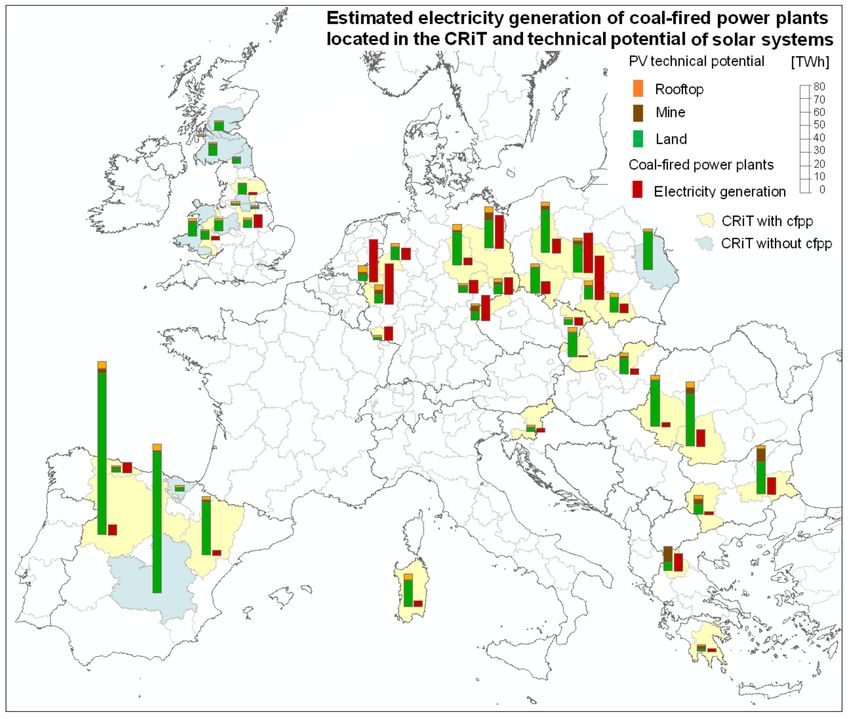
Sustainability 2019, 11, 3703                                                                         3 of 14

The EU’s annual electricity production from coal and other solid fuels was 692 TWh in 2016 [10], albeit
on a decreasing trend. Presently, 14 European Union MS have already joined the Powering Past Coal
Alliance, showing their commitment to advance the transition of these regions from coal powered
energy generation to clean energy [6]. An economically viable and socially fair transition process
towards phasing-out coal energy use is thus needed to honour the “well below 2 ◦ C” target of the
Paris Agreement.
      The interest in synergies between renewable power and mining activities (or mines’ closure)
has grown in recent years and a number of solar, wind and battery storage installations have been
tested in mining sites. By 2018, almost 2 GW of renewable power was commissioned and announced
at mine sites, with the sector’s investment in RES being anticipated to double by 2022 [11]. Solar
photovoltaic (PV) electricity generation represents 37% of such investments [12] as it is a mature
technology with continuously decreasing production costs. Using abandoned open-cast coal mines
and their surroundings for the installation of utility-scale solar PV systems is an approach with several
advantages. In the case of proximity to a coal power plant, such an approach takes advantage of
the grid infrastructure that is already in place. Additional advantages are the existing infrastructure
(e.g., access roads, fencing), trained personnel. Using reclaimed mine land for solar energy projects is
particularly attractive for the mine’s post-closure phase. Mining concession areas are generally larger
than the mined area. Moreover, mining operations expand progressively during the operation lifecycle
of the mine and portions of the site can thus be used for renewable power production.
      The closure and reclamation of a mine operation involves obligations to restore, manage and
monitor the closed site. At that point, the mine becomes a liability for the owning company [12] and
the deployment of solar PV systems provides an opportunity for an alternative revenue source.
Such installations can be combined with remediation works because reclaimed tailing dams provide
wide flat areas that do not require clearing and are ideal for ground-mounted PV systems [13].
The utilisation of such degraded land for solar PV system installation can be part of an integrated coal
mine reclamation and benefit from relevant funding. This could also address an important bottleneck
in the exploitation of solar potential, i.e., land availability. Equally important is that obtaining licenses
to operate in the mine’s rehabilitated brownfield land may be easier and faster because generally there
is no public opposition and no competition with agricultural activities. Abandoned mining sites do
not favour traditional commercial or industrial reuse opportunities [14]. Thus, solar PV systems in
mining sites are a viable option to help these regions in their transition from coal as a major source of
economic activities by substituting the coal-fired electricity production with renewable-based one.
      Examples of such a transformation include the 18 MW solar park next to the lignite power plant
in Visonta, Hungary [15], the 5 MW Kellingley solar farm in the UK, and the 44 MW solar facility,
Nanticoke Solar in Canada (near completion), which has been installed where the largest coal power
plant of North America was previously standing [16]. In China, the 50 MW Yangquan solar project
was installed on a collapsed coal mine.
      A recent scientific modelling study has simulated how a full energy transition in Europe across
the power, heat, transport, and desalination sectors could be realised by 2050 [17]. The study describes
the necessary technological mix of renewable energy sources, storage options and power to gas options.
It also analyses the economic consequences and the necessary political framework, which is mandatory
for such a transition. One of the key findings of the study is that photovoltaic electricity generation
will play a major role in this process. A common question asked in this context is whether or not
there is sufficient land available in the different geographic regions to realise such a scenario and what
are the potential land use implications. Therefore, the aim of this paper is to analyse the available
technical potential on a Nomenclature of Territorial Units for Statistics (NUTS) level NUTS-2 level in
the mentioned Coal Regions in Transition (CRiTs). The NUTS-2 regions are the basic regions for the
application of regional policies.
Sustainability 2019, 11, 3703 4 of 14
2. Materials and Methods
The present study focuses on EU regions with ongoing coal mining activities that intend to identify,
develop and implement projects to implement a viable economic and technological transformation.
In late 2017, selected EU regions were designated as Coal Regions in Transition (CRiT) according to the
relevant terms of reference [18]. CRiT regions span 12 EU Member States and are defined at a territorial
classification of NUTS-2 level (basic regions for the application of regional policies). Economic activities
in these regions are closely linked to operational mines and coal-fired power plants. Figure 1 illustrates
the CRiT regions with light yellow colour and provides the corresponding NUTS-2 classification codes.
It also shows the operational coal-fired plants that are located inside the CRiT or in their vicinity, that is,
within a 30 km distance. In total, 111 coal-fired stations operate within the CRiT (83.2 GW) and another
20.5 GW are located within a 30 km distance (Figure 1).
Figure 1. EU Coal Regions in Transition (CRiT) and coal power generation plants. Data source: [15].
A detailed list of the CRiT is provided in Table 1, together with their NUTS-2 classification [19].
The expected yearly sum of electricity generated by a 1 kWp solar PV system in the region is also
provided.. These values correspond to the regional average for a representative PV system configuration
(see Section 2.4) and can act as a proxy to distinguish regions with particularly advantageous
solar resources.
Table 1. EU Coal Regions in Transition, NUTS codes and average annual solar electricity output.
Nominal Nominal
NUTS 2016 Region Annual Yield NUTS 2016 Region Annual Yield
kWh/kWp kWh/kWp
BG34 Yugoiztochen 1317 PL21 Malopolskie 1010
BG41 Yugozapaden 1274 PL22 Slaskie 1015
CZ04 Severozápad 1008 PL41 Wielkopolskie 1018
CZ08 Moraskoslezko 1015 PL51 Dolnoslaskie 1022
DE40 Brandenburg 1002 PL71 Lodzkie 1020Sustainability 2019, 11, 3703 5 of 14
Table 1. Cont.
Nominal Nominal
NUTS 2016 Region Annual Yield NUTS 2016 Region Annual Yield
kWh/kWp kWh/kWp
DEA1 Düsseldorf 985 PL81 Lubelskie 1028
DEA2 Köln 987 RO41 Sud-Vest Oltenia 1264
DEA3 Münster 970 RO42 Vest 1180
DEC0 Saarland 1040 SI03 Vzhodna Slovnija 1154
DED2 Dresden 1007 SK02 Stredne Slovensko 1147
Northumberland &
DED5 Leipzig 1033 UKC2 864
Tyne & Wear
DEE0 Sachsen-Anhalt 1008 UKE2 North Yorkshire 883
EL53 Dytiki Makedonia 1365 UKE3 South Yorkshire 913
EL65 Peloponnisos 1525 UKE4 West Yorkshire 882
Derbyshire and
ES12 Principado de Asturias 1141 UKF1 919
Nottinghamshire
Shropshire and
ES21 País Vasco 1164 UKG2 919
Staffordshire
ES24 Aragón 1558 UKL1 West Wales & Valleys 909
ES41 Castilla y León 1511 UKL2 East Wales 906
ES42 Castilla-La Mancha 1626 UKM7 Eastern Scotland 806
HU31 Észak-Magyarország 1168 UKM8 S.W. Scotland 793
ITG2 Sardegna 1510 UKM9 North Eastern Scotland 828
The analysis provides an assessment of the technical potential to generate electricity from
photovoltaic systems in each of the 42 coal extraction CRiT regions (NUTS-2 level, 2016 definitions) [19].
It assessed the areas that are technically available for ground-mounted and rooftop systems and the
corresponding annual electricity production of an idealised PV system. Both the potential installed
capacity and the annual energy yield are reported.
2.1. Ground-Mounted Systems on Open-Pit Mines
In the present study, a spatial data layer of 405 open-pit coal mines was developed based on the
spatial distribution of mining areas suggested by the CORINE Land Cover data set [20]. This input
data was extended by the EC Joint Research Centre’s Coal Mine Database (JRC-CMDB), developed
in 2017 [8] and combined with manually digitised vector data based on satellite imageries. The final
geodata set contains the following attributes of the mining areas, which are additional to the original
sources: geographic coordinates of the mining centroids, orthogonal area (m2 ) of the open-pit mine,
perimeter (m) of the mining sites, location-specific nominal PV yield (kWh/kWp), location-specific
yield of the PV system (kWh/m2 ), suitable area for PV installation based on morphometric parameters,
modelled technical yield (GWh/year), and estimated technical power capacity (GW).
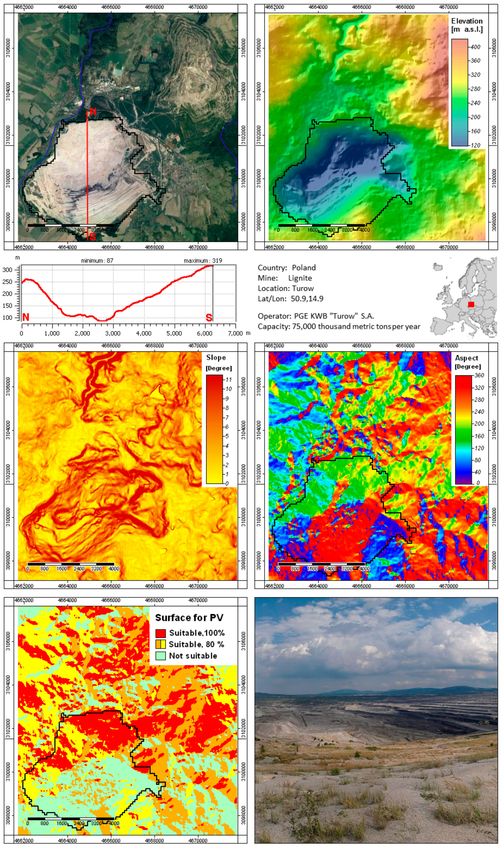
Mapping the suitability of open-pit mines for PV systems was completed by digital terrain analysis
using the latest EUDEM25 (ver.1.1.) with a spatial resolution of 25 m [21]. Mining surfaces fulfilling
the following pre-set conditions were considered potentially suitable for PV system installation if they
had moderate steepness (criterion i) and a favourable azimuth (criterion ii):
i. slope inclination: ≤30 degrees
ii. slopes’ azimuth faces to the east (45◦ –135◦ ), south (135◦ –225◦ ) or west (225◦ –315◦ ), where 0◦
marks north.
The PV yield was determined by the available surface in each class multiplied by the relevant
nominal annual yield of PV system shown in the third column of Table 1. Correction factors were
applied for east- and west-facing slopes as such installations are expected to produce approximately
20% less electricity compared to south-facing systems installed at the same location. Figure 2 shows the
site selection steps in the example of a 22 km2 mining area in Lower Silesia (Turów coal mine, Poland,
Dolnoslaskie, PL51).Sustainability 2019, 11, 3703 6 of 14
Figure 2. Digital terrain analysis (surface modelling, north-south profile cross-section, digital elevation
model, slope steepness and aspect characteristics) and suitability mapping for PV system installation in
one of the analysed mines. (aerial photo from Google, 2018, panorama photo seen from the west in
2012, Wikipedia).Sustainability 2019, 11, 3703 7 of 14
2.2. Ground-Mounted Systems on CRiT Surrounding Areas
The potential installation of ground-mounted systems was estimated by assessing suitable areas in
the selected regions. The analysis started with the CORINE Land Cover data set [19], which provides
data on the type of land cover for the EU and candidate countries at a resolution of 100 m and is
divided into four overall classes:
(1) Artificial surfaces (urban areas, buildings, road and rail networks, ports, airports, mineral
extraction sites, sports facilities, etc.),
(2) Agricultural areas (arable lands, rice fields, vineyards, pastures, agro-forestry areas, etc.),
(3) Forest and semi-natural areas (scrub and/or herbaceous vegetation, bare rocks, dunes, etc.),
(4) Glaciers, wetlands and water bodies.
Class 1 was excluded since the building rooftop area is calculated separately (see below). Other
artificial surfaces or inland water bodies could also be exploited e.g., parking areas, roads, urban waste
sites, lakes, reservoirs, but refined location-specific analyses are needed to systematically address these
opportunities. Classes 3 and 4 were also excluded as the installation of solar PV systems should not
involve deforestation or have a negative impact on natural areas. Moreover, installing PV systems on
glaciers, wetlands and water bodies is either not possible or requires special designs (e.g., floating PV
systems [22]), a topic that exceeds the scope of the present study.
Accordingly, the analysis only included agricultural areas of CLC Class 2 to host ground-mounted
PV systems. Two sub-classes were considered from CLC Class 2: non-irrigated arable lands (CLC 211)
and pastures (CLC 231). These were then subject to two further restrictions:
(a) Protected areas according to the Natura 2000 database [23] were excluded (on average this
accounts for 6% of arable land and 16% of pastures).
(b) Land forms where slopes are steeper than 20 degrees or north-facing and steeper than 5 degrees
were excluded. On average, the constraints related to terrain morphometry exclude 12% of arable
lands and 30% of pastures.
To analyse the relevant terrain characteristics (e.g. slope steepness, slope orientation/exposure/aspect,
surface roughness), the SRTM (Shuttle Radar Topography Mission) digital elevation model (DEM) with
a spatial resolution of approximately 30 m has been processed. The source SRTM dataset is available
from the Consortium for Spatial Information [24]. Following the application of the described constraints,
only a small fraction of the estimated land area (3%) was considered as suitable for ground-mounted PV
systems. The selection of this value was based on the EU average for value set-aside land. The latter
refers to arable land that farmers choose not to cultivate and devote to soil and environment conservation
uses. The average EU value is thus used here as a proxy for agricultural areas potentially available for
non-agricultural purposes. Notably, PV technologies are generally suitable for dual-use approaches that
combine electricity and agricultural production [25].
2.3. Rooftop-Mounted Systems
Buildings offer considerable potential for the deployment of PV and allow better geographic
correlation of supply and demand. A harmonized database on the EU building stock with the required
level of detail is lacking. To overcome this, a multi-layer approach was recently developed by the
authors [26] and it was applied in the analysed CRiT to determine the total detectable building footprint
area. To do this, the analysis used the land cover dataset and the European Urban Atlas to validate
information on EU built-up areas (to a resolution of 10 m × 10 m and 2.5 m × 2.5 m) derived from the
European Settlement Map [27,28]. The results were then refined using correction factors derived from
comparisons with cadastre data, as well as analysis of building-by-building LIDAR digital elevation
models for a limited number of benchmark locations.
The PV energy productivity was calculated for the rooftop locations following the methodology
described above for ground-mounted systems. While the assumption of array spacing may beSustainability 2019, 11, 3703 8 of 14
conservative for rooftop installations, it compensates for not addressing other factors such as
non-optimal orientation and shading effects.
2.4. Estimation of Potential Solar PV Output
To estimate the PV energy productivity, the instantaneous PV power at a specific location was
calculated taking into account the in-plane irradiance, spectral content of the sunlight, and the module
temperature, which depends on air temperature, wind speed and irradiance. The latter were obtained
by the up-to-date information available in the Photovoltaic Geographical Information System (PVGIS)
repository [28] maintained at the authors’ laboratory.
For the ground-mounted systems, the PV system mounting configuration was assumed to be
free-standing racks facing south at an inclination angle of 20 degrees (40 degrees for locations north of
60◦ N). The area required was calculated assuming 5.5 m2 per kWp of PV modules, i.e., 18.2% efficiency.
The distance between the module racks was calculated to avoid shadowing of one rack over other
modules, especially in winter. Calculation of the PV energy yield was performed using the JRC’s
PVGIS methodology [29], using hourly solar radiation data for the period 2005–2016. The calculation
assumes crystalline silicon modules, with balance-of-system losses of 10%. The anticipated annual
energy yield per unit of power (kWp) varies from 793 kWh/kWp in northern regions (see Table 1: South
Western Scotland, UK) to 1626 kWh/kWp in southern regions (Castilla-La Mancha, Spain). As these
values are spatial aggregations for each region based on past observations, a year-to-year variability of
the order of 5% is expected.
3. Results
Table 2 reports the results of the analysis for each region, listing the land area considered available,
the power capacity potential (in GW) and the relevant annual electricity yield if the power potential
is fully exploited. Results are provided per installation type; the columns on the left side show
the estimated solar PV technical potential for ground-mounted utility-scale systems in the CRiT.
The analysis shows a technical potential of 580.1 GW for such systems if only a fraction (3%) of the
suitable land in CRiT is utilised. A full utilisation of the estimated technical potential would require
7570 km2 of land and the expected annual electricity production would be 704.8 TWh.
Table 2. Calculated available surface, potential power capacity and annual electricity yield in CRiT per
installation type.
CRiT Available Land Suitable Mining Area Suitable Rooftop Area
NUTS
Area Power PV Yield Area Power PV Yield Area Power PV Yield
2016
km2 GW Twh/Year km2 GW TWh/Year km2 GW TWh/Year
BG34 198.0 18.2 24.0 88.3 7.2 9.5 23.7 2.2 2.8
BG41 64.4 6.0 7.6 34.2 2.8 3.6 27.3 2.5 3.2
CZ04 85.1 6.0 6.0 75.1 4.7 4.7 17.9 1.2 1.3
CZ08 54.9 4.0 4.0 0.0 0.0 0.0 18.6 1.3 1.4
DE40 328.0 20.6 20.6 94.6 5.7 5.7 72.6 4.6 4.6
DEA1 74.9 5.0 4.9 23.9 1.5 1.5 72.9 4.8 4.7
DEA2 97.3 6.7 6.6 51.2 3.1 3.1 63.6 4.3 4.3
DEA3 146.5 9.5 9.2 2.7 0.2 0.2 46.3 3.0 2.9
DEC0 22.2 1.6 1.7 0.5 0.0 0.0 19.8 1.4 1.5
DED2 102.8 6.9 7.0 32.5 2.0 2.0 35.1 2.4 2.4
DED5 66.5 4.4 4.6 9.7 0.6 0.6 21.0 1.4 1.4
DEE0 375.1 24.3 24.5 24.4 1.5 1.5 62.6 4.1 4.1
EL53 47.6 4.7 6.4 91.8 8.1 11.1 3.8 0.4 0.5
EL65 9.8 1.0 1.5 15.3 1.4 2.1 6.4 0.7 1.0Sustainability 2019, 11, 3703 9 of 14
Table 2. Cont.
CRiT Available Land Suitable Mining Area Suitable Rooftop Area
NUTS
Area Power PV Yield Area Power PV Yield Area Power PV Yield
2016
km2 GW Twh/Year km2 GW TWh/Year km2 GW TWh/Year
ES12 27.5 2.5 2.8 8.4 0.7 0.8 9.6 0.9 1.0
ES21 27.7 2.5 3.0 0.8 0.1 0.1 16.4 1.4 1.6
ES24 264.1 25.3 39.4 13.2 1.1 1.7 13.7 1.3 2.0
ES41 843.6 79.9 120.7 31.9 2.4 3.6 37.4 3.5 5.3
ES42 653.4 64.7 105.2 8.3 0.7 1.2 28.8 2.9 4.6
HU31 131.3 10.1 11.8 19.3 1.4 1.6 23.8 1.8 2.1
ITG2 133.5 13.1 19.9 1.0 0.1 0.1 32.0 3.1 4.7
PL21 152.9 10.9 11.1 3.9 0.3 0.3 36.0 2.6 2.6
PL22 130.8 9.1 9.3 10.2 0.6 0.7 47.1 3.3 3.4
PL41 489.7 31.2 31.8 51.1 2.9 3.0 42.9 2.7 2.8
PL51 275.1 18.7 19.1 12.0 0.7 0.7 37.6 2.6 2.6
PL71 303.8 19.9 20.3 51.7 3.1 3.1 27.7 1.8 1.9
PL81 407.7 27.3 28.1 0.5 0.0 0.0 30.8 2.1 2.1
RO41 345.4 30.5 38.5 50.7 3.9 4.9 38.9 3.4 4.3
RO42 343.7 29.1 34.4 2.8 0.2 0.2 34.9 2.9 3.5
SI03 34.2 2.8 3.3 0.7 0.1 0.1 16.2 1.3 1.5
SK02 209.8 16.2 18.5 1.1 0.1 0.1 42.8 3.3 3.7
UKC2 80.1 4.4 3.8 6.7 0.3 0.3 17.7 1.0 0.9
UKE2 150.8 8.8 7.7 4.2 0.2 0.2 11.0 0.7 0.6
UKE3 24.1 1.4 1.3 9.7 0.5 0.5 16.8 1.0 0.9
UKE4 25.4 1.5 1.3 7.6 0.4 0.4 24.7 1.5 1.3
UKF1 93.6 5.7 5.3 7.2 0.4 0.4 26.0 1.6 1.5
UKG2 141.2 8.8 8.1 1.6 0.1 0.1 23.8 1.5 1.4
UKL1 181.2 11.7 10.7 13.9 0.8 0.8 31.7 2.1 1.9
UKL2 104.8 6.7 6.1 3.1 0.2 0.2 17.5 1.2 1.1
UKM7 137.0 7.8 6.3 6.9 0.4 0.3 15.3 0.9 0.7
UKM8 15.5 0.9 0.7 1.9 0.1 0.1 15.9 0.9 0.7
UKM9 169.4 9.5 7.8 35.8 1.6 1.3 11.5 0.6 0.5
Total 7570.2 580.1 704.8 910.6 62.2 72.2 1220.3 88.0 97.3
The central part of Table 2 shows the estimated mine area that is technically fit to host
ground-mounted solar PV systems of utility scale. In addition to the regions’ surrounding area,
an additional 910.6 km2 of degraded land on mine sites could potential host utility scale PVs. A full
utilisation of the technical potential would add 62.2 GW of PV that is expected to produce 72.2 TWh
per year of operation.
The right side of Table 2 shows the available solar PV technical potential in existing buildings of
the analysed CRiT. The existing building stock in urban and rural areas of the analysed regions offers
a notable option for distributed rooftop PV systems. The total available net rooftop area that could
host PV systems is estimated at 1220.3 km2 . This area could potentially host an additional 88 GW of
small-scale rooftop PV with an annual electricity output of more than 97 TWh.
Thus, full utilisation of the identified technical potential in the CRiT (730.3 GW) could contribute
a total 874.3 TWh from PV, potentially replacing the electricity output of the current coal power plants
operating in the EU, provided that sufficient flexible production and storage capacities are added.
The installation of such a scale of PV systems would be revolutionary for the EU and global market asSustainability 2019, 11, 3703 10 of 14
it would be equal to installations six times higher than those existing at the end of 2018 (117 GW) in
the EU [30].
The estimated electricity generation of coal-fired power plants located in CRiT, and the modelled
technical potential of solar systems are visualised in Figure 3. It is shown that even a partial utilisation
of the estimated technical potential could replace (or even exceed) the current coal-based electricity
produced in most of the CRiT.
Figure 3. Comparison of estimated electricity generation of coal-fired power plants (CFPP) located in
the CRiT and the modelled technical potential of solar systems.
Accordingly, the gradual installation of large-scale solar farms could go hand-by-hand with the
planned decommission of existing coal power plants. The estimated output from the full exploitation of
the technical potential is 874.3 TWh and this could potentially compensate for the retired thermal units
if supported with proportionate storage-flexible units. A recent pan-European analysis implemented
by the authors also analysed the economic viability of rooftop PV systems in the EU, including
the CRiT [26]. Using retail electricity tariffs as a proxy, the analysis showed that almost half of the
available technical potential (47%) would produce electricity at a lower cost than the current retail
prices. This figure refers to rooftop systems and is an indication of the economic potential of PV in the
selected regions.
4. Discussion
The two types of PV systems described above have different economic rationales: ground-mounted
systems can vary between a few kWs to hundreds of MWs. The larger systems, that is, >50 MW are
also called utility PV plants. Such plants have the advantage of economies of scale, which reducesSustainability 2019, 11, 3703 11 of 14
capital investment costs (CAPEX) as well as operation and maintenance (O&M) costs. The electricity
generated by such plants can either be sold by a direct power purchase agreement (PPA) or traded in
electricity wholesale markets.
These large-scale installations are attracting increasing interest from institutional investors and
electricity companies alike. The competitiveness of such projects in general depends on the local
market conditions including competition amongst energy providers, policy stability, the regulatory
framework and access to capital [30,31]. PV PPAs and solar auctions in the 42 CRiT resulted in prices
as low as USD 45/MWh (EUR 40/MWh) in Spain up to USD 96/MWh (EUR 86/MWh) in Poland.
Rooftop installations have higher capital costs, which vary considerably in the European Union
between USD 1000/kWp (EUR 890/kWp) and 3000/kWp (EUR 2680/kWp). The variation is due to
different market conditions, building codes and local regulations. In addition, the value added tax (VAT)
can vary between 0% and 27%. However, electricity generated by rooftop PV systems can be consumed
either fully or in part on-site. Therefore, the competitiveness of PV power is correlated to the local
industrial or residential retail prices. Rooftop PVs also provide a better geographical match between
supply and demand. This fact is becoming more relevant due to increasing electrification rates in heating
and cooling as well as the transport sectors. Besides the self-consumption of PV generated electricity
in commercial buildings and single family homes, self-consumption for tenants in multi-apartment
buildings is gaining more and more attention, despite the existing regulatory challenges [32].
The rapid decarbonisation of our power supply is mandatory to stay on track towards a 1.5◦
scenario outlined in the special report of the Intergovernmental Panel on Climate Change (IPCC) [33].
Due to the rapid and massive increase of variable RES power capacity including multi GW PV
systems a new focus of attention now are the issues of integrating these RES power capacities into the
different power systems. Scientists have characterised the rapid upscale of renewables as the shift from
take-off phase-1 to a break-through phase-2 [34]. Phase-1 mainly relates to creating the framework for
emerging technologies to reach market maturity as well as creating the institutional and regulatory
frameworks. Solar PV technology has achieved that and reached phase-2, where the focus shifts away
from supporting the new technology towards enabling systems. In order to achieve a (very) high share
of PV in the power mix, more attention needs to be given to the pace of the transition [35]. This is
due to the additional required actions to balance the system as well as the impacts on the operation of
conventional thermal stations [36]. It is safe to assume that integration will be less challenging where
sufficient flexible and storage capacities are already in place, and the complementarity of technologies
is utilised [37]. A recent study by the Energy Watch Group and LTU University, which was presented
at COP24 in Katowice in December 2018, simulated how a 100% RES-based energy transition could be
realised by 2050 in Europe across the power, heat, transport, and desalination sectors [17].
The phase-out of coal for generating electricity is crucial to achieve this goal and offers additional
health benefits at the same time. In the European Union, the number of people employed in this sector
is estimated at about 240,000 (180,000 in the coal and lignite mining and 60,000 in coal and lignite
power plants) for which socially acceptable job alternatives are needed.
According to the USA Solar Census, about 0.17 full time work equivalents (FTE) per MW and year
of installed PV systems were needed for operation and maintenance (O&M) in 2018 [38]. However,
this number will decrease over the next decade due to increased automation and digitalisation of O&M
activities. The installation of larger PV systems requires about 3.5 FTE per MW. If the retirement of
coal and lignite mines as well as the coal fired power stations goes hand in hand with the installation
of larger PV systems over the next 15 years, the installation of 580 GW of PV power capacity could
provide about 135,000 construction jobs per year. If the O&M FTE were to halve over the next 15 years,
this sector could provide about 50,000 jobs by then. Additional jobs could come from the installation
and services for rooftop systems. However, quantification is more difficult as these jobs are more
dependent on local regulations and building codes.Sustainability 2019, 11, 3703 12 of 14
5. Conclusions
This paper analysed the technical potential to install solar photovoltaic electricity generation
system in the 42 EU CRiT. The available area is sufficient to generate the same amount of electricity that
all the coal and lignite-fired power stations currently generate in the European Union. The aim was to
show the technical potential, not to sketch a roadmap for how to achieve this. Possible pathways to
achieving power systems with very PV penetration have been addressed in several studies, notably
the 100% renewable plan from the Energy Watch Group and LTU University. However, that study
did not elaborate on the area requirements, which are addressed in this paper. It is recognised that
the energy transitions may vary substantially across regions and different transition pathways are
expected in different regions [35]. Again by analysing at regional level, differences among CRiT areas
are highlighted in the present study.
Further analysis also needs to be done in order to analyse the technical requirements of an energy
system for a phase out of coal through renewable electricity. Such an analysis then has to take into
account the actual load curves, the time variable generation of electricity, required storage capacities
and complementary additional renewable electricity generation sources.
Author Contributions: Each of the co-authors (K.B., I.K., N.T., A.J.-W.) contributed to the development of the
methodology to estimate the technical potential of solar photovoltaic systems. K.B. performed data mining and
exploratory analysis on the required information, designed and applied the geospatial decision-making model to
identify the suitable surfaces and PV yield of selected sites. She developed the harmonized GIS database and was
responsible for visualization. I.K. collected and processed the input data on power generation and analysed the
situation of coal-fired power plants. All authors (K.B., I.K., N.T., A.J.-W.) contributed to writing the text, have read
and approved the final manuscript.
Funding: This research received no external funding.
Conflicts of Interest: The authors declare no conflict of interest.
Abbreviations
The following abbreviations are used in this manuscript:
CAPEX capital investment costs
CFFP coal-fired power plant
COP Conference of the Parties
CRiT Coal Regions in Transition
EU European Union
IEA International Energy Agency
IPCC Intergovernmental Panel on Climate Change
MS European Union Member States
OECD Organisation for Economic Co-operation and Development
O&M operation and maintenance costs
PPA power purchase agreement
PV Photovoltaic
RES Renewable Energy Sources
References
1. International Energy Agency. World Energy Outlook; International Energy Agency: Paris, France, 2018;
ISBN 978-92-64-30677-6.
2. NSW Environment Protection Authority. Review of Coal Fired Power Stations Air Emissions and Monitoring; State
of NSW and Environment Protection authority: New South Wales, Australia, 2018; ISBN 978-1-925790-17-7.
3. Wright, I.A.; Paciuszkiewicz, K.; Belmer, N. Increased Water Pollution After Closure of Australia’s Longest
Operating Underground Coal Mine: A 13-Month Study of Mine Drainage, Water Chemistry and River
Ecology. Water Air Soil Pollut. 2018, 229, 55. [CrossRef]Sustainability 2019, 11, 3703 13 of 14
4. Córdoba, P. Emissions of Inorganic Trace Pollutants from Coal Power Generation, Air Pollution—Monitoring,
Quantification and Removal of Gases and Particles; IntechOpen: London, UK, 05 November 2018; Available
online: https://www.intechopen.com/books/air-pollution-monitoring-quantification-and-removal-of-gases-
and-particles/emissions-of-inorganic-trace-pollutants-from-coal-power-generation (accessed on 10 May
2019). [CrossRef]
5. Carrington, D. Fossil Fuel Divestment Funds Rise to $6tn, The Guardian. 10 September 2018. Available
online: https://www.theguardian.com/environment/2018/sep/10/fossil-fuel-divestment-funds-rise-to-6tn
(accessed on 8 May 2019).
6. Powering Past Coal Alliance: Declaration, 16 November 2017. Available online: https://poweringpastcoal.
org/about/Powering_Past_Coal_Alliance_Declaration (accessed on 8 May 2019).
7. European Commission Communication. A Clean Planet for All—A European Strategic Long-Term Vision for a
Prosperous, Modern, Competitive and Climate Neutral Economy; European Commission Communication: Brussels,
Belgium, 2018; Available online: https://eur-lex.europa.eu/legal-content/EN/TXT/?uri=CELEX:52018DC0773
(accessed on 8 May 2019).
8. Alves Dias, P.; Kanellopoulos, K.; Medarac, H.; Kapetaki, Z.; Miranda-Barbosa, E.; Shortall, R.; Czako, V.;
Telsnig, T.; Vazquez-Hernandez, C.; Lacal Arántegui, R.; et al. EU Coal Regions: Opportunities and Challenges
Ahead; EUR 29292 EN; Publications Office of the European Union: Luxembourg, 2018; ISBN 978-92-79-89884-6.
[CrossRef]
9. Europe Beyond Coal: European Coal Plant Database. Status: 12 Feb 2019. Available online: https:
//beyond-coal.eu/data/ (accessed on 8 May 2019).
10. European Environment Agency, Overview of electricity production and use in Europe, December 2018,
Kopenhagen, Denmark. Available online: https://www.eea.europa.eu/data-and-maps/indicators/overview-
of-the-electricity-production-2/assessment-4 (accessed on 03 July 2019).
11. Ernst & Young, Global Cleantech Canter. Mining: The Growing Role of Renewable Energy;
Ernst & Young, Global Cleantech Canter: London, UK, 2014; Available online: https:
//www.ey.com/Publication/vwLUAssets/EY_-_Mining:_the_growing_role_of_renewable_energy/$FILE/EY-
mining-the-growing-role-of-renewable-energy.pdf (accessed on 8 May 2019).
12. Maennling, N.; Toledano, P. The Renewable Power of the Mine: Accelerating Renewable Energy Integration; BMZ
and GIZ: Bonn, Germany, 2018.
13. Choi, Y.; Song, J. Sustainable development of abandoned mine areas using renewable energy systems: A case
study of the photovoltaic potential assessment at the tailings dam of abandoned Sangdong mine, Korea.
Sustainability 2016, 8, 1320. [CrossRef]
14. U.S. Environmental Protection Agency. Shining Light on a Bright Opportunity: Developing Solar Energy on
Abandoned Mine Lands; EPA: Washington, DC, USA, 2011.
15. Szabó, S.; Bódis, K.; Kougias, I.; Moner-Girona, M.; Jäger-Waldau, A.; Barton, G.; Szabó, L. A methodology
for maximizing the benefits of solar landfills on closed sites. Renew. Sustain. Energy Rev. 2017, 76, 1291–300.
[CrossRef]
16. Brown, F. Ontario utility OPG makes room for solar at demolished coal power plant. PV Magazine, Berlin,
Germany, 01 March 2018. Available online: https://www.pv-magazine.com/2018/03/01/ontarios-utility-opg-
makes-room-for-solar-at-demolished-coal-power-plant/(accessed on 8 May 2019).
17. Ram, M.; Bogdanov, D.; Aghahosseini, A.; Gulagi, A.; Oyewo, A.S.; Child, M.; Caldera, U.; Sadovskaia, K.;
Farfan, J.; Barbosa, L.S.N.S.; et al. Global Energy System Based on 100% Renewable Energy—Energy Transition
in Europe Across Power, Heat, Transport and Desalination Sectors; LUT University and Energy Watch Group:
Lappeenranta, Berlin, 2018; ISBN 978-952-335-329-9.
18. European Commission. Coal Regions in Transition Platform. Platform on Coal and Carbon-Intensive Regions:
Terms of Reference. 2017. Available online: https://ec.europa.eu/energy/sites/ener/files/crit_tor_fin.pdf
(accessed on 21 May 2019).
19. Eurostat, European Commission. Nomenclature of Territorial Units. 2018. Available online: http:
//ec.europa.eu/eurostat/web/nuts (accessed on 8 May 2019).
20. Copernicus Land Monitoring Service. CORINE Land Cover. 2018. Available online: https://land.copernicus.
eu/pan-european/corine-land-cover/clc2018 (accessed on 8 May 2019).
21. Copernicus Land Monitoring Service, EU-DEM. 2018. Available online: https://land.copernicus.eu/imagery-
in-situ/eu-dem (accessed on 1 May 2019).Sustainability 2019, 11, 3703 14 of 14
22. Song, J.; Choi, Y. Analysis of the Potential for use of floating photovoltaic systems on mine pit lakes: Case
study at the Ssangyong open-pit limestone mine in Korea. Energies 2016, 9, 102. [CrossRef]
23. European Environment Agency, NATURA 2000 Database. Available online: http://ec.europa.eu/environment/
nature/natura2000/access_data/index_en.htm (accessed on 8 April 2019).
24. Jarvis, A.; Reuter, H.I.; Nelson, A.; Guevara, E. Hole-Filled Seamless SRTM Data V4, International Centre for
Tropical Agriculture (CIAT). 2008. Available online: http://srtm.csi.cgiar.org (accessed on 8 May 2019).
25. Weselek, A.; Ehmann, A.; Zikeli, S.; Lewandowski, I.; Schindelei, S.; Högy, P. Agrophotovoltaic systems:
applications, challenges, and opportunities, A review. Agron. Sustain. Dev. 2019, 39, 35. Available online:
https://doi.org/10.1007/s13593-019-0581-3 (accessed on 8 May 2019).
26. Bodis, K.; Kougias, I.; Jäger-Waldau, A.; Taylor, N.; Szabo, S. A high-resolution geospatial assessment of the
rooftop solar photovoltaic potential in the European Union. under review.
27. Copernicus Land Monitoring Service, European Urban Atlas. 2018. Available online: https://land.copernicus.
eu/local/urban-atlas/urban-atlas-2012 (accessed on 8 May 2019).
28. Copernicus Land Monitoring Service, European Settlement Map. 2018. Available online: http://land.
copernicus.eu/pan-european/GHSL/european-settlement-map/ (accessed on 8 April 2019).
29. European Commission, Joint Research Centre. Photovoltaic Geographical Information System (PVGIS). 2018.
Available online: http://re.jrc.ec.europa.eu/pvgis.html (accessed on 8 May 2019).
30. Jäger-Waldau, A. Snapshot of Photovoltaics—February 2019. Energies 2019, 12, 769. [CrossRef]
31. Szabó, S.; Jäger-Waldau, A. More Competition: Threat or Chance to Financing Renewable Electricity?
Energy Policy 2008, 36, 1436–1447. [CrossRef]
32. Jäger-Waldau, A.; Bucher, C.; Frederiksen, K.H.B.; Guerrero-Lemus, R.; Mason, G.; Mather, B.; Mayr, C.;
Moneta, D.; Nikoletatos, J.; Roberts, M.B. Self-consumption of electricity produced from PV systems in
apartment buildings—Comparison of the situation in Australia, Austria, Denmark, Germany, Greece, Italy,
Spain, Switzerland and the USA. In Proceedings of the 2018 IEEE 7th World Conference on Photovoltaic
Energy Conversion, WCPEC 2018—A Joint Conference of 45th IEEE PVSC, 28th PVSEC and 34th EU
PVSEC26, Waikoloa Village, HI, USA, 10–15 June 2018; pp. 1424–1430. [CrossRef]
33. IPCC. Global Warming of 1.5 ◦ C: An IPCC Special Report on the Impacts of Global Warming of 1.5 ◦ C above Pre-Industrial
Levels and Related Global Greenhouse Gas Emission Pathways, in the Context of Strengthening the Global Response
to the Threat of Climate Change, Sustainable Development, and Efforts to Eradicate Poverty; Masson-Delmotte, V.P.,
Zhai, H.-O., Pörtner, D., Roberts, J., Skea, P.R., Shukla, A., Pirani, W., Moufouma-Okia, C., Péan, R., Pidcock, S.,
Eds.; World Meteorological Organization: Geneva, Switzerland, 2018.
34. Rotmans, J.; Kemp, R.; Van Asselt, M. More evolution than revolution: Transition management in public
policy. Foresight 2001, 3, 15–31. [CrossRef]
35. Markard, J. The next phase of the energy transition and its implications for research and policy. Nat. Energy
2018, 3, 628. [CrossRef]
36. Bird, L.; Milligan, M.; Lew, D. Integrating Variable Renewable Energy: Challenges and Solutions; National
Renewable Energy Lab (NREL): Golden, CO, USA, 2013.
37. Kougias, I.; Szabó, S.; Monforti-Ferrario, F.; Huld, T.; Bódis, K. A methodology for optimization of the
complementarity between small-hydropower plants and solar PV systems. Renew. Energy 2016, 87, 1023–1030.
[CrossRef]
38. Solar Energy Industries Association. U.S. Solar Market Insight—2018 Year in Review; Executive summary;
Solar Energy Industries Association: Washington, DC, USA, 2019.
© 2019 by the authors. Licensee MDPI, Basel, Switzerland. This article is an open access
article distributed under the terms and conditions of the Creative Commons Attribution
(CC BY) license (http://creativecommons.org/licenses/by/4.0/).You can also read