Whole Grains and Consumer Understanding: Investigating Consumers' Identification, Knowledge and Attitudes to Whole Grains - MDPI
←
→
Page content transcription
If your browser does not render page correctly, please read the page content below
nutrients
Article
Whole Grains and Consumer Understanding:
Investigating Consumers’ Identification, Knowledge
and Attitudes to Whole Grains
Shara Foster 1 , Eleanor Beck 1,2 , Jaimee Hughes 3         and Sara Grafenauer 1,3, *
 1   School of Medicine, University of Wollongong, Northfields Avenue, Wollongong 2522, Australia;
     sif087@uowmail.edu.au (S.F.); eleanor@uow.edu.au (E.B.)
 2   Illawarra Health & Medical Research Institute, Northfields Avenue, Wollongong 2552, Australia
 3   Grains & Legumes Nutrition Council, 1 Rivett Rd, North Ryde 2113, Australia; j.hughes@glnc.org.au
 *   Correspondence: sarag@glnc.org.au; Tel.: +61-401-265-142

 Received: 11 June 2020; Accepted: 20 July 2020; Published: 22 July 2020

 Abstract: Whole grains may assist in reducing risk of non-communicable disease, but consumption is
 limited in many countries. In Australia, the reasons for poor consumption are not well understood.
 The aim of this study was to investigate consumers’ knowledge, attitudes and identification of whole
 grains, incorporating an exploration of factors influencing consumption, promotion and provision.
 An online semi-structured questionnaire was used to gather responses from 735 participants (61%
 complete responses). Although 92% of respondents consumed grains, only 8% reported an intake
 consistent with age and gender recommendations. Refined pasta and rice were the most frequently
 purchased grain foods followed by wholemeal/whole grain bread. Of whole grain foods, bread and
 breakfast cereals were consumed more frequently. However, overall, participants did not prioritise
 consumption of whole grains. Despite this, 93% of participants had seen food packaging information
 drawing attention to whole grain content, with a high proportion describing whole grain as less
 processed (72%) or high in dietary fibre (67%). Two-thirds were aware of health benefits but stated
 that if they had further information, they would be more likely to swap to whole grain. Further
 education, increasing exposure, accessibility and extensive promotion of whole grain health benefits
 are required to facilitate whole grain consumption. Furthermore, removing the negative stigma
 associated with carbohydrate foods, including grains, will be necessary to improve consumption.

 Keywords: whole grain; grains; fibre; health benefits; education; food labelling

1. Introduction
      The body of evidence supporting whole grains continues to grow and highlights the significant
health benefits of regular consumption and protective effects [1]. These effects include decreased
risk of a range of chronic illnesses such as type 2 diabetes mellitus [2], cardiovascular disease [2,3],
certain cancers including colorectal [3], along with their potential risk factors including obesity [2,4],
hypertension and elevated fasting glucose, insulin and low-density lipoprotein (LDL) cholesterol
levels [5]. It has been suggested that the health benefits of whole grain consumption may be attributed to
the synergistic effects of the bran and germ component of whole grains, as they are rich in micronutrients,
dietary fibre and phytochemicals [6,7]. However, the complete mechanisms as to how these constituents
have such health benefits remains unclear. Results from the National Nutrition and Physical Activity
Survey 2011–2012 (NNPAS) indicated that approximately 30% of Australians met recommended grain
intake, with one-third (34%) of total grains consumed as whole grains. Whole grains made up 55% of
all grains consumed by individuals over 71 years, which was double of those aged 14–18 years (22%) [8].
Consumption of whole grains was calculated at 21 g/d for adults (19–85 years) [9], indicating inadequate

Nutrients 2020, 12, 2170; doi:10.3390/nu12082170                              www.mdpi.com/journal/nutrients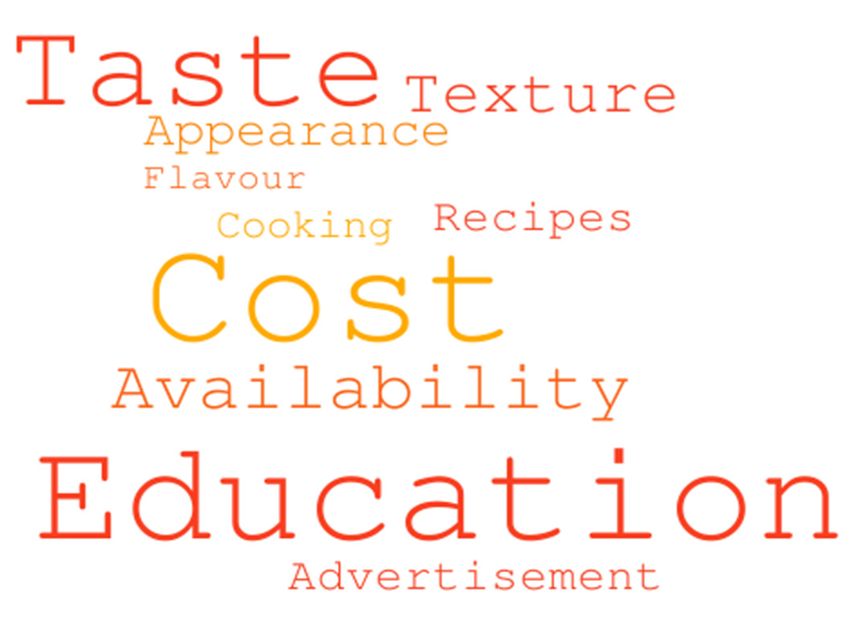
Nutrients 2020, 12, 2170                                                                          2 of 20

whole grain consumption. However, this was similar to the level of consumption recorded in the
United Kingdom [10], the United States [11], Ireland [12] and Singapore [13], while other countries,
such as France [14], Italy [15] and Malaysia [16] have far lower intakes. Scandinavian countries have
recently increased intakes, in particular Denmark, where successful promotion of whole grains, via a
public-private partnership, increased consumption from 33 g/day (from 2000 to 2004) to 55 g/day (in
2011–2014) [17].
     Food Standards Australia New Zealand (FSANZ) define whole grain as the intact grain or the
dehulled, ground, milled, cracked or flaked grain, where the constituents—endosperm, germ and
bran—are present in such proportions that represent the typical ratio of those fractions occurring in
the whole cereal, and includes wholemeal [18]. With the aim of proposing an international definition,
the Whole Grain Initiative has suggested that whole grains shall consist of the intact, ground, cracked,
flaked or otherwise processed kernel after the removal of inedible parts such as the hull and husk.
All anatomical components, including the endosperm, germ, and bran must be present in the same
relative proportions as in the intact kernel [19]. This definition closely aligns with the Australian
definition. Defining whole grain foods is far more problematic and has been described as foods
containing ≥51% whole grain by weight per reference amount customarily consumed by the United
States Food and Drug Administration [20], and The Health Grain Forum has proposed that whole
grain foods are ≥30% whole grain ingredients on a dry weight basis and contain more whole grain than
refined grain ingredients [21]. Since FSANZ do not regulate claims describing the amount of whole
grain in foods, a voluntary Code of Practice for Whole Grain Ingredient Content Claims designed to
complement existing food standards and to assist consumers in meeting the 48 g Daily Target Intake
(DTI) has been established by the Grains & Legumes Nutrition Council (GLNC). In order to gain an
understanding of whole grain, GLNC had conducted attitude and behaviour surveys over a number of
years and in 2017 results indicated that fifty percent of Australians were unaware of the definition
of whole grain food [22]. Whole grain foods are commonly identified through the use of food labels,
as well as by their appearance and colour. Research conducted outside of Australia has indicated that
potential barriers to adequate whole grain consumption relate to taste, lack of understanding of health
benefits, family influence, price and availability of whole grains [23,24]. Without sufficient knowledge
of how to read a label and identify whole grains, consumers may become confused [25], or incorrectly
mistake refined products for whole grain sources (e.g., multigrain bread), thereby unintentionally
reducing whole grain intake. Therefore, understanding of consumers’ knowledge of whole grains
may provide insight into strategies to increase whole grain consumption. The aim of this study was
to conduct an online semi-structured questionnaire to investigate consumers’ knowledge, attitudes
and identification of whole grains, incorporating an exploration of factors influencing consumption,
promotion and provision.

2. Materials and Methods
      A cross-sectional approach used an online survey (SurveyMonkey [26]) with both open and closed
questions. Ethical approval for this study was provided by the University of Wollongong and Illawarra
and Shoalhaven Local Health District Health and Medical HREC (Ethics number: 2019/049, Approval
date: 26 February 2019). Consumer perspectives were sought from Australians over the age of 18 years,
as adults are more likely to be responsible for their own food choices and parental consent was not
possible for children. Individuals with formal nutrition qualifications or who were currently involved
in nutrition education were excluded through the promotional materials for the survey due to the
likelihood that this cohort would have greater knowledge associated with whole grains compared to
the general population. Participants were alerted to this study through a combination of convenience,
snowballing and purposive recruitment, via word of mouth, as well as advertisement on social media
platforms such as Facebook, Twitter and Instagram via a nationwide promotion of the survey link.
This study was also advertised in the GLNC newsletter to over 5000 subscribers. An incentive of a $50
grain food prize pack was offered to encourage participation.
Nutrients 2020, 12, 2170                                                                             3 of 20

      Data were collected from March to May 2019. The survey (Appendix A) comprised 39 questions
and was designed to gain information on general dietary information, consumption of grains, perceived
whole grain definition, and, understanding and identification of ‘whole grains’. In addition to this,
participants were asked whether they believed whole grains were important in their diet, if they were
aware of the recommended daily intake of grains and whole grains, and any health benefits associated
with their consumption. Questions associated with food labels and claims, including claims such as
high in protein, contains whole grains, high in fibre and low glycaemic index (GI) were also included.
The survey utilised multiple choice, check multiple choice box selection, rank and scale, a 3-point scale
ranging from ‘never to frequently’, a 5-point scale ranging from ‘strongly agree to strongly disagree’,
and free-text responses. Recorded demographic characteristics were age, gender, employment status,
highest level of education, and residential area.
      Questions in this study were modelled on a study conducted by McMackin et al. (2011) which
utilised focus groups to gain in-depth information regarding consumer attitudes and awareness of
whole grain as well as barriers and facilitators to their consumption [27]. Questions were refined in
consultation with relevant stakeholders, and surveys piloted by five dietitians and three non-dietitians
to assist with construct and content validity, as well as the general understanding of questions and
flow of the survey tool.
      Data were exported from SurveyMonkey to Microsoft Excel™ (Version 16.22, 2019, Washington,
DC, USA), where data collation and cleaning occurred. Descriptive statistics were used to
provide frequency counts and percentages for demographic information, multiple choice questions,
check multiple choice box selection, rank and scale and Likert scale-related questions. Content analysis
and themes were identified utilising data visualisation methods, including content or word clouds.
These were used to identify, analyse and report patterns from the open-ended questions [28]. Content
analysis of responses was used to explore topics and themes as they emerged in the data, representing
a conventional approach to this analysis with no preconceived ideas as to the relevant themes derived
from responses [29].

3. Results

3.1. Study Population
      Sixty-one percent of surveys were completed in full, from 735 responses (n = 448). Partially
completed questionnaires were included in the final analysis, as question responses were independent
of one another. Most respondents were female (86.9%; n = 637), from two defined age groups 18–25
(23%; n = 168) or 36–45 years (23%; n = 168) and a larger proportion were employed full time compared
with other employment categories (37.6%; n = 276). Most participants had achieved qualifications post
high school of a certificate or diploma (37.4%; n = 274) or degree (26.6%; n = 195). Most commonly,
participants stated that they lived in a regional area (42.4%; n = 311) and three-quarters (76.6%; n = 579)
of participants were not following a specific diet (Table 1). Special diets were noted by 134 participants
and included vegetarian/plant based (n = 37), gluten free (n = 32), low carbohydrate/ketogenic (n = 23),
‘for medical purposes’ (n = 22), and dairy free (n = 20).
      Forty percent (n = 296) of respondents noted avoiding particular foods, including
gluten/carbohydrates/bread/grains (29.4%; n = 87), dairy/lactose (26.7%; n = 79), sugar (14.5%; n = 43),
meat (11.8%; n = 35) and processed foods (9.5%; n = 28).
Nutrients 2020, 12, 2170 4 of 20
Table 1. Demographic characteristics of participants.
Demographic Variable Frequency (%)
Gender (n = 733)
Male 93 (12.7)
Female 637 (86.9)
Prefer not to answer 3 (Nutrients 2020, 12, 2170 5 of 20
Table 2. Reported daily grain serve consumption of participants.
Serves Frequency (%)
Serve of Grains Consumed Each Day (n = 487) Female (n = 421) Male (n = 63)
1 56 (13.3) 9 (14.3)
2 124 (29.5) 16 (25.4)
3 104 (24.7) 18 (28.6)
4 86 (20.4) 10 (16)
5 34 (8) 6 (9.5)
6+ 17 (4) 4 (6.4)
Table 3. Consumers frequency of grain purchases 1,2 .
Frequency (%)
Grain Foods
Never Sometimes Frequently n Total
Oats 30 (13.7) 365 (55.7) 200 (30.5) 655
Brown rice 146 (22.4) 355 (54.5) 150 (23) 651
White rice 63 (9.6) 359 (54.6) 235 (35.8) 657
Wild rice 459 (71.7) 168 (26.3) 13 (2) 640
Black rice 492 (77) 135 (21) 12 (2) 639
Red rice 575 (90) 58 (9) 5 (0.8) 638
White pasta 67 (10) 307 (46.7) 283 (43) 657
Wholemeal pasta 244 (37.7) 325 (50) 78 (12) 647
White wraps 196 (30.5) 359 (55.8) 88 (13.7) 643
Wholemeal wraps 186 (28.8) 366 (56.6) 95 (14.7) 647
Whole grain wraps 223 (34.7) 309 (48) 111 (17.3) 643
Whole grain bread 142 (21.8) 274 (42) 235 (36) 651
Wholemeal bread 202 (31.3) 289 (44.8) 154 (24) 645
White bread 210 (32.7) 269 (41.8) 164 (25.5) 643
Multigrain bread 125 (19.3) 307 (47.3) 217 (33.4) 649
Wholemeal flour 319 (49.8) 268 (42) 53 (8.3) 640
White flour 106 (16.3) 362 (55) 183 (28) 651
Enriched flour 566 (89) 61 (9.6) 9 (1.4) 636
Popcorn 161 (25) 357 (55) 130 (20) 648
Quinoa 291 (45) 290 (45) 64 (10) 645
Buckwheat 515 (80) 110 (17) 18 (2.8) 643
Rye 450 (70) 167 (26) 26 (4) 643
Spelt 550 (85.7) 81 (12.6) 11 (1.7) 642
Teff 611 (91.7) 29 (4.5) 0 640
Freekeh 587 (91.7) 45 (7) 8 (1.3) 640Nutrients 2020, 12, 2170 6 of 20
Table 3. Cont.
Frequency (%)
Grain Foods
Never Sometimes Frequently n Total
Bulgur 562 (87.7) 74 (11.5) 5 (0.8) 641
Barley (pearled) 405 (63) 226 (35) 12 (1.9) 643
Triticale 630 (97) 16 (2.5) 2 (0.3) 638
Sorghum 589 (92.3) 44 (6.9) 5 (0.8) 638
Millet 584 (91.7) 48 (7.5) 5 (0.8) 637
Rice noodles 178 (27) 400 (61) 76 (11.6) 654
Wheat noodles 367 (57.5) 240 (37.6) 31 (4.9) 638
Whole grain noodles 480 (75) 145 (22.7) 15 (2.3) 640
Muesli or oat bars 174 (26.8) 352 (54) 124 (19) 650
Plain crackers 83 (12.8) 406 (62.4) 162 (24.9) 651
Whole grain crackers 169 (26) 355 (55) 120 (18.6) 644
1 Whole grains and whole grain-containing foods are underlined. 2 Highest frequencies are bolded.
Overall, 77.4% (n = 514/664) of participants reported consuming breakfast cereals, with a
oat/porridge varieties most commonly consumed (n = 353/485), followed by muesli (n = 214/485),
and granola (n = 153/485) (Table 4). Frequency of consumption of each cereal was not determined.
Twenty-two percent of participants noted consumption of other breakfast cereals not listed, with the
most commonly noted cereal being (whole grain) Weet-Bix™.
Table 4. Frequency of breakfast cereals selected while shopping.
Breakfast Cereals (n = 485) Frequency (%)
Kids cereals 128 (26.4)
Muesli 214 (44)
Granola/clusters 153 (31.6)
Oats/porridge 353 (72.8)
Other 107 (22)
3.3. Grain and Whole Grain Knowledge and Awareness
Ninety-six percent of participants had previously heard of whole grain or whole grain foods
(n = 489/507), although eighteen participants (3.5%) had never heard of them before. More than half of
participants (62%; n = 393/635) were unable to comment on how many grain serves are recommended
each day, although serve size information had been provided in an earlier question. When accounting
for varying serve recommendations based on age and gender, only 7% (n = 44) of participants were able
to correctly identify these recommendations. Similarly, more than half of participants (62%; n = 507)
were unable to recall a recommended quantity of whole grain serves (from their grain serves), and only
9% (n = 46) correctly identified recommended serves based on their age and gender (Table 5).Nutrients 2020, 12, 2170 7 of 20
Table 5. Recommended number of grain and whole grain serve per day as identified by participants.
Frequency (%)
Serves
Grain Serves (n = 635) Whole Grain Serves (n = 507)
1 14 (2.2) 14 (2.8)
2 38 (6) 41 (8)
3 65 (10.2) 44 (8.7)
4 48 (7.6) 48 (9.5)
5 51 (8) 30 (5.9)
6+ 26 (4) 19 (3.8)
unknown 393 (62) 311 (61.3)
Whole grains were commonly described by participants as a food made from a less processed
grain (72%) or a food high in fibre (67%). Though these statements are true to an extent, less than half
(49%) of participants correctly identified whole grains as specified by Food Standards Australia New
Zealand, as a food that contains all components of the grain [18]. When open responses were utilised,
almost half of participants (47%) stated that whole grains are less processed grains, with one-quarter
(24%) of participants stating ‘whole grains are grains that used all its components’. Close to one-quarter
Nutrients 2020, 12, x FOR PEER REVIEW 7 of 21
(23%) of participants were unsure how a food might be classified as a whole grain.
Approximately half of the participants reported seeing whole grains mentioned on social media
mention of whole grains within cooking books, on blogs and menus. Yet, over half of the participants
(n = 238/492) and television, respectively (n = 288/492). Others commented that they have also noticed
(59%; n = 298) have never had a health care professional mention whole grain to them. However,
mention of whole grains within cooking books, on blogs and menus. Yet, over half of the participants
those that had most commonly note that they had heard the information from dietitians (25%; n =
(59%; n = 298) have never had a health care professional mention whole grain to them. However, those
126).
that had most commonly note that they had heard the information from dietitians (25%; n = 126).
3.4.
3.4. Participant
Participant Attitudes
Attitudes and
and Barriers
Barriers
Ninety-two
Ninety-two percent
percent (n
(n ==468)
468)ofofparticipants
participantsbelieved
believedwhole
wholegrains
grainswere
wereimportant
importantforfortheir
theirdiet.
diet.
Half of the very few participants (52%; n = 16) who did not believe that whole grains were important,
Half of the very few participants (52%; n = 16) who did not believe that whole grains were important,
stated
stated that
that this
this belief
belief was
was due
due to
to them
them being
being unaware
unaware of
of the
the importance
importance ofof whole
whole grains
grains for
for health,
health,
and
and that no one had mentioned their significance. Common factors that participants reported help
that no one had mentioned their significance. Common factors that participants reported help
them
them choose
choose whole
whole grains
grains foods more frequently
foods more frequently included
included education,
education, cost
cost and
and taste
taste (Figure
(Figure 1).
1).
Figure 1.
Figure Wordcloud
1. Word cloudbased
basedonon responses
responses to to
thethe question
question “What
“What do you
do you think
think could
could be done
be done to
to help
help you choose whole grain foods more often?” Larger font indicates high frequency of mentions
you choose whole grain foods more often?” Larger font indicates high frequency of mentions by
by participants.
participants.
3.5. Whole Grain Identification
Three times as many participants stated that they would seek information on whole grains via
online sources (n = 320) compared to via qualified dietitians (n = 103) (Figure 2).Figure 1. Word cloud based on responses to the question “What do you think could be done to help
you choose
Nutrients 2020, 12, whole
2170 grain foods more often?” Larger font indicates high frequency of mentions by 8 of 20
participants.
3.5.Whole
3.5. Whole GrainIdentification
Grain Identification
Threetimes
Three timesasasmany
manyparticipants
participantsstated
statedthat
thatthey
theywould
wouldseek
seekinformation
informationononwhole
wholegrains
grainsvia
via
online sources (n = 320) compared to via qualified dietitians (n = 103) (Figure
online sources (n = 320) compared to via qualified dietitians (n = 103) (Figure 2). 2).
Figure 2. Word cloud based on responses to the question “Where would you go to seek nutritional
Figure 2. Word cloud based on responses to the question “Where would you go to seek nutritional
information on whole grains?” Larger font indicates high frequency of mentions by participants.
information on whole grains?” Larger font indicates high frequency of mentions by participants.
Almost all participants (93%; n = 418) had seen whole grains advertised on packaging in some
Almost
form. all participants
However, consumers (93%; n = 418)
were less awarehad seendetails
of the wholeorgrains advertised
the amount on packaging
of whole grain beinginclaimed
some
form. However,
on packs such asconsumers
“source orwere
madeless
ofaware
wholeof the details
grains”. or thegrain
A whole amount
foodofwas
whole grain
most being
often claimed
identified via
on-pack messaging (65%; n = 292) followed by the ingredients list (52%; n = 233). Fourteen percent of
participants reported either not looking for whole grain items (14%; n = 62) or that they were unaware
of what a whole grain food was (6%; n = 26) and were therefore unable to recall how they would
identify whole grain foods.
When participants were asked to identify whole grain foods, they were most unsure about teff
(65%; n = 343), spelt (48%; n = 243), black rice (38%; n = 191), red rice (52%; n = 260) and buckwheat
(37%; n = 187) (Table 6).
Table 6. Participants’ classification of foods as whole grain or whole grain containing 1,2 .
Frequency (%)
Grain Foods Not a Whole Whole Grain A Whole
Unsure
Grain Containing Grain
Rye 26 (5) 75 (15) 276 (55) 123 (25)
Teff 9 (2) 23 (4.5) 128 (25.5) 343 (68)
Oats 43 (8.5) 119 (24) 283 (56) 59 (12)
Spelt 15 (3) 49 (10) 195 (39) 243 (48.4)
Quinoa 16 (3) 65 (13) 292 (58) 130 (26)
Popcorn 112(22) 114 (23) 155 (31) 123 (24.4)
Weet-Bix™ 82 (16) 302 (60) 54 (9) 76 (15)
Wild rice 12 (2) 59 (12) 295 (58) 140 (28)
White rice 238 (47.5) 76 (15) 87 (17.4) 100 (20)
Brown rice 22 (4.4) 113 (22) 281 (56) 88 (17.5)
Black rice 15 (3) 64 (13) 235 (47) 191 (38)
Red rice 17 (3.4) 50 (10) 174 (35) 260 (52)
Vita-Weats™ 65 (13) 325 (65) 28 (5.5) 88 (17.4)Nutrients 2020, 12, 2170 9 of 20
Table 6. Cont.
Frequency (%)
Grain Foods Not a Whole Whole Grain A Whole
Unsure
Grain Containing Grain
Ryvita’s™ 59 (12) 278 (55.4) 30 (6) 135 (27)
Buckwheat 10 (2) 47 (9.4) 257 (51) 187 (37)
Rice cakes 186 (35) 173 (34.4) 16 (3) 128 (26)
Brown rice cakes 59 (12) 296 (59) 26 (5) 119 (24)
Wheat pasta 176 (35) 174 (35) 23 (4.6) 131 (26)
Wholemeal pasta 76 (15) 289 (58) 32 (6.4) 104 (21)
White wrap 356 (71) 46 (9) 9 (1.8) 91 (18)
Wholemeal wraps 104 (21) 284 (57) 25 (5) 90 (18)
White bread 377 (75) 41 (8) 3 (0.6) 80 (16.3)
Grainy bread 37 (7.3) 358 (71) 34 (6.75) 75 (15)
Wholemeal bread 99 (20) 296 (59) 25 (5) 79(15.8)
Multigrain bread 27 (5) 376 (74) 49 (9.7) 54 (11)
Rye bread 67 (13) 280 (56) 32 (6.4) 124 (25)
Sourdough 261 (52) 82 (16.4) 12 (2.4) 146 (29)
White flour 366 (73) 32 (6.4) 7 (1.4) 96 (19)
Enriched flour 221 (44) 73 (15) 7 (1.4) 199 (40)
Wholemeal flour 106 (21.2) 259 (52) 42 (8.4) 94 (18.8)
Rice noodles 245 (49) 91 (18) 12 (2.4) 151 (30.3)
Wheat noodles 189 (38) 152 (30.5) 13 (2.6) 145 (29)
Whole grain noodles 49 (10) 319 (64) 36 (7) 97 (19.4)
Plain crackers 323 (65) 47 (9.4) 5 (1) 125 (25)
Whole grain crackers 47 (9) 345 (69) 38 (7.6) 72 (14.3)
1 2
Whole grain foods are underlined; correct answers are bolded.
3.6. Whole Grain Health Literacy
Seventy percent of participants reported that they were aware of positive health benefits associated
with whole grains and the majority of participants were able to correctly answer true and false
statements related to health benefits associated with whole grain consumption (Table 7). However,
43% of participants were most unsure about the ability of whole grains to decrease inflammation (43%;
n = 218). Three-quarters of participants (75%; n = 381) stated that if they were further informed of the
health benefits of whole grains, their opinion would change and they would be more willing to switch
to whole grain options.Nutrients 2020, 12, 2170 10 of 20
Table 7. Participant perceptions of whole grain associated health benefits 1 .
Survey Question Frequency (%)
Health-Associated Whole Grain Statements (n = 507) True False Unsure
Causes weight gain 32 (6.3) 405 (80) 70 (14)
Causes inflammation 37 (7.3) 366 (72) 104 (21)
Decreases inflammation 222 (43.8) 67 (13) 218 (43)
Lower risk of bowel cancer 396 (78) 19 (4) 92 (18)
Better weight maintenance 388 (76.5) 29 (6) 90 (17.5)
Improves cholesterol 359 (70.8) 24 (5) 124 (25)
Reduces risk of heart disease 351 (69) 19 (4) 137 (27)
Reduces risk of type 2 diabetes 340 (67) 26 (5) 141 (27.8)
Healthier waist measurements 280 (55) 42 (8.3) 185 (36.5)
Causes spike in blood sugar levels 34 (6.7) 344 (68) 129 (25.4)
Helps keep you feeling fuller for longer 453 (89.4) 11 (2) 43 (8.5)
1 Correct answers are bolded.
3.7. Whole Grain as an Ingredient
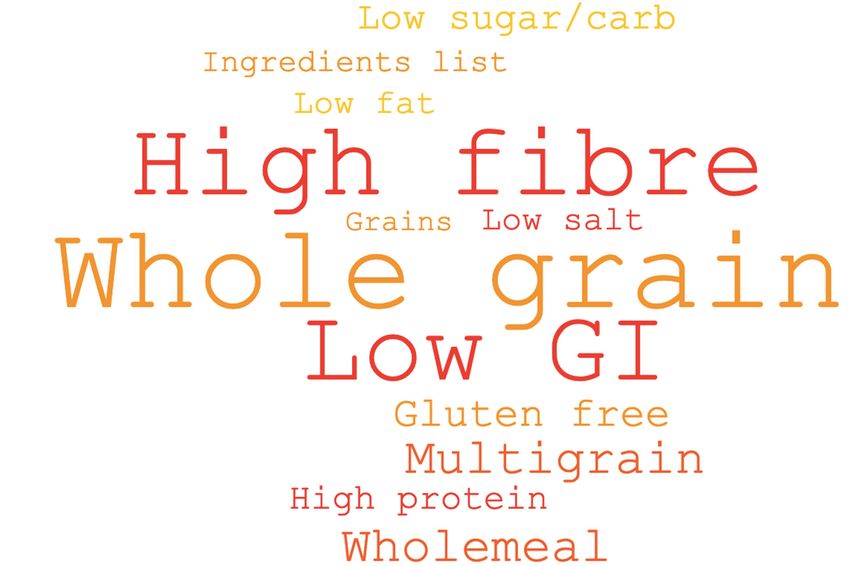
When considering claims which may encourage purchasing decisions (Figure 3), ‘contains whole
grains’ (18%; n = 83) was reported to be less important than high in fibre (34%; n = 153), high in protein
(26%; n = 114) and low GI claims. (22%; n = 99). Despite this, when participants were asked to report
the types of claims they commonly looked for on bread, noodles, crackers, rice and pasta, whole grain
claims were most commonly referred to, followed by high fibre and low GI claims (Figure 3). The most
common food item participants reported examining for specific phrases related to health was bread
(56.5%; n = 253), with noodles being the least common (15.2%; n = 68).
Nutrients 2020, 12, x FOR PEER REVIEW 10 of 21
Figure 3. 3.
Figure WordWordcloud
cloudbased onon
based open-ended
open-endedresponses
responsesto to
thethe
question “Do
question “Do you look
you lookforfor
any specific
any specific
words
wordsor or
phrases onon
phrases packaging
packagingwhen purchasing
when purchasingthethe
following
following items?” Items
items?” listed
Items included
listed bread,
included bread,
noodles, crackers,
noodles, rice
crackers, and
rice pasta.
and Larger
pasta. font
Larger indicates
font high
indicates highfrequency
frequencyof of
mentions
mentions bybyparticipants.
participants.
Reasons
Reasonswhole
wholegrains were
grains werenotnot
considered
consideredto to
bebe
important
importantin in
thethe
diet included
diet “it“it
included was never
was never
mentioned to me”.
mentioned to me”. The majority of participants stated that they were unsure why they were
majority of participants stated that they were unsure why they were important,
important, that nutrients found in whole grains could be found in other foods, and a number of
participants reported following a ketogenic diet, which excludes all grain foods (Appendix B).
4. Discussion
This study provides some understanding of Australians’ views of whole grains, their attitudes,
knowledge and health literacy and provides insights into factors that may affect choice of grain foods.Nutrients 2020, 12, 2170 11 of 20
that nutrients found in whole grains could be found in other foods, and a number of participants
reported following a ketogenic diet, which excludes all grain foods (Appendix B).
4. Discussion
This study provides some understanding of Australians’ views of whole grains, their attitudes,
knowledge and health literacy and provides insights into factors that may affect choice of grain foods.
Whole grain intake within Australia is below current recommendations [9] and one of the first steps in
developing modes of action to increase intake is understanding Australians current knowledge related
to whole grains, as this may impact food choices and the likelihood of making dietary changes.
While it must be noted that the sample was not representative of the Australian population,
results from this study are consistent with other work suggesting that the participants consume less
than the recommend amount of grain food serves per day for their age and gender. Data from the
NNPAS 2011–2012 reported that 70% of Australians did not consume sufficient quantities of grains [8].
If individuals consume insufficient grains, then not only will they be likely to consume insufficient
whole grains, but they may also be at risk of inadequate consumption of other key elements derived
from grain foods such as dietary fibre, B group vitamins and iodine.
In order for individual adherence to dietary guidelines, an appropriate level of nutrition knowledge
is required for success [30]. This study found that less than one in ten participants were able to correctly
identify both the recommended number of grain serves per day and also recommended whole grain
serves a day for their age and gender. Over half of all participants were unable to identify any
recommended quantities of grain serves (62%) or whole grain serves (61%). This was an important
finding, as without sufficient knowledge on whole grain recommendations, the success of positive
health behaviours related to adequate intake is limited. In a study aimed at increasing fruit and
vegetable intake, a nutrition intervention provided participants with information on nutrients in fruit
and vegetables, the role these nutrients played in the body and current intake recommendations.
At the end of this, 91% of participants within the intervention increased fruit and vegetable intake
compared to only 22% in the control group [31]. This highlights the value in improved understanding
of dietary guidelines and recommendations as a possible strategy to increasing knowledge, compliance
and consumption.
Participants within this study primarily understood whole grains as a less processed grain,
higher in dietary fibre. Only half of participants identified whole grains as a food containing all
components of a grain when provided with multiple options, and even fewer participants noted
this within open responses. Results were comparable to a previous attitude and behaviour survey,
with 50% of participants not knowing precisely what constitutes a whole grain, but the majority
acknowledging level of processing as a feature of these grain foods [22]. Findings from this study
suggest that individuals may have difficulty in identifying whole grains and whole grain foods,
particularly those described as wholemeal or those categorised as snacks or breakfast cereals, for
example, wholemeal flour, popcorn and Weet-Bix™ or other cereal products. The possible basis for this
misconception could be related to individuals believing whole grains are unprocessed or less processed
grains [25]. Consequently, if they are transformed from their original “intact” form, they may no longer
be perceived as whole grain by many consumers who assume a literal meaning for this food label.
Correct identification of these manufactured whole grain foods could potentially encourage intake
and therefore impact total daily whole grain consumption. The inability to differentiate whole grain
and refined grain varieties is widely acknowledged as a barrier to consumption of grain foods [27,32].
Previous research on whole grains has identified barriers to whole grain consumption including texture
and taste with a number of studies assessing the general acceptability of whole grain foods including
muffins, bread, rolls, breakfast cereals, oats, muesli, pasta, brown rice, cookies, granola bars, cereal
bars and other snacks [15–18]. Perhaps if individuals are informed that whole grain-containing foods
come in a variety forms and they are able to identify these, preconceived taste and texture expectations
may be overcome and consumption may increase.Nutrients 2020, 12, 2170 12 of 20
The majority of participants (92%) believed that whole grains were important for their diet,
as they provided dietary fibre and nutrients, they are less processed and more natural. However,
almost all participants who stated the reverse, that whole grains were not important, explained that
the reason for this belief was due to a lack of knowledge of the specific health benefits of whole
grains. Overall, there were general perceptions of “healthfulness”, but thirty percent of participants
were unaware of any specific health benefits associated with whole grains. The most frequent health
benefits that participants associated with whole grains related to dietary fibre, digestion, bowel and
gut health improvements and, that they are low GI. Digestive benefits are tangible for consumers.
Recent work has noted that dietary fibre and whole grain content are better measures of carbohydrate
quality than GI, so it is perhaps positive that fibre and broad health measures are most commonly
recognised [33]. Few participants identified whole grains as important in reducing chronic illnesses such
as cardiovascular disease, certain cancers and their potential risk factors—obesity, hypertension and
elevated fasting glucose levels [2–5]. This indicates that individuals only have a basic understanding
and awareness of whole grain health benefits, which is to be expected. It is unlikely that discussion of
serious disease would take place in advertising or on social media, the key sources of information for
participants in this study. Furthermore, making connections with serious disease via high-level health
claims is not permitted on food product labelling.
Interestingly, three-quarters of participants stated that if they were informed of benefits associated
with whole grain intake, it would encourage them to switch to whole grain options, which also
corresponds with previous research [32]. Participants stated that being educated on identification of
whole grains along with information on how to cook them would also act as facilitators to further
consumption. A recently published paper increasing exposure to whole grain food choices among
low whole grain consumers over six weeks was shown to improve ratings of liking, flavor, texture
and willingness to include more whole grains in the diet [34]. This study emphasised that increasing
exposure was key, with simple swaps rather than changes to the dietary pattern, leading to greater
whole grain intake. A previous study utilised nutritional lectures to educate college students on
physiological benefits of whole grains in relation to disease prevention, along with enabling them
to identify whole grain foods on food labels and become involved with tasting activities. The study
aimed to reduce taste and texture biases, and resulted in an increase in whole grain intake from 10%
to 38% of total grain intake [35]. Generally, multi-pronged approaches, with education and tasting,
produce the outcomes required to impact dietary change.
Individuals in this study reported using on-pack messages to identify whole grain foods.
While FSANZ do not regulate the use of on-pack whole grain claims, as they do with other nutrients,
such as dietary fibre, protein, carbohydrate, and fat, the voluntary Code of Practice for Whole Grain
Ingredient Content Claims in Australia, or overseas, labelling using whole grain “stamps” is used to
guide consumers [36,37]. According to research that aimed to assess the impact of the GLNC Code,
the use of the on-pack claims was more prevalent in certain food product categories, with 75% of
breakfast cereals and breads using the specified claims compared to just 40% of crispbreads/crackers/rice
and corn cakes and rice, pasta, noodles or other grains [36]. Although there was a high prevalence
of whole grain claims on pack labels, it was estimated that only 43% of all eligible Australian
grain food manufacturers and 65% of eligible grain food products in Australia are registered with
the Code [36]. Here, less than one-quarter of participants reported looking for whole grain foods
specifically and almost half never looked for the term ‘whole grains’ on packaging. In research focused
on multi-attribute choice modelling using bread as the example, Burke et al. [38] found that whole
grain was rated highly for both healthful and value for money by consumers. If more manufacturers
routinely declared the percentage of whole grain content on packs, there would be a wider range of
whole grain products for consumers to easily identify, providing the greatest opportunity to improve
consumption patterns of whole grain foods across the population.
Aligned with this, strengthening public policy and regulation through the government, health
professionals, health organisations and the food industry, perhaps via successful public–privateNutrients 2020, 12, 2170 13 of 20
partnership models utilised elsewhere, will become increasingly important to encourage whole grain
and whole grain food consumption [39]. Key to this research and the promotion of whole grains is
the concept of health, nutrition and food literacy. Health literacy, as defined by the World Health
Organisation, is “the cognitive and social skills which determine motivation and ability of individuals to
gain access to, understand and use information in ways which promote and maintain good health” [40].
Food literacy can be defined as the everyday practicalities associated with navigating the food system
and being able to use it to ensure a food intake that aligns with nutrition recommendations [41].
While there may be some ambiguity in these definitions, they are important in nutrition research
because they can assist in determining how a consumer’s knowledge may affect their health [42,43].
This is relevant when choosing between refined and whole grain foods. In order to assist Australians
in making healthier choices, the Health Star Rating (HSR), a voluntary front-of-pack (FOP) labelling
system, was adopted in Australia and New Zealand in 2014. Like other systems used internationally,
the HSR was introduced as a strategy to guide selection of healthier foods in an easily understood
manner, ranking foods on a scale between 0.5 (1/2) and 5 stars, based on the premise that more stars
equate to a healthier product [44]. The HSR system was designed to reflect principles outlined in
the Australian Dietary Guidelines, and provide consumers with a simple measure to compare foods
within the same category [45]. The current HSR does not include whole grain within the algorithm.
Some whole grain foods achieve a higher HSR due to the positive points gained from dietary fibre.
However, research demonstrates that there is less than one star difference across multiple grain food
categories [46]. Addition of whole grains to the algorithm may assist in promotion of their intake.
Diets with varying carbohydrate content and aversions to carbohydrate foods and grains have
gained substantial popularity in recent years [47,48]. This was evident within this study, with almost
all reasons individuals provided for not consuming whole grains related to participants’ dietary beliefs
and regimens, with gluten-free (not for medical purposes), ketogenic, paleo and low-carbohydrate
diets mentioned. Though diets lower in carbohydrate have been shown to have short-term weight-loss
benefits, the long-term effects and safety of these diets are not thoroughly studied or understood [49,50].
These diets exclude major carbohydrate food sources such as whole grain breads, pasta, and starchy
vegetables including potatoes and corn, resulting in a significant decrease in carbohydrate, dietary fibre
and micronutrient intakes of non-haem iron, magnesium, folate, thiamin, and iodine, which are the key
nutrients supplied predominantly by grain foods in the Australian diet [51]. With the decreased intake
of these nutrients due to elimination of their primary sources, potential gastrointestinal consequences
such as constipation, increased risk of bowel cancer [52,53] and altered gut microbiota composition [54]
may impact overall health. This provides further evidence of the importance of education on the
benefits of whole grain foods to assist in removing the negative stigma that implies that all carbohydrate
sources are ‘bad’.
Online surveys are beneficial to reach a large array of individuals in a relatively short period [55,56].
However, there may be unintentional exclusion of individuals, particularly those in remote areas, or of
lower socioeconomic status or those of an older age. Although an active attempt was undertaken to
ensure that a representative population was achieved for this study through active promotion via social
media, the use of convenience sampling resulted in a less generalisable population, and an especially
high proportion of female participants (87%), who tend to have higher food literacy. Importantly,
the survey targeted the age groups making up ~65% of the Australian population [57]. Although there
were a limited number of participants ≥65 years of age, NNPAS data suggest that those ≥71 years of
age already consume more whole grain than any other age group within the population (33.7 g/d) [9].
Furthermore, of the 735 participants who commenced the survey, only 448 completed it, potentially
due to the length of time required for completion. It was also possible that participants completing the
survey may have had a greater general interest in nutrition compared to the general population. It is
important to note that there was some unintentional ambiguity in the question asking consumers to
classify multigrain and grainy bread with respect to whole grain content. Multigrain breads tend to be
made from refined flour with the addition of seeds and grains, and therefore not classified as a wholeNutrients 2020, 12, 2170 14 of 20
grain food. However there are exceptions and some multigrain breads may be made from wholemeal
(whole grain) flours and as a result participants’ responses may have varied depending on the type of
multigrain and grainy breads encountered. Furthermore, consumption data received from this study
were self-reported and based on estimates by participants and the precise amounts of grain food intake
were not quantified. Therefore, consumption estimates can only be use as an indication of grain intake
and not as an exact measure.
5. Conclusions
This study aimed to investigate consumers’ knowledge, attitudes and identification of whole
grains, with an exploration of factors influencing consumption, accessibility, promotion and provision.
Findings highlighted the necessity of education on whole grain health benefits. For consumers,
improving health literacy, by providing ideas on how to identify whole grains and whole grain
foods, and practical ways for individuals to incorporate these foods into their current lifestyle are
needed. Furthermore, promotion of whole grains and the increased use of prominent and clear
labelling of whole grain in foods may be beneficial to clearly identify all possible categories of products.
Finally, removing the negative stigma associated with carbohydrate foods, including grains, will be
necessary to improve consumption and facilitate active choices to incorporate the best food options.
While health professionals like dietitians may be best placed to provide information to consumers,
proportionately, very few within the population access their services. More broad-reaching campaigns
may be required to make more sustainable changes in consumption, leveraging the support of the
government, regulators, the food industry and non-government organisations within a public–private
partnership model.
Author Contributions: Conceptualization, S.G. and E.B.; methodology, S.F.; formal analysis, S.F.; original draft
preparation, S.F. and S.G.; review and editing, J.H. and E.B. All authors have read and agreed to the published
version of the manuscript.
Funding: This research received no external funding but was supported by the Grains & Legumes Nutrition
Council, a not-for-profit charity.
Conflicts of Interest: S.G. and J.H. are employed by the Grains & Legumes Nutrition Council, a not-for-profit
charity; S.F. and E.B. declare no conflict of interest.
Appendix A
Survey Questions
1. What is your age group?
2. What is your gender?
3. Which of the following categories best describes your employment status?
4. What is the highest level of education you have completed?
5. How would you describe the area you live?
6. Do you follow a specific diet? (For example, vegetarian, gluten free, medical condition)
7. Do you avoid any particular foods?
8. Do you consume grain foods?
9. Please tick what items you purchase from the following. (Never, Sometimes, Frequently)
10. Do you consume breakfast cereals? (including muesli/granola/oats/porridge/flakes)
11. In the breakfast cereal aisle what foods do you look for? (tick any that apply)
12. Please specify what breakfast cereal types/brands you consume. (open box)
13. Based on the above information on average how many grain food serves do you consume per
day? (0–6+)
14. The Australia Dietary Guidelines provides recommendations for the number of serves individuals
are supposed to consume. Are you aware of how many grain food serves are recommended for
you (for your age and gender) per day? (1–6 and no)Nutrients 2020, 12, 2170 15 of 20
15. Have you heard of whole grains or whole grain foods?
16. What do you think whole grains are? (Open question—“unsure” is an acceptable answer)
17. What is your understanding of the term “whole grain”? (tick as many as you want)
18. Have you seen whole grains mentioned on any of the following? (tick all that apply)
19. Have whole grains been mentioned to you by any of the following health care professionals? (tick
all that apply)
20. Do you believe wholegrains are important to your diet? (yes/no)Please specify. (open box)
21. If a product says it is made of whole grains, how processed do you believe it is? (Likert scale with
natural to processed—drag the dot)
22. Are you aware of how many serves of whole grain foods are recommended for you per day?
(options 1–6 and no)
23. Are you aware of how many serves of whole grains are recommended for a child per day?
24. From the following foods, which foods do you believe are whole grains or whole grain containing
foods? (Three columns: not a whole grain, whole grain, whole grain containing)
25. Are there any reasons why you would not choose whole grain foods when shopping? (open box)
26. Are you aware of any positive health benefits associated with consuming whole grains?
(yes/no)Please specify. (open box)
27. From the following please specify if you believe the statements to be true or false about whole
grains. (true, false, unsure)
28. Would being informed that whole grains are good for you change your opinion on them?
29. Have you heard of grains being discussed in a negative way? For example, friends choosing
grain free food options.
30. Where would you go to seek nutritional information about whole grains? (For example: the
internet, books, magazines, doctors, nutritionists, dietitians)
31. What do you think could be done to help you choose whole grain foods more often? (For example:
taste, cost, texture, availability, education on whole grain foods, appearance)
32. When shopping you may see the following claims on food packaging. Rank what is the most
important to you when purchasing food items. (1 being the most important and 4 being the least)
33. Have you seen any of these statements on food items when shopping? (Tick all that apply)
34. Do you regularly look for whole grain claims on packaging when you are shopping? (tick)
35. Do you actively choose foods that say they contain whole grains over foods that do not? (Likert
scale, 0 to 100%)
36. How do you identify if a food is a whole grain food or not? (Tick all that apply)
37. Do you look for any specific words or phrases on packaging when purchasing the following
items? For example: low GI, high fibre, contains whole grains. (Tick, if ticked asked to specify in
open box below)
38. How much do you agree with the following statements about why you eat whole grains/whole
grain foods? (Strongly agree, agree, neutral, disagree, strongly disagree)
39. Are you aware of the Grains and Legumes Nutrition Council?Nutrients 2020, 12, 2170 16 of 20
Appendix B
Table A1. Consistent themes emerging from the data and keywords that summarise participant responses related to whole grain knowledge, attitudes, consumption
and health literacy, in descending frequency.
Theme Subthemes/Keywords Exemplar Quotes
Unprocessed “Unprocessed grains”
Natural “Natural”
Whole grain “Includes the whole grain”
Whole grains Unsure “I don’t know”
Containing husk “Grain that contains all its components”
Not crushed/ground “Grains that are still whole, not crushed up”
Seeds “Grain food with seeds”
Fibre “Good source of dietary fibre”
Nutrients “Provide nutrients”
Less processed “The food that have the least processing are better for you”
Natural “They’re the most natural, best for you”
Unsure “I heard they are good for you but unsure why”
Diet importance Healthier choice “Seems like a healthy choice”
Fuller for longer “Appetite control”
Digestion “Good for the digestive system”
Bowel health “Keep you regular”
Gut health “It is important for gut health”
Low GI “Some have a low glycaemic index”
Healthy diet “Important part of a balanced diet”Nutrients 2020, 12, 2170 17 of 20
Table A1. Cont.
Theme Subthemes/Keywords Exemplar Quotes
Fibre “Higher fibre”
Gut health “Improves gut health”
Digestive health “Good for digestion”
Low GI “Lower GI so good for combating diabetes”
Regularity “To assist in regular bowel movements”
Nutrients “More nutrition content than processed grains”
Health benefits
Lowers cholesterol “Lower cholesterol, better for heart”
Fuller for longer “Keep fuller longer and better for you”
Heart health “Reduce risk of heart disease”
Blood sugar control “Helps control blood sugar levels”
Reduced diabetes risk “Reduce risk for diabetes”
Lower cancer risk “Lower bowel cancer risk”
Taste “Worried about lack of taste”
Price “If they are priced considerably more than traditionally processed foods”
Family influences “My family not liking the taste. If it wasn’t for them I’d buy them”
Barriers to purchasing Texture “Texture in things like bread and wraps”
Dietary requirements “We are coeliac and eat gluten free”
Culinary use “Compatibility with food dishes that I am cooking”
Diet choice “Rarely eat foods containing gluten”
Cooking “Unsure how to cook some of the rarer ones”
Gluten-free diet “Many people seem to think a gluten free diet is healthier”
Weight gain “Weight issues and paranoia about gluten fattening, I’ve cut out carbs at dinner”
Taste “Husband says grains taste like bird seed”
Negative grain association Carbohydrates are bad “Too many carbs are meant to be bad for you”
Paleo diet “Friends following paleo diet”
Keto diet “Carb free diets and keto”
Fad diets “People who are dieting avoid them”Nutrients 2020, 12, 2170 18 of 20
References
1. GBD 2017 Diet Collaborators. Health effects of dietary risks in 195 countries, 1990–2017: A systematic
analysis for the Global Burden of Disease Study 2017. Lancet 2019, 393, 1958–1972. [CrossRef]
2. Newby, P.K.; Maras, J.; Bakun, P.; Muller, D.; Ferrucci, L.; Tucker, K.L. Intake of whole grains, refined
grains, and cereal fiber measured with 7-d diet records and associations with risk factors for chronic disease.
Am. J. Clin. Nutr. 2007, 86, 1745–1753. [CrossRef] [PubMed]
3. Chen, G.-C.; Tong, X.; Xu, J.-Y.; Han, S.-F.; Wan, Z.-X.; Qin, J.-B.; Qin, L.-Q. Whole-grain intake and
total, cardiovascular, and cancer mortality: A systematic review and meta-analysis of prospective studies.
Am. J. Clin. Nutr. 2016, 104, 164–172. [CrossRef] [PubMed]
4. Harland, J.I.; Garton, L.E. Whole-grain intake as a marker of healthy body weight and adiposity.
Public Health Nutr. 2008, 11, 554–563. [CrossRef] [PubMed]
5. Ye, E.Q.; Chacko, S.A.; Chou, E.L.; Kugizaki, M.; Liu, S. Greater Whole-Grain Intake Is Associated with Lower
Risk of Type 2 Diabetes, Cardiovascular Disease, and Weight Gain. J. Nutr. 2012, 142, 1304–1313. [CrossRef]
6. Jacobs, D.R.; Steffen, L.M. Nutrients, foods, and dietary patterns as exposures in research: A framework for
food synergy. AM. J. Clin. Nutr. 2003, 78, 508S–513S. [CrossRef] [PubMed]
7. Jensen, M.K.; Koh-Banerjee, P.; Hu, F.B.; Franz, M.; Sampson, L.; Grønbæk, M.; Rimm, E.B. Intakes of whole
grains, bran, and germ and the risk of coronary heart disease in men. Am. J. Clin. Nutr. 2004, 80, 1492–1499.
[CrossRef]
8. Australian Bureau of Statistics. 4364.0.55.012—Australian Health Survey: Consumption of
Food Groups from the Australian Dietary Guidelines, 2011–2012. Available online: http:
//www.abs.gov.au/ausstats/abs@.nsf/Lookup/by%20Subject/4364.0.55.007~{}2011-12~{}Main%20Features~
{}Cereals%20and%20cereal%20products~{}720 (accessed on 2 June 2020).
9. Galea, L.M.; Beck, E.J.; Probst, Y.C.; Cashman, C.J. Whole grain intake of Australians estimated from a
cross-sectional analysis of dietary intake data from the 2011–2013 Australian Health Survey. Public Health
Nutr. 2017, 20, 2166–2172. [CrossRef] [PubMed]
10. Mann, K.D.; Pearce, M.S.; McKevith, B.; Thielecke, F.; Seal, C.J. Low whole grain intake in the UK: Results
from the National Diet and Nutrition Survey rolling programme 2008–2011. Br. J. Nutr. 2015, 113, 1643–1651.
[CrossRef] [PubMed]
11. Albertson, A.M.; Reicks, M.; Joshi, N.; Gugger, C.K. Whole grain consumption trends and associations with
body weight measures in the United States: Results from the cross sectional National Health and Nutrition
Examination Survey 2001–2012. Nutr. J. 2016, 15, 8. [CrossRef]
12. O’Donovan, C.B.; Devlin, N.F.; Buffini, M.; Walton, J.; Flynn, A.; Gibney, M.J.; Nugent, A.P.; McNulty, B.A.
Whole grain intakes in Irish adults: Findings from the National Adults Nutrition Survey (NANS). Eur. J. Nutr.
2018. [CrossRef] [PubMed]
13. Neo, J.; Brownlee, I. Wholegrain Food Acceptance in Young Singaporean Adults. Nutrients 2017, 9, 371.
[CrossRef]
14. Bellisle, F.; Hébel, P.; Colin, J.; Reyé, B.; Hopkins, S. Consumption of whole grains in French children,
adolescents and adults. Br. J. Nutr. 2014, 112, 1674–1684. [CrossRef] [PubMed]
15. Sette, S.; D’Addezio, L.; Piccinelli, R.; Hopkins, S.; Le Donne, C.; Ferrari, M.; Mistura, L.; Turrini, A. Intakes
of whole grain in an Italian sample of children, adolescents and adults. Eur. J. Nutr. 2017, 56, 521–533.
[CrossRef] [PubMed]
16. Norimah, A.K.; Koo, H.C.; Hamid, J.M.; Mohd Nasir, M.T.; Tan, S.Y.; Appukutty, M.; Nurliyana, A.R.;
Thielecke, F.; Hoplins, S.; Ong, M.K.; et al. Whole Grain Intakes in the Diets Of Malaysian Children and
Adolescents—Findings from the MyBreakfast Study. PLoS ONE 2015, 10, e0138247. [CrossRef]
17. Mejborn, H.; Ygil, K.H.; Fagt, S.; Christensen, E.T. Wholegrain intake of Danes 2011–2012. Available
online: http://www.food.dtu.dk/english/-/media/Institutter/Foedevareinstituttet/Publikationer/Pub-2013/
Rapport_Fuldkornsindtag_11-12_UK.ashx?la=da (accessed on 2 June 2020).
18. Food Standards Australia New Zealand. Australia New Zealand Food Standards Code. Standard 2.1.1.—Cereals
and Cereal Products; Food Standards Australia New Zealand: Canberra, Australia. Available online:
https://www.legislation.gov.au/Details/F2015L00420 (accessed on 20 April 2020).Nutrients 2020, 12, 2170 19 of 20
19. Whole Grain Initiative. Definition of Whole Grain as a Food Ingredient. Available online:
https://wgi.meetinghand.com/projectData/775/webData/Definition-of-Whole-Grain-as-Food-Ingredient-
Version-20190501C.pdf (accessed on 14 July 2020).
20. Health Claim Notification for Whole Grain Foods; U.S. Food and Drug Administration: White Oak, MD,
USA, 1999.
21. Ross, A.B.; van der Kamp, J.-W.; King, R.; Lê, K.-A.; Mejborn, H.; Seal, C.J.; Thielecke, F. Perspective:
A Definition for Whole-Grain Food Products—Recommendations from the Healthgrain Forum. Adv. Nutr.
Int. Rev. J. 2017, 8, 525–531. [CrossRef]
22. Grains & Legumes Nutrition Coucil. GLNC Grains & Legumes Consumption Study. Available online:
https://www.glnc.org.au/resources/glnc-grains-legumes-consumption-study/ (accessed on 8 April 2019).
23. Pollard, C.M.; Pulker, C.E.; Meng, X.; Scott, J.A.; Denham, F.C.; Solah, V.A.; Kerr, D.A. Consumer attitudes
and misperceptions associated with trends in self-reported cereal foods consumption: Cross-sectional study
of Western Australian adults, 1995 to 2012. BMC Public Health 2017, 17, 597. [CrossRef] [PubMed]
24. Kuznesof, S.; Brownlee, I.A.; Moore, C.; Richardson, D.P.; Jebb, S.A.; Seal, C.J. WHOLEheart study participant
acceptance of wholegrain foods. Appetite 2012, 59, 187–193. [CrossRef] [PubMed]
25. Marquart, L.; Pham, A.-T.; Lautenschlager, L.; Croy, M.; Sobal, J. Beliefs about Whole-Grain Foods by Food
and Nutrition Professionals, Health Club Members, and Special Supplemental Nutrition Program for Women,
Infants, and Children Participants/State Fair Attendees. J. Am. Diet. Assoc. 2006, 106, 1856–1860. [CrossRef]
26. SurveyMonkey Inc. Available online: www.surveymonkey.com (accessed on 21 July 2020).
27. McMackin, E.; Dean, M.; Woodside, J.; McKinley, M.C. Whole grains and health: Attitudes to whole grains
against a prevailing background of increased marketing and promotion. Public Health Nutr. 2013, 16, 743–751.
[CrossRef]
28. Braun, V.; Clarke, V. Using thematic analysis in psychology. Qual. Res. Psychol. 2006, 3, 77–101. [CrossRef]
29. Hsieh, H.-F.; Shannon, S.E. Three Approaches to Qualitative Content Analysis. Qualitative Health Res. 2005,
15, 1277–1288. [CrossRef] [PubMed]
30. Kothe, E.J.; Mullan, B.A. Perceptions of fruit and vegetable dietary guidelines among Australian young
adults. Nutr. Diet. 2011, 68, 262–266. [CrossRef]
31. Wagner, M.G.; Rhee, Y.; Honrath, K.; Blodgett Salafia, E.H.; Terbizan, D. Nutrition education effective in
increasing fruit and vegetable consumption among overweight and obese adults. Appetite 2016, 100, 94–101.
[CrossRef]
32. Lang, R.; Jebb, S.A. Who consumes whole grains, and how much? Proc. Nutr. Soc. 2003, 62, 123–127.
[CrossRef] [PubMed]
33. Reynolds, A.; Mann, J.; Cummings, J.; Winter, N.; Mete, E.; Te Morenga, L. Carbohydrate quality and human
health: A series of systematic reviews and meta-analyses. Lancet 2019, 18, 31809. [CrossRef]
34. De Leon, A.; Burnett, D.J.; Rust, B.M.; Casperson, S.; Horn, W.; Keim, N. Liking and Acceptability of Whole
Grains Increases with a 6-Week Exposure but Preferences for Foods Varying in Taste and Fat Content Are
Not Altered: A Randomized Controlled Trial. Curr. Dev. Nutr. 2020, 4. [CrossRef] [PubMed]
35. Ha, E.-J.; Caine-Bish, N. Interactive Introductory Nutrition Course Focusing on Disease Prevention Increased
Whole-Grain Consumption by College Students. J. Nutr. Educ. Behav. 2011, 43, 263–267. [CrossRef] [PubMed]
36. Curtain, F.; Locke, A.; Grafenauer, S. Growing the Business of Whole Grain in the Australian Market: A 6-Year
Impact Assessment. Nutrients 2020, 12, 313. [CrossRef]
37. Mozaffarian, R.; Lee, R.; Kennedy, M.; Ludwig, D.; Mozaffarian, D.; Gortmaker, S. Identifying whole grain
foods: A comparison of different approaches for selecting more healthful whole grain products. Public Health
Nutr. 2013, 16, 2255–2264. [CrossRef]
38. Burke, P.F.; Eckert, C.; Sethi, S. A Multiattribute Benefits-Based Choice Model with Multiple Mediators:
New Insights for Positioning. J. Mark. Res. (JMR) 2020, 57, 35–54. [CrossRef]
39. Suthers, R.; Broom, M.; Beck, E.J. Key Characteristics of Public Health Interventions Aimed at Increasing
Whole Grain Intake: A Systematic Review. J. Nutr. Educ. Behav. 2018, 50, 813–823. [CrossRef] [PubMed]
40. WHO. Health Literacy and Health Behaviour. Available online: https://www.who.int/healthpromotion/
conferences/7gchp/track2/en/ (accessed on 2 June 2020).
41. Vidgen, H.; Gallegos, D. Defining food literacy and its components. Appetite 2014, 76, 50–59. [CrossRef]
[PubMed]You can also read