Costs of Healthy Diets Briefing Paper 2 - Imperial College ...
←
→
Page content transcription
If your browser does not render page correctly, please read the page content below

Costs of Healthy Diets
     Briefing Paper 2
          Prof. Sir Gordon Conway
             Prof. Mark Burgman
                  Zen Makuch
                  Alexa Segal

           Imperial College London
         Faculty of Natural Sciences
       Centre for Environmental Policy

Programme on Protective Foods that Protect the Planet,
       funded by The Rockefeller Foundation.
ACKNOWLEDGEMENTS

This report is authored by Professor Sir Gordon Conway with contributions from Professor
Mark Burgman, Zen Makuch and Alexa Segal. The report was reviewed by Professor Bruce
German (UC Davis) with the input and advice from The Rockefeller Foundation’s team. The
research project is generously funded by The Rockefeller Foundation and supported by
Imperial College London.

Disclaimer:

This report is based on research funded by The Rockefeller Foundation. The findings and
conclusions contained within are those of the authors and do not necessarily reflect
positions or policies of The Rockefeller Foundation.

Suggested citation:

Conway, G.R, Burgman, M., Makuch, Z., Segal, A. (2021) Better Diets, Better Health:
Costs of Healthy Diets. Briefing Paper 2. Centre for Environmental Policy, Imperial
College London. UK: London.

Copyright:

© 2021 The Authors. Published by The Centre for Environmental Policy, Imperial College
London under the terms of the Creative Commons Attribution-NonCommercial-
NoDerivatives 4.0 International License.
https://creativecommons.org/licenses/by-nc-nd/4.0/

Front cover pictures: unsplash.com

THE AUTHORS
      Sir Gordon Conway is Professor of International Development at Imperial College
      London, and a member of the Malabo-Montpellier Panel. He holds a Ph.D. in Systems
      Ecology from the University of California, and a Bachelor of Science in Zoology from
      the University College of Wales.

      He was previously Chief Scientific Adviser to the UK Department for International
      Development, President of the Royal Geographical Society, President of The
      Rockefeller Foundation and Vice-Chancellor of the University of Sussex. He was also
      the Chair of the Montpellier Panel between 2010 and 2016. Sir Conway is a fellow of
      several universities among which the Universities of Wales, Sussex, Brighton, and of
      the West Indies.

      He is a Fellow of the America and World Academy of Arts and Science, recipient of
      the Leadership in Science Public Service Award and a Royal Medal from the Royal
      Geographical Society (2017). In 2002 he was named Distinguished Professor Emeritus
      of Environmental Science by the University of Sussex.

      Professor Mark Burgman is Director of the Centre for Environmental Policy at
      Imperial College London and Editor-in-Chief of the journal Conservation Biology.

      Previously, he was Adrienne Clarke Chair of Botany at the University of Melbourne,
      Australia. He works on expert judgement, ecological modelling, conservation biology
      and risk assessment.

      He has written models for biosecurity, medicine regulation, marine fisheries, forestry,
      irrigation, electrical power utilities, mining, and national park planning. He worked
      as a consultant ecologist and research scientist in Australia, the United States and
      Switzerland during the 1980’s before joining the University of Melbourne in 1990. He
      joined the Imperial College London’s Centre for Environmental Policy in February
      2017. He has published over two hundred and fifty refereed papers and book chapters
      and seven authored books.

      Zen Makuch is a Barrister and interdisciplinary Senior Academic at Imperial College
      London, where he is Director of the Sustainable Transitions and Food SystemsResearch
      Programmes. He has conducted legal and research activities in a balanced mix of 78
      developing, developed, and least developed countries. This also included advisory
      work for the UN, FAO, WHO, OECD, GATT, WTO and a range of other
      international institutions, governments and leading firms. He recently co-designed and
      implemented the first climate change insurance programme for agriculture.

      He is recognised globally for designing and implementing some 125 legislative
      instruments pertaining to the environment, climate change and natural resource
      sustainability.

       Alexa Segal is a Public Health scientist now pursuing a PhD in Health Economics.
       Before beginning her PhD at Imperial College London, Alexa’s research was based on
       paediatric chronic disease epidemiology. Her PhD will focus on fiscal and regulatory
       policies       for governmental childhood obesity strategy and improved food
       environments.
      Alexa has a MPhil in Public Health and Epidemiology from the University of
      Cambridge (UK) and a BSc in Public Health and Global Studies from Temple
      University (USA).
      Currently, Alexa is a Teaching Assistant for two Master courses at Imperial College
      London: the Healthcare and Medical Analytics (Master’s in Business Analytics) and the
      Health Economics (Master’s in International Health Management and Master’s in
      Business Analytics).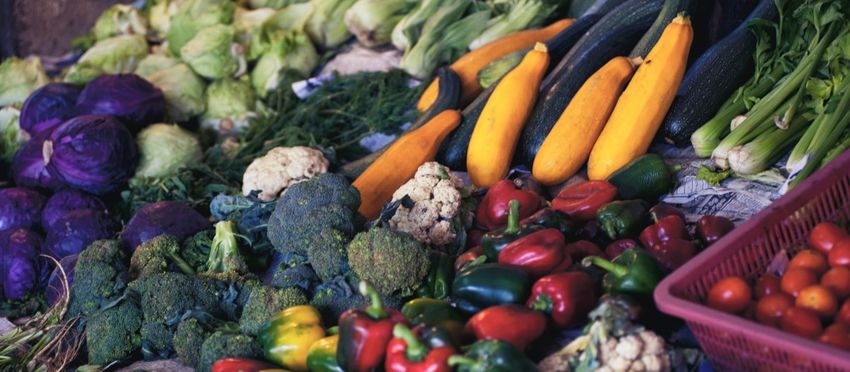
Better diets, Better health - Costs of healthy diets

           COSTS OF HEALTHY DIETS
                                    Summary

      According to the Global Burden of Disease supplement, many populations globally
appear to have become healthier in recent years. Diet-related Disability-Adjusted Life Years
(DALY’s) lost, a good measure of morbidity, have declined, although type 2 diabetes has
worsened. The successes in reducing background mortality have been driven by advances
in technologies, innovations in health diagnostics and therapeutic advances in disease
management, especially in developed countries. However, these successes have not been
matched by improvements in diet-dependent health outcomes that have worsened in all parts
of the world.

       In particular, according to the African literature, there has been a considerable increase
in the prevalence of diet-related cancers and cardiovascular disease (CVD). Obesity is also
very high in South Africa and the US, although low in East Africa. Sub-Saharan Africa (SSA)
is also in the midst of a rapidly expanding epidemic of type 2 diabetes. Specific variations
such as these provide new opportunities to foresee and mitigate emerging health problems
and to enhance diets that improve health effectively, especially in SSA.

       Some countries in East Africa, such as Kenya, are undergoing a nutritional transition
from a cancer-protective traditional diet to a potentially cancer-prone, more “western diet.”
This transition in diet is reflected in an upsurge in cancer incidence in the last few decades.
The highest levels of hypertension, attributable to a changing diet, occur throughout much
of Africa and are higher than in the US. In Kenya, 35 % of men and 37 % of women are
hypertense; these figures have dramatically increased since the year 2000. Furthermore, there
is a rapidly expanding epidemic of type 2 diabetes throughout SSA.

       The concept of broad dietary guidelines seeking to educate populations towards
‘Optimal’ diets is now well established. In this report, we evaluate actual and optimal food
intakes in SSA, noting that in Eastern and Western SSA, the intakes of legumes are in excess
of the targets. Intakes of whole grains are just above the global level, and fibres well above
the global level, in both cases above the North American level. However, intakes of red meat,
processed meat, sugar-sweetened beverages, trans fats and sodium are well below the figures
Better diets, Better health - Costs of healthy diets

for high income North America. Nevertheless, in most instances they are also above the
recommended levels of intake for East Africa.

      In the US, the real price of some foods has been declining, yet the price of foods
associated with healthy outcomes in many parts of East Africa is a barrier to healthy diets.
Individuals consuming an EAT-Lancet diet would require nearly 90 % of the mean per capita
household income for individuals from low-income countries. There is an historical pattern
of poor investment in the agriculture chain reducing affordability and accessibility of a
diversity of foods. The complexity of the modern industrial food system adds to the barriers
and there is an emphasis on providing sufficient caloric intakes, rather than diet quality.

       Studies about the economic impact of unhealthy diets tend to underestimate the
economic burden because they focus on direct health-care costs and overlook indirect costs.
Poor nutrition precipitates substantial direct and indirect economic and social costs, through
obesity, cancer, diabetes and other lifestyle-related diseases. Costs are borne by individuals
and the wider public. However, estimates of the costs and benefits of healthy diets vary
greatly in terms of methodologies and between countries. Healthy diets can help to reduce
chronic disease burden. We explore the implications of our insights and provide a number
of suggestions on the policy improvements that more comprehensive economic assessments
may provide.

      Human capital is a major input to individual and public productivity. Proper nutrition
and protective diets are important determinants of labour market productivity. About 22 %
of the transition growth rate of per capita income in SSA can be attributed to health.

      In terms of immediate and intermediate outcomes, poor diet quality contributes to
negative cognitive outcomes, which have an impact on educational attainment. An average
child born in SSA will only be 40 % as productive as he or she could be with complete
education and full health. A major benefit associated with increased nutrition is the potential
return to human capital (especially in terms of an individuals’ skills, intelligence, and
education), essential for the future of East Africa’s economic growth.
Better diets, Better health - Costs of healthy diets

                  POLICY IMPLICATIONS

          ● There is an urgent need for investment in
            protective diets to benefit individuals and
            populations as well as the future economic
            productivity and social development of SSA.

          ● In SSA, consumption of protective diets is
            well below optimum.

          ● There are clear, yet so far, unsurmountable
            barriers to the accessibility and affordability
            of healthy diets in East Africa.

          ● Better estimates are needed of the costs of
            the direct and indirect economic impacts of
            unhealthy diets on health care.

          ● Investment in proper nutrition and protective
            diets will enhance labour market productivity
            and the overall economy of SSA.

This Briefing Paper, the second of a series, focuses on the Costs of Healthy Diets.
Better diets, Better health - Costs of healthy diets

                                                BACKGROUND

     Much of what we eat is not good for us or for the planet. We consume diets that contribute
to poor health and increase mortality. As we will discuss in a later Briefing Paper, producing
foods contributes substantially to overuse of pesticides and fertilisers, depletion of water
reserves, soil erosion and emissions of greenhouse gases.

     The Rockefeller Foundation initiative has the objective of countering these trends, in part
by shifting food consumption towards dietary patterns that protect against disease (see Briefing
Paper no. 1).1,2

                          Eating is an intimate act and several times each day we
                     think, even superficially, about what we are eating. But eating
                     and drinking have profound effects on our health, lives and
                     communities. It is often said that ‘You are What you Eat.’ Originally,
                     this phrase was first popularised by the influential 18th century
                     French gastronome, Jean-Anthelme Brillat-Savarin, author of
                     the classic, The Physiology of Taste, who advocated the hypothesis
                     that what we ingest becomes part of the composition of our
                     bodies. He wrote “Dis-moi ce que tu manges, je te dirai ce que tu es” (Tell
                     me what you eat, and I will tell you who you are).3 Today, it
                     is even more pertinent, being that evidence is accumulating
                     that our dietary intake is likely to be unhealthy for us.

1
  The Rockefeller Foundation. 2020. RF Food Initiative: Protective Foods Strategy Overview with Learning Approach slides no. 2.
2
  Flor, R. 2019. Focusing on “Protective Foods” to Reduce the Global Burden of Disease. The Rockefeller Foundation. Available from:
https://www.rockefellerfoundation.org/blog/focusing-protective-foods-reduce-global-burden-disease/ (accessed 16.02.21).
3
  “Tell me what you eat: I will tell you who you are.” Quote attributed to Jean Anthelme Brillat-Savarin (1755-1826), French lawyer and politician,
well-known for his work as an epicure and gastronome. Wikipedia, The Free Encyclopedia. Available from:
https://en.wikipedia.org/wiki/Jean_Anthelme_Brillat-Savarin (accessed: 6.04.2020)
Better diets, Better health - Costs of healthy diets

            HEALTHY AND UNHEALTHY DIETS

      Unhealthy diets are defined as those that may result in higher morbidity and mortality
through increased cardio-vascular disease (CVD), cancers, type 2 diabetes and other diseases.
In this series of briefings, we focus on diet-related illnesses in East Africa and, for comparative
purposes, the US.

      Globally, in 2017, dietary factors are believed to be responsible for the loss of 255 million
DALY’s (Disability-Adjusted Life Years). CVD was the leading cause of 207 million diet-related
DALYs with diet-related cancers causing the loss of 20 million DALYs, and type 2 diabetes, 24
million DALYs.4

                                 Figure 1. Diet related DALY’s in East Africa and the US
For Ethiopia, Kenya and Tanzania, diet-related DALYs are 4,300-5,300 per 100,000 population. For the US the DALY’s are 3,085-
4,307 per 100,000 population. The DALYs per 100,000 population for Rwanda are lower and comparable with the US.

Source: Afshin, A. et al. 2019. Health effects of dietary risks in 195 countries, 1990–2017: a systematic analysis for the Global Burden
of Disease Study 2017. Figure 2.The Lancet 393, 1958-1972. Available from: https://pubmed.ncbi.nlm.nih.gov/30954305/ (accessed
02.03.21)

4
 Afshin, A. et al. 2019. Health effects of dietary risks in 195 countries, 1990–2017: a systematic analysis for the Global Burden of Disease Study
201. The Lancet 393, 1958–1972. Available from: https://pubmed.ncbi.nlm.nih.gov/30954305/(accessed 02.03.21)
Better diets, Better health - Costs of healthy diets

                                Are the DALYs going down with time?
                             Surprisingly, the answer appears to be yes.

       In most instances, the DALY’s for East Africa and for Kenya have declined between 1990
and 2017.5 The exception is for type 2 diabetes, where the DALYs have risen. This is also trueof
the US (Tables 1 and 2).

           Table 1. Age standardized DALYs attributable to dietary risks among adults at regional
                               and SDI level for Eastern SSA in 1990 and 2017

                                                                                   1990                   2017

                               All causes                                          8702                    5675

                               CVD                                                 7451                    4661

                               Type 2 diabetes                                      690                     658

                               Neoplasms (cancers)                                  425                     289

         Source: Adapted from Afshin, A. et al. 2019. Health effects of dietary risks in 195 countries, 1990–2017: a systematic
         analysis for the Global Burden of Disease Study 2017. Supplemental table 5. The Lancet, 393(10184), pp.1958–1972.
         Available from:https://ars.els-cdn.com/content/image/1-s2.0-S0140673619300418-mmc1.pdf (accessed 13.10.20)

 5
  Afshin, A. et al. 2019. Health effects of dietary risks in 195 countries, 1990–2017: a systematic analysis for the Global Burden of Disease Study
 2017. Supplementary appendix. The Lancet, 393(10184), pp. 1958–1972. Available from:
 https://ars.els-cdn.com/content/image/1-s2.0-S0140673619300418-mmc1.pdf (accessed 13.10.20)
Better diets, Better health - Costs of healthy diets

                     Table 2. Age standardized rates for DALYs attributable to dietary risks among
                               adults at the national level for Kenya and the US in 1990 and 2017

                                          Kenya 1990            Kenya 2017              USA 1990               USA 2017

             All causes                       5213                  4971                   6204                   3982
             CVD                              4234                  3958                   5201                   2909
             Type 2 diabetes                  607                    719                    489                    647
             Neoplasms
                                              297                    244                    488                    361
             (Cancers)

           Source: Adapted from Afshin, A. et al. 2019. Health effects of dietary risks in 195 countries, 1990–2017: a systematic
           analysis for the Global Burden of Disease Study 2017. Supplemental table 7. The Lancet, 393(10184), pp. 1958–1972.
           Available from: https://ars.els-cdn.com/content/image/1-s2.0-S0140673619300418-mmc1.pdf (accessed 13.10.20)

     According to the Global Burden of Disease Study 2017, these decreases seemed to be
“driven mostly by decreases in the background mortality rate because, during the same period,
the proportion of deaths and DALYs related to dietary risk remained relatively stable.”6 The
background mortality rate has declined because of advances in technology and innovation
in health and health care, especially in the developed countries, even though diets have not
necessarily improved.

                                                                                    Photo by Joshua Hanson on Unsplash

6
    Op. cit. Afshin, A. et al., 2019.
Better diets, Better health - Costs of healthy diets
EAST AFRICA
Thus, the data on cancers and CVDs in
In contrast to the data in Kenya tell a very different story from that of
the US. (Note, however, that these outcomes
Tables 1 and 2 above, there
are not strictly confined to diet-related
is considerable growth morbidity.)
of diet-related DALY’s In Table 3 and in Figure 2, Kenya
in East Africa. stands out as the country in East Africa that
has relatively high prevalence of cancer and
CVD.
Table 3. Prevalence of cancers, CVD, diabetes and obesity in East Africa and the US
Country Cancers CVD Obesity Type 2 diabetes
Per Hypertension Body mellitus
100,000 Prevalence (%) Mass Prevalence
population inadult Index Adult
(2012) population ≥30Kg/m2 percentage(2019)
(2017) adult percentage
(2017)
Ethiopia 101-138 20-25 2.01 3.2
Uganda 137-172 25-30 2.07 1.6
Kenya 172-243 35-40 3.48 2.2
Tanzania 101-137 30-35 3.59 3.7
Rwanda 101-137 21 2.87 2.7
Burundi 101-137 22 1.36 2.4
US 243+ 30-35 14.31 11.1
Source: Data adapted from multiple sources 7, 8 ,9 ,10 ,11
7
Maiyoh, G.K., Tuei, V.C. 2019. Rising Cancer Incidence and Role of the Evolving Diet in Kenya. Nutrition and Cancer 71, 531–546. Available
from: https://doi.org/10.1080/01635581.2018.1542010 (accessed 02.03.21)
8
Mills, K.T., Bundy, J.D., Kelly, T.N., Reed, J.E., Kearney, P.M., Reynolds, K., Chen, J., He, J. 2016. Global Disparities of Hypertension Prevalence
and Control: A Systematic Analysis of Population-based Studies from 90 Countries. Supplemental Table 1. Circulation 134, 441–450. Available
from: https://doi.org/10.1161/CIRCULATIONAHA.115.018912 (accessed 02.03.21)
9
Diabetes prevalence by country. n.d. MECOMeter, Macro Economy Meter. Available from:
http://mecometer.com/topic/diabetes-prevalence/ (accessed 13.10.20)
10
International Diabetes Federation.Diabetes Atlas 9th edition 2019 Available from: https://www.diabetesatlas.org/en/(accessed 14.10.20)
11
Ritchie, H., Roser, M. 2017. Obesity. Available from: OurWorldInData.org. Available from: https://ourworldindata.org/obesity (accessed
13.10.20)Better diets, Better health - Costs of healthy diets
Cancers (Neoplasms) in Kenya
According to Dr Geoffrey Maiyoh,of by a nutritional transition from potentially
Moi University, and Dr Vivian Tuei of Eldoret cancer-protective traditional diets (mostlyrich
University in Kenya, there has been an in dietary fibre, fruits, and vegetables) to a
increase in the incidence of various types of “western diet” (rich in charred red/organ
cancers in the last few decades, with diet- meats, fat, cholesterol, sugar, and salt) that
related cancers such as esophageal, colorectal, elevates cancer risks. The cancer rates for
stomach, prostate, and breast, predominating Kenya are at 172-243 per 100,000, with the
among Kenyans.12 rest of East Africa at 101-172 per 100,000,
compared to more than 243 per 100,000 for
Over the past few decades, this increase
the US (age-standardised rates).13
has been accompanied, and perhaps, caused
Figure 2. Estimated cancer incidence rate per 100,000
Source: © Copyright – International Agency for
Research on Cancer (IARC), 2019. All Rights Re-
served. Ferlay J, Ervik M, Lam F, Colombet M,
Mery L, Piñeros M, Znaor A, Soerjomataram I,
Bray F. 2020. Global Cancer Observatory: Can-
cer Today. Lyon, France: International Agency for
Research on Cancer. Available from: https://gco.
iarc.fr/today (accessed 15.02.21).14,15
12
Op.cit. Maiyoh, G.K. and Tuei. V.C., 2019.
13
Ibid.
14
Sung, H., Ferlay, J., Siegel, R.L., Laversanne, M., Soerjomataram, I., Jemal, A., Bray, F. 2021. Global cancer statistics 2020: GLOBOCAN esti-
mates of incidence and mortality worldwide for 36 cancers in 185 countries. CA Cancer J Clin. Available from:
https://doi.org/10.3322/caac.21660 (accessed 02.03.21)
15
Ferlay J., Colombet M., Soerjomataram I., Mathers C., Parkin D.M., Piñeros M., Znaor A., Bray F. 2019. Estimating the global cancer incidence
and mortality in 2018: GLOBOCAN sources and methods. Int J Cancer. 144(8):1941–1953. Available from:
https://pubmed.ncbi.nlm.nih.gov/30350310/ (accessed 02.03.21)Better diets, Better health - Costs of healthy diets
Cardiovascular Disease (CVD) in Kenya
Hypertension is now the leading dramatic rise from 15 % and 13 % in 2000.
modifiable risk factor causing CVD and Hypertension in Uganda is about 26 % and
premature death world-wide. It is caused, in Tanzania, 26 %.16 Nearly half of adults in the
part, by diets high in salt, fat, and cholesterol. US had hypertension in 2017.17
Globally, over 1.4 billion people in 2010
had hypertension.
Figure 3 reveals that high levels of
hypertension occur throughout much of
Africa. In Kenya, the figure in 2010 was 35
% for men and 37 % for women, showing a
Figure 3. Hypertension prevalence by world region in 2010.
Prevalence of hypertension (systolic blood pressure ≥ 140 mmHg or diastolic blood pressure
≥90 mmHg or use of antihypertensive medication.18
Source: Reprinted by permission from Springer Nature. Mills, K. T., Stefanescu, A. and He, J. 2020. The global epidemiology of hy-
pertension. Figure 2. Nature Reviews Nephrology, 16(4), pp. 223–237. Available from: https://doi.org/10.1038/s41581-019-0244-2
(accessed 02.03.21)
16
Mohamed, S.F., Mutua, M.K., Wamai, R., Wekesah, F., Haregu, T., Juma, P., Nyanjau, L., Kyobutungi, C., Ogola, E. 2018. Prevalence, awareness,
treatment and control of hypertension and their determinants: results from a national survey in Kenya. BMC Public Health 18, 1219. Available
from: https://doi.org/10.1186/s12889-018-6052-y (accessed 02.03.21)
17
Centers for Disease Control and Prevention. 2020. Facts About Hypertension. Available from:
https://www.cdc.gov/bloodpressure/facts.htm (accessed 14.10.20).
18
Mills, K. T. et al. 2016. Global disparities of hypertension prevalence and control: a systematic analysis of population-based studies from 90
countries. Circulation 134, 441–450. Available from: https://pubmed.ncbi.nlm.nih.gov/27502908/ (accessed 02.03.21)
10Better diets, Better health - Costs of healthy diets
Diets that are lower in sodium chloride, Hypertension (DASH) 19,20 is an eating plan
as well as in other components, have been that contains only small amounts of red meat,
observed to lower blood pressure. (Guidelines sweets, and sugar-containing beverages. The
recommend reducing the daily dietary sodium DASH diet is now recommended in the US
intake to 100 mmol or less.)20 national guidelines.21
The Dietary Approach to Stop
The DASH eating plan recommends: In Kenya, the DASH diet may
include the following foods:22
● Eating vegetables, fruits, and
whole grains ● Bananas – potassium lessens
effects of sodium on blood
● Including fat-free or low-fat dairy pressure
products, fish, poultry, beans,
nuts, and vegetable oils ● Berries, especially strawberries,
are rich in flavonoids that may
● Limiting foods that are high help reduce blood pressure
in saturated fat, such as fatty
meats, full-fat dairy products, ● Beets, garlic, herbs and water-
and tropical oils such as coconut, melon are high in nitric acid
palm kernel, and palm oils that can help reduce blood
pressure through vasodilation
● Limiting sugar-sweetened
beverages and sweets ● Fatty fish high in omega-3 fatty
acids that can reduce blood
pressure
19
National Heart, Lung and Blood Institute (NHLBI). DASH Eating Plan. Available from:https://www.nhlbi.nih.gov/health-topics/dash-eating-
plan (accessed 02.03.21).
20
The DASH Diet for Healthy Weight Loss, Lower Blood Pressure & Cholesterol. Available from: https://dashdiet.org/ (accessed 02.03.21)
21
Chobanian, A. V. et al. 2003. Seventh Report of the Joint National Committee on Prevention, Detection, Evaluation, and Treatment of High
Blood Pressure. Hypertension. 2003; 42:1206–1252. Available from: https://www.ahajournals.org/doi/full/10.1161/01.hyp.0000107251.49515.c2
(accessed 02.03.21)
22
Recommended Foods for Patients with High Blood Pressure. 2019. Kenyayote. https://kenyayote.com/recommended-foods-for-patients-with-
high-blood-pressure/ (accessed 02.03.21).
11Better diets, Better health - Costs of healthy diets
Obesity
Another key risk contributing to poor health is obesity, resulting from consumption of
high-energy foods, such as processed foods. Prevalence is measured as Body Mass Index (BMI)
≥30 kg/m2. Obesity is a cardiovascular risk factor closely linked to diet and physical inactivity.
Figure 4 shows the prevalence of obesity in adults. Although the prevalence of obesity
is increasing in East Africa, it remains low on a global scale (between. 1.4 % and 3.6 %). By
comparison, it is very high, over 25% in the US. It is also as high in South Africa.
The prevalence of overweight and obesity among reproductive-age females in Kenya,
attributable to rapid urbanisation and unhealthy lifestyles, almost doubled over a fifteen-year
period between 1993 and 2008.23 In Kenya, overweight prevalence is about 20% and 9 %
for obesity, being higher among women, especially those from urban areas and/or with high
economic status.24
Photo by Annie Spratt on Unsplash
23
Oti, S., Kyobutungi, C. 2011. P2-232 Cardiovascular disease conditions: prevalence, awareness, treatment and control among the urban poor in
Nairobi. J Epidemiol Community Health 65, A285. Available from: https://jech.bmj.com/content/65/Suppl_1/A285.3 (accessed 02.03.21)
24
Mkuu, R.S. 2018. Prevalence and Predictors of Overweight and Obesity Among Kenyan Women. Prev. Chronic Dis. 15. Available from:
https://www.cdc.gov/pcd/issues/2018/17_0401.htm
12Better diets, Better health - Costs of healthy diets
Figures 4. Prevalence of obesity BMI ≥30 kg/m2 in a) Males and b) Females
a) Males
b) Females
Source: Reproduced from Prevalence of obesity among adults, BMI ≥ 30, age-stan-
dardized. Estimates by country. World Health Organization. Global Health Observa-
tory data repository. 2017. Available from: https://apps.who.int/gho/data/view.main.
CTRY2450A?lang=en (accessed 02.03.21) © World Health Organization 2017.
Interactive Graphs: Prevalence of obesity among adults, ages 18+, 1975-2016 (age stan-
dardized estimate): Male, 2016; Prevalence of overweight among adults, ages 18+, 1975-
2016 (age standardized estimate): female, 2016.
13Better diets, Better health - Costs of healthy diets
Type 2 Diabetes
The final factor contributing to ill-
health in Kenya is type 2 diabetes. Globally,
the incidence of diabetes, especially type 2,
is growing rapidly. In 1985, an estimated
30 million people suffered from diabetes,
which, by the end of 2006, had increased to
230 million, representing 6% of the world’s
population.25
Note from Table 2 that the DALYsfor
diabetes in East Africa and the US are
increasing. SSA is in the midst of a rapidly
expanding diabetes epidemic, over the last 25
years increasing by as much as 9 % in South
Africa.26 The national prevalence of diabetes in
Kenya is about 3 %, compared with nearly 11
% in the US.27
Photo by Nadine Primeau on Unsplash
Global and Optimal levels of food intake for Kenya
The data below are taken from the Global Burden of Disease Study 201728 and extracted
from Figure 1 of that report, providing figures for African regions and the US. Note the graphs
in Figures 5 and 6, which show the actual intake levels (dashed line) and the recommended
intake levels in grams per day (dashed green line). The desired level of intake is the level of risk
exposure that minimises the risk from all causes of death.
25
Azevedo, M., Alla, S. 2008. Diabetes in Sub-Saharan Africa: Kenya, Mali, Mozambique, Nigeria, South Africa and Zambia. Int J Diabetes Dev
Ctries 28, 101–108. Available from: https://pubmed.ncbi.nlm.nih.gov/20165596/ (accessed 02.03.21)
26
Sinclair, A.J. 2019. Sub-Sahara Africa:The impact and challenge of type 2 diabetes mellitus requiring urgent and sustainable public health
measures. E. Clinical Medicine 16, 6–7. Available from: https://www.thelancet.com/journals/eclinm/article/PIIS2589-5370(19)30187-7/fulltext
(accessed 02.03.21)
27
International Diabetes Federation.Diabetes Atlas 9th edition 2019 Available from: https://www.diabetesatlas.org/en/(accessed 14.10.20)
28
Op.cit.Afshin, A. et al., 2019.
14Better diets, Better health - Costs of healthy diets
Global intake in 2017 - Optimal level of intake (according to the midpoint of the optimal range of
intake).
Figure 5. Global and Optimal intakes of healthy foods
Notably, in Eastern and Western SSA the intakes of legumes are in excess of the optimal
intake. Intakes of whole grains are just above the global level, and fibres are well above the
global level, in both cases, above the levels in North America.
In Figure 6, intakes of red meat, processed meat, sugar-sweetened beverages, trans fats,
and sodium are well below the figures for high income North America. Nevertheless, in most
instances, they are also above the desirable level of intake for East Africa, marked by the green areas.
Figure 6. Intakes of unhealthy foods
Source (Fig. 5 and 6): Adapted from Afshin, A. et al. 2019. Health effects of dietary risks in 195 countries, 1990–2017: a systematic
analysis for the Global Burden of Disease Study 2017. Figure 1. The Lancet 393, 1958–1972. Available from:
https://doi.org/10.1016/S0140-6736(19)30041-8
15Better diets, Better health - Costs of healthy diets
COSTS AND BENEFITS OF
IMPROVED DIETS IN EAST AFRICA
There are likely considerable economic benefits to East African people,
governments, and societies if the intakes of healthy foods are increased and the
intakes of unhealthy foods decreased, so potentially reducing cancers, cardiovascular
diseases, and diabetes.
Overall costs and benefits of improved nutrition
While unhealthy diets are recognized to contribute to the prevalence of chronic disease
and cancers, estimating the economic impact has proven to be a challenging endeavour.
However, the information obtained from such analysis would provide policy-makers with
important insights, which may lead to the development of more effective interventions aimed
at improving nutrition.
A 2013 review of the costs and benefits of healthy eating in the US used evidence from
economics, medicine, public health, nutrition, and psychology to explain the monetary and non-
monetary incentives and disincentives associated with healthy eating, highlighted in Figure 7.29
Figure 7. The economic costs of healthy eating
Source: Reprinted by permission from Springer Nature. Anekwe, T.D., Rahkovsky, I. 2013. Economic Costs and Benefits of
Healthy Eating. Figure 1. Curr Obes Rep 2, 225–234. Available from: https://doi.org/10.1007/s13679-013-0064-9 (accessed
02.03.21)
29
Anekwe, T.D., Rahkovsky, I. 2013. Economic Costs and Benefits of Healthy Eating. Curr. Obes. Rep. 2, 225–234. Available from:
https://doi.org/10.1007/s13679-013-0064-9 (accessed 02.03.21)
16Better diets, Better health - Costs of healthy diets
Most studies underestimate the economic impacts of unhealthy diets and low physical
activity, typically investigating the costs on the healthcare system but overlooking indirect costs.
Estimating indirect costs (for example, via lost productivity) may double the overall direct
healthcare costs.30
Regardless of the income level of the country, the evidence is clear: poor nutrition is
associated with large economic and social costs, borne by the individual and the public. However,
studies that estimate the costs and benefits of diets differ in measurement tactics, economic
methodologies, and frameworks.
Estimates also vary greatly between countries, which may be due to differences in attributes
such as healthcare and healthcare infrastructure, disparities in socioeconomic conditions and
labour costs, or agricultural markets. This heterogeneity means that analysing the potential
returns on investment from improving diets is not straightforward.
The following sections explain the costs associated with unhealthy diets and the benefits
associated with healthy diets, provide examples of interventions that were successful in East
African settings, and conclude with policy implications for East African countries.
Photo by Doug Linstedt on Unsplash
Candari, C.J., Cylus, J., Nolte, E. 2017. Assessing the economic costs of unhealthy diets and low physical activity: an evidence review and pro-
30
posed framework, Health policy series. WHO Regional Office for Europe, Copenhagen, Denmark. Available from:
https://www.euro.who.int/en/publications/abstracts/assessing-the-economic-costs-of-unhealthy-diets-and-low-physical-activity-an-evidence-review-and-proposed-
framework-2017
(accessed 02.03.21)
17Better diets, Better health - Costs of healthy diets
The Affordability of Healthy Eating
Price
The price of healthy foods in many parts of East Africa is a
barrier to healthy diets.
In contrast to the US, where the real price than 60 % of the poor population receive their
(i.e. price adjusted for inflation) of unhealthy calories from staple items such as rice, and
foods has been declining, the price of healthy wheat, relying on nutrient fortification and
foods in many parts of East Africa is a barrier biofortification.32
to healthy diets. In East Africa, and particularly
in SSA, there is a historical pattern of poor In the seminal study to evaluate the
investment in the agricultural production and affordability of the diet recommended by the
distribution chain. This has led to issues with EAT-Lancet33 Commission, the authors
affordability and accessibility of healthy foods. concluded that the EAT-Lancet diet was
affordable for most people in high income
Further, many of the interventions countries but not for the global low-income
providing nutrition to the poor in East Africa population, putting it out of the reach of 1.58
are still focused on providing sufficient caloric billion people, mostly from SSA and South
intakes, rather than diet quality.31 In SSA, more Asia.34
31
Bhutta, Z.A., Das, J.K., Rizvi, A., Gaffey, M.F., Walker, N., Horton, S., Webb, P., Lartey, A., Black, R.E. 2013. Evidence-based interventions for
improvement of maternal and child nutrition: What can be done and at what cost? Lancet 382, 452–477. Available from:
https://doi.org/10.1016/S0140-6736(13)60996-4 (accessed 02.03.21)
32
UNSCN. 2016. Investments for Healthy Food Systems: A Framework Analysis and Review of Evidence on Food System Investments for Im-
proving Nutrition. Available from:https://www.unscn.org/files/ICN2_TPM/EN_final_Investments_for_Healthy_Food_Systems_UNSCN.pdf
(accessed 02.03.21)
33
The EAT–Lancet Commission constructed the first global benchmark diet capable of sustaining both human health and environmental health.
34
Hirvonen, K., Bai, Y., Headey, D., Masters, W.A. 2020. Affordability of the EAT–Lancet reference diet: a global analysis. Lancet Glob. Heal. 8,
e59–e66. Available from: https://doi.org/10.1016/S2214-109X(19)30447-4 (accessed 02.03.21)
18Better diets, Better health - Costs of healthy diets
The barrier to animal protein in East Africa is, for the most part, due to cost, which,
according to Hirvonen et al (2020): “could be explained by differences in productivity and farm-to-retail
food systems in higher-income countries that feature specialized investment to supply eggs, milk, fish, and other
animal-sourced foods at lower unit cost.”35 Hirvonen et al’s study showed that for individuals acquiring
an EAT-Lancet diet (estimating using the least expensive, local food products) would require
89.1% and 52.4% of the mean per capita household income for individuals from low-income
countries and low-middle income countries, respectively (see Figure 8 below).36
Figure 8. Cost of the EAT–Lancet reference diet relative to mean daily per capita household
income by country income levels and major regions.
“We used price data from the International Comparison Program to estimate the cost of the EAT–Lancet diet and
compared these estimates to mean daily per capita household income…The bottom and top rule marks the bottom
fifth and top fifth percentiles, respectively. The vertical bar rule inside the box shows the median value for the income
group or geographical region. N=141 countries”
Source: Hirvonen, K., Bai, Y., Headey, D., Masters, W.A. 2020. Affordability of the EAT–Lancet reference diet: a global analysis.
Figure 2. Lancet Glob. Heal. 8, e59–e66. Available from: https://doi.org/10.1016/S2214-109X(19)30447-4 (accessed 02.03.21)
35
Op. cit. Hirvonen et al., 2020.
36
Ibid
19Better diets, Better health - Costs of healthy diets
Drivers of choice
The complexity of the food system adds to the barriers
associated with healthy diets.
Drivers of choice include a variety of individually modifiable factors such as time and
convenience, that affect an individual’s ability to consume a healthy diet. For example, healthy
diets often require shopping, travel, preparation, and clean-up that can be a burden on consumers
with little time to spend on such activities.
Unhealthy fast-foods and convenience foods are often nearby and readily available,
especially in high-income countries. Other drivers associated with the choice environment
include knowledge and/or information, specific tastes, preference, and habits.
Consumer psychology and physiology, convenience, and the food environment, i.e. the
consumption of large portions, fast-food advertising, and the wide availability of dessert-like
foods, appear to encourage unhealthy eating habits. Since unhealthy foods are more readily
available in the market than healthy ones, this drives the costs of healthy products up beyond
the monetary capacity of the average consumer. Typically, consumers also bear the cost of
acquiring nutrition information,37 especially in low-income countries, where these costs are also
driven by the food and agriculture systems.
Extended life expectancy
Healthy diets extend life expectancy, resulting in extra costs of age-related health
conditions, though the economic benefits discussed in the next section may overshadow the
costs associated with longer life expectancy.
37
Op.cit. Anekwe, T.D. and Rahkovsky, I.,2013.
20Better diets, Better health - Costs of healthy diets
Benefits of Healthy Eating
Certain dietary patterns, as described above, reduce morbidity and mortality, and produce
economic benefits, including lower medical and institutional care costs, increased productivity,
improved quality of life, and increased life expectancy. We discuss the implications of these
benefits in this section.
Healthcare and medical savings
Estimating the economic impacts of unhealthy diets on health
care is complex.
Most of the evidence on healthcare to £185 per capita.38 Elsewhere, they ranged
savings come from high-income countries. from €143 to €156 for the United Kingdom,
Even this evidence is varied because estimating €63 for Australia and €3.5 for China. The
the economic impacts of unhealthy diets on promotion of healthy diets can help to reduce
healthcare and the wider society is complex; the chronic disease burden which accounts for
healthcare and healthcare systems are complex 70-80% of healthcare budgets (based on
and heterogeneous, as are the consequences of European Union countries).
unhealthy diets – i.e., obesity, cancers, diabetes,
and other lifestyle-related diseases.
A 2017 review of the economic costs
of unhealthy diets and low physical activity
concluded that the medical costs associated
with unhealthy diets in the US ranged from £1
38
Candari, C.J., Cylus, J., Nolte, E. 2017. Assessing the economic costs of unhealthy diets and low physical activity: an evidence review and pro-
posed framework, Health policy series. WHO Regional Office for Europe, Copenhagen, Denmark. Available from:
https://www.ncbi.nlm.nih.gov/books/NBK447219/ (accessed 02.03.21)
21Better diets, Better health - Costs of healthy diets
Human capital and productivity
Proper nutrition and protective diets are important determinants
of labour market productivity and thus overall economic growth of
a country.
A major benefit of improved nutrition such as compromised reasoning and poorer
is the potential return to human capital school grades.
(individuals’ skills, intelligence, education,
training, etc.). According to the Human Capital Individuals with mild or moderate
Index (HCI), the average child born in SSA malnutrition (~30% of the children in the
will only be 40% (compared to the worldwide world) also display significant deficiencies in
average of 57%) as productive as they could “intellectual and behavioural functioning.”41
be with complete education and full health.39 Proper nutrition and protective diets are
Healthy diets are key in accelerating human therefore important determinants of labour
capital development and are essential for the market productivity and the overall economic
future of East Africa’s economy. growth of a country.
In terms of immediate and intermediate In 2019, the World Bank launched the
outcomes, poor diet quality (i.e., inadequate Africa Human Capital Plan, to boost Africa’s
nutrition) contributes to negative cognitive human capital—the health, knowledge, skills,
outcomes and educational attainment.40 The and resilience of its people. The World Bank
literature is clear – those who are extremely estimates that investments in human capital
malnourished exhibit a multitude of impacts, could result in annual yearly-growth of 1.8%
of the countries’ economies over the next 50
39
World Bank. 2020. World Bank Africa Human Capital Plan: Game changers for investing in Africa’s people. Available from:
https://www.worldbank.org/en/region/afr/publication/africa-human-capital-plan (accessed 22.02.21).
40
Whaley, S.E. et al. 2003. The impact of dietary intervention on the cognitive development of Kenyan school children. J Nutr 133, 3965S-3971S.
Available from: https://doi.org/10.1093/jn/133.11.3965S (accessed 02.03.21)
41
Ibid.
22Better diets, Better health - Costs of healthy diets
years.42 A study that investigated health human of stunting. The evidence shows that height
capital on economic growth concluded that – a predictor of poor nutrition – affects
“22% and 30% of the transition growth rate of individuals’ future incomes, even more so
per capita income in SSA and OECD countries in low- and middle-income than in high
respectively, can be attributed to health.”43 income countries, because it limits physical
This supports the claim that improvements to productivity in manual occupations.45 As
health through improved diets would result in discussed above, indirect effects of improved
significant economic development. diets include improved cognition, which
enhances educational attainment, which later
Health is a type of human capital in contributes to wages. A 2019 study combined
itself, but it is also an input to other forms the impact of stunting rates with income
of human capital.44 Healthy diets are a crucial penalties (combining the effects on schooling,
element of the relationship between human cognition and height) and estimated that “an
capital development and economic success. average country’s GDP per capita is 7% lower
Human capital theory posits that health isvital than it would have been if none of its current
to cognitive and educational outcomes in workers had been stunted in childhood,” with
early life and is a predictor of longer-term the average even higher in Africa at 9-10%.46
outcomes. For example, since healthy diets are
protective (against cancers, chronic diseases,
etc.), they increase life expectancy, motivating
and incentivising individuals to make personal
investments in skill acquisition (via education
and training). As such, human capital is a major
input to both individual and public growth.
Previous interventions on healthy diets
in East Africa have focused on the reduction
42
Op.cit. The World Bank, 2020.
43
Gyimah-Brempong, K., Wilson, M. 2004. Health human capital and economic growth in Sub-Saharan African and OECD countries. Q. Rev.
Econ. Financ. 44, 296–320. Available from: https://doi.org/10.1016/j.qref.2003.07.002 (access 02.03.21)
44
Oster, E., Shoulson, I., Dorsey, E.R. 2013. Limited life expectancy, human capital and health investments. Am. Econ. Rev. 103, 1977–2002.
Available from: https://doi.org/10.1257/aer.103.5.1977 (accessed 02.03.21)
45
Horton, S., Hoddinott, J. 2014. Food Security and Nutrition Perspective Paper. Copenhagen Consens. 14.
46
Galasso, E., Wagstaff, A. 2019. The aggregate income losses from childhood stunting and the returns to a nutrition intervention aimed at reduc-
ing stunting. Econ. Hum. Biol. 34, 225–238. Available from: https://doi.org/10.1016/j.ehb.2019.01.010 (accessed 02.03.21)
23Better diets, Better health - Costs of healthy diets
POLICY IMPLICATIONS
● Focus on the first 1000 days
Stunting of children can be
overcome by providing adequate
diets in the first 1000 days of
childhood.
The literature on human capital inEast
African countries points to the ‘1000
days’ theory – that is that child
development depends critically on dietary
intake (quality and quantity) during the
first 1000 days of life after conception.47
Policy implications include focusing
nutrition and dietary interventions onthis
period to ensure that young childrenand
mothers receive adequate nutrition,
especially within the first 1000 days post-
conception. Proper nutrition and healthy
diets will have beneficial effects later in
life, affecting all aspects of human capital
(Figure 9).
For the sake of future work on these
topics, weight at age two is a good
predictor of adult height and adult
height is associated with wages.48 A
survey of eight low- and middle-income
countries found that median hourly
wages increased by 4.5% with each
centimetre of adult height and that adult
height tracks economic development.
Figure 9. A life-cycle approach to investments within the first 1000 day.
Source: Reproduced with permission of the corresponding author. Figure 1 A life-cycle approach to investments in the
First 1000 Days in Hoddinott, J., Alderman, H., Behrman, J.R., Haddad, L., Horton, S., 2013. The economic rationale for
investing in stunting reduction. Matern. Child Nutr. 9, 69–82. Available from: https://doi.org/10.1111/mcn.12080 (ac-
cessed 02.03.21)
47
Hoddinott, J., Alderman, H., Behrman, J.R., Haddad, L., Horton, S. 2013. The economic rationale for investing in stunting reduction. Matern.
Child Nutr. 9, 69–82. Available from: https://doi.org/10.1111/mcn.12080 (accessed 02.03.21)
48
Horton, S. and R.H. Steckel. 2013. Malnutrition: global economic losses attributable to malnutrition 1900-2000 and projections to 2050. In B.
Lomborg (ed.) How much have global problems cost the world?. Cambridge: Cambridge University Press.
24Better diets, Better health - Costs of healthy diets
● Wholistic research mandate
Future research should focus on all parts of the ‘puzzle’.
As already mentioned, there is limited evidence of the potential returns on investment associated
with improved nutrition for people in East and SSA. Firstly, there is a gap in the literature on
the economic impacts on health care and potential health care savings in these geographic areas.
Estimating the financial impact associated with indirect costs of poor nutrition in this area will be
essential for future growth – both, economic and social.
This urgency for research and development aimed at the improvement of children’s diets will
become a financially justifiable enterprise when the costs of not doing so are factored. Therefore,
moving forward, future research should focus not only on what infants and children need in diets,
but also on the infrastructure and logistics necessary to facilitate this. This research must study and
account for the local environments as the means to achieve the goals associated with improved
diets.”
● Accountability of the governing body
Many governments are forming multi-sectoral nutrition policies.
Historically, interventions in East Africa have focused on undernutrition and adequate caloric
intake. However, following the advice of the Food and Agriculture Organization of the United
Nations (FAO), to allow for diverse healthy diets, many organizations have employed the use of a
Continental Nutrition Accountability Scorecard to hold African governments more accountable for
their progress in nutrition. Based on the evidence that healthy diets support economic development,
many African governments are forming multi-sectoral nutrition policies. These policies include
embedding nutrition education in primary and secondary school and incorporating it in the ante-
natal clinic services for pregnant women.50
50
Bafana, B. 2019. Nutrition: the Best Investment for a Developing Africa. Inter Press Serv.. Available from:
http://www.ipsnews.net/2019/10/nutrition-best-investment-developing-africa/ (accessed 02.03.21)
25Better diets, Better health - Costs of healthy diets
● Food availability
Diets need to be affordable but also of high nutrient quality.
Research on the nutrition goals from the 2015 Millennium Development Goals (MDGs) and the
WHO targets for 2025 show the potential benefits of good nutrition, specifically on stunting rates.
We have only begun to understand the full implications of specific nutrients and micronutrients on
diets. A study in rural Kenya designed to test the impact of different diets on school children’s
cognitive development concluded that diet quality, particularly increased animal protein, was
positively associated with cognitive development in Kenyan children.51 The authors of this
study recommended diets including more rabbits and chickens, which are available and culturally
acceptable in this region. Increasing access to animal source foods could be greatly beneficial to
individuals, especially children, in low-income countries.
Attaining the essential nutrients, as outlined by the EAT-Lancet reference diet through vegetable
alternatives, makes diet goals even more affordable. In the future, policy makers should focus on
designing reference diets and global reports that are nutritionally focused, available, accessible, and
affordable for people in low- and middle-income countries.
Some studies support the notion that lowering the prices on healthier foods would greatly benefit
people in low-income countries. This could be achieved through healthy food subsidies or,
according to Hirvonen et al (2020): “improvements in local production, marketing, and trade,
and expanding the range of lower-cost options in each food group.”52 Careful economic design,
effective policies and regulations are needed in much of SSA to reduce the price of healthy foods
so that most people in low-income countries can afford healthy diets. Information on the benefits
of these diets will need to be made equally accessible, so that people are incentivized appropriately
to make effective changes in their eating habits.
Photo by Alexandr Podvalny on Unsplash
51
Op. cit.Whaley et al., 2003
52
Op. cit. Hirvonen et al., 2020.
26You can also read