Flaxseed Oil and Heated Flaxseed Supplements Have Different Effects on Lipid Deposition and Ileal Microbiota in Albas Cashmere Goats - MDPI
←
→
Page content transcription
If your browser does not render page correctly, please read the page content below
animals
Article
Flaxseed Oil and Heated Flaxseed Supplements Have Different
Effects on Lipid Deposition and Ileal Microbiota in Albas
Cashmere Goats
Shulin Liu, Xue Wang, Yinhao Li, Binlin Shi, Xiaoyu Guo, Yanli Zhao and Sumei Yan *

                                            Inner Mongolia Key Laboratory of Animal Nutrition and Feed Science, College of Animal Science,
                                            Inner Mongolia Agricultural University, Huhhot 010018, China; liushulin0723@163.com (S.L.);
                                            wangxue199204@163.com (X.W.); yinhaoli2019@126.com (Y.L.); shibinlin@yeah.net (B.S.);
                                            gxy_2594@163.com (X.G.); ylzhao2010@163.com (Y.Z.)
                                            * Correspondence: yansmimau@163.com

                                            Simple Summary: With the grassland desertification intensified, pasture carrying capacity decreased,
                                            and grass seasonal changed, stall-feeding fattening has become an effective means to protect the
                                            natural environment. The stall-feeding fattening increased the cashmere goats’ weight but reduced
                                            the meat quality and increased the saturated fatty acids content in muscle and fat tissue of cashmere
                                            goats. Supplementing flaxseed and flaxseed oil rich-in linolenic acid (ALA) to diet to improve meat
                                            quality is an effective nutritional regulation means. Previous research results of our team showed
                                  that compared to diet supplemented with flaxseed oil, added flaxseed increased linoleic acid biohy-

                                            drogenation by reducing the Ruminobacter relative abundance and increasing the relative abundance
Citation: Liu, S.; Wang, X.; Li, Y.; Shi,   of Prevotellaceae_UCG-001 and Fretibacterium in rumen, protected ALA away from biohydrogenation,
B.; Guo, X.; Zhao, Y.; Yan, S. Flaxseed     and more n-3 polyunsaturated fatty acids entered the post-intestinal tract. Based on the previous
Oil and Heated Flaxseed                     research, this study explored whether the ALA flowing into the posterior intestine can reduce
Supplements Have Different Effects
                                            fat deposition and blood lipid by affecting intestinal microbiota. The results showed that adding
on Lipid Deposition and Ileal
                                            flaxseed grain to diet decreased the growth performance, lipid deposition, and blood lipid content of
Microbiota in Albas Cashmere Goats.
                                            goats by regulating the blood lipid-related enzyme activity, which positively associated with [Eu-
Animals 2021, 11, 790. https://
                                            bacterium]_coprostanoligenes_group, but negatively associated with unclassified_f_Peptostreptococcaceae,
doi.org/10.3390/ani11030790
                                            Intestinibacter, and Ruminococcus_2.
Academic Editors: Gabriel De
La Fuente, Joaquim Balcells and             Abstract: The present study investigated the effect of flaxseed grain or flaxseed oil on ileal microbiota
Ahmad Reza Seradj                           and lipid deposition of cashmere goats. Sixty kid goats (average body weight 18.6 ± 0.1 kg) were allo-
                                            cated to three treatments, fed for 90 days, with control treatment: basal diet (CON, total-mixed ration),
Received: 17 February 2021                  experimental treatment: basal diet with added flaxseed oil (LNO), experimental treatment: basal diet
Accepted: 8 March 2021                      with added heated flaxseed grain (HLS). The final body weight, body weight gain, the weight of
Published: 12 March 2021                    kidney fat, omental fat, tail fat, and fat tissue, the activity of fatty acid synthetase, acetyl-coa carboxy-
                                            lase, and malic dehydrogenase, and the relative abundance (RA) of unclassified_f_Peptostreptococcaceae
Publisher’s Note: MDPI stays neutral        and Intestinibacter were remarkably higher in the LNO treatment than in the HLS treatment, but
with regard to jurisdictional claims in
                                            the [Eubacterium]_coprostanoligenes_group RA showed the opposite result. The content of triglyc-
published maps and institutional affil-
                                            eride, cholesterol, and low-density lipoprotein cholesterol were significantly higher in the CON and
iations.
                                            LNO treatments than in the HLS treatment, while the hormone-sensitive lipase activity and the
                                            non-esterified fatty acid content showed the opposite result. In conclusion, the flaxseed grain is more
                                            efficient than flaxseed oil in ameliorating the blood lipid profiles and it is a potential product for
                                            decreasing the lipid deposition of cashmere goats.
Copyright: © 2021 by the authors.
Licensee MDPI, Basel, Switzerland.
                                            Keywords: flaxseed; flaxseed oil; lipid deposition; ileal microbiota; cashmere goats
This article is an open access article
distributed under the terms and
conditions of the Creative Commons
Attribution (CC BY) license (https://
creativecommons.org/licenses/by/
4.0/).

Animals 2021, 11, 790. https://doi.org/10.3390/ani11030790                                                    https://www.mdpi.com/journal/animals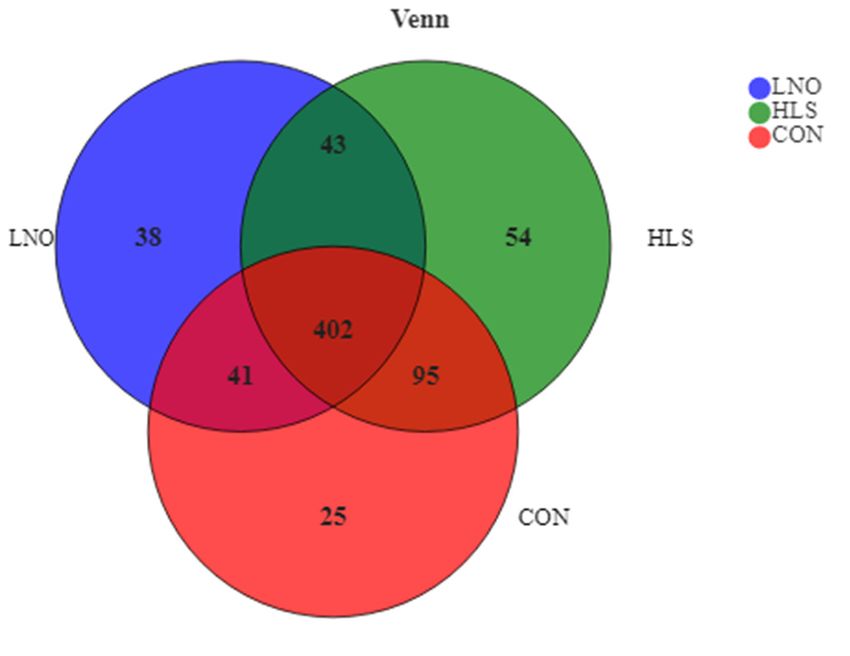
Animals 2021, 11, 790                                                                                            2 of 19

                        1. Introduction
                              Albas white cashmere goat is a world famous local breed producing cashmere and
                        meat, coming from the plateau region of Ordos, Inner Mongolian, China. In recent years,
                        due to the limitation of natural grassland resources, degeneration of the grassland, and
                        the increase of mutton market demand, the fattening pattern has changed from traditional
                        pasture fattening to feedlot fattening, which can alleviate the pressure of grassland and
                        increase the economic benefits. However, changes in fattening pattern mean the alteration
                        of diet nutritional level, which can cause metabolic changes in livestock. For lambs fed
                        an energy-restricted feeding sequence program to mimic the seasonal changes of the
                        natural grasslands, the results indicated that sequentially restricting metabolizable energy
                        intake resulted in a reduction of body weight, serum glucose (GLU) and triglyceride (TG)
                        concentration [1]. Feeding high-energy diets increased serum GLU and cholesterol (CHO)
                        content in ewes [2]. Chen et al. reported that the diet with low ratio of forage to concentrate
                        (F:C = 50:50) had a higher concentration of serum high-density lipoprotein cholesterol
                        (HDL-C) in Yak than the diet with high-forage (F:C = 70:30, F:C = 60:40) groups [3]. Previous
                        research reported an increase of plasma total lipids, CHO, TG, phospholipids, and non-
                        esterified fatty acid (NEFA) in ruminant, which lead to lipid infiltration of the liver, and
                        this favors the appearance of ketoacidosis, to the detriment of the health and reproductive
                        performance of the animal [4]. Therefore, the increasing studies ameliorating the lipid
                        metabolism of ruminants in stall fattening are very necessary. Manipulating the dietary
                        fat might be a feasible approach to regulate blood lipid metabolism, however, very little
                        information on ruminants is available. Flaxseed contains 32% to 45% of its mass as oil,
                        of which 51% to 55% is a-linolenic acid (ALA) and 15% to 18% is linoleic acid, and it
                        includes the flax lignan complex [5]. The main components of flaxseed oil are saturated
                        fatty acid (SFA, 9%), monounsaturated fatty acid (18%), and ALA (57%) [6]. ALA is the
                        most important fatty acid in flaxseed oil and flaxseed, which are the most important
                        functional phytochemicals in flaxseeds for human health [7], and it is the precursor to the
                        synthesis of eicosapentaenoic acid (EPA) and docosahexaenoic acid (DHA). The research
                        observed that the addition of flaxseed could reduce the serum CHO concentration of
                        cows [8], and another study reported that dietary calcium ALA could significantly reduce
                        serum CHO, TG, and low-density lipoprotein cholesterol (LDL-C) levels in high-fat-fed
                        mice [9]. Our previous study showed that flaxseed oil and flaxseed grain supplemented in
                        diet showed different effects on increasing the concentration of ALA, EPA, DHA, and n-3
                        polyunsaturated fatty acids (n-3PUFA) in plasma and tissues in Albas cashmere goats, and
                        flaxseed grain was more efficient [10]. n-3 PUFAs reduced plasma TG by approximately
                        20–30% and decreased the substrate of oxidative LDL-C and remnant CHO taken up by
                        macrophages [11,12]. These researches hinted that flaxseed and flaxseed oil rich in n-3
                        PUFA may regulate the blood lipid profiles and lipid deposition, and they probably have
                        different influences, but limited data are available, and the mechanism is also unclear.
                              Gut microbiota may be involved in the regulation of serum lipid levels and lipid
                        accumulation, because it plays important roles in host metabolism [13]. Wen et al. re-
                        ported that the genus Methanobrevibacter and the species Mucispirillum schaedleri were
                        strongly associated with fat deposition in gut of chickens [14]. The bacteria in cecum of
                        pigs positively associating with LDL-C/HDL-C in serum belongs to Proteobacteria, which
                        is associated with inflammation [15]. An increase of serum LDL-C, very LDL-C and lipids
                        concentration by dietary butyrate glycerides in broilers, not only significantly increased the
                        Bifdobacterium abundance but also boosted the species diversity, and the results suggested
                        the potential contribution of intestinal bacteria to lipid metabolism/energy homeostasis
                        in broilers [16]. The previous research results of our team showed that compared to diet
                        supplemented with linseed oil, added flaxseed increased linoleic acid biohydrogenation by
                        reducing the relative abundance of Ruminobacter and increasing the relative abundance of
                        Prevotellaceae_UCG-001 and Fretibacterium in rumen, protected ALA away from biohydro-
                        genation, and lead to more n-3 PUFAs entering the post-intestinal tract [17]. The previous
                        studies have shown that except for the rumen and large intestine, the ileum also serves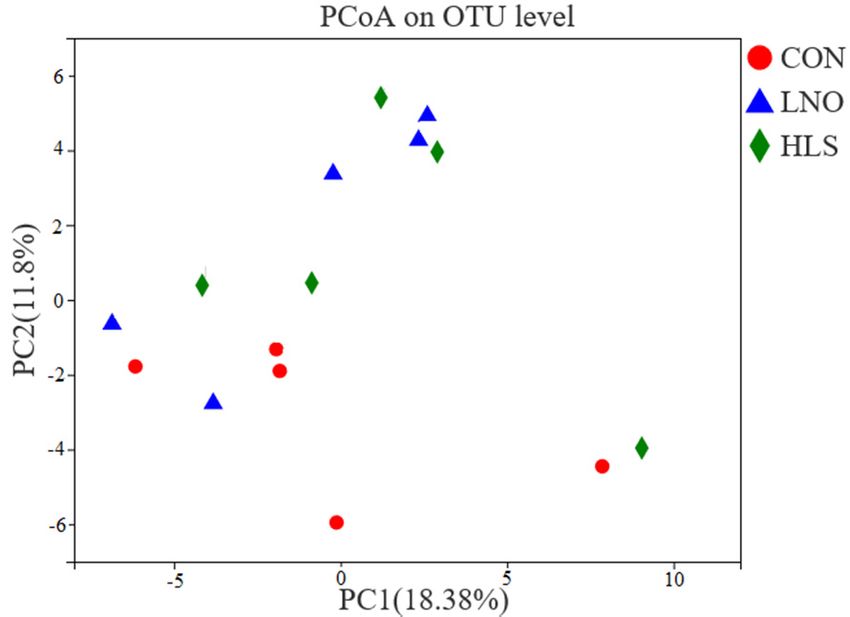
Animals 2021, 11, 790                                                                                            3 of 19

                        as an indispensable fermentation site in goats [18,19]. Yan et al. reported that there is a
                        larger number of cellulolytic bacteria in sheep ileum, particularly Clostridium cluster IV [20].
                        Therefore, we hypothesized that ALA-rich flaxseed oil and flaxseed grain supplements
                        have different effects in ameliorating blood lipid profiles and lipid deposition in Albas
                        cashmere goats, and the mechanism is probably involved in altering ileal microbial compo-
                        sition. The current study aimed to test whether supplementing flaxseed oil and flaxseed
                        grain in diet has different regulation on lipid deposition and ileal microbiota community in
                        Albas cashmere goats, and to explain the possible mechanism of flaxseed oil and flaxseed
                        in ameliorating lipid deposition.

                        2. Materials and Methods
                             The experiment was conducted in the experimental farm of Inner Mongolia Agri-
                        cultural University (Hohhot, China). All animal procedures were performed under the
                        national standard Guidelines for Ethical Review of Animal Welfare (GB/T 35892-2018).

                        2.1. Experimental Design, Diet, and Feeding Management
                             A single-factor completely randomized design was used. Sixty 4-month-old castrated
                        Albas cashmere male kid goats were selected from a farm, at Etuoke Town, Inner Mongolia,
                        with an initial live weight of 18.6 ± 0.1 kg, and were randomly assigned to three treatments,
                        with each treatment comprising 4 units of 5 goats. The control group (CON) was fed
                        the basal diet with no supplementation. The experimental group was fed the flaxseed
                        oil-supplemented diets (LNO) prepared by manually blending the oil thoroughly into the
                        ground concentrate to ensure homogenous distribution of the oil in the ration. Another
                        experimental group was fed the basal diet supplemented with heated flaxseed grain (HLS,
                        the flaxseed contains about 36% oil and it was stir roasted at 120 ◦ C for 10 min), which
                        provided the same content of flaxseed oil as the LNO group. The nutrition levels of the
                        diet could meet the needs of growing cashmere kids, according to the feeding standard
                        of meat-producing sheep and goats (NY/T816, 2004 [21]; Table 1). The trial consisted of
                        a 14-day adaptation period and a 90-day treatment period, including early (1 to 30 days),
                        medium (31 to 60 days), and late (61 to 90 days) fattening stages. The diet was offered to
                        goats twice daily at 08:30 am and 16:30 pm as total mixed ration (concentrate to forage ratio
                        of 50:50) and the goats were given free access to drinking water. To estimate feed intake for
                        five goats in each pen, refusals were collected and weighed 30 min before each feeding, at
                        08:00 am daily. All goats were weighed (before feeding in the morning) on day 0 (initial
                        body weight, IBW) and days 90 (final body weight, FBW) of the measurement periods to
                        determine changes in body weight (total body weight gain, BWG).

                        2.2. Sample Collection
                             At the end of the experiment, 2 goats from each experimental unit (8 goats per
                        treatment) were randomly selected for slaughtering by exsanguination. Before slaughter,
                        the goats were prevented from consuming feed for 24 h and from drinking for 2 h. Jugular
                        blood (20 mL) was sampled into Vacutainer tubes after the goats were prevented from
                        consuming feed for 12 h. Blood was centrifuged at 3000× g for 15 min and serum was
                        harvested, and at last stored at −20 ◦ C for lipid profiles and enzymatic activity analysis.
                        Immediately after death, the ileal digesta were collected, flash-frozen by liquid nitrogen,
                        and stored at −80 ◦ C for microbial diversity analysis.
Animals 2021, 11, 790 4 of 19
Table 1. The composition and nutrient levels of CON, LNO, and HLS group (dry-matter basis, DM basis).
1 to 30 Days 31 to 60 Days 61 to 90 Days
Ingredients
CON LNO HSL CON LNO HSL CON LNO HSL
Alfalfa 25.00 25.00 25.00 15.00 15.00 15.00 12.50 12.50 12.50
Corn stalk 5.00 5.00 5.00 20.00 20.00 20.00 25.00 25.00 25.00
Oat 20.00 20.00 20.00 15.00 15.00 15.00 12.50 12.50 12.50
Corn 28.41 23.37 23.17 30.80 30.40 29.90 31.30 29.90 29.40
Soybean meal 46% 11.70 10.50 11.50 9.50 11.40 11.90 8.00 10.40 10.90
Distillers dried grains with solubles,
3.00 7.24 7.74 4.00 0.50 0.50 4.00 0.50 0.50
DDGS
Flaxseed meal 4.80 4.80 0.00 3.50 3.50 0.00 4.50 4.50 0.00
Flaxseed 0.00 0.00 5.50 0.00 0.00 5.50 0.00 0.00 7.00
Flaxseed oil 0.00 2.00 0.00 0.00 2.00 0.00 0.00 2.50 0.00
Premix (1) 0.50 0.50 0.50 0.50 0.50 0.50 0.50 0.50 0.50
Limestone 0.2 0.2 0.2 0.2 0.2 0.2 0.2 0.2 0.2
CaHPO4 0.2 0.2 0.2 0.2 0.2 0.2 0.2 0.2 0.2
NaCl 0.54 0.54 0.54 0.50 0.50 0.50 0.50 0.50 0.50
NaHCO3 0.35 0.35 0.35 0.80 0.80 0.80 0.80 0.80 0.80
MgO 0.30 0.30 0.30 0.00 0.00 0.00 0.00 0.00 0.00
Total 100.00 100.00 100.00 100.00 100.00 100.00 100.00 100.00 100.00
Nutrient levels
Digestible energy, DE MJ/Kg DM (2) 12.83 13.09 13.06 12.87 13.00 12.96 12.74 13.09 13.05
Dry Matter, DM/% 88.02 88.36 88.24 89.14 89.36 89.32 87.09 87.02 87.03
Crude protein, CP g/kg DM 188.73 188.13 188.20 162.84 158.71 159.69 153.52 151.34 151.85
Ether extract, EE g/kg DM 29.12 53.97 53.97 28.99 45.84 46.14 26.85 48.99 49.92
Neutral Detergent Fiber, NDF g/kg
425.31 431.18 441.6 448.6 427.41 439.12 457.42 436.06 450.68
DM
Acid Detergent Fiber, ADF g/kg DM 232.2 237.71 243.3 242.59 235.23 248.4 247.69 240.32 256.96
Calcium, Ca g/kg DM 11.25 11.11 11.00 10.48 10.89 10.78 10.26 10.67 10.56
Phosphorus, P g/kg DM 4.65 4.67 4.78 4.50 4.44 4.56 4.31 4.22 4.33
(1)Per kilogram of premix provided the following: iron (Fe) 4 g, copper (Cu) 0.8 g, zinc (Zn) 5 g, manganese (Mn) 3 g, iodine (I) 30 mg,
selenium (Se) 30 mg, cobalt (Co) 25 mg, vitamin (VA) 600,000 IU (International Unit), vitamin D (VD3) 250,000 IU, vitamin E (VE) 1250 IU,
vitamin K (VK3) 180 mg, vitamin B1 (VB1) 35 mg, vitamin B2 (VB2) 850 mg, vitamin B6 (VB6) 90 mg, nicotinic acid 2200 mg, D-pantothenic
acid 1700 mg, vitamin B12 (VB12) 3 mg, biotin 14 mg, folic acid 150 mg. (2) Digestible energy was calculated based on the ingredients of the
diet and their digestible energy content, not based on the actual dry matter intake. CON: basal diet; LNO: basal diet added with flaxseed
oil; HLS: basal diet added with heated flaxseed grain.
2.3. Chemical Analysis
The concentrations of TG, CHO, LDL-C, and HDL-C in serum were analyzed in an au-
tomatic biochemical analyzer (L-8900) using commercially available kits (Lepu Diagnostics
Co., Ltd., Beijing, China). The concentrations of NEFA, GLU, and β-hydroxybutyric acid
(BHBA) in serum were analyzed through commercially available kits (Nanjing Jiancheng
Bioengineering Institute, Nanjing, Jiangsu, China). The quantity of acetyl-coa carboxylase
(ACC, CK-E75273), fatty acid synthetase (FAS, CK-E75339), malic dehydrogenase (MDH,
CK-E75029), lipoprotein lipase (LPL, CK-E75274), hormone-sensitive lipase (HSL, CK-
E75402), and lipase (LPS, CK-E75263) were measured by enzyme-linked immunosorbent
assay (ELISA) kits (QUANZHOU RUIXIN BIOTECHNOLOGY CO., LTD., Quanzhou, Fu-
jian, China), and the experiments were performed strictly according to the manufacturer’s
instructions. Meanwhile, the standard curves of enzymes were established. Briefly, 10 µL
serum sample and 40 µL sample diluent were added to the coated plate, and 100 µL diluted
enzyme-labeled antibody was added to the plate, incubated at 37 ◦ C for 1 h, then washed
five times with phosphate-buffered saline (PBS) (let stand for 1 min). 100 µL substrate
Tetramethylbenzidine (TMB) was added and avoided light incubation at 37 ◦ C for 15 min,
the reaction was terminated with 50 µL 2 M H2 SO4 , and the optical density (OD) was
measured at 450 nm.
2.4. 16S rRNA Gene Sequencing and Operational Taxonomic Units (OTUs) Picking
2.4.1. DNA Extraction and Checking
Five ileal digesta samples from each treatment group were selected to extract the
microbial DNA using the E.Z.N.A.® soil DNA Kit (Omega Bio-tek, Norcross, GA, USA)
according to the instruction manual. The final DNA concentration and OD (OpticalAnimals 2021, 11, 790 5 of 19
Density) 260/280 values were determined by NanoDrop 2000 UV-vis (ultraviolet-visible)
spectrophotometer (Thermo Scientific, Wilmington, NC, USA), and DNA quality was
checked through 1% agarose gel electrophoresis.
2.4.2. PCR (Polymerase Chain Reaction) Amplification and Checking
The amplified region is V3–V4 hypervariable regions of the bacteria 16S rRNA gene.
The amplified primers are 338F (50 -ACCHOCTACGGGAGGCAGCAG-30 ) and 806R (50 -
GGACTACHVGGGTWCHOTAAT-30 ), and are universal primers. The procedure of PCR
reactions was as follows: 3 min of denaturation at 95 ◦ C, 27 cycles of 30 s at 95 ◦ C, 30 s
for annealing at 55 ◦ C, and 45 s for elongation at 72 ◦ C, and a final extension at 72 ◦ C for
10 min. The mixed volume of PCR reactions was 20 µL: 4 µL of 5× FastPfu Buffer, 2 µL of
2.5 mM dNTPs (Deoxynucleotide Triphosphates), 0.8 µL of each primer (5 µM), 0.4 µL of
FastPfu Polymerase, and 10 ng of template DNA. The PCR products were extracted from a
2% agarose gel and further purified using the AxyPrep DNA Gel Extraction Kit (Axygen
Biosciences, Union City, CA, USA) and quantified using QuantiFluor™-ST (Promega,
Madison, WI, USA) according to the instruction manual.
2.4.3. Illumina MiSeq Sequencing
Purified amplicons were pooled on an Illumina MiSeq PE300 instrument (Illumina,
San Diego, CA, USA) which were equimolar and paired-end sequenced (2 × 300) according
to the standard protocols by Majorbio Bio-Pharm Technology Co. Ltd. (Shanghai, China).
2.4.4. Bioinformatics
Raw data was filtered and analyzed using QIIME (Quantitative Insights into Microbial
Ecology, version 1.9.1) software, quality-filtered by Trimmomatic and merged by FLASH
(Fast Length Adjustment of Short Reads). Low-quality reads were removed with the fol-
lowing criteria: (i) The reads were truncated at any site receiving an average quality score
< 20 over a 50 bp sliding window, (ii) primers’ matching allowed 2-nucleotide mismatching,
and reads containing ambiguous bases were removed, and (iii) sequences with an overlap
longer than 10 bp were merged according to their overlap sequence. The assembled se-
quences were assigned to operational taxonomic units (OTUs) at 97% similarity cutoff using
UPARSE (Highly Accurate OTU Sequences from Microbial Amplicon Reads, version 7.1,
http://drive5.com/uparse/, 30 September 2013) and chimeric sequences were identified
and removed using UCHIME (Chimera Prediction for Amplicon Sequencing). OTUs were
used for α-diversity (Coverage, Sobs, ACE, Chao, Shannon and Simpson) analysis. OTUs
were taxonomically analyzed by the Ribosomal Database Project (RDP) Classifier algorithm
(http://rdp.cme.msu.edu/, 30 September 2016). The rarefaction curves’ analysis with
Mothur v.1.21.1 was performed to reflect the sequence depth. Principal coordinate analysis
(PCoA) was performed using the weighted Unifrac distance with R Language.
2.5. Statistical Analysis
The data of growth performance, organ weight, blood parameters, and enzymatic
activity were analyzed in a completely randomized design using the Proc Mixed procedure
of SAS (SAS Inst. Inc., Cary, NC, USA). The model was Yij = µ + Ti + Pj + Ti × Pj + εij ,
where Yij was the dependent, continuous variable, µ was the overall mean, Ti was the fixed
effect of diet treatment (i = basal diet, flaxseed oil, or flaxseed grain), Pj was the random
effect of pen (j = 1, 2, 3, and 4), Ti × Pj was the fixed effect of the interaction between diet
and pen, and εij was the residual error. The mixed model included fixed effects of diet
and random effects of pen. Pen was considered the experimental unit and the repeated
measurement. The model used to analyze body weight gain considers 4 replicates (number
of pens), each with 5 observations (number of goats): organ weight, blood parameters,
and enzymatic activity consider 4 replicates (number of pens), each with 2 observations
(number of goats), for each treatment. Specifically, the model used to study feed intake
considers 4 replicates (number of pens), each with 1 observation. The results are presentedAnimals 2021, 11, 790 6 of 19
as the mean values and standard error of the mean (SEM). Data means significance was
declared at p ≤ 0.05 and tendencies were considered at 0.05 < p ≤ 0.10.
For evaluation of bacterial diversity indexes, the bacteria community structure at
phylum and genus level, a one-way analysis of variance (ANOVA) and Duncan’s multiple
range tests were carried out in SAS (SAS Inst. Inc., Cary, NC, USA). The results are
presented as the mean values and SEM. Spearman correlation was used to correlate the
growth performance, lipid deposition, blood lipid profiles, and blood lipid-related enzyme
activity with the top 20 most relatively abundant bacterial genera through R Language
(pheatmap package). Correlations with p ≤ 0.05 for the linear model were considered
as significant.
3. Results
3.1. Growth Performance and Lipid Deposits
As indicated in Tables 2 and 3, compared with the CON and HLS groups, the FBW,
BWG, fat tissue weight, omental fat weight, and the percentage of fat tissue and omental
fat to live body weight were significantly increased in the LNO group (p < 0.05), but the
HLS group did not differ from the CON group. Compared with the HLS group, the weight
of kidney fat and tail fat were remarkably increased in the LNO group (p = 0.041, p = 0.037),
but the CON group did not differ from either LNO or HLS groups.
Table 2. The effect of dietary flaxseed oil or flaxseed supplementation on the growth performance in
Albas cashmere goats.
Items CON LNO HLS SEM p-Value
Feed Intake
0.72 0.79 0.71 0.041 0.379
(kg/day/per)
Initial Body
18.65 18.54 18.51 0.245 0.915
Weight/kg
Final Body Weight/kg 26.74 B 28.14 A 26.51 B 0.370 0.006
Total Body Weight B A B
8.03 9.80 7.95 0.382 0.0001
Gain/kg
A, BMeans within the same row not followed by the same letters are significantly different at p ≤ 0.05, whereas
the differences were considered to be a statistical trend when 0.05 < p ≤ 0.10. CON: basal diet; LNO: basal diet
added with flaxseed oil; HLS: basal diet added with heated flaxseed grain. SEM: standard error of the mean.
Table 3. The effect of dietary flaxseed oil or flaxseed supplementation on the lipid deposits in Albas
cashmere goats.
Items CON LNO HLS SEM p-Value
Fat Tissue Weight/g
Kidney Fat 129.93 AB 153.91 A 120.63 B 8.352 0.041
Omental Fat 729.31 B 1053.55 A 696.62 B 12.006Animals 2021, 11, 790 7 of 19
p = 0.001), the NEFA content showed the opposite result (p = 0.003), and the LNO group
did not differ from the CON group. Compared with the CON and HLS treatments, the
BHBA content significantly decreased in the LNO treatment (p = 0.002), and there was
no difference between the CON and HLS treatments. The HDL-C content tended to be
remarkably higher in the LNO and HLS groups than the CON group (p = 0.062), but the
HLS group did not differ from the LNO group. The GLU content tended to be remarkably
higher in the LNO treatment (p = 0.062) than the CON and HLS treatments, but the HLS
treatment did not differ from the CON treatment.
Table 4. The effect of dietary flaxseed oil or flaxseed supplementation on the blood lipid profiles in
Albas cashmere goats.
Items CON LNO HLS SEM p-Value
TG (mmol/L) 0.63 A 0.64 A 0.48 B 0.036 0.001
CHO (mmol/L) 1.87 A 2.11 A 1.57 B 0.100 0.001
LDL-C (mmol/L) 0.54 A 0.57 A 0.40 B 0.026 0.001
HDL-C (mmol/L) 0.82 0.86 0.87 0.015 0.062
GLU (mmol/L) 3.64 3.88 3.72 0.093 0.062
NEFA (nmol/L) 0.23 B 0.16 B 0.36 A 0.035 0.003
BHBA (mmol/L) 0.20 A 0.14 B 0.23 A 0.013 0.002
A, BMeans within the same row not followed by the same letters are significantly different at p ≤ 0.05, whereas
the differences were considered to be a statistical trend when 0.05 < p ≤ 0.10. CON: basal diet; LNO: basal diet
added with flaxseed oil; HLS: basal diet added with heated flaxseed grain. SEM: standard error of the mean.
TG: triglyceride; CHO: cholesterol; LDL-C: low-density lipoprotein cholesterol; HDL-C: high-density lipoprotein
cholesterol; GLU: glucose; NEFA: non-esterified fatty acid; BHBA: β-hydroxybutyric acid.
3.3. The Quantity of Enzymes Related to Blood Lipid Metabolism
As indicated in Table 5, compared with the CON and HLS treatments, the ACC and
MDH quantity remarkably increased in the LNO treatment (p = 0.015, p = 0.010), but there
was no difference between the CON and HLS treatments. Compared with the CON and
LNO treatments, the HSL quantity significantly increased in the HLS treatment (p = 0.002),
but there was no difference between the CON and LNO treatments. The FAS quantity was
significantly higher in the LNO treatment than the HLS treatment (p = 0.016), but the CON
treatment did not differ from either LNO or HLS treatments.
Table 5. The effect of dietary flaxseed oil or flaxseed supplementation on the enzymes related to lipid
metabolism in blood of Albas cashmere goats.
Items CON LNO HLS SEM p-Value
FAS (ng/mL) 26.07 AB 31.07 A 22.57 B 1.748 0.016
ACC (ng/mL) 82.26 B 100.38 A 81.15 B 4.365 0.015
MDH (ng/mL) 18.24 B 19.24 A 17.58 B 0.470 0.010
LPL (ng/mL) 340.24 334.40 364.28 12.551 0.134
HSL (ng/mL) 7.21 B 7.34 B 9.55 A 0.393 0.002
LPS (ng/mL) 9.80 10.00 8.87 0.424 0.176
A, BMeans within the same row not followed by the same letters are significantly different at p ≤ 0.05, whereas
the differences were considered to be a statistical trend when 0.05 < p ≤ 0.10. CON: basal diet; LNO: basal diet
added with flaxseed oil; HLS: basal diet added with heated flaxseed grain. SEM: standard error of the mean. FAS:
fatty acid synthetase; ACC: acetyl-coa carboxylase; MDH: malic dehydrogenase; LPL: lipoprotein lipase; HSL:
hormone-sensitive lipase; LPS: lipase.
3.4. Microbial Diversity of Ileum Digesta
3.4.1. Sampling Depth
As shown in Table 6, after optimizing the original data, 271,857, 281,019, and 253,906
high-quality valid sequences were obtained in the CON, LNO, and HLS groups, respec-
tively. On the basis of 97% species similarity, 563, 524, and 594 OTUs were separately
obtained from samples in the CON, LNO, and HLS groups. Nearly 806,782 sequences
were generated for ileum digesta bacteria, with an average of 54,371, 56,204, and 50,7813.4. Microbial Diversity of Ileum Digesta
3.4.1. Sampling Depth
As shown in Table 6, after optimizing the original data, 271,857, 281,019, and 253,906
Animals 2021, 11, 790 high-quality valid sequences were obtained in the CON, LNO, and HLS groups, respec- 8 of 19
tively. On the basis of 97% species similarity, 563, 524, and 594 OTUs were separately
obtained from samples in the CON, LNO, and HLS groups. Nearly 806,782 sequences
were generated for ileum digesta bacteria, with an average of 54,371, 56,204, and 50,781
sequences for each
sequences for each sample
sampleininthe
theCON,
CON,LNO,
LNO, and
and HLS
HLS groups,
groups, respectively.
respectively. Both
Both the
the rar-
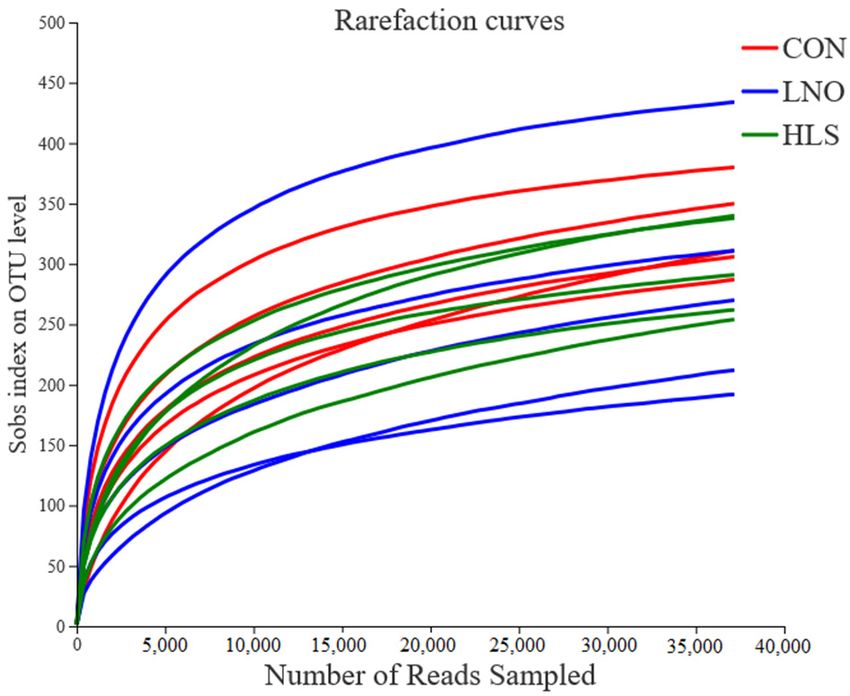
rarefaction curves (Figure 1) and the high coverage value (from 0.9985 to 0.9987, Table 4)
efaction curves (Figure 1) and the high coverage value (from 0.9985 to 0.9987, Table 4)
showed that the sampling depth is enough to estimate bacterial diversity.
showed that the sampling depth is enough to estimate bacterial diversity.
Table6.6.Sequence
Table Sequencedata
dataof
ofbacteria
bacteriain
inileum
ileumdigesta.
digesta.
Optimized Average Optimized Average Average Length
of of
Group Optimized OTUs
Group
Average Optimized
OTUs Length
Sequences
Sequences Sequences Sequences
of Sample of Sample Optimized
Optimized Sequence
Sequence
CON CON 271,857271,857563 563 54,371 54,371 429429
LNOLNO 281,019281,019524 524 56,204 56,204 431431
HLSHLS 253,906253,906594 594 50,781 50,781 433433
CON:
CON: basal diet; LNO: basal diet added with flaxseed oil; HLS: basal diet added with flaxseed
basal diet; LNO: basal diet added with flaxseed oil; HLS: basal diet added with heated grain.
heated flax-
OTUs: operational taxonomic units.
seed grain. OTUs: operational taxonomic units.
Figure 1.
Figure 1. The
TheOTU
OTUrarefaction
rarefactioncurves
curvesofofthe
theileum
ileumdigesta bacterial
digesta communities.
bacterial Curves
communities. werewere
Curves
drawn using the least sequenced sample as the upper limit for the rarefactions. Each color
drawn using the least sequenced sample as the upper limit for the rarefactions. Each color representsrepre-
sents one treatment: The red curves represent kids fed the basal diet (CON), the blue curves
one treatment: The red curves represent kids fed the basal diet (CON), the blue curves represent repre-
kids
sent kids fed the basal diet supplemented with flaxseed oil (LNO), and the green curves represent
fed the basal diet supplemented with flaxseed oil (LNO), and the green curves represent kids fed the
kids fed the basal diet supplemented with heated flaxseed grain (HLS).
basal diet supplemented with heated flaxseed grain (HLS).
3.4.2. Ileum
3.4.2. Ileum Microbiota
Microbiota α-α- and
and β-Diversity
β-Diversity
As indicated
As indicatedininTable
Table 7, compared
7, compared withwith the LNO
the LNO group, group, the(the
the Sobs Sobs (the number
number of
of OTUs),
OTUs), ACE (the ACE estimator) and Chao (the Chao estimator) index
ACE (the ACE estimator) and Chao (the Chao estimator) index significantly increased in significantly in-
creased
CON andinHLS
CON and HLS
groups groups
(p = 0.038, p =(p0.001,
= 0.038,
p =p0.019),
= 0.001,
butp there
= 0.019),
wasbut there was difference
no significant no signifi-
cant difference
between between
CON and CON and
HLS groups. The HLS groups.
principal The principal
coordinate coordinate
analysis (PCoA)analysis (PCoA)
plots (Figure 2)
demonstrate dissimilarities between the CON group, the LNO group, and the HLS group.
Table 7. The α-diversity indexes of bacteria in ileum digesta.
Index CON LNO HLS SEM p-Value
Coverage 0.9985 0.9987 0.9985 0.0002 0.722
Sobs 325.25 A 253.00 B 354.50 A 12.867 0.038
ACE 418.86 A 356.34 B 404.77 A 3.713 0.001
Chao 407.55 A 354.18 B 408.35 A 5.753 0.019
Shannon 2.69 2.56 2.64 0.194 0.931
Simpson 0.16 0.14 0.17 0.025 0.748
A, BMeans within the same row not followed by the same letters are significantly different at p ≤ 0.05, whereas
the differences were considered to be a statistical trend when 0.05 < p ≤ 0.10. CON: basal diet; LNO: basal diet
added with flaxseed oil; HLS: basal diet added with heated flaxseed grain. SEM: standard error of the mean. Sobs:
the number of OTUs; ACE: the ACE estimator; Chao: the Chao estimator.Shannon 2.69 2.56 2.64 0.194 0.931
Simpson 0.16 0.14 0.17 0.025 0.748
Means within the same row not followed by the same letters are significantly different at p ≤
A, B
0.05, whereas the differences were considered to be a statistical trend when 0.05 < p ≤ 0.10. CON:
Animals 2021, 11, 790 basal diet; LNO: basal diet added with flaxseed oil; HLS: basal diet added with heated flaxseed9 of 19
grain. SEM: standard error of the mean. Sobs: the number of OTUs; ACE: the ACE estimator;
Chao: the Chao estimator.
Figure2.
Figure 2. Principal
Principal coordinate
coordinate analysis
analysis(PCoA)
(PCoA)(using
(usingthe
theweighted
weightedUnifrac similarity
Unifrac metric)
similarity of of
metric)
bacterial operational taxonomic units (OTUs) in the ileum digesta of goat kids. Each symbol repre-
bacterial operational taxonomic units (OTUs) in the ileum digesta of goat kids. Each symbol rep-
sents one treatment: The solid red circle represents kids fed the basal diet (CON), the solid blue
resents one treatment: The solid red circle represents kids fed the basal diet (CON), the solid blue
triangle represents kids fed the basal diet supplemented with flaxseed oil (LNO), and the solid
triangle represents
green rhombus kids fed the
represents kidsbasal dietbasal
fed the supplemented with flaxseed
diet supplemented withoil (LNO),
heated and the
flaxseed solid(HLS).
grain green
rhombus represents kids fed the basal diet supplemented with heated flaxseed grain (HLS).
A total of 698 OTUs were obtained from all samples, of which 402 exist in all groups
A total of 698 OTUs were obtained from all samples, of which 402 exist in all groups
defined as core OTUs (Figure 3). The core OTUs comprised approximately 57.6% of the
defined as core OTUs (Figure 3). The core OTUs comprised approximately 57.6% of the
total OTUs. In addition, 25, 38, and 54 OTUs were uniquely identified in groups 10
Animals 2021, 11, x FOR PEER REVIEW
CON,
of 20
total OTUs. In addition, 25, 38, and 54 OTUs were uniquely identified in groups CON,
LNO, and HLS, respectively.
LNO, and HLS, respectively.
Figure 3. Venn plot of operational taxonomic units (OTUs) showing the percent of observations for
Figure 3. Venn plot of operational taxonomic units (OTUs) showing the percent of observations
each OTU (>0.5%) present in each dietary group (flaxseed oil, LNO, heated flaxseed grain, HLS,
for each OTU (>0.5%) present in each dietary group (flaxseed oil, LNO, heated flaxseed grain,
CON). Each color represents one treatment: The red represents kids fed the basal diet (CON), the blue
HLS, CON). Each color represents one treatment: The red represents kids fed the basal diet (CON),
represents kids fed the
the blue represents kidsbasal dietbasal
fed the supplemented with flaxseed
diet supplemented oil (LNO),
with flaxseed oiland the green
(LNO), represents
and the green
kids fed thekids
represents basalfed
diet
thesupplemented with heatedwith
basal diet supplemented flaxseed grain
heated (HLS).grain (HLS).
flaxseed
3.4.3. Bacterial Community at Different Taxonomical Levels
3.4.3. Bacterial Community at Different Taxonomical Levels
Taxonomic assignment of OTUs identified 17 phyla in the ileum digesta of Albas
Taxonomic assignment of OTUs identified 17 phyla in the ileum digesta of Albas
cashmere goats. As shown in Table 8, a detailed overview of bacteria composition of
cashmere goats. As shown in Table 8, a detailed overview of bacteria composition of ileum
ileum digesta in each group was illustrated at the phylum level. The Firmicutes is the
digesta in each group was illustrated at the phylum level. The Firmicutes is the most pre-
most predominant phylum in the ileum digesta of the CON (90.80%), LNO (87.22%), and
dominant
HLS phylum
(75.83%) groups,in whereas
the ileum digesta of the
Actinobacteria CON4.96%,
(CON: (90.80%),
LNO:LNO (87.22%),
8.92%, and HLS
HLS: 20.06%) is
(75.83%) groups, whereas Actinobacteria (CON: 4.96%, LNO: 8.92%, HLS: 20.06%)
secondary, they account for 95.76%, 96.14%, and 95.89% of total sequences, respectively. is sec-
ondary, they
Compared withaccount
the CON for and
95.76%,
LNO96.14%,
groups,and
the 95.89%
relativeof total sequences,
abundance (RA) ofrespectively.
Firmicutes,
Compared with the CON and LNO groups, the relative abundance
Proteobacteria, and Tenericutes reduced remarkably in the HLS group (p (RA) of Firmicutes,
= 0.015, p = 0.042,
Proteobacteria, and Tenericutes reduced remarkably in the HLS group (p = 0.015, p = 0.042,
p = 0.005), the Actinobacteria RA showed the opposite result (p = 0.001), and the LNO
group did not differ from the CON group.
Table 8. The effect of dietary flaxseed oil or flaxseed supplementation on the relative abundance ofAnimals 2021, 11, 790 10 of 19
p = 0.005), the Actinobacteria RA showed the opposite result (p = 0.001), and the LNO
group did not differ from the CON group.
Table 8. The effect of dietary flaxseed oil or flaxseed supplementation on the relative abundance of
bacteria in ileum digesta—Phylum level (%).
Phylum CON LNO HLS SEM p-Value
Firmicutes 90.80 A 87.22 A 75.83 B 1.826 0.015
Actinobacteria 4.96 B 8.92 B 20.06 A 1.449 0.001
Proteobacteria 0.79 A 0.71 A 0.37 B 0.106 0.042
Tenericutes 1.25 A 1.03 A 0.62 B 0.102 0.005
Bacteroidetes 1.48 1.49 2.78 0.641 0.292
others 0.70 0.67 0.42 0.237 0.776
A, BMeans within the same row not followed by the same letters are significantly different at p ≤ 0.05, whereas
the differences were considered to be a statistical trend when 0.05 < p ≤ 0.10. CON: basal diet; LNO: basal diet
added with flaxseed oil; HLS: basal diet added with heated flaxseed grain. SEM: standard error of the mean.
On the genus level, a total of 43 genera were identified from all samples. The 20 most
abundant genera are listed in Table 9 for ileum samples. The RA of the top 20 bacterial
genera were 73.08%, 84.88%, and 66.38% in the CON, LNO, and HLS groups, respectively.
Compared with CON treatment, the RA of unclassified_f_Peptostreptococcaceae (Uncl.
Pep.), Clostridium_sensu_stricto_1, and Lachnospiraceae_NK3A20_group significantly
decreased in LNO and HLS treatments, and these genera were remarkably lower in the HLS
group than in the LNO group (p < 0.0001), but the [Eubacterium]_coprostanoligenes_group
([E.] cop. group), Family_XIII_AD3011_group, and Aeriscardovia showed the opposite
result (p < 0.0001). Compared with CON and LNO treatments, the RA of Intestinibacter
remarkably decreased in HLS treatment (p = 0.001), but there was no difference between
CON and LNO groups. Compared with CON treatment, the RA of Ruminococcus_2,
Ruminococcaceae_UCG-014, and Christensenellaceae_R-7_group significantly increased
in the LNO group, but these genera remarkably decreased in the HLS group (p < 0.0001).
Compared with CON and HLS treatments, the Turicibacter RA remarkably increased in
LNO treatment (p < 0.0001), the Streptococcus and [Ruminococcus]_gauvreauii_group
showed the opposite result, and there was no difference between CON and HLS groups.
Compared with CON treatment, the RA of Lactobacillus, Bifidobacterium, Olsenella, and
Ureaplasma significantly increased in LNO and HLS treatments, and these genera were
remarkably higher in LNO treatment than in HLS treatment (p < 0.0001). Compared with
CON treatment, the RA of Acetitomaculum and Mycoplasma significantly decreased in
LNO and HLS treatments, and these genera were remarkably lower in the LNO group
than in the HLS group (p < 0.0001). The unclassified_f__Bifidobacteriaceae RA tended to
be remarkably lower in the HLS group than in the CON group (p = 0.064), but the LNO
group did not differ from the CON and HLS groups.Animals 2021, 11, 790 11 of 19
Table 9. The effect of dietary flaxseed oil or heated flaxseed supplementation on the relative abundance of the top 20 bacteria
in ileum digesta—Genus level (%).
Family Genus CON LNO HLS SEM p-Value
Phylum—Firmicutes
Peptostreptococcaceae g__unclassified_f__Peptostreptococcaceae 35.14 A 31.22 B 13.13 C 0.610Animals 2021, 11, 790 12 of 19
ium_sensu_stricto_1 was positively correlated with LDL-C, but negatively associated with
HSL. The unclassified_f__Bifidobacteriaceae was negatively associated with HDL-C. The
Aeriscardovia was positively correlated with HSL, but negatively associated with LDL-C.
The Uncl. Pep. Was negatively associated with HSL and LPL, but the [E.] cop. group was
positively correlated with them.
Table 10. Growth performance and lipid deposition showing a Spearman’s correlation with ileal bacterial community.
FBW BWG Omental Fat Kidney Fat Mesenteric Fat
Items (1) (2)
R p-Value R p-Value R p-Value R p-Value R p-Value
g__[Ruminococcus]
−0.52 0.04 −0.72 0.002
_gauvreauii_group
g__Streptococcus −0.55 0.04 −0.64 0.01 −0.82 0.0002 −0.52 0.05
g__Turicibacter 0.58 0.02 0.73 0.002 0.74 0.001
g__Acetitomaculum −0.64 0.01 −0.59 0.02
g__Bifidobacterium 0.77 0.001 0.63 0.01 0.62 0.01
g__Christensenellaceae
0.66 0.01 0.81 0.0002
_R-7_group
g__Mycoplasma −0.61 0.02 −0.52 0.05
g__Olsenella 0.60 0.02
g__Ruminococcaceae
0.54 0.04 0.83 0.0001
_UCG-014
g__Ruminococcus_2 0.53 0.04 0.62 0.01 0.88Animals 2021, 11, 790 13 of 19
Table 11. Blood lipid profiles showing a Spearman’s correlation with ileal bacterial community.
GLU BHBA NEFA TG CHO LDL-C HDL-C
Items
R (1) p-Value (2) R p-Value R p-Value R p-Value R p-Value R p-Value R p-Value
g__[Ruminococcus]_gauvreauii_group −0.57 0.03 0.64 0.01 0.71 0.003
g__Streptococcus −0.57 0.03 0.78 0.0006 0.71 0.003
g__Turicibacter −0.70 0.004 −0.76 0.001 0.56 0.03
g__Acetitomaculum −0.71 0.003 −0.55 0.03
g__Bifidobacterium 0.55 0.03 −0.54 0.04 −0.62 0.01 0.60 0.02
g__Christensenellaceae_R-7_group −0.88Animals 2021, 11, 790 14 of 19
Table 12. The enzymes related to blood lipid metabolism showing a Spearman’s correlation with ileal bacterial community.
ACC FAS HSL LPL MDH
Items
R (1) p-Value (2) R p-Value R p-Value R p-Value R p-Value
g__Streptococcus −0.56 0.03 −0.64 0.01 −0.78 0.001
g__Turicibacter 0.71 0.003 0.52 0.04
g__Acetitomaculum −0.60 0.02
g__Bifidobacterium 0.60 0.02
g__Christensenellaceae_R-7_group 0.59 0.02 −0.70 0.004
g__Mycoplasma −0.52 0.05
g__Ruminococcaceae_UCG-014 0.57 0.03 −0.53 0.04 0.57 0.03
g__Ruminococcus_2 0.57 0.03 0.54 0.04 −0.52 0.05 0.67 0.01
g__Lachnospiraceae_NK3A20_group −0.78 0.001
g__Intestinibacter 0.51 0.05
g__Family_XIII_AD3011_group 0.78 0.001
g__Clostridium_sensu_stricto_1 −0.77 0.001
g__unclassified_f__Peptostreptococcaceae −0.67 0.01 −0.56 0.03
g__[Eubacterium]_coprostanoligenes_group 0.71 0.003 0.56 0.03
g__Aeriscardovia 0.75 0.001
(1) Spearman correlation coefficient (R) represents the degree of association between ileum bacterial community and enzymes related to blood lipid metabolism. (2) Correlations with p ≤ 0.05 for the linear model
were considered as significant. FAS: fatty acid synthetase; ACC: acetyl-coa carboxylase; MDH: malic dehydrogenase; LPL: lipo-protein lipase; HSL: hormone-sensitive lipase.Animals 2021, 11, 790 15 of 19
4. Discussion
Our previous study has shown that, compared with the addition of flaxseed oil,
flaxseed could protect ALA from the hydrogenation in rumen, increase the ALA content in
blood, and then increase the ALA accumulation in muscle of goats, which is beneficial to
human health [10,17]. However, the comparison effects of flaxseed oil and flaxseed grain
on lipid deposition and ileum microbiota profiles have not been investigated. The present
study indicated that flaxseed is more effective than flaxseed oil in reducing lipid deposition,
which may work by modulating the ileal microbiota composition.
Candyrine et al. reported that 4% oil supplementation to diet significantly enhanced
the growth performance in fattening sheep and goats [22]. In the current study, compared
with the CON group, the dietary flaxseed oil supplementation significantly increased the
FBW and BWG, which agrees with the above report. Compared with the CON treatment,
flaxseed oil significantly promoted the FBW, BWG, and lipid accumulation in goats, but
the dietary flaxseed supplementation had no effect on the growth performance of goats.
However, compared with the LNO group, the dietary flaxseed supplementation reduced
the adipose tissue weight, indicating that flaxseed efficiently reduced the lipid deposition
of goats. Blood biochemical parameters can reflect the physiological and metabolic state of
animals, which is closely related to nutritional status. The present results showed that the
dietary flaxseed grain supplementation significantly decreased the content of TG, CHO,
and LDL-C in serum, indicating that flaxseed could reduce the blood lipid deposition,
which is consistent with the results of changes in adipose tissue weight. In agreement
with these findings, the majority of previous studies showed that flaxseed consumption
reduced serum content of CHO [23] and LDL-C [24] levels. In the current study, compared
with the CON and HLS groups, the flaxseed oil had a tendency to increase the serum
GLU content and significantly reduced the serum BHBA content, which suggested that
the addition of flaxseed oil to the diet reduced lipid mobilization, resulting in an increase
of lipid deposition. Compared with the LNO group, flaxseed significantly increased the
serum BHBA and NEFA content, which indicated that cashmere goats would mobilize lipid
to meet growth needs, so they produced a large amount of BHBA and NEFA. ACC and FAS
are the key enzymes involved in de novo FA synthesis and play a key role in animal lipid
synthesis [10]. MDH is closely involved in the trans hydrogenation during the conversion
of carbohydrates to fatty acids [25]. HSL is the key enzyme and rate-limiting enzyme that
initially mobilized lipolysis, it gradually hydrolyzes the fat stored in fat cells into free FA
and glycerin and releases them into the blood [26]. In the current study, compared with the
LNO treatment, the flaxseed grain significantly decreased the quantity of FAS, ACC, and
MDH, but remarkably promoted the HSL quantity. These results suggested that adding
flaxseed grain to the diet could reduce the quantity of enzymes related to lipid de novo
synthesis and increase the quantity of enzymes related to lipolysis, thereby reducing the
blood TG content and TG accumulation in the adipose tissue, which further explained the
above-mentioned change of growth performance and lipid deposition. Liu et al. reported
that the diets containing unsaturated fatty acids (UFAs) could reduce serum CHO, TG,
and LDL-C content, but increase serum HDL-C content [27]. Egert et al. observed that
enrichment of the diet with EPA or DHA decreased fasting serum TG concentration by 15%
and 31% in humans, suggesting that DHA is more effective in reducing TG levels in the
blood [28]. Morin et al. reported a lower serum CHO and LDL-C levels of rats in the DHA
monoglycerides treatment than the high-fat/high-carbohydrate diet [29]. In our previous
study, the flaxseed grain group had a higher plasma concentration of DHA than the control
and supplemented flaxseed oil groups [10], but in the present study, had a lower serum TG,
CHO, and LDL-C content, hinting that flaxseed grain is more efficient to goats in reducing
the blood TG, CHO, and LDL-C level because of the decreased plasma DHA. Sawada
et al. reported that the EPA significantly improved the HDL-C concentration in blood of
humans [30]. HDL-C removes cholesterol from the bloodstream and carries it back to the
liver for recycling [31], which is beneficial to the health of livestock. In the present study, the
diet supplemented with flaxseed oil and flaxseed grain had a tendency to increase the serumAnimals 2021, 11, 790 16 of 19
HDL-C concentration compared to the CON group, which probably related to the increase
of plasma EPA concentration [10]. Some researches indicated that the lipid-lowering effect
of flaxseed is owing to its high content of lignans and soluble fibers [32,33]. Lignans are
one of the vital groups of phytoestrogens, which inhibit acyl-coenzyme A activity: CHO
acyltransferase involved in the formation of cholesteryl ester in tissues [34,35]. Soluble
fibers can reduce intestinal absorption of dietary CHO and increase the production of
bile acid [33]. In conclusion, supplementation of flaxseed significantly alleviated the lipid
accumulation in goats compared to the addition of flaxseed oil, indicating that flaxseed
(enriched ALA) may play an important role in regulating lipid metabolism, and therefore
it is beneficial to the goats.
In recent years, the gut microbiota has been shown to affect lipid levels and lipid
metabolism in blood. In the present study, the dietary flaxseed supplementation signifi-
cantly reduced the relative abundance of Firmicutes, Proteobacteria, and Tenericutes, while
it remarkably increased the Actinobacteria relative abundance. Firmicutes is known as
obesity-related bacterial phylum, which accelerates degradation of food components to
supply energy for the host [36]. A high abundance of Firmicutes goes with a low abundance
of Bacteroidetes, which leads to accelerate energy harvest from food and promote energy
storage in adipose tissue of the host [37] and would further suppress the fasting-induced
adipose factor (FIAF) produced. Meanwhile, a higher TG was stored in adipose tissue and
lower satiety hormones were released by the suppression of FIAF [38]. In the current study,
the dietary flaxseed significantly decreased the Firmicutes relative abundance compared to
the CON and LNO groups, so we speculated that adding flaxseed to the diet promoted
the production of FIAF by reducing the Firmicutes relative abundance, thereby releasing
more satiety hormones, reducing the absorption of energy from the diet through ileum,
which further explained the decrease in blood TG and fat tissue weight. Proteobacteria is a
major phylum of Gram-negative bacteria with a wide range of pathogenic microorganisms,
and a high ratio of Proteobacteria to Firmicutes + Bacteroidetes was confirmed as a good
indicator for rumen dysbiosis [39]. The addition of flaxseed decreased the Proteobacteria
relative abundance in ileum of goats, which may be caused by competitive relationships
between the gut microbiota and pathogenic bacteria in the intestine [40], indicating that
the flaxseed is beneficial to the colonization of probiotic in the goats’ ileum. Actinobacteria
is the dominant bacterial in most mammals [41]. In the long-term co-evolution process of
animal intestinal Actinobacteria and the host, by producing a variety of bioactive substances,
such as antibiotics, immunosuppressants, vitamins, and enzymes, they participate in the
metabolism of the host and maintain the intestinal microecological balance of the host and a
series of important physiological activities [42]. Claus et al. reported that the Actinobacteria
was negatively associated with serum GLU level in the microbial colonization process [43].
The current study observed that, compared to added flaxseed oil, dietary flaxseed supple-
mentation increased the Actinobacteria relative abundance and had a tendency to reduce
the serum GLU content, which is similar to the above-mentioned reports.
[E.] cop. is a CHO-reducing bacterium, and on the one hand, converting CHO to co-
prostanol could decrease the CHO absorption [44]. On the other hand, the bacterium might
interrupt the enterohepatic circulation of billary CHO so that the liver would partition
more CHO into the bile and less CHO into the blood [45]. In the current study, [E.] cop.
group (16.92%), Aeriscardovia (14.95%), and Uncl. Pep. (13.13%) were the 3 most abundant
genera in the goats’ ileum of the HLS group, which showed that the flaxseed significantly
increased the [E.] cop. group relative abundance and remarkably decreased the blood CHO
content, and that the [E.] cop. group was positively correlated with the content of HSL and
LPL, illustrating that the flaxseed can reduce the absorption of CHO in ileum and increase
the degradation of lipid by increasing the relative abundance of [E.] cop. group. Whon
et al. reported that the castrated male cattle harbor distinct ileum microbiota which were
dominated by the family Peptostreptococcaceae, with increased extra- and intra-muscular
fat storage [46]. A previous study revealed that the Uncl. Pep. might play an important
role in feed digestion [47]. In the current study, Uncl. Pep. (31.22%), Intestinibacter (12.01%),Animals 2021, 11, 790 17 of 19
and Ruminococcus_2 (10.61%) were the 3 most abundant genera in the goats’ ileum of the
LNO group, Uncl. Pep. (35.14%) and Intestinibacter (13.73%) were the 2 most abundant
genera in the goats’ ileum of the CON group, the relative abundance of Uncl. Pep. and
Intestinibacter are significantly higher in the CON and LNO groups than in the HLS group,
and the blood TG content showed a consistent trend of change. Meanwhile, the current
results showed that the Uncl. Pep. was negatively associated with the quantity of HSL and
LPL, and the Intestinibacter was negatively associated with the content of BHBA and NEFA.
These results hinted that the increased absorption of nutrients in ileum and the reduced
mobilization of body fat in goats of CON and LNO groups was due to increasing the
relative abundance of Uncl. Pep. and Intestinibacter. Jiang et al. reported that the increase
of Ruminococcus relative abundance can increase the digestibility of DM and NDF in vivo
and the production performance of cows [48]. The dietary supplementation of flaxseed
oil significantly elevated the Ruminococcus_2 relative abundance and increased the FBW
and BWG of goats, and the Ruminococcus_2 genus was positively associated with FBW,
BWG, Omental Fat, GLU, CHO, LDL-C, ACC, and MDH, but negatively correlated with
BHBA, NEFA, and HSL. Therefore, these results hinted that the flaxseed oil can promote
the absorption of nutrients and reduce lipid mobilization, leading to much more GLU and
TG flowed into blood, more lipid deposition in adipose tissue, and increasing the FBW of
goats by increasing the Ruminococcus_2 relative abundance.
The present study investigated the shift among blood lipid profiles in cashmere goats
in response to dietary supplementation of flaxseed or flaxseed oil, which probably related to
the change of ileal microbial composition, but the mechanism is unclear. Therefore, the ileal
metabolites of goats fed a diet containing flaxseed or flaxseed oil needed to be measured
to further elucidate the mechanism in the future. The [E.] cop. is the most relatively
abundant genus in the ileum of HLS goats and the Ruminococcus_2 is the third top genus
in the ileum of LNO goats, and they are strongly associated with host lipid metabolism,
so the function of [E.] cop. and Ruminococcus_2 on lipid metabolism needed to be verified
in vitro. In addition, further study is needed to test other intestinal microbes (duodenum,
jejunum, cecum, and colon), to better interpret the microbiota compositions and the shift of
microbiota in response to dietary supplementation of flaxseed or flaxseed oil.
5. Conclusions
In conclusion, the flaxseed grain is more efficient than flaxseed oil in ameliorating
the blood lipid profiles and it is a potential product in decreasing the lipid deposition
of cashmere goats. The blood lipid profiles in cashmere goats in response to dietary
supplementation of flaxseed or flaxseed oil are probably related to the change of the ileal
microbiota composition.
Author Contributions: S.L. was involved in the animal experimentation, sample analysis, data
interpretation and writing original draft. X.W. was involved in the animal experimentation, sample
analysis. Y.L. was involved in the animal experimentation. B.S. was involved in the sample collection
and data interpretation. X.G. and Y.Z. were involved in the sample collection and data analysis. S.Y.
was involved in the project administration, study design and writing-review and editing. All authors
have read and agreed to the published version of the manuscript.
Funding: This work was supported by grants of the National Natural Science Foundation of China
(Project No. 31760685) and the National Key R&D Program of China (Project No. 2017YFD0500504).
Institutional Review Board Statement: The experiment was conducted in the experimental farm of
Inner Mongolia Agricultural University (Hohhot, China). All animal procedures were performed
under the national standard Guidelines for Ethical Review of Animal Welfare (GB/T 35892-2018).
Data Availability Statement: The raw data presented in the current study are available on reasonable
request from the corresponding author.
Acknowledgments: For their help during laboratory and data analysis, the authors express deep
appreciation to Qi Wen, Yongsheng Zhang, and Siqingaowa Bao from College of Animal Science,
Inner Mongolia Agricultural University, China.Animals 2021, 11, 790 18 of 19
Conflicts of Interest: There is no potential conflict of interest among the authors.
References
1. Song, S.; Wu, J.; Zhao, S.; Casper, D.P.; Zhang, L.; He, B.; Lang, X.; Wang, C.; Gong, X.; Wang, F.; et al. The effect of periodic energy
restriction on growth performance, serum biochemical indices, and meat quality in sheep. J. Anim. Sci. 2018, 96, 4251–4263.
[CrossRef]
2. Habibizad, J.; Riasi, A.; Kohram, H.; Rahmani, H.R. Effect of feeding greater amounts of dietary energy for a short-term with or
without eCG injection on reproductive performance, serum metabolites and hormones in ewes. Anim. Reprod. Sci. 2015, 160,
82–89. [CrossRef]
3. Chen, G.J.; Song, S.D.; Wang, B.X.; Zhang, Z.F.; Peng, Z.L.; Guo, C.H.; Zhong, J.C.; Wang, Y. Effects of Forage:Concentrate Ratio
on Growth Performance, Ruminal Fermentation and Blood Metabolites in Housing-feeding Yaks. Asian-Australas. J. Anim. Sci.
2015, 28, 1736–1741. [CrossRef]
4. Bauchart, D. Lipid absorption and transport in ruminants. J. Dairy Sci. 1993, 76, 3864–3881. [CrossRef]
5. Prasad, K. Flaxseed and cardiovascular health. J. Cardiovasc. Pharmacol. 2009, 54, 369–377. [CrossRef]
6. Flaxseed oil: Healthful or harmful for men? Harv. Men’s Health Watch 2003, 8, 5–8.
7. Shah, M.; Eklund, B.; Conde Lima, L.G.; Bergholz, T.; Hall, C. Microbial and Chemical Shelf-Life of Vacuum Steam-Pasteurized
Whole Flaxseed and Milled Flaxseed. J. Food Sci. 2018, 83, 300–308. [CrossRef] [PubMed]
8. Petit, H.V.; Dewhurst, R.J.; Proulx, J.G.; Khalid, M.; Haresign, W.; Twagiramungu, H. Milk production, milk composition, and
reproductive function of dairy cows fed different fats. Can. J. Anim. Sci. 2001, 81, 263–271. [CrossRef]
9. Liu, A.J.; Zhao, Y.; Zhang, G.R.; Wang, D.; Wang, Y.X. Effects of α-Linolenic Acid Calcium on Lipid Metabolism of Mice with
Hyperlipidemia. Mod. Food Sci. Technol. 2009, 25, 1144–1145. [CrossRef]
10. Wang, X.; Martin, G.B.; Liu, S.; Shi, B.; Guo, X.; Zhao, Y.; Yan, S. The mechanism through which dietary supplementation
with heated linseed grain increases n-3 long-chain polyunsaturated fatty acid concentration in subcutaneous adipose tissue of
cashmere kids. J. Anim. Sci. 2019, 97, 385–397. [CrossRef]
11. Yagi, S.; Fukuda, D.; Aihara, K.I.; Akaike, M.; Shimabukuro, M.; Sata, M. n-3 Polyunsaturated Fatty Acids: Promising Nutrients
for Preventing Cardiovascular Disease. J. Atheroscler. Thromb. 2017, 24, 999–1010. [CrossRef]
12. Mori, T.A. Dietary n-3 PUFA and CVD: A review of the evidence. Proc. Nutr. Soc. 2014, 73, 57–64. [CrossRef]
13. Fu, J.; Bonder, M.J.; Cenit, M.C.; Tigchelaar, E.F.; Maatman, A.; Dekens, J.A.; Brandsma, E.; Marczynska, J.; Imhann, F.; Weersma,
R.K.; et al. The Gut Microbiome Contributes to a Substantial Proportion of the Variation in Blood Lipids. Circ. Res. 2015, 117,
817–824. [CrossRef]
14. Wen, C.; Yan, W.; Sun, C.; Ji, C.; Zhou, Q.; Zhang, D.; Zheng, J.; Yang, N. The gut microbiota is largely independent of host
genetics in regulating fat deposition in chickens. ISME J. 2019, 13, 1422–1436. [CrossRef] [PubMed]
15. Huang, X.; Fang, S.; Yang, H.; Gao, J.; He, M.; Ke, S.; Zhao, Y.; Chen, C.; Huang, L. Evaluating the contribution of gut microbiome
to the variance of porcine serum glucose and lipid concentration. Sci. Rep. 2017, 7, 14928. [CrossRef]
16. Yang, X.; Yin, F.; Yang, Y.; Lepp, D.; Yu, H.; Ruan, Z.; Yang, C.; Yin, Y.; Hou, Y.; Leeson, S.; et al. Dietary butyrate glycerides
modulate intestinal microbiota composition and serum metabolites in broilers. Sci. Rep. 2018, 8, 4940. [CrossRef] [PubMed]
17. Wang, X.; Martin, G.B.; Wen, Q.; Liu, S.; Zhang, J.; Yu, Y.; Shi, B.; Guo, X.; Zhao, Y.; Yan, S. Linseed oil and heated linseed grain
supplements have different effects on rumen bacterial community structures and fatty acid profiles in cashmere kids. J. Anim. Sci.
2019, 97, 2099–2113. [CrossRef] [PubMed]
18. Jiao, J.; Huang, J.; Zhou, C.; Tan, Z. Taxonomic Identification of Ruminal Epithelial Bacterial Diversity during Rumen Development
in Goats. Appl. Environ. Microbiol. 2015, 81, 3502–3509. [CrossRef]
19. Jiao, J.; Li, X.; Beauchemin, K.A.; Tan, Z.; Tang, S.; Zhou, C. Rumen development process in goats as affected by supplemental
feeding v. grazing: Age-related anatomic development, functional achievement and microbial colonisation. Br. J. Nutr. 2015, 113,
888–900. [CrossRef] [PubMed]
20. Yan, Z.; Zeng, D.; Zhang, Y.; Ni, X.Q.; Tang, Y.R.; Zhu, H.; Wang, H.S.; Yin, Z.Q.; Pan, K.C.; Jing, B. Characterization of the
cellulolytic bacteria communities along the gastrointestinal tract of Chinese Mongolian sheep by using PCR-DGGE and real-time
PCR analysis. World J. Microbiol. Biotechnol. 2015, 31, 1103–1113. [CrossRef]
21. China NY/T816. Feeding Standard of Meat-Producing Sheep and Goats; China NongYe HangYe Biaozhun/Tuijian-816; China
Agricultural Publisher: Beijing, China, 2004.
22. Candyrine, S.; Jahromi, M.F.; Ebrahimi, M.; Chen, W.L.; Rezaei, S.; Goh, Y.M.; Abdullah, N.; Liang, J.B. Oil supplementation
improved growth and diet digestibility in goats and sheep fed fattening diet. Asian-Australas. J. Anim. Sci. 2019, 32, 533–540.
[CrossRef]
23. Haliga, R.E.; Mocanu, V.; Badescu, M. Antioxidative and antiatherogenic effects of flaxseed, α-tocopherol and their combination
in diabetic hamsters fed with a high-fat diet. Exp. Ther. Med. 2015, 9, 533–538. [CrossRef]
24. Prasad, K.; Jadhav, A. Prevention and treatment of atherosclerosis with flaxseed-derived compound secoisolariciresinol digluco-
side. Curr. Pharm. Des. 2016, 22, 214–220. [CrossRef]
25. Bogin, E.; Avidar, Y.; Merom, M.; Soback, S.; Brenner, G. Biochemical changes associated with the fatty liver syndrome in cows. J.
Comp. Pathol. 1988, 98, 337–347. [CrossRef]You can also read