Frontal and parietal participation in problem solving in the Tower of London: fMRI and computational modeling of planning
←
→
Page content transcription
If your browser does not render page correctly, please read the page content below
Neuropsychologia 41 (2003) 1668–1682

     Frontal and parietal participation in problem solving in the Tower of
           London: fMRI and computational modeling of planning
                           and high-level perception
           Sharlene D. Newman∗ , Patricia A. Carpenter, Sashank Varma, Marcel Adam Just
                        Department of Psychology, Center for Cognitive Brain Imaging, Carnegie Mellon University, Baker Hall,
                                                3275000 Forbes Avenue, Pittsburgh, PA 15213, USA
                             Received 7 September 2001; received in revised form 7 May 2002; accepted 25 March 2003

Abstract
   This study triangulates executive planning and visuo-spatial reasoning in the context of the Tower of London (TOL) task by using a
variety of methodological approaches. These approaches include functional magnetic resonance imaging (fMRI), functional connectivity
analysis, individual difference analysis, and computational modeling. A graded fMRI paradigm compared the brain activation during the
solution of problems with varying path lengths: easy (1 and 2 moves), moderate (3 and 4 moves) and difficult (5 and 6 moves). There were
three central findings regarding the prefrontal cortex: (1) while both the left and right prefrontal cortices were equally involved during
the solution of moderate and difficult problems, the activation on the right was differentially attenuated during the solution of the easy
problems; (2) the activation observed in the right prefrontal cortex was highly correlated with individual differences in working memory
(measured independently by the reading span task); and (3) different patterns of functional connectivity were observed in the left and right
prefrontal cortices. Results obtained from the superior parietal region also revealed left/right differences; only the left superior parietal
region revealed an effect of difficulty. These fMRI results converged upon two hypotheses: (1) the right prefrontal area may be more involved
in the generation of a plan, whereas the left prefrontal area may be more involved in plan execution; and (2) the right superior parietal
region is more involved in attention processes while the left homologue is more of a visuo-spatial workspace. A 4CAPS computational
model of the cognitive processes and brain activation in the TOL task integrated these hypothesized mechanisms, and provided a reasonably
good fit to the observed behavioral and brain activation data. The multiple research approaches presented here converge on a deepening
understanding of the combination of perceptual and conceptual processes in this type of visual problem solving.
© 2003 Elsevier Science Ltd. All rights reserved.
Keywords: Planning; fMRI; Spatial working memory; Problem solving; Tower of London; Computational modeling; 4CAPS

1. Introduction                                                               Syed, & Toone, 1993; Owen, Downes, Sahakian, Polkey, &
                                                                              Robbins, 1990; Shallice, 1982). The current study uses both
   The ability to plan and schedule one’s actions is an                       a functional magnetic resonance imaging (fMRI) activation
essential part of a functional life. Planning is a superor-                   study, as well as a computational model to examine plan
dinate term that subsumes several subprocesses, including                     formation and execution in the TOL task.
strategy formation, coordination and sequencing of mental                        In the TOL paradigm used in the current study, partici-
functions, and holding information on-line (Morris, Miotto,                   pants were presented with two configurations (a start state
Feigenbaum, Bullock, & Polkey, 1997). Both neuropsycho-                       and a goal state) of three balls arrayed in three bins. The
logical and neuroimaging studies have suggested that the                      easiest type of problem is shown in Fig. 1. Participants were
prefrontal cortex is an important part of the cortical network                asked to plan how to move the balls from the start configu-
involved in planning. One task that has been used to assess                   ration to match the goal configuration in the minimum num-
planning function is the Tower of London task (TOL) (Baker,                   ber of moves. Their overt response concerned the number
Rogers, Owen, Frith, Dolan, Frackowiak, & Robbins, 1996;                      of moves that were required. Thus, this TOL task required
Dagher, Owen, Boecker, & Brooks, 1999; Morris, Ahmed,                         participants to “look ahead” and map out a plan to solve
                                                                              the problem. Constraints on the possible moves are deter-
 ∗ Corresponding author. Tel.: +1-412-268-6859; fax: +1-412-268-2804.         mined by the different depths of the bins (the three bins
 E-mail address: snewman@andrew.cmu.edu (S.D. Newman).                        hold three, two and one ball, respectively) and being able to

0028-3932/$ – see front matter © 2003 Elsevier Science Ltd. All rights reserved.
doi:10.1016/S0028-3932(03)00091-5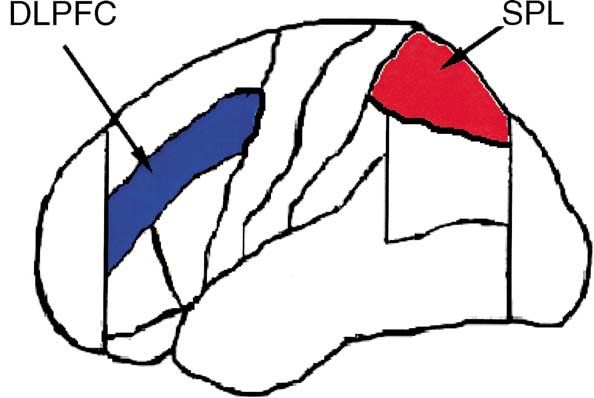
S.D. Newman et al. / Neuropsychologia 41 (2003) 1668–1682                                1669

                                                                                 responding brain area, modulo the hemodynamic response
                                                                                 function. Performing a task entails neural computation in
                                                                                 the brain areas with relevant competencies. Because the
                                                                                 modeled brain areas perform these theorized computations,
                                                                                 capacity utilization can be considered an idealized measure
                                                                                 of the activity level of the region. Information processing
                                                                                 within each center is highly collaborative in the sense that
                                                                                 productions fire in parallel. 4CAPS models are also col-
                                                                                 laborative in that centers interact with each other when
Fig. 1. A sample TOL problem. This display shows a 1-move problem,               performing a task. The pattern of interaction is dictated by
with the start state on the left, the goal state on the right, and a schematic   the functional demands of the task modeled and the spe-
diagram showing the response button assignments on the bottom. (The              cializations attributed to each of the centers of the model.
display was presented as a white figure on a black background.)
                                                                                    The TOL task here requires two main types of cognitive
                                                                                 processes: executive/planning processes and visuo-spatial
move only the top-most balls to a different bin. In addition                     processes. The 4CAPS model of TOL distributes these two
to being a test of planning, the TOL task also places consid-                    types of processes across four centers: RH-EXECUTIVE,
erable demands on spatial working memory. Therefore, the                         LH-EXECUTIVE, RH-SPATIAL and LH-SPATIAL. The
present research examines the neural basis of some of the                        RH- and LH-EXECUTIVE centers are proposed to corres-
visuo-spatial as well as the planning processes necessary to                     pond to right- and left-hemisphere dorsolateral prefrontal
perform the TOL task.                                                            cortex (DLPFC), respectively. The model is intended to
   A computational model of the TOL task was devel-                              be consistent with the established literature and theory of
oped in the cortical capacity–constrained collaborative                          prefrontal executive function associated with these areas.
activation-based production systems (4CAPS) cognitive                            In general, the RH-EXECUTIVE center is proposed to
neuroarchitecture, which is a production system architec-                        have specialized cognitive functions for goal-management,
ture with several connectionist features (for more details                       planning, and strategy formulation. In contrast, the
on 4CAPS refer to Just & Varma, 2003; Just, Carpenter,                           LH-EXECUTIVE center is proposed to have special-
& Varma, 1999). 4CAPS models function at the interface                           ized cognitive functions for controlling the execution of
between the cortical and cognitive levels of analysis. Con-                      a plan or of a sequence of mental actions. The RH- and
ventional production systems are the simulation medium                           LH-SPATIAL centers are intended to correspond to right-
of choice for high-level cognition. Some of the prominent                        and left-hemisphere superior parietal cortex, respectively,
ones, including Soar (Newell, 1990), ACT-R (Anderson,                            including the intraparietal sulcus area. As in the case of the
1993), EPIC (Meyer & Kieras, 1997) and 3CAPS (Goel,                              two EXECUTIVE centers, we propose a distinction in the
Pullara, & Grafman, 2001; Just & Carpenter, 1992), ac-                           functions of the two SPATIAL centers, based on emerging
count for the error patterns and processing times in problem                     evidence. The RH-SPATIAL center is hypothesized to be
solving, reasoning, decision making, memory and learning,                        more involved in the control of spatial attention and the ge-
language comprehension and visual thinking.                                      ometric manipulation of spatial representations (Carpenter,
   In addition to accounting for the behavioral characteris-                     Just, Keller, Eddy, & Thulborn, 1999; Chelazzi & Cor-
tics as the systems above do, 4CAPS models also attempt to                       betta, 2000; Mesulam, 1990), whereas the LH-SPATIAL
account for the amount of brain activity in a number of cor-                     center is proposed to be more involved with constructing
tical areas as measured by functional neuroimaging. 4CAPS                        and maintaining spatial representations. The model’s main
models consist of a number of processing centers each cor-                       predictions concern the relative amount of activation in the
responding to a particular cortical area. Each 4CAPS center                      four areas in each of the three experimental conditions.
is a hybrid symbolic-connectionist processing system with                        (Further details regarding the specific processes attributed
its own specializations and computational resources. Pro-                        to each center are described in the discussion section and
ductions, or if–then rules, implement these processes. The                       details regarding the problem-solving heuristics used are
productions do their work by incrementally manipulating                          outlined in Appendix A.)
the activation levels of representational elements. Each cen-                       Functional neuroimaging studies typically measure cor-
ter possesses a finite amount of resources paralleling the                       tical activation to assess the involvement of a particular
biological and informational constraints of cortical areas.                      region in a given task. The qualitative properties of the
The capacity utilization of a center is an index of its re-                      task are assumed to be critical to the pattern of activation.
source consumption over time. Because the actions of the                         The current study goes beyond the qualitative aspects to
productions consume resources, the total resource consump-                       examine the quantitative properties of the brain activation
tion of a center can be measured (either instantaneously or                      within the context of a theoretical framework. We relate the
averaged over an interval of time). A key claim of 4CAPS                         amount of cognitive demand in each experimental condi-
is that the capacity utilization of a center should correspond                   tion (as measured in the 4CAPS model) to the amount of
to the relative level of fMRI-measured activation in the cor-                    cortical activity in specific areas, as measured with fMRI.
1670 S.D. Newman et al. / Neuropsychologia 41 (2003) 1668–1682
Furthermore, we examine the degree of synchronization 2.2. Experimental paradigm
(functional connectivity) between the activation in key cor-
tical areas as a function of the number of moves in the The experiment consisted of a practice session and a scan-
problem (Diwadkar, Carpenter, & Just, 2000). Finally, we ning session. In the practice session, participants solved two
explore the impact of individual differences in working sets of Tower of London problems. During the first 19 prac-
memory on patterns of brain activation, by examining the tice problems, both the start state and goal state were pre-
correlation between levels of brain activation and measures sented on a computer screen, and participants used a mouse
of working memory capacity. The major objective is to de- to actually move the balls from bin to bin, beginning in the
termine how the amount of neural activation in a network start state, until they matched the goal state. This format en-
of brain regions is modulated by the amount and type of sured that participants were thoroughly familiarized with the
processing that is required in a given condition. Difficulty Tower of London problem-solving procedures. The format
is manipulated here as the minimal number of moves (or of the next 18 practice problems was identical to that used
solution path length) required to solve the problem. As the in the scanner during the text session. On each trial, the start
number of moves increases, the working memory load, as and goal states of a Tower of London problem were pre-
well as demands on planning processes increase. Therefore, sented (see Fig. 1). But rather than moving the balls, the par-
in the current experiment we varied the path length so that ticipants were asked to imagine the moves and count the total
it ranged from easy (1–2 moves problems) to moderate (3–4 number of moves required, and then indicate (by pressing the
move problems) to difficult (>5 moves). This allows for appropriate response button) the total number of moves. As
the observation of parametric changes in the activation. It Fig. 1 indicates, the display contained a schematic diagram
also allows for substantiative evaluation of the TOL model of the buttons and their correct response assignments. All of
and the 4CAPS cognitive neuroarchitecture in which it is the presented problems required 1–2, 3, 4, or >5 moves.
embedded. Participants were familiarized with the fMRI scanner and
The goal of the current study was to use the methods out- the general scanning procedures prior to being scanned.
lined above to further characterize the contribution of pre- During the test session, participants solved 12 epochs con-
frontal and parietal regions in planning and visuo-spatial taining 3–6 Tower of London problems each. The task
processing in the TOL task. One specific hypothesis exam- was self-paced, and each problem display remained visible
ined is that there are hemispheric processing differences in until a response was made. Both response latencies and
TOL in both prefrontal and parietal cortex. We suggest, and accuracies were collected. Epochs were separated by a 6 s
there is some indication in the literature (Burgess, Veitch, rest period in which participants fixated a plus sign in the
de Lacy Costello, & Shallice, 2000; Feigenbaum, Polkey, center of the screen. The images collected during these rest
& Morris, 1996; Miotto, Bullock, Polkey, & Morris, 1996; periods and the first 6 s of each epoch were discarded to ac-
Morris et al., 1997), that the right prefrontal cortex is dif- commodate the rise and fall of the hemodynamic response
ferentially involved in the formulation of plans, while left (Bandettini, Wong, Hinks, Tokofsky, & Hyde, 1992). Five
prefrontal cortex is involved in the execution of that plan. In 30 s fixation periods were also included to provide a base-
addition, we suggest, and again there is some evidence in the line measure of cortical activation.
literature, that right superior parietal cortex is differentially Problem difficulty (as defined by the minimum number
involved in spatial attention while left superior parietal cor- of moves to solve a problem) was the independent variable.
tex may be more involved in maintaining visuo-spatial infor- All of the problems had a unique solution. The epochs
mation. These hypotheses concern differential, not absolute were constructed to give three average levels of path length,
involvement, because the areas involved appear to closely with a small amount of overlap across epochs to make the
collaborate. solutions within an epoch unpredictable and to require at
least two different responses within each epoch: (1) Easy
epochs contained five 1- and 2-move problems and one
2. Method 3-move problem; (2) Moderate epochs contained three 3-
and 4-move problems and one 1-move problem; and (3)
2.1. Participants Difficult epochs contained two 5- and 6-move problems and
one 1-move problem. The durations of the epochs were ap-
Sixteen right-handed (12 males and 4 females) Carnegie proximately equated by having more items in those epochs
Mellon University undergraduate students participated in that contained easier problems. The mean reaction times for
the experiment. All of the participants gave informed con- each problem type was estimated based on data obtained
sent that was approved by the University of Pittsburgh during a pilot study.
and Carnegie Mellon Institutional Review Boards. Data
from three participants were excluded due to excessive 2.3. Psychometric testing
out-of-plane motion during scanning, and data from one
additional participant was excluded because of excessive The Daneman and Carpenter (1980) reading span test
in-plane motion (mean displacement > 0.3 voxels). was administered to 10 of 12 participants. This test requiredS.D. Newman et al. / Neuropsychologia 41 (2003) 1668–1682 1671
participants to simultaneously read aloud a small (1–5) set within the inferior frontal gyrus and the inferior parietal
of sentences while attempting to recall the last word of each cortex. The ROIs were anatomically defined to allow com-
sentence at the end of the set. The number of sentences read parison of activation within some specified cortical region
was incremented until the participants failed to recall one or across conditions. The ROIs were defined according to the
more of the sentence-final words on 50% of the trials. The Rademacher, Galaburda, Kennedy, Flilipek, and Caviness
number of words recalled at this point was defined as the (1992), and Caviness, Meyer, Makris, and Kennedy (1996)
participant’s reading span. Because the reading span task parcellation scheme, which uses limiting sulci and coronal
is increasingly being used to assess central executive func- planes defined by anatomical landmarks to segment cortical
tioning in studies of the effects of frontal lobe damage and regions. The limiting sulci and anatomical landmarks were
working memory (Engle & Oransky, 1999; Whitney, Arnett, located by simultaneously viewing the structural images in
Driver, & Budd, 2001), we used it here as a measure of ex- the three orthogonal planes; the ROIs were then defined
ecutive functioning. by manually tracing the regions onto each functional slice.
The superior parietal ROI (SPL) was defined as BA 5 and
7, while the inferior parietal ROI (IPL) was defined as BA
2.4. fMRI procedure
40 and 39. The dorsolateral prefrontal cortex included the
middle frontal gyrus F2, or approximately BA 10, 9, 46
The experiment was conducted on a GE 3.0T scanner us-
and portions of 6 and 8. The inferior frontal gyrus (IFG)
ing a commercial birdcage, quadrature-drive radio-frequency
was defined as BA 44, 45 and 47. The inter-rater reliability
whole-head coil. Fourteen oblique-axial images (5 mm
of this ROI-defining procedure between two trained staff
thick, skipping 1 mm between slices) were chosen to max-
members was previously evaluated for four ROIs in two
imize the coverage of each participant’s cerebral cortex
participants in another study. The reliability measure was
while minimizing coverage of the eyes and their move-
obtained by dividing the size of the set of voxels that over-
ment. The images were collected using a gradient echo,
lapped between the two raters by the mean of their two set
resonant echo planar pulse sequence, with TE = 25 ms,
sizes. The resulting eight reliability measures were in the
90◦ flip-angle, and a 128 × 64 acquisition matrix with
78–91% range, with a mean of 84%, as high as the reliabil-
3.125 mm × 3.125 mm × 5 mm voxels, with a TR (time per
ity reported by the developers of the parcellation scheme.
repetition or sampling rate) of once of every 3000 ms.
The means of the images corresponding to each 2.5. Data analysis
participant’s 14 functional slices were registered to a high-
resolution, T1-weighted structural volume scan. The vol-
Image preprocessing (including de-ghosting, mean cor-
ume scans were constructed from 124 3D SPGR axial
rection, motion correction, and trend correction) was
images that were collected with TR = 25 ms, TE = 4 ms,
performed using FIASCO (Eddy, Fitzgerald, Genovese,
40◦ flip-angle, and a 24 cm × 18 cm FOV, resulting in
Mockus, & Noll, 1996; Lazar, Eddy, Genovese, & Welling,
0.9375 mm × 0.9375 mm × 1.5 mm voxels.
2001; further description and tools are available at
Because problem solving tasks like the TOL are thought to
http://www.stat.cmu.edu/∼fiasco/). The mean of the max-
engage a large-scale network of cortical regions (Mesulam,
imum head motion per participant was 0.2 voxels, and it
1990, 1998), our fMRI analyses focused on measuring the
never exceeded 0.3 voxels. To accommodate the rise and
modulation of the volume of activation from four regions of
fall time of the hemodynamic response data from the first
interest (ROIs): left and right superior parietal and DLPFC
6 s of each epoch and the 6 s rest interval between epochs
(see Fig. 2). However, we also examined the activation
were discarded. Excluded from analysis were the 1% of all
voxels showing more than 6% change in signal intensity
that might have possibly arisen from blood vessels.
fMRI-measured activation was quantified by first con-
structing a t-map by computing the difference between each
voxel’s activation in each experimental condition and the
baseline condition. Voxels whose signal change exceeded
baseline by an amount determined by t-tests with t > 6 were
considered “active.” This high t-threshold provides approx-
imately similar or more conservative correction for multiple
comparisons as compared to a Bonferroni correction with an
alpha level of 0.01 given approximately 5000 voxels per par-
ticipant in all regions of interest. A measure called the sum of
the change in signal intensity (SSI) was calculated for each
ROI and each participant, to take into consideration changes
Fig. 2. A schematic depiction of the DLPFC (blue) and superior parietal in both the signal intensity and in the activation volume
(red) ROIs. (see Xiong, Rao, Gao, Woldorff, & Fox, 1998 for details).1672 S.D. Newman et al. / Neuropsychologia 41 (2003) 1668–1682
The SSI is calculated by summing the percent change in accuracy (0.90). Fig. 3A shows the mean reaction time for
signal intensity for each active voxel within an ROI. those problems that were solved correctly and the proportion
of problems solved. As expected, the time necessary to solve
a problem increased monotonically with path length (i.e. the
3. Results number of moves). A one-way ANOVA indicated that the
effect of this variable was statistically reliable, F(5, 55) =
3.1. Human participant results 19.46, P < 0.01. A similar ANOVA on the proportion of
incorrect responses also indicated a reliable effect of path
3.1.1. Behavioral results length, F(5, 55) = 4.33, P < 0.01. The slight decrease in
The behavioral data indicate that the participants followed error rate for the longest length problems arose because
instructions and solved the problems with a high degree of participants sometimes responded by pressing the >5 move
Fig. 3. (A) The mean response latencies for correctly solved TOL problems and the percentage of problems solved incorrectly, both as a function of path
length (i.e. the minimal number of moves needed to solve a problem). (B) The computational model’s processing time for each problem. As shown, the
model’s processing time reveals a similar slope as the participants’ reaction time, both showing a sharp increase with number of moves.S.D. Newman et al. / Neuropsychologia 41 (2003) 1668–1682 1673
Table 1
Activation
ROI Sum signal intensity (%) Average coordinates
Easy Moderate Difficult x y z
Left dorsolateral prefrontal cortex (BA 8, 9, 10, 46) 7.3 10.2 14.3 36.5 −26.8 35.4
Right dorsolateral prefrontal cortex 2.8 9.0 12.3 −32.5 −24.0 40.7
Left superior parietal cortex (BA 5 and 7) 19.6 29.7 32.5 18.9 67.4 46.3
Right superior parietal cortex 31.4 34.7 36.9 −19.9 65.2 47.4
Left inferior frontal gyrus (BA 44 and 45) 4.8 8.6 8.1 40.8 −14.1 27.9
Right inferior frontal gyrus 1.6 3.3 2.1 −37.4 −19.7 22.9
Left inferior parietal cortex (BA 39 and 40) 20.2 29.6 31.8 33.8 56.9 45.2
Right inferior parietal cortex 19.6 20.8 20.7 −36.9 53.3 44.3
button during very time-consuming problems before they 3.1.2.1. DLPFC ROIs. As predicted, the mean change
had completed the solution. However, because the reaction in the sum of the signal intensity in the DLPFC increased
time continues to increase with path length, it may be as- with path length, F(2, 22) = 5.97, P < 0.01, as shown in
sumed that participants were engaged in the solution of the Fig. 5A. Moreover, neither the main effect of laterality nor
5- and 6-move problems. its interaction with difficulty were reliable, F < 1. Further
analysis of each hemisphere separately revealed that the
3.1.2. fMRI results effect of difficulty was significant in both left and right
The TOL task activated several brain regions, including DLPFC, F(2, 22) = 5.61, P < 0.05 and F(2, 22) = 4.35,
the dorsolateral prefrontal cortex, the inferior frontal gyrus, P < 0.05, respectively. These results indicate that both
the superior parietal cortex, and the inferior parietal cor- left and right DLPFC were involved in the TOL process-
tex, as shown in Table 1 and Fig. 4. Because no signifi- ing to an approximately similar extent during the perfor-
cant differences in the level of activation as a function of mance of the moderate and difficult problems. The group
difficulty were observed in either the inferior frontal gyrus averaged activation pattern in one slice is presented in
or the inferior parietal region, the focus of the description Fig. 4.
of the results below is on DLPFC and the superior pari-
etal area, although all of the results are shown in Table 1. 3.1.2.2. Parietal ROIs. Path length also significantly
For both cortical regions a set of three ANOVAs were com- affected the activation of the superior parietal region,
puted. The first was a three by two ANOVA in which dif- F(2, 22) = 4.42, P < 0.05, as shown in Fig. 6A. In addi-
ficulty (easy versus moderate versus difficult) and laterality tion, as in the DLPFC, there was no main effect of laterality,
(left versus right) as within-participant variables. The re- F(1, 22) = 2.05, P > 0.1. However, unlike the DLPFC,
maining two analyses were one-way ANOVAs performed only the left superior parietal ROI revealed a reliable effect
for each hemisphere with difficulty as the within-participant of number of moves [F(2, 22) = 7.6, P < 0.005] while the
variable. right superior parietal region did not, F < 1. While these
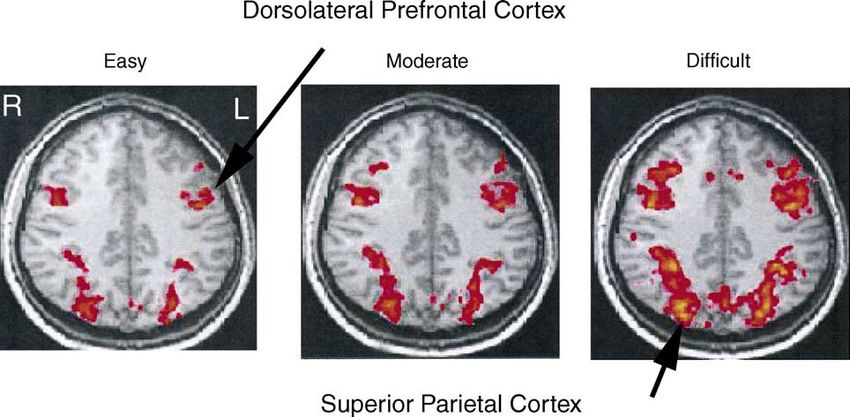
Fig. 4. The Talairach averaged pattern of activation for each of the three levels of path length superimposed on the structural images of a single
individual. The left-most column depicts the activation for the easy problems, the middle column moderate problems, and the right-most column the
difficult problems. As shown, the amount of activation increases with difficulty in the prefrontal cortex as well as the superior parietal cortex.1674 S.D. Newman et al. / Neuropsychologia 41 (2003) 1668–1682
Fig. 5. fMRI and model results for the DLPFC. (A) The sum signal
intensity for both left and right DLPFC. As shown, the activation level for
the right DLPFC during the easy problems is significantly less than for the
Fig. 6. fMRI and model results for the superior parietal region. (A)
left while they are quite similar for the moderate and difficult problems.
The sum signal intensity for both left and right superior parietal cortex.
(B) The capacity utilization for the model’s left and right EXECUTIVE
As shown, while the left superior parietal region reveals a prominent
centers, which corresponds to the left and right DLPFC.
step-wise increase in activation with difficulty, its right homologue reveals
a significantly attenuated step-wise increase. (B) The capacity utilization
for the model’s left and right SPATIAL centers, which corresponds to the
results indicate that both left and right superior parietal processing taking place in left and right superior parietal cortex.
regions were clearly involved in the task, they also suggest
that the two regions may be performing somewhat different & Miyake, 2003; Reichle, Carpenter, & Just, 2000). The
functions. correlation for the easy and moderately difficult problems
failed to reach significance (right DLPFC r = −0.06 and
3.1.2.3. Individual differences. To examine the relation- −0.37 and left DLPFC r = 0.07 and 0.01, respectively).
ship between cortical activation and a psychometric mea-
sure of working memory and executive functioning, the 3.1.2.4. Planning time. Previous studies examining the
correlation between the SSI measure in each condition and Tower of London as well as the Tower of Hanoi (TOH)
the participant’s reading span score was computed. Partici- have examined the effect of planning time on the level of
pants with higher reading span scores produced less cortical activation (Morris et al., 1993; Rowe, Owen, Johnsrude, &
activation in the right DLPFC than individuals with a lower Passingham, 2001). It is thought that areas whose activation
reading span during the solution of the longest path prob- levels are highly correlated with the planning time are more
lems, r = −0.67, P < 0.05, as shown in Fig. 7 (left DLPFC intimately involved in planning processes. Planning time is
r = –0.12). In addition, a t-test comparing these two cor- typically defined as the time between stimulus onset and
relation coefficients found that the correlation between the the onset of the first move. In studies in which participants
activation of the right prefrontal cortex and reading span actually move the balls, they are typically asked to plan the
is significantly different from the correlation between left entire sequence of moves before they make their first move.
prefrontal cortex activation and reading span (t = 2.23, α = In the current task, participants do not physically move the
0.05). When a correlation between an ability level and acti- balls. It can be argued that the reaction time measure in the
vation level is observed, the relation is generally like this one, current study corresponds approximately to the planning
with less activation with greater ability, reflecting something time measured in previous studies. We calculated the cor-
like cortical efficiency (Haier, Siegel, Neuchterlein, Hazlett, relation between mean response time for each participant
Wu, Paek, Browning, & Buchsbaum, 1988; Just, Carpenter, and their corresponding activation level for each ROI. TheS.D. Newman et al. / Neuropsychologia 41 (2003) 1668–1682 1675
Fig. 7. Scatter plot indicating the correlation between the volume of
activation and reading span for right DLPFC for the difficult problems.
One of the 12 participants failed to undergo the reading span task and
there are some participants with the same reading span score and the
same activation volume resulting in the appearance of nine data points.
As shown, the activation volume is significantly less for those participants
with high reading spans compared to those with low span scores.
correlation between SSI during the solution of the longest
path problems and response time was highly significant
for both left and right superior parietal regions (r = 0.66,
Fig. 8. Scatter plots indicating the correlation between the volume of
P < 0.05 and r = 0.93, P < 0.05 respectively), as seen activation and the average response time for each participant for both left
in the scatter plots in Fig. 8. The correlations between re- and right superior parietal cortex. As shown, there is a linear increase in
sponse time and the activation within the prefrontal regions the activation volume with increasing response time.
(r = 0.71, P < 0.05 for left and r = 0.47, NS, for the right
DLPFC) were also relatively high.
3.1.2.5. Functional connectivity. The activation in a set of The analysis revealed two major findings that support
cortical areas is highly synchronized, indicating collabora- differential processing in left and right prefrontal cortex.
tion among areas. An increasingly used technique measures The first is that while the right prefrontal region showed a
the correlation of the activation levels in two activated ar- significant linear increase in functional connectivity with
eas over some time period, and generally shows systematic path length, the left prefrontal region did not (see Fig. 9).
synchronization between areas, modulated by a number The modulation by problem difficulty of the functional con-
of variables. The synchronization is taken as evidence of nectivity between the right DLPFC and left superior parietal
functional connectivity [or effective connectivity (Buchel, cortex [F(2, 20) = 6.13, P < 0.01], and right superior pari-
Coull, & Friston, 1999; Friston, 1994; Horwitz, Rumsey, etal cortex [F(2, 20) = 4.92, P < 0.05] was found to be
& Donohue, 1998)]. The functional connectivity between significant. On the other hand, the modulation of the func-
ROIs was assessed by computing the correlation of the tional connectivity between the left DLPFC and the left su-
activation time-series between activated voxels in pairs of perior parietal cortex [F(2, 20) = 1.24, P > 0.3], and right
ROIs. Functionally connected areas might be collaborating superior parietal cortex (F < 1) failed to reach significance.
or communicating, such that their activation levels are being While the modulation of functional connectivity with
modulated by a partially overlapping workload. The corre- path length was found to be significant only between the
lations were based on only those periods when the task was right prefrontal region and parietal cortices, the left pre-
being performed (excluding the fixation periods), so that frontal region was found to have a higher level of functional
the time series indicates the momentary fluctuations in ac- connectivity with the same regions. This is particularly
tivation level during the task performance. The correlation true during the shorter path length problems, as shown in
between the averaged time courses from the activated voxels Fig. 9 (all t’s comparing left and right connectivity were
in each member of a pair of ROIs was computed for each >2.0, P < 0.05). This suggests that the left DLPFC was
participant. An ANOVA compared the functional connec- more involved in the processing of the shortest path length
tivities of each ROI pair across the three levels of difficulty. problems than was its right homologue.1676 S.D. Newman et al. / Neuropsychologia 41 (2003) 1668–1682
the proportion of the resource pool that is being consumed,
averaged over all the cycles of processing for each problem
(see Haarmann, Just, & Carpenter, 1997 for a similar mea-
sure in a purely cognitive system, 3CAPS). The capacity uti-
lizations of both centers increase linearly with path length,
matching the neuroimaging data shown in Fig. 5. Specifi-
cally, the correlation between the brain imaging data and the
capacity utilizations of the model is 0.96 (P < 0.01).
Fig. 6B shows the capacity utilizations of the LH- and
RH-SPATIAL centers for the three levels of path length. Al-
though the quantitative fit between the brain imaging data
and model predictions is only marginally reliable, as re-
flected in the correlation of 0.79 (0.05 < P < 0.1), the
qualitative fit is good.
4. fMRI discussion
The use of a graded, parametric design as well as func-
tional connectivity analysis has allowed for a more detailed
examination of the contribution of the cortical regions nec-
essary to perform the Tower of London task. These new
results combine with findings in the literature to suggest a
theory of the function of the superior parietal and prefrontal
cortical areas during TOL problem solving.
Fig. 9. The functional connectivity between (A) the right DLPFC [(B) 4.1. Planning
the left DLPFC] and the left and right superior parietal cortex. As shown,
the connectivity increases with path length and the connectivity between One of the major goals of this study was to examine the
left DLPFC and the superior parietal cortex is greater than that between
hemispheric differences in prefrontal cortex as it relates to
the right DLPFC and the superior parietal cortex. Also, the connectivity
of right DLPFC with left and right superior parietal cortex is much lower planning. “Planning” includes strategy formation, coordinat-
when solving the easy problems compared to the connectivity of left ing and sequencing mental activity, and holding information
DLPFC with left and right superior parietal cortex when solving the easy on-line (Morris et al., 1997). In addition, Goel and Grafman
problems. (1995) have differentiated the process of planning (“charting
a course from point A to B”) versus executing that plan.
The results obtained in the current study suggest that al-
3.1.3. 4CAPS model results though both left and right DLPFC are clearly involved in the
The TOL model corresponds well to the subset of the be- TOL task, the two regions may be performing distinguish-
havioral and neuroimaging data to which it has been com- able functions. One account that is consistent with these data
pared, as shown in Figs. 3B, 5B, and 6B. Below we will is that the right prefrontal cortex is differentially involved in
discuss in more detail the relation between the model char- constructing the plan for solving the TOL problem, whereas
acteristics and the behavioral and neuroimaging data. the left prefrontal cortex is involved in control processes (or
Fig. 3B plots the model’s average processing time for supervising the execution of the plan). Several sources of
problems of each length. As with the behavioral data in evidence converge on this conclusion. First, only the right
Fig. 3A, the model times (number of model macrocy- DLPFC revealed a significant correlation with reading span,
cles) increase in a monotonic and roughly linear fashion. such that participants with higher span scores elicited less
The correlation between human reaction times and model activation than those with lower scores. The reading span
processing times is 0.96 (P < 0.01). Because 4CAPS is has been used as a tool to assess the functioning of the cen-
deterministic, the TOL model cannot address the behav- tral executive particularly in the context of working memory
ioral error rates without further assumptions about random management (Engle & Oransky, 1999; Whitney et al., 2001).
processes that can cause errors. We chose not to make such Therefore, the significant correlation with right but not left
assumptions here because this is not the current focus of DLPFC provides a possible insight, namely that the right
the theory or modeling effort. prefrontal cortex may be involved in the strategic planning
Fig. 5B plots the capacity utilization of the LH- and necessary to integrate and maintain information. Second,
RH-EXECUTIVE centers for the three path length cate- the modulation of the functional connectivity between the
gories. The capacity utilization measure from the model is left and right DLPFC with other areas was found to differ.S.D. Newman et al. / Neuropsychologia 41 (2003) 1668–1682 1677 During the problems with shortest path length, the right the easy TOL problems, which require very little planning, DLPFC was less involved than the left DLPFC, suggesting but also in the region’s lack of correlation with reading span, that the right DLPFC becomes substantially involved only which is thought to measure central executive functioning. when the demands on planning increase. Therefore, while Also, in a single trial fMRI study of the Stroop task, activa- both left and right DLPFC may be involved in the planning tion within the left DLPFC was found to be modulated only required to perform the TOL task, it appears that they are by the instruction to name the color and not to read the word, involved in slightly different aspects of planning. which is consistent with the role of the left DLPFC in repre- The hypothesis that left and right prefrontal regions may senting and maintaining task demands needed for top–down be associated with different functions is supported by other control (McDonald, Cohen, Stenger, & Carter, 2000). findings in both the neuropsychological and neuroimaging literature. For example, in a recent study examining verbal 4.2. Visuo-spatial processing and spatial working memory, the right prefrontal cortex was found to elicit significantly more activation during the main- A secondary goal of this work was to examine the contri- tenance of integrated information (when letters to be remem- bution of the superior parietal region to the spatial working bered were displayed in the locations to be remembered) memory and mental imagery processing taking place dur- than unintegrated information (when the letters to be remem- ing the TOL task. Like the prefrontal regions, the left and bered were displayed centrally and separately from the loca- right parietal regions also appear to be involved in some- tions to be remembered), despite the fact that the behavioral what different processes. As shown in Fig. 6, the activation measures indicated that the integrated condition was easier within the right superior parietal region was not strongly than the unintegrated condition (Prabhakaran, Narayanan, modulated by path length, as was the activation in its left Zhao, & Gabrieli, 2000). While the current task involves homologue. While the amount of right superior parietal spatial working memory, it also involves holding onto sev- activation was not reliably modulated by difficulty, its con- eral pieces of information, such as the spatial configuration nectivity with right DLPFC was, suggesting that while the of the balls as well as a dynamic count of the number of amount of processing taking place within the region does moves. While Prabhakaran et al. (2000) attributed the acti- not change, its coordination with prefrontal regions does vation within the right prefrontal cortex to integration, it can increase with path length. It has been hypothesized that the be argued that strategic planning is necessary to integrate right superior parietal region is involved in attention pro- and maintain the information. Also, a recent fMRI study of cessing (Coull & Frith, 1998). When performing any TOL goal management (a key facet of planning) found more acti- problem, participants may be expected to make attentional vation in right prefrontal cortex than in left prefrontal cortex shifts between the various imagined states (locations) of (Braver & Bongiolatti, 2002). In addition, it can be argued the balls, including the start state, the goal state, and the that the reading span task also taps into these planning pro- intermediate states. Therefore, the lack of a significant ef- cesses such that individuals with high reading spans have an fect of difficulty in the right superior parietal region may be increased ability to integrate information, which enhances due to its constant role in attention, which was necessary the efficiency of their working memory system. in relatively high degrees in all three conditions. There is also some evidence that strategy formation is lat- While the right superior parietal region appears to be eralized to some degree, with spatial tasks revealing greater more involved in attention processes, the left homologue deficits after damage to the right prefrontal cortex. For ex- may be more of a visuo-spatial workspace. When solving the ample, in a study examining patients with either left or TOL problems, participants may be expected to make use right frontal lesions during the performance of the Tower of of mental imagery processes in order to plan the moves. It Hanoi, patients with right hemisphere lesions, not left, were seems plausible and has been suggested that imagery plays impaired in planning accuracy (Morris et al., 1997). Also, an important role in spatial reasoning and memory (Kosslyn, in the comparison between frontal and temporal lobe lesion Behrman, & Jeannerod, 1995). In addition, it has been sug- patients, only the right frontal group revealed poor strategy gested that some aspects of mental imagery are lateralized formation (Feigenbaum et al., 1996; Miotto et al., 1996). to the left hemisphere (D’Esposito, Deter, Aguirre, Stallcup, Furthermore, in a study in which frontal lobe patients were Alsop, Tippet, & Farah, 1997; Farah, Peronnet, Weisberg, & asked to perform a multitasking experiment, it was found Monheit, 1989; Ishai, Ungerleider, & Haxby, 2000). For ex- that those patients with lesions involving the lateral aspects ample, in a study in which participants were to either view of Brodmann’s areas 8, 9, and 46 in the right frontal lobe images of objects or generate mental images of objects, made poor plans (Burgess et al., 2000), suggesting that it is imagery elicited significantly more left superior parietal ac- the right DLPFC that is involved in strategy formation. tivation, particularly in and around the intraparietal sulcus, While the right prefrontal cortex appears to be more in- than its right homologue (Ishai et al., 2000). In the current volved in strategy formation, the left prefrontal region ap- study, the activation within the left superior parietal region pears to be more involved in the control processes necessary was significantly modulated by task difficulty. Presumably, to provide top–down support. This is indicated not only by an increase in the number of moves planned would increase the significant involvement of the left DLPFC even during the amount of mental imagery processing required.
1678                                   S.D. Newman et al. / Neuropsychologia 41 (2003) 1668–1682

   The activation of the superior parietal ROIs was also              and ending state. Perceptual operators are proposed with-
highly correlated with response time. Due to the design of the        out considering whether their preconditions are completely
current study, response time here is analogous to “planning           met, i.e. whether they can be applied to the current state.
time” in previous studies (e.g. Rowe et al., 2001). Therefore,        Note that the perceptual mode alone can solve simple TOL
this high correlation suggests that although participants are         problems whose starting configurations can be transformed
not manually moving the balls during this “planning” pe-              into their ending configurations by a sequence of perceptual
riod, they are mentally moving them and representing the in-          moves. This is consistent with the success of patients with
termediate steps. This high correlation of the response time          frontal lobe lesions on TOL problems requiring one or two
with the superior parietal region activation suggests that this       moves (Owen et al., 1990).
time is devoted to non-planning processes, as well as those              If the preconditions of a proposed operator are unsatisfied
related to planning. In addition, planning time was also cor-         and the perceptual mode falters, the strategic mode assumes
related with the activation in both the left and right DLPFC,         control. The strategic mode is goal-driven in that it proposes
suggesting that in the current task, planning processes can-          goals that bring about the necessary preconditions. Goals
not be easily separated from those involved in visuo-spatial          are proposed and pursued by strategic operators. If one or
processes.                                                            more of the preconditions of a strategic operator are unsat-
                                                                      isfied, goals will be recursively proposed to establish these
                                                                      preconditions, resulting in goal hierarchies. After the strate-
5. The TOL model                                                      gic mode establishes the outstanding preconditions of the
                                                                      moment, the perceptual mode resumes control and the orig-
   The account of executive function at the heart of the TOL          inal perceptual operator is applied. (Note that the perceptual
model, that we have proposed in more detail elsewhere                 and strategic modes correspond approximately to two arti-
(Just & Varma, 2003), synthesizes two existing theories.              ficial intelligence techniques, hill-climbing and hierarchical
The first was proposed by Shallice (1982), who suggested              planning.) The adaptive transfer of control between percep-
that executive function arises from the reconciliation of two         tual and strategic modes as needed is a key characteristic of
streams of cognitive control. The “routine” stream is par-            the proposed theory of executive function.
allel, bottom–up, and perceptually driven. By contrast, the
“non-routine” stream is serial, top–down, and goal-driven.            5.1. Cortical centers
Resolving the two streams of control is the job of the
“contention scheduler.” Shallice placed the routine and                  The 4CAPS model of TOL problem solving relates
non-routine streams in posterior and anterior areas of the            the qualitative description of executive function offered
brain, respectively. The second theory of executive function          above to cortical function. Executive function in this spatial
utilized in the present work is Newell’s (1990) Soar model            problem-solving task is distributed across four centers, and
of problem solving. Soar construes problem solving as a               emerges through their collaborative processing.
sequence of cycles, each consisting of four phases. During
the “deliberation phase,” all problem-solving operators that          5.1.1. RH- and LH-EXECUTIVE centers
can apply next are proposed in parallel. During the second               RH-EXECUTIVE is hypothesized to be deeply involved
phase, preferences between pairs of operators are computed,           in strategic control. It is specialized for proposing new goals
again in parallel. Each preference asserts that one operator          and proposing strategic moves based on existing goals. The
is preferable to another. During the third phase, a decision          re-iterative proposing of goals and strategic moves consti-
procedure sorts through the preferences to select the most            tutes the construction of a plan. A plan can have the struc-
preferred operator. If possible, the selected operator is ap-         ture of a goal hierarchy if embedded goals are required.
plied to the current state during the final phase, producing a        RH-EXECUTIVE becomes engaged when a selected move
new current state. However, if one or more of the precondi-           cannot be applied because one or more of its preconditions
tions of the selected operator are unsatisfied, then goals are        is unsatisfied (i.e. there is an impediment to making the
established to resolve the impasse by satisfying the unsat-           move). RH-EXECUTIVE then proposes new goals that lead
isfied preconditions. The sufficiency of Soar as an account           to satisfying each unsatisfied precondition.
of problem solving has been demonstrated across several                  LH-EXECUTIVE is hypothesized to be involved in the
tasks (Rosenbloom, Laird, & Newell, 1993a, 1993b).                    control of the execution of moves according to an existing
   The account of executive function that we offer inte-              plan. At any point in time, multiple moves may be avail-
grates Shallice’s theory and Soar (for more detail, see Just &        able to be performed next. LH-EXECUTIVE selects among
Varma, 2003). The routine and non-routine streams are re-             possible moves by asserting a preference between pairs of
ferred to as the perceptual and strategic modes of processing         possible proposed moves (based on heuristic, algorithmic,
and are implemented using the information processing vo-              and/or frequency principles) and choosing the next move
cabulary of Soar: states, operators, goals, etc. The perceptual       by consolidating over these pair-wise move preferences.
mode is driven by perceptual analysis, proposing operators            LH-EXECUTIVE functions like the contention scheduler of
that increase the visual similarity between the current state         Shallice’s theory.
S.D. Newman et al. / Neuropsychologia 41 (2003) 1668–1682 1679
The capacity utilizations of both executive centers in- with path length, and consequently so does the capacity
crease linearly with path length, matching the neuroimaging utilization of the LH-SPATIAL center. The RH-SPATIAL
data reported (as shown in Fig. 5A). The LH-EXECUTIVE center shows no systematic change in capacity utilization
center displays this capacity utilization profile because with trial difficulty. This is because it is specialized for ac-
harder problems require the establishment of a greater tivating perceptual moves during problem solving. (Recall
number of goals for longer durations of problem solving, that perceptual moves are those that directly place a ball
often in a nested fashion, which imposes a high capac- in its ending position.) The number of direct moves does
ity utilization load. The RH-EXECUTIVE center shows not increase with path length in TOL in this range of path
the same pattern, but for a subtly different reason. Harder lengths. Rather, as path length increases, there is an increase
problems require more goal-driven processing. These goals in the number of strategic moves driven by goals estab-
generate proposed (indirect) moves that compete with the lished in the EXECUTIVE centers. Thus, the RH-SPATIAL
direct moves proposed by the RH-SPATIAL center. The center exhibits the same lack of an effect of trial difficulty
RH-EXECUTIVE center must select between these com- as does the right-hemisphere superior parietal cortex.
peting proposals. The harder a problem, the more proposals
to consider, and the more proposals to consider, the more 5.2. Relation to other accounts of problem solving
resource-consuming is the selection.
The theory of TOL problem solving presented above and
5.1.2. RH- and LH-SPATIAL centers instantiated in the 4CAPS model is both consistent with the
The RH-SPATIAL center is hypothesized to be deeply in- literature and the data reported here. It is also consistent
volved in the perceptual control mode, at least during spatial with, and to some degree synthesizes a prominent connec-
problem solving, and thus specialized for the generation of tionist and prominent symbolic account of problem solv-
perceptual moves. Perceptual moves are generated by com- ing. The connectionist account is Dehaene and Changeux’s
paring the current and ending configurations and proposing (1997) model of TOL problem solving. Their “gesture” and
moves that increase the surface similarity between the two. “operation” levels perform the perceptually driven problem
The perceptual moves that are proposed attempt to place solving implemented by the SPATIAL centers of the 4CAPS
balls in their bin position in the ending configuration, re- model. Their “plan” level establishes goals that modulate
gardless of whether the preconditions of the moves are satis- problem solving at these two lower levels. These goals ef-
fied. For example, a perceptual move could propose moving fectively seize control of problem solving away from per-
a ball into an occupied bin position. ception. Their plan level maps neatly to the EXECUTIVE
The LH-SPATIAL center serves as the spatial workspace centers of the 4CAPS TOL model. The 4CAPS model is also
of the TOL model. The starting and ending configurations consistent with the account of problem solving given by the
become available to the LH-SPATIAL center via perceptual Soar cognitive architecture (Newell, 1990). Soar has mod-
processing that is outside the scope of the model. This cen- eled a breadth of problem solving data using the same basic
ter is responsible for defining the spatial characteristics of elements—problem states, moves, goals, and move selection
the move selected by the LH-EXECUTIVE center to pro- logic—that populate the TOL model. This bodes well for
duce a new configuration. This requires copying the cur- the generality of the TOL model to other problem solving
rent configuration and spatially transforming it by imagining domains. The TOL model also differs from Soar in impor-
the moving of the specified ball to a new bin position. The tant ways. For example, it is not as rigorously top–down and
LH-SPATIAL center is also responsible for the maintenance goal-driven as Soar. On simple problems that require only
of the intermediate configurations generated during problem perceptual moves, the SPATIAL centers perform the bulk of
solving. These representations implicitly record the number problem solving relatively free of executive supervision. In
of moves required to solve the problem, which is the re- Soar, goals structure all problem solving from above. The
quired participant response in the current administration of present TOL model supersedes both the connectionist and
the TOL task. Soar accounts in its ability to model both the brain activa-
The LH-SPATIAL center displays increasing capacity tion and behavioral dimensions of cognition. This ability is
utilization with path length, resembling the increased brain inherited through the 4CAPS cognitive neuroarchitecture.
activation displayed in Fig. 6A. The model’s performance We have not modeled the relationship between indi-
corresponds to the hypothesis that the LH-SPATIAL cen- vidual differences and patterns of brain activation. The
ter serves as the visuo-spatial workspace, subserving the finding of less right DLPFC activation in higher-span par-
imaginal representation of various states of the problem. ticipants could be modeled by assuming that higher span
In particular, it encodes the starting and ending puzzle participants have more resources in right DLPFC. Because
configurations as well as every intermediate configuration capacity utilization is defined as the proportion of available
generated during problem solving. These encodings are resources consumed by a component, this would result in
necessary for the model to perform the task and be able to lower capacity utilizations for the higher-span participants
report the number of moves required for solution. By defini- in the RH-EXECUTIVE center. However, because reading
tion, the number of configurations to be imagined increases span does not measure a single processing ability (WhitneyYou can also read