Respirometric In Situ Methods for Real-Time Monitoring of Corrosion Rates: Part II. Immersion - IOPscience
←
→
Page content transcription
If your browser does not render page correctly, please read the page content below

Journal of The Electrochemical
Society

OPEN ACCESS

Respirometric In Situ Methods for Real-Time Monitoring of Corrosion
Rates: Part II. Immersion
To cite this article: M. G. Strebl et al 2021 J. Electrochem. Soc. 168 011502

View the article online for updates and enhancements.

                                This content was downloaded from IP address 46.4.80.155 on 12/08/2021 at 21:09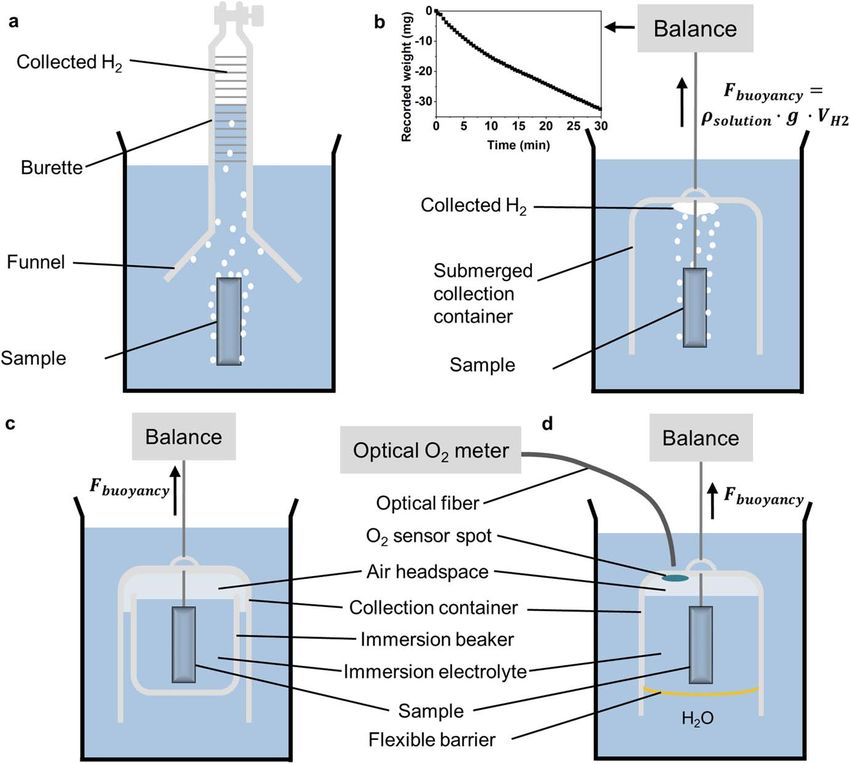
Journal of The Electrochemical Society, 2021 168 011502

                            Respirometric In Situ Methods for Real-Time Monitoring of
                            Corrosion Rates: Part II. Immersion
                            M. G. Strebl,*         M. P. Bruns,           G. Schulze, and S. Virtanen**,z
                            Department of Materials Science (LKO, WW-4), University of Erlangen-Nuremberg, 91058 Erlangen, Germany

              With the aim to open a new window into corrosion processes this paper presents respirometric methods for real-time in situ monitoring of
              corrosion rates under immersion conditions. With these techniques, sensitive, non-destructive corrosion rate measurements are possible on
              basically all metals and alloys. Different methods are presented that enable to monitor HER, ORR or both reactions simultaneously based
              on the amount of evolved H2 or the amount of consumed O2 by volumetric, manometric and sensor-based approaches. Various research
              examples are presented, demonstrating the benefits and limitations of the different approaches. For Mg alloys, besides HER, ORR plays a
              role in the cathodic reactions and a good correlation of the total cathodic charge with mass loss was obtained. H2 dissolution into the
              electrolyte was identified as an important factor. The results obtained for Zn immersion corrosion in intermittent-flow and flow-through
              respirometric experiments suggest that the ORR mechanism leads to the generation of stable H2O2 under these conditions. As a result, the
              effective number of exchanged electrons for one O2 molecule was found to be in between two and four. The here introduced respirometric
              techniques allow new insights into corrosion mechanisms, in addition to enabling real-time monitoring of corrosion.
              © 2021 The Author(s). Published on behalf of The Electrochemical Society by IOP Publishing Limited. This is an open access
              article distributed under the terms of the Creative Commons Attribution Non-Commercial No Derivatives 4.0 License (CC BY-
              NC-ND, http://creativecommons.org/licenses/by-nc-nd/4.0/), which permits non-commercial reuse, distribution, and reproduction
              in any medium, provided the original work is not changed in any way and is properly cited. For permission for commercial reuse,
              please email: permissions@ioppublishing.org. [DOI: 10.1149/1945-7111/abdb4a]

              Manuscript submitted November 20, 2020; revised manuscript received January 12, 2021. Published January 22, 2021. This paper
              is part of the JES Focus Issue on Characterization of Corrosion Processes in Honor of Philippe Marcus.
              Supplementary material for this article is available online

    This paper is the second of a series that describes the use of                   or historical amount of corrosion that has occurred (mass loss,
respirometric approaches in corrosion science. While Part I covered                  off-line solution analysis), other methods are capable of monitoring
techniques to monitor atmospheric corrosion in real-time,1 this part                 the corrosion process in the time domain (LPR, EIS, EN, QCM, in-line
is focused on immersion conditions. In Part III respirometric                        spectrometry). However, to extract reliable corrosion rates with these
methods will be combined with electrochemical measurements and                       methods is not without pitfalls. For example, in PP, significant
the methods will be applied to follow changes of the immersion                       variability of the results comes from the selection of the linear regions
conditions in real-time, directly on the same sample.                                where to perform the Tafel fit. Influence of mixed activation control
    Full immersion conditions are frequently used to study corrosion                 and diffusion control can be an issue,11 as well as contributions of
of metallic materials. One advantage of immersion tests is that the                  ohmic drop12 that are difficult to assess accurately. Additionally, it is
bulk electrolyte facilitates the use of electrochemical techniques to                required to polarize the sample far away from its free corrosion
characterize a corrosion process. The methods employed range from                    potential in order to determine the correct Tafel slopes. This strong
macroscopic electrochemical techniques like potentiodynamic po-                      polarization can lead to changes induced on the sample surface that can
larization (PP), linear polarization resistance measurements (LPR),                  affect the results. The alkalinization related with cathodic reactions can
electrochemical impedance spectroscopy (EIS) and electrochemical                     artificially increase or decrease the dissolution rate. Therefore, it
noise measurements (EN) to localized electrochemical techniques                      can make a difference whether the scan is started at a cathodic
like scanning vibrating electrode (SVET), scanning droplet cell                      potential or at the corrosion potential.13 For Mg, it was found that Tafel
(SDC), and others. Each technique shows different possibilities and                  extrapolation from the cathodic polarization initiated at the corrosion
limitations and a complementary approach is useful to reveal many                    potential provides a good estimate of the corrosion rate while starting
details about the studied corrosion system.2                                         the potential scan at a cathodic potential leads to substantial under-
    Additionally, non-electrochemical techniques are commonly used to                estimation of the corrosion current.14 For Al, cathodic dissolution can
quantify the amount of corrosion that occurs during immersion. This                  occur during the cathodic scan as a consequence of the produced OH–
includes the gravimetric determination of mass loss after removal of the             that attacks the native oxide film.13,15–17
corrosion products with a suitable pickling solution.3 The quartz crystal                The interpretation of data generated with EIS or LPR can be
microbalance (QCM) can be used to monitor mass changes with a high                   challenging as well. A suitable electrical equivalent circuit that
resolution in situ.4,5 Another approach is the detection of metallic cations         represents the correct physicochemical processes of the corroding
released into the immersion electrolyte by solution analysis, e.g. with ion          electrochemical interface is needed for the extraction of a polariza-
chromatography (IC),6 inductively coupled plasma atomic emission                     tion resistance value. The polarization resistance, obtained from
spectroscopy (ICP-AES), or mass spectrometry (ICP-MS). Sophisticated                 fitting EIS data to an equivalent circuit or from LPR measurements,
in-line techniques for both ICP-AES7,8 and ICP-MS9,10 have been                      can be inserted into the Stern-Geary equation to obtain instantaneous
developed that allow for monitoring of time- and potential-resolved                  corrosion rate information. For this however, the Tafel slopes are
elemental dissolution rates. While insoluble species that form a                     another required input that has to be determined with independent
corrosion product film are undetectable by ICP-AES, there are cases                   experiments.18 Changes of these values with time are usually not
where the amount of insoluble ions may be quantified indirectly by a                  considered which makes interpretation of data from the Stern-Geary
mass-charge balance during galvanostatic experiments.8                               method difficult.19 Another issue complicating EIS measurements is
    While some of the methods mentioned above are destructive and                    the intrinsic non-stationarity of a corrosion process that is most
only give information at a distinct point in time (PP) or the cumulative             severe in the time directly after immersing the sample.2
                                                                                         Respirometry is a widespread method used in many research
                                                                                     disciplines to quantify metabolic rates associated with the respiration
                                                                                     of animals,20,21 plants,22,23 tissues,24 cells,25 or microorganisms.26
  *Electrochemical Society Student Member.
 **Electrochemical Society Fellow.                                                   Metabolic processes in a biochemical sense are redox reactions that
  z
    E-mail: virtanen@ww.uni-erlangen.de                                              involve the transfer of electrons from donor molecules (e.g. organic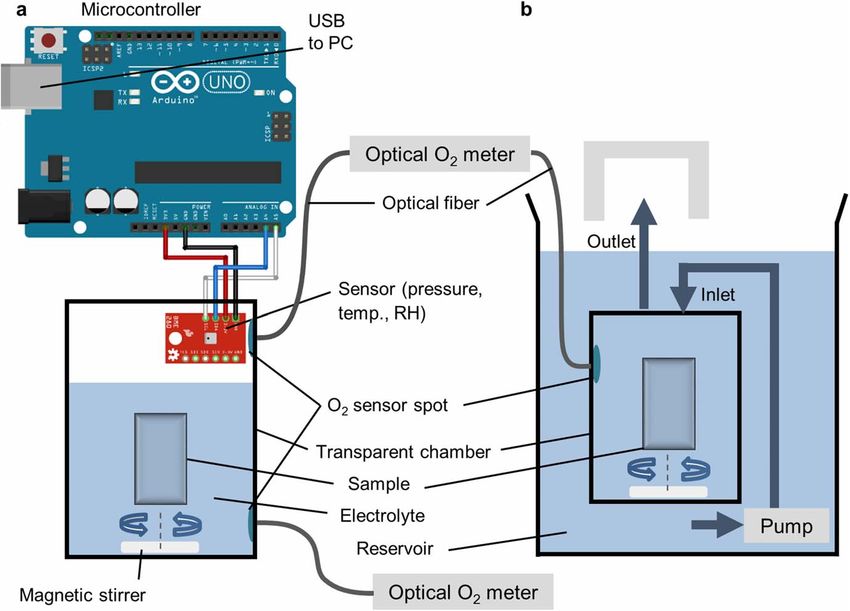
Journal of The Electrochemical Society, 2021 168 011502
compound) to an electron acceptor (e.g. O2) in order to provide the
organism with energy.26 The respirometric principle is based on O2 + 2H+ + 2e- H2 O2 E 0 = 0.67 VSHE [3]
measuring the rate of the reduction reaction associated with this
metabolic conversion process.26 For example, the consumption of O2 H2 O2 + 2H+ + 2e- 2H2 O E 0 = 1.77 VSHE [4]
by a fish in a sealed chamber can be measured to characterize its
metabolism under different conditions.27 In a way, corrosion is a 2H2 O2 2H2 O + O2 [5]
similar redox process that is composed of an anodic metal oxidation
reaction and a cathodic reduction reaction that occur at an equal rate
on the corroding surface. The aim of this paper is to demonstrate that The mechanism of the ORR, which involves several elementary
similar respirometric approaches can be employed to monitor steps and reaction intermediates, has been controversially discussed
corrosion rates under immersion conditions non-destructively and and is still not completely resolved.33 According to a simplified
in real-time by monitoring the rate of the cathodic reactions. reaction scheme,34 the reduction of O2 can progress by two
Different methods to assess the rate of the O2 reduction reaction alternative pathways depending on the electrocatalytic material
(ORR)28–30 or the H2 evolution reaction (HER)14,31,32 of immersed where the reaction takes place.35–37 O2 can be reduced in a direct
samples have been presented before. However, the use of this 4-electron mechanism (Eq. 2) to H2O without any detectable
universal approach, that is applicable in principle to all metals or intermediates. The parallel peroxide pathway includes the reduction
alloys,30 in quantitative corrosion studies remained below its of O2 to H2O2 as an intermediate (Eq. 3), that can be followed by a
potential. This paper gives an overview of the different approaches further reduction of the peroxide (Eq. 4) or by decomposition of two
and additionally presents new methods that enable one to monitor H2O2 molecules via a disproportionation reaction (Eq. 5) to O2 and
ORR, HER or both reactions simultaneously. Furthermore, it is H2O. Alternatively, H2O2 can be transported to the bulk solution.
intended to highlight details in the experimental setups that are Hence, for the ORR, the effective number of exchanged electrons
necessary to avoid typical pitfalls and to get reliable results. The zORR can range between zORR = 2 (incomplete reduction with only
possibility to apply the method to study biodegradable metals in reaction 3) and zORR = 4 (direct reduction or complete reduction
different simulated physiological solutions is shown. Examples of with a combination of reactions 3 + 4 or 3 + 5).37 As a
measurements with different respirometric methods will be pre- consequence, the number of metal ions that can be oxidized by one
sented and are compared with independent mass loss measurements. O2 molecule can vary by a factor of two which contributes
uncertainty to ORR rates calculated from O2 consumption rates.
Respirometric Approach The respirometric measurement approaches discussed in this
work for immersion can be categorized in volumetric techniques,
As described in Part I of this paper series, the measurement manometric techniques or the measurement of partial pressure or
principle of the respirometric method is to monitor the rates of the concentration with a sensor (Fig. 1). In the volumetric approach,
most important cathodic reactions (HER and ORR) based on the changes in gas volume are detected at ambient pressure, while in the
measurement of the rates of O2 consumption or H2 evolution. In the manometric approach changes in pressure are measured in constant
HER protons are reduced to H2 gas (Eq. 1). volume chambers. As opposed to atmospheric corrosion, a bulk
liquid phase is present in immersion conditions. The species
2H+ + 2e- H2 E 0 = 0VSHE [1] dissolved in this phase have to be taken into account, when
determining the rate of consumption of O2 or the rate of production
O2 + 4H+ + 4e- 2H2 O E 0 = 1.229 VSHE [2] of H2 that accompanies a corrosion process. Some techniques that
Figure 1. Classification of respirometric approaches to monitor immersion corrosion kinetics by the measurement principle and the degree of flow. Arrows in
the lower part of the figure visualize the degree of flow through the respirometric chamber for the different measurement approaches. Adapted from Ref. 1.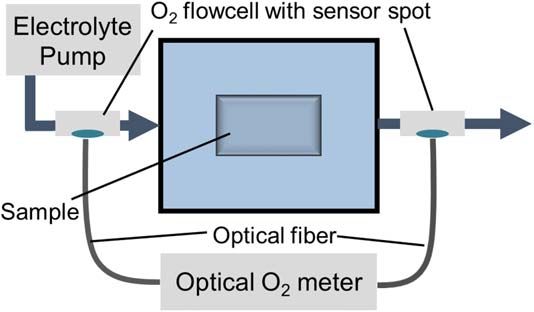
Journal of The Electrochemical Society, 2021 168 011502

will be presented require the presence of a gas headspace above the       can lead to an underestimation of the amount of detected H2. Pre-
liquid phase. The partial pressure of O2 and H2 gas in this phase have    saturation of the electrolyte could resolve this issue for short-term
to be determined and included in the mass balance.                        experiments but is another step that complicates the experiment.
    To prevent depletion of O2 which can occur in prolonged               Moreover, pre-saturation by bubbling with pure H2 gas leads to the
experiments, the concepts of flow-through respirometry20 or inter-         unintended displacement of dissolved O2, while pre-saturation by
mittent-flow respirometry38 can be adapted. Compared with static           electrolyzing chloride containing solutions can lead to pH changes
immersion conditions, a flow cell setup brings new possibilities to        and the generation of reactive chlorine species at the anode which
study corrosion processes. On the one hand, a flowing electrolyte          could influence the corrosion mechanism.44 Figure 2c shows the
enables keeping the exposure conditions constant that would be            schematic of a gravimetric setup with reduced volume of electrolyte
subject to change in a closed system. There, ongoing corrosion can        that was designed in this study to minimize the dissolution of H2 into
lead to changes in the electrolyte composition like the depletion of      the electrolyte. An air headspace separates the electrolyte in contact
dissolved ions or O2, changes in the bulk pH of the electrolyte, or       with the sample from the electrolyte that is necessary for complete
accumulation of dissolved metal ions. On the other hand, a                submersion of the collection assembly. That way, the dissolution of
respirometric flow cell can be used to change the exposure                 H2 is limited to a high extent to the small volume of the immersion
conditions while providing real-time data of the effects on the           electrolyte. As an alternative to the air headspace, the immersion
corrosion rate. Particularly, the electrolyte composition can be          volume can be confined with a flexible rubber barrier (Fig. 2d) that
changed with respect to e.g. chloride concentration. Another              must be able to adapt to volume changes without the build-up of a
application is to study the effect of the addition of different           pressure.
concentrations of inhibitors, or to elucidate the role of amino acids         The gravimetric setup can be used also to monitor samples that
or other organic molecules present in electrolytes that are commonly      show only O2 consumption and negligible HER rate. As the
used to test biodegradable metals in vitro. In this context it is also    dissolved O2 cannot be detected with the buoyancy method, an air
possible to realize a change of the temperature of the experiment to      headspace is required and the consumption of O2 gas from that
values that will be present in the human body. In addition, also the      headspace is monitored by the volume reduction gravimetrically.
effect of the flow rate on the corrosion rate can be of interest for       Because of the gas exchange at the liquid–gas interface, the
biodegradable cardiovascular stents or other applications.                consumption of dissolved O2 by the corroding sample leads to a
    Microbial background respiration, i.e. the consumption of dis-        depletion of O2 also in the gas phase that can be readily detected
solved O2 that is not related to the studied corrosion process has to     with the balance. The addition of a flexible rubber barrier is
be avoided or determined by experiments without a sample. This            necessary for limiting the exchange of dissolved O2 with the
aspect can be critical if solutions are studied that contain nutrients    surrounding solution (Fig. 2d). Monitoring both HER and ORR
for microorganisms. Apart from cleaning and disinfection of the           simultaneously with the volumetric setup is feasible with the
setup, sterilization of the solution or frequent exchange of the          addition of an optical O2 sensor that determines the partial pressure
solution can help to control interference of background respiration.      of O2 in the headspace non-invasively through the vessel wall
Other important factors are the construction material of the              without touching the collection container.
respirometer and its surface area to volume ratio.39 The biofilm               The volume of the collection assembly and the volume of air
formation is also dependent on the temperature40 and pH41 of the          initially present at the beginning of the experiment can be deter-
solution.                                                                 mined from buoyancy considerations as described in a previous
    Electrolytes that contain oxidants other than O2 or water, e.g.       paper.45 To correct for changes in the gas volume that are solely
nitrate, cannot be studied with the presented setups and would require    caused by changes in temperature and atmospheric pressure, these
additional sensors to be analyzed with the respirometric method. Pre-     quantities have to be logged throughout the experiment. The
corroded Fe samples were shown to reduce Fe3+ ions in the rust scale      correction is described in more detail in earlier work.45 Another
as a cathodic process parallel to ORR under atmospheric corrosion         influence on the measurement is the density of the solution that
conditions.42 This implies that data generated with respirometric O2      depends on the amount of dissolved salts and temperature.
consumption measurements on pre-corroded Fe initially after immer-        According to Archimedes’ principle, the change in the volume of
sion should be treated with caution. As the amount of reducible Fe3+      the gas Vgas(t) is directly related to the measured change in the
in the corrosion products is limited, a steady state ORR rate should be   apparent weight of the collection container Wbalance(t) by:
established at some point. Additionally, the evolution or consumption
of other gases not related to corrosion has to be excluded. For                                                Wbalance (t )
                                                                                              Vgas (t ) = -                                    [6]
example, this could be the case for electrolytes supersaturated with                                           g rsolution (t )
HCO3− that can liberate CO2 gas.
                                                                          where ρsolution(t) is the density of the solution and g is gravitational
   Volumetric techniques.—Monitoring HER rates volumetrically             acceleration. The gas volume increases for HER and decreases for
is well established to study, e.g. Mg or Al corrosion.14,15,32 The        ORR and hence, the apparent weight will decrease or increase,
volume of H2 gas evolved from the sample can be measured for              respectively. The pressure of the gas is given mainly by the actual
example with a setup containing a funnel inserted in an inverted          atmospheric pressure patm(t). The hydrostatic pressure of the water
burette, initially filled with electrolyte (Fig. 2a). Gradually, the       column may be neglected for small immersion depths and dilute
electrolyte gets displaced by the collected H2 gas and the volume can     solutions.43 Water vapor occupies part of the volume, so its partial
be obtained from the burette reading. A more sensitive gravimetric        pressure p H2 O (t) has to be subtracted from the atmospheric pressure.
technique (Fig. 2b) was first presented by Curioni14 and further           With ideal gas law, and taking into account the above influences, the
developed by Fajardo and Frankel.43 In this setup, a collection           change in the amount of substance of gas under the collection
container is submerged together with the sample and both are              container can be calculated.45
connected to a balance. A change of the gas volume under
the collection container causes a change in buoyancy that can be                                  (patm (t ) - p H2 O (t )) DVgas (t )
                                                                                         Dn =                                                  [7]
measured as a weight change with the balance. The benefit of the                                                 RT (t )
gravimetric method over the burette setup is that it provides a higher
sensitivity, better time resolution and improved collection efficiency,    Δn(t) will increase in the case of HER and decrease for ORR as a
as also H2 bubbles that stick to the sample are registered.43             cathodic reaction. For mixed HER and ORR the O2 partial pressure
   One possible source of error with these open systems is a loss of      changes Δpo2 (t) can be determined from parallel optical O2
H2 gas by dissolution into the electrolyte and to the ambient air that    measurements in order to determine the amount of consumed O2.
Journal of The Electrochemical Society, 2021 168 011502
Figure 2. Schematic representation of immersion respirometric setups: (a) inverted burette volumetric setup, (b) experimental setup for gravimetric H2
collection, (c) volume reduced gravimetric setup for volumetric respirometric measurements and (d) flexible rubber barrier respirometric setup to separate the
immersion electrolyte from the surrounding solution. With an optical O2 sensor simultaneous monitoring of HER and ORR is possible with setup (d).
Changes in the amount of substance are converted to cathodic concentration of O2 dissolved in the liquid phase can be calculated
charge with Faraday’s law (Eq. 8), where z is the number of from the partial pressure in the gas phase. The solubility of O2 in the
exchanged electrons and F is the Faraday constant. Taking the electrolyte is a function of O2 partial pressure, salinity and
derivative of the charge vs time curve results in the HER or ORR temperature and can be estimated with empirical equations.46 The
current. validity of the equilibrium assumption should be carefully checked
by determining the concentration with a second O2 sensor.26 The rate
of gas exchange between the gas and liquid phase is determined by
DQHER ORR (t ) = Dn H2 O 2 (t ) Dz HER ORR ⋅F [ 8]
the area dimension of the interface which is given by the geometric
dimension of the chamber. One of the most important factors
affecting the exchange velocity of a sparingly soluble gas such as
Manometric technique.—A manometric respirometric approach O2 is the degree of mixing of the liquid phase.47–49 Apart from
to monitor HER and ORR rates simultaneously in immersion acceleration of gas exchange, mixing is also important to ensure that
conditions is shown in Fig. 3a. The sample is immersed in a closed the measured concentration of O2 corresponds to the mean concen-
chamber with a fixed volume with a gas phase above the liquid tration value of the liquid phase.38,39 Gradients in O2 concentration
phase. A combined sensor for pressure, temperature and relative would otherwise lead to incorrect calculations of O2 consumption
humidity (RH) is placed in the gas headspace above the solution to rates.
measure HER rates. The amount of O2 in the gas phase can be
To determine the amount of consumed O2 molecules ΔnO2 (t ) ,
monitored with an optical O2 sensor. The amount of O2 in the liquid
phase can be either measured with a second optical O2 sensor or it besides partial pressure changes in the gas phase DpOgas 2
(t ) , changes
can be assumed that both phases are in equilibrium. Then, the in the concentration of O2 dissolved in the liquid phase DCOliq2 haveJournal of The Electrochemical Society, 2021 168 011502
Figure 3. Schematic representation of immersion experimental setups: (a) simultaneous monitoring of HER and ORR rates with a static, manometric
respirometric method and (b) monitoring of ORR rates with an intermittent-flow respirometric method.
to be considered. The evolution of RH inside the gas volume can be measured
in situ by the RH sensor with the manometric setup. This allows
DpOgas
2 (t ) ⋅ Vgas calculation of the water vapor pressure Δp H2 O (t ) from the saturation
Dn O 2 (t ) = Dn Ogas (t ) + Dn Oliq2 (t ) =
2
R ⋅ T (t ) vapor pressure p Hsat2 O which is a function of temperature (Eq. 11).
+ DCOliq2 ⋅ Vliq [ 9]
pH 2O (t ) = RH (t ) p Hsat2 O [11]
with Vgas and Vliq being the volume of the gas phase and liquid
phase, respectively, and R is the the ideal gas constant. The amount of dissolved H2 can be estimated with Henry’s law:
The rate of H2 evolution is determined by the pressure increase
2 = H ⋅ p H2
CHdiss gas
inside the closed chamber. As shown in the previous part of the [12]
paper, the HER charge can be calculated from the change in the total
pressure inside the chamber Δptot(t) with a combination of ideal gas Here, H is Henry’s law solubility constant, CHdiss
2
is the concentration
law (Eq. 10) and Faraday’s law (Eq. 8). Therefore, the changes in O2 of H2 in the aqueous phase, and pHgas 2 is the partial pressure of H2 in
2 (t ) , water vapor pressure Δp H2 O (t ) and
partial pressure DpOgas the gas phase under equilibrium conditions.
temperature of the gas phase T(t) have to be also taken into account. A conservative estimation for this calculation is to use the actual
The temperature of the experiment should be maintained constant or H2 partial pressure in the gas phase that was provided by the
measured at the position of the gas volume. Accurate temperature pressure increase. Regarding the H2 distribution between gas and
recording is a prerequisite for both the calculation of the amount of liquid phases, significant supersaturation with respect to Henry’s law
gas molecules, as well as for the internal automatic temperature was observed which was attributed to a major resistance to H2
compensation of the optical O2 sensor. transfer from the liquid phase to the gas phase.50 An upper boundary
for the amount of dissolved H2 is given assuming a partial pressure
(Dptot (t ) - DpOgas (t ) - Dp H2 O (t )) ⋅ Vgas of H2 that is equal to the total pressure inside the chamber. This can
Dn H2 (t ) = 2
[10]
R ⋅ T (t ) be rationalized by the fact that the H2 bubbles evolved from the
sample surface are initially pure H2 before they rise up to the gas
Water is virtually incompressible compared to a gas. Thus, a smaller headspace. This means that the solution around these bubbles
gas phase volume inside the chamber leads to faster pressure equilibrates with H2 under a partial pressure close to the total
changes and to an improved detection limit. pressure. The true amount of dissolved H2 will be in between theseJournal of The Electrochemical Society, 2021 168 011502
two scenarios and probably closer to the lower limit. Taking into
account the concentration of O2 and H2 in both phases allows for a
full mass balance. The actual rates of both HER and ORR can be
obtained from the slope of the respective charge curves. Thus, the
total respirometric corrosion rate is the sum of both HER and ORR
rates.
Intermittent-flow ORR Monitoring.—Corrosion systems that
corrode mainly with ORR and not with visible H2 gas evolution
can be monitored by an O2 sensor approach as shown in Fig. 3b. The
consumption of O2 by a sample that is immersed in a completely
filled chamber with a fixed volume of electrolyte is determined, e.g.
with an optical O2 sensor. For very low corrosion rates it might be Figure 4. Flow-through respirometric setup to monitor ORR rates based on
sufficient to use static exposure in a completely closed chamber. the measurement of O2 concentration in a stream of electrolyte before and
However, for higher corrosion rates or prolonged exposure, the level after passing a corroding sample in a chamber.
of O2 in the solution needs to be restored periodically. In inter-
mittent-flow respirometry this is achieved by periodically flushing Another issue to be considered for flow-through measurements is
the chamber with fresh, air saturated solution. The O2 consumption that changes in the corrosion rate on a short time-scale are not
rate can be determined from the slopes of the O2 concentration instantly reflected in the response due to a lag in time and mixing
decrease during each measurement phase of the sawtooth curve problems.21,38 These washout characteristics depend on the ratio of
together with the volume of electrolyte in the chamber. The flow rate to chamber volume of the respirometry system and can
fundamental principles that need to be considered when designing usually be satisfactorily corrected mathematically.21,51 Ignoring the
and carrying out automated intermittent-flow respirometry measure- washout characteristics of the system may result in misinterpretation
ments are accurately described by Svendsen et al.38 For this kind of of the obtained results.20 Decreasing the flow rate would increase the
experiment the chamber does not need to be hermetically closed. signal of the excurrent O2 sensor which increases the sensitivity of
Rather, the chamber has two ports for an inlet and outlet of the measurement. However, it takes more time until the measure-
electrolyte flow. One-way flow valves can be used to avoid the ment responds to changes in O2 consumption rate due to washout.20
exchange of O2 with the surrounding reservoir bath. The same Systems that corrode mainly with HER as a cathodic reaction can
function can be provided by inlet tubing of sufficient length and by be monitored in a flow-through cell with a gravimetric H2 collection
designing the outlet as an overflow that is positioned above the liquid experimental setup similar to the one presented by Han et al.52 The
level of the electrolyte reservoir bath.27 The flush pump can be H2 gas bubbles evolved from the corroding sample in a respirometric
triggered automatically with a given time interval or when a defined chamber are transported with the flow of electrolyte. The flow outlet
critical O2 concentration is reached in the chamber. Again, mixing of is directed under a submerged collection container that detects the
the solution is important in order to avoid concentration gradients. amount of H2 gravimetrically with a balance. The collected H2 gas
Mixing can be achieved by stirring the solution or by using a pump exerts a buoyant force that can be monitored as a change in the
inside the chamber, or in a separate recirculation loop.38 In the case apparent weight of the collection container. Care must be taken that
of a separate recirculation loop, the total liquid volume comprises the bubbles are not retained in bends or junctions. Because the H2 exits
chamber volume plus the volume in the recirculation loop. What the tubing discontinuously as discrete bubbles, the weight curve
should be kept in mind is that the degree of agitation also influences shows a step-like course. What must be kept in mind is that H2 gas is
the corrosion rate. Stirring the solution increases the rate of soluble in water. Therefore, depending on the flow rate, much of the
diffusional mass transport of O2 by decreasing the thickness of the generated H2 is dissolved and hence not detected with the gravi-
Nernst diffusion layer. metric measurement.
Gas bubbles inside the chamber should be avoided as they Combining both flow-through approaches to monitor HER and
provide a possible source or sink for O2. Therefore, the outlet should ORR simultaneously is not advisable because the evolved H2 gas
be positioned on the topmost part of the chamber and designed in a takes up O2 from the solution. Even if no O2 is consumed by
way to facilitate the removal of gas during flush phases. If the corrosion the second O2 sensor will detect a lower amount of
fountain of water from the overflow is not sufficient to hold the O2 dissolved O2 in the excurrent stream, thus, suggesting ORR activity
concentration level of the reservoir close to saturation, the reservoir that is not real.
bath can be aerated with an air pump. Possible background O2
consumption by microbial activity can be measured in a parallel Experimental
chamber without sample that is periodically flushed with the same Materials, sample preparation and electrolytes.—Die cast high
solution as the sample chamber. purity Mg alloy AM50 and AZ91 plates with a thickness of 2 mm
were supplied by DGS Druckgusssysteme AG, Germany. High
Continuous flow-through techniques.—Another approach is to purity AZ31 sheet material was obtained from MgF Magnesium
use a continuous flow of electrolyte that passes the corroding sample Flachprodukte GmbH, Germany. Zn foil (0.125 mm thickness,
in a respirometric chamber (Fig. 4). The concentration of dissolved purity 99.99%, typical analysis ppm: Fe 19, Cd 19, Pb < 40,
O2 in the electrolyte is measured in the incurrent (COin2 ) and excurrent Cu < 50) was obtained from Advent Research Materials Ltd.,
(COex2 ) stream. The rate of O2 consumption can be calculated from the England. Specimens were prepared by cutting or sawing and a hole
concentration difference together with the flow rate V and converted was drilled to attach a nylon string. The sample surface was prepared
to a current with Faraday’s law: by grinding to 1200 grit with SiC paper and cleaning with ethanol.
The composition of the immersion electrolytes can be found in
IORR = (COin2 - COex2) ⋅ V ⋅ z ORR ⋅ F [13] Table I. Dulbecco’s Modified Eagle’s Medium (DMEM) is a cell
culture medium that is frequently used to assess the corrosion
The flow rate is an important parameter that should be accurately behavior of biodegradable metals in vitro. Besides a 0.1 M NaCl
controlled or measured. Sensor drift can be an issue that impairs solution, tests were also carried out in inorganic DMEM without
oxygen readings, especially if two sensors are used. This sensor- NaHCO3. This solution was prepared by adding only the inorganic
based error can be reduced by utilizing a valve system that allows salts of the DMEM cell culture medium and leaving out the organic
the same probe to sample both streams.38 constituents. Additionally, DMEM without NaHCO3, that containsJournal of The Electrochemical Society, 2021 168 011502 Table I. Electrolyte composition in mg l−1. A detailed concentration overview of the substances contained in the used DMEM electrolyte can be found in the literature.53 Electrolyte NaCl KCl MgSO4 •7H2O CaCl2 NaH2PO4 •H2O Fe(NO3)3 •9H2O Amino acids, vitamins, phenol red Glucose 0.1 M NaCl 5844 0 0 0 0 0 no 0 Inorganic DMEM w/o NaHCO3 6400 400 200 200 125 0 no 0 DMEM w/o NaHCO3 6400 400 200 200 125 0.1 yes 1000
Journal of The Electrochemical Society, 2021 168 011502

all organic constituents like amino acids, vitamins and glucose, was    experiments, a LuminOx LOX-02-S optical O2 sensor (SST Sensing,
prepared from powder medium (T 041, Biochrom) by adding high-           UK) was used to measure gas phase O2 partial pressure and total
purity water without sterile filtration. DMEM media are usually          pressure. This sensor is only applicable for gas phase O2 monitoring
buffered with the bicarbonate/CO2 buffer system. In this work,          but showed a comparable performance to the PyroScience sensor.
NaHCO3 was not added because of possible interference of CO2 gas        Since no RH measurement is possible with the Luminox sensor, the
evolution with the respirometric method. The initial pH of the three    average RH-time profile of several comparable BME 280 measure-
solutions was not adjusted to the physiological value of 7.4 but was    ments was used in this case. Mixing of the liquid phase was provided
ca. 5.8 for 0.1 M NaCl and 5.2 for the DMEM electrolytes.               by a magnetic stirrer at 200 rpm. The Arduino microcontroller read
                                                                        out both the BME280 sensor and the optical O2 sensors and the
    Gravimetric setups for volumetric corrosion rate monitoring.—       results were returned in a comma separated format. The microcon-
To measure changes in the gas volume gravimetrically with the           troller was connected to a computer and the CoolTerm terminal
configuration shown in Fig. 2b, the sample was attached to the hook      software was used to capture the data to a text file. In addition, a live
of a collection container fully made of glass. A thin, monofilament      plotter was developed that enables one to analyze and visualize the
fiber was used to attach the beaker to the balance in order to measure   data in a real-time graph both on the measurement computer and
changes in the buoyant force exerted by the changes in gas volume.      remotely from anywhere over the internet. The volume of the
For more accuracy, it is important to fully submerge the collection     chamber was determined by weighing the amount of water necessary
setup. Otherwise, possible evaporation of electrolyte would lead to     to completely fill the chamber. The volume of the immersion
partial emergence of the setup which would cause the measured           electrolyte was also determined by weighing. The volume of the
buoyant force to decrease. A syringe with a bent plastic tube was       gas phase was calculated from the chamber volume minus the
used to initially remove the air under the collection container. The    volumes of liquid phase, sample, sensor and stir bar. Imaging of
temperature and atmospheric pressure were logged during the             the surface during exposure was carried out with a USB microscope
experiments in order to correct for the influences on the gas volume.    PCE-MM 400 in order to construct a time-lapse video of the
    The volume-reduced gravimetric setup as in Fig. 2c was              corrosion progress.
constructed from a smaller glass beaker containing the immersed
sample with a defined amount of corrosive electrolyte. This beaker           Intermittent-flow ORR monitoring setup.—A PyroScience op-
was covered by a second, inverted beaker that collects the evolved      tical O2 sensor was used to monitor the concentration of dissolved
H2 gas. While both glass beakers were connected mechanically, a         O2 in a chamber completely filled with electrolyte, i.e. without gas
small air headspace separated the immersion electrolyte from the        headspace. To restore the level of O2, the chamber was periodically
outer electrolyte where the whole assembly was submerged in. A          flushed by pumping fresh aerated solution from an outer electrolyte
minimum and maximum amount of dissolved H2 was calculated               reservoir. The electrolyte in the reservoir bath was air saturated at
using the actual H2 partial pressure in the gas phase and the total     the beginning of the experiment. The solution exiting the chamber
pressure of the gas phase, respectively, using Henry’s law and a        through an overflow was in contact with air before flowing back to
Henry constant of 7.7 · 10−6 mol/(m3Pa).54                              the electrolyte reservoir and was thereby reaerated. The flush pump
    To demonstrate real-time HER monitoring with the different          was triggered automatically by an Arduino microcontroller via a
gravimetric setups, Mg alloys AZ31, AM50 and AZ91 were exposed          relay module that switches power on or off. A flush phase of 30 s
in 0.1 M NaCl for 48 h. The experiments were repeated 2 to 3 times      every 30 min was used in most experiments.
for each alloy and setup. After gravimetric measurements, the               The O2 consumption rate was extracted from the slopes of the
corroded sample was removed, and mass gain and mass loss                sawtooth O2 concentration curves. As no rate could be determined
measurements were carried out by cleaning with 200 g l−1 CrO3           during the flush phase, it was assumed that the corrosion rate from the
solution. After the experiment, HNO3 was added to the immersion         previous measurement phase persisted also during this period. The
solution to dissolve precipitated corrosion products and the solution   cumulative amount of consumed O2 was obtained by integrating the
was filled up with high purity water (18.2 MΩcm) to make 1000 ml.        rate curves. The cumulative amount of consumed O2 was compared
After further dilution the solution was analyzed with IC (Metrohm       with the amount of corroded Zn obtained from mass loss in order to
883 Basic IC plus) to determine the concentration of Mg2+ ions. The     calculate the number of exchanged electrons zORR in the ORR.
IC device was equipped with a Metrosep C4 − 150/4.0 separation              To test for background respiration, the O2 consumption was
column and the eluent was water with 0.7 mmol l−1 dipicolinic acid      measured after the experiments when the sample was removed. In
and 1,7 mmol l−1 HNO3. The amount of Mg2+ that remained on the          DMEM the background O2 consumption was directly monitored
sample was estimated from mass gain and mass loss values,               throughout the experiment with a second chamber without sample.
assuming Mg(OH)2 as the dominant corrosion product.                     Both chambers were flushed by the same pump using a junction and
                                                                        the flush time was increased to 2 min.
    Static setup for manometric corrosion rate monitoring.—The
static setup for simultaneous HER and ORR monitoring is similar to          Continuous flow-through ORR setup.—An ORR continuous
the manometric setup presented in Part I of the paper series. In this   flow-through setup was constructed using two PyroScience O2 flow
setup, the sample was immersed in an electrolyte inside a gas-tight,    cells with integrated contactless optical O2 sensor spots that were
transparent chamber. A DURAN® laboratory glass bottle was used          read out by two Piccolo2-OEM optical O2 meters. The sensors were
as a chamber and it was sealed with a DURAN® bromobutyl rubber          located at the inlet and outlet of a respirometric chamber of
stopper. In this work, the chamber was submerged in a water bath        approximately 25 ml volume that contained the sample. A peristaltic
that was not temperature controlled in order to stabilize the           pump supplied a continuous stream of electrolyte. The flow rate was
temperature. A Bosch BME 280 combined sensor for absolute               determined gravimetrically and was found to be 32.6 ml per minute.
pressure, temperature and relative humidity was placed in the air
headspace of the vessel. The electronic components of the sensor           Mass loss measurements.—After exposure, to remove the
breakout board were protected from condensation by a coating with       corrosion products, the samples were immersed in a pickling
a two-component epoxy and additionally wrapped with Teflon tape.         solution (Zn: 250 g l−1 glycine solution, Mg alloys: 200 g l−1
The sensor was connected via a gastight feedthrough to an Arduino       CrO3) according to ISO 8407.3 The amount of metal loss was
Uno microcontroller. The O2 partial pressure was measured both in       determined by weighing the samples before exposure and after
the liquid phase and in the gas phase with two Piccolo2-OEM optical     removal of the corrosion products with a balance (Mettler Toledo
O2 meters with contactless sensor spots (PyroScience, Germany) that     XA205DU). The value was converted to an anodic charge using
were glued to the inner wall of the transparent chamber. In some        Faraday’s law.
Journal of The Electrochemical Society, 2021 168 011502
Figure 5. HER charge curves determined from gravimetric H2 collection
measurements of different Mg alloys immersed for 48 h in different volumes
of 0.1 M NaCl solution. The measurements of replicate samples are
normalized to the sample area, averaged and plotted together with the
standard deviation. Although the 50 ml samples actually corroded less
compared to the 500 ml samples, more H2 was detected because of a
reduced influence of H2 dissolution (see Fig. 7).
Results and Discussion
Gravimetric volumetric experiments.—The influence of tem-
perature and ambient pressure on the baseline of gravimetric
experiments was already reported before. After correcting for
environmental fluctuations, the gravimetric method exhibits a good
reproducibility and is sensitive enough to monitor HER rates in the
low μA range. Gravimetric measurements of three different Mg
alloys were carried out with the regular gravimetric setup (Fig. 2b) to Figure 6. Comparison of real-time HER current density of (a) AZ31,
monitor HER rates in real-time with the samples being immersed in (b) AM50 and (c) AZ91 samples in 0.1 M NaCl obtained with gravimetric
setups of different surface area to electrolyte volume ratios. Average curves
500 ml of 0.1 M NaCl. Additional measurements with the volume of multiple replicate samples are shown together with the standard deviation.
reduced gravimetric setup depicted in Fig. 2c were carried out to test Note that the curves show only H2 detected by the balance and are not
the influence of the immersion electrolyte volume to surface area on corrected for dissolved H2. A comparison with mass loss and the estimation
the corrosion rate and on the amount of dissolved H2. of the contribution of H2 dissolved in the liquid phase is given in Fig. 7.
From the gravimetric results shown in Fig. 5 it can be seen that
the corrosion rate decreases with an increase in the amount of Al in
the alloy, with AZ91 samples evolving the lowest amount of H2. A
similar trend of decreasing global corrosion rate with increasing Al
content was also observed by Bland et al.55 While the microstructure
of AZ31 is characterized by α-Mg with Al-Mn intermetallic
particles, AM50 and AZ91 contain a β-Mg17Al12 second phase as
well as eutectic α + β. These intermetallic phases in Mg alloys act
as cathodes. Therefore, they may initiate microgalvanic corrosion in
the surrounding alpha matrix and lead to higher extent of localized
attack.55 On the other hand, the β-phase can act as a barrier for the
lateral propagation of filiform corrosion fronts.56 While the β-phase
is absent in AZ31, its volume fraction increases from AM50 to
AZ91. Another influence that determines the corrosion rate of
Mg–Al alloys is the Al content in α-Mg.57 Consequently, the trend
of increasing corrosion resistance might be explained by a higher
Al content in the α-phase and the increasing barrier effect of the
β-phase.
From the slope of the charge curves the real-time HER rate was
calculated as shown in Fig. 6. For AZ31, a strong increase in
corrosion rate at the beginning of the 500 ml experiments was
observed. Parallel optical imaging of the surface revealed that the
increase in HER rate coincides with an increase in the number of
active corrosion fronts that propagate across the sample. This
behavior is diminished for the lower electrolyte volumes. As with
Figure 7. Comparison of the total consumed charge after 48 h of immersion
AM50 and AZ91, the corrosion rate of AZ31 in the 50 ml and 13 ml in 0.1 M NaCl as determined by gravimetric HER monitoring, solution
setup shows a decline with immersion time. This is probably due to a analysis for dissolved Mg2+ ions with ion chromatography, and mass loss.
faster increase of the solution pH that facilitates the precipitation of The amount of Mg2+ in the corrosion film was estimated from mass gain and
Mg(OH)2 on the sample surface and leads to an increased mass loss.Journal of The Electrochemical Society, 2021 168 011502
Figure 8. Gravimetric experiment of Zn corrosion in 0.1 M NaCl with
simultaneous O2 sensor measurement using the setup in Fig. 2d.
protectiveness against corrosion. Thus, the surface area to electrolyte
volume modifies the corrosion mechanism that occurs as well as the
total amount of corrosion.
Apart from the activation of corrosion fronts at the beginning of
AZ31 corrosion, the HER rates recorded with the 50 ml setup seem
to be higher compared to the 500 ml experiments, also for AM50 and
AZ91. That this interpretation is slightly misleading can be
explained by comparing the total amount of consumed HER charge
after 48 h immersion in 0.1 M NaCl with the mass loss method
(Fig. 7). Comparing the amount of H2 collected with the 500 ml
setup with mass loss reveals a substantial discrepancy. For this setup,
HER monitoring with AZ31 detected only 44% of the mass loss
charge and less than 25% in the case of AM50 and AZ91. The
discrepancy was attributed to the loss of gaseous H2 by dissolution
into the solution. When H2 is dissolved it does not exert a buoyant
force anymore and is thus not detected by the gravimetric method.
An alternative explanation that could contribute to the discrepancy
with mass loss could be that ORR plays a partial role in the corrosion
mechanism. Looking at the results with 50 ml and 13 ml electrolyte
volume show that the correlation of the amount of detected H2 to the Figure 9. Simultaneous HER and ORR monitoring of AZ91 immersed in
amount of mass loss gets much closer compared to the 500 ml setup. 0.1 M NaCl in the manometric respirometric setup: (a) raw data obtained
from the sensors, (b) changes in the number of H2 and O2 in gas and liquid
Samples exposed in the volume reduced gravimetric setups show a
phase, and (c) HER, ORR and total respirometric charge and current density.
lower overall amount of corrosion as determined by mass loss for all
three Mg alloys. However, more H2 gas evolution is detected for the
50 ml experiments. This implies that, with the 500 ml setup a big of electrolyte by far exceeds the amount of H2 gas detected in the
amount of H2 gas is not detected because of dissolution of H2 into experiments. This makes it difficult to estimate the contribution of
the electrolyte. dissolved H2 for this setup without additional mass loss tests.
To further assess the issue of H2 dissolution, two types of Conversely, the influence of possible H2 dissolution is limited in
dissolved H2 estimations were performed with Henry’s law as shown the volume reduced experiments. As a consequence, more H2 is
in Fig. 7. The values denoted with H2max detected and it is possible to give a good estimate of the amount of
liq are HER equivalent charge
dissolved H2 with Henry’s law. This shows that the effect of
values that represent the amount of H2 dissolved in the liquid phase
dissolution of H2 should be considered especially for low corrosion
that was calculated assuming that the solution is in equilibrium with
rates and high volume of electrolyte. More sensitive and correct
a gas phase of pure H2 with a pressure equal to the atmospheric
measurements of HER rates are possible with a volume reduced
pressure. This could be the case for H2 collected in the 500 ml setup
gravimetric setup as shown in Figs. 2c, 2d. This comes at the
where there is no gas headspace. For the volume reduced experi-
expense of a possible modification of the corrosion mechanism due a
ments with a gas headspace, the H2min liq values were calculated faster alkalinization with higher surface area to volume ratio setups.
assuming that the concentration of dissolved H2 is in equilibrium Regarding the amount of corrosion as determined by solution
with the actual partial pressure of H2 in the headspace. Since the gas analysis with ion chromatography it can be observed that this
evolved from the samples is pure H2 at atmospheric pressure before method largely underestimates the amount of corrosion that has
it reaches the headspace, the H2max liq value could be a plausible occurred. This can be rationalized with the Mg2+ ions that form a
scenario also for the headspace setup. The true H2 solubility could be corrosion product film on the sample surface and that are not
ascertained with a sensor for dissolved H2 in future work. The results registered by solution analysis. The amount of corrosion products
show that the amount of H2 that could potentially dissolve in 500 ml that remained on the sample were estimated with mass gain andJournal of The Electrochemical Society, 2021 168 011502
measurement approaches in the beginning of the experiment, a very
good agreement in the ORR rate was found after one day.
One possible source of error is that the optical fiber was not
tightly attached to the sensor spot in order not to disturb the
gravimetric measurement. The exact position of the optical fiber
on the sensor spot could influence the measured O2 pressure. In
addition, the O2 sensor measurement is not independent from the
gravimetric measurement since any volume change also affects the
O2 partial pressure. To study the influence of ORR in Mg alloy
immersion in more detail, it was decided to carry out tests in the
constant gas volume manometric setup.
Static manometric experiments.—To demonstrate simultaneous
HER and ORR monitoring with the static manometric setup, the
results of a 90 h immersion experiment carried out with AZ91 in
0.1 M NaCl is shown. The raw data recorded with the different
sensors can be seen in Fig. 9a. From the changes in O2 partial
pressure in the gas and liquid phase, total pressure, temperature and
relative humidity it is possible to calculate the change in the number
of H2 and O2 molecules in the gas phase and liquid phase (Fig. 9b).
To calculate the number of H2 in the gas phase, the total pressure
change is corrected for changes in water vapor pressure and changes
in O2 partial pressure. The amount of H2 dissolved in the liquid
phase is estimated with Henry’s law using the actual partial pressure
of H2 in the gas phase. In this special long-term experiment, besides
evolving H2, AZ91 also consumes a considerable amount of O2. This
can be seen from the decrease in O2 partial pressures and in the
decrease in the total number of O2 molecules. In Fig. 9c, the change
in the total number of moles of H2 and O2 is converted to an HER
and ORR charge assuming zORR = 4. The derivative of the charge
curves results in real-time current density for the two cathodic
reactions. This demonstrates that real-time monitoring of both HER
and ORR rates is possible simultaneously.
Figure 10. HER (a) and ORR (b) charge curves of Mg alloys in 0.1 M NaCl, Looking at the comparison of the total respirometric charge with
inorganic DMEM w/o NaHCO3 and DMEM w/o NaHCO3 measured with mass loss reveals an excellent correlation. The share of ORR in the
the manometric respirometric setup. Dissolved H2 was considered in the cathodic charge for this particular long-term experiment was over
HER charge with a correction based on Henry’s law using the actual partial 40%. A special phenomenon that was revealed by real-time
pressure of H2 in the gas phase. monitoring in this experiment is that the corrosion rate and
especially the ORR rate increased again after an initial period of
mass loss measurements and assuming that Mg(OH)2 was formed as declining corrosion rate. Parallel optical imaging of the corroding
the dominant corrosion product. From Fig. 7 it can be seen that this surface (see time-lapse video in supporting information) demon-
estimation gives a good fit of the amount of soluble and insoluble strates that this event coincides with a branching and multiplication
Mg2+ ions with mass loss, especially for AZ31. The remaining of active corrosion fronts. It can only be speculated that this
discrepancy with AM50 and AZ91 can be explained with the activation of corrosion fronts was triggered by an increased cathodic
increasing amount of corroded Al3+ ions that were not measured activity that supplied the current necessary to drive more anodic
with IC and that were not considered with the corrosion product fronts.58 Since the effect of a second corrosion rate maximum was
composition assumption. Compared with the 500 ml samples, the not reproducible on AZ91, it is possible that a special feature in the
lower electrolyte volume samples exhibited proportionately more microstructure that results from the inhomogeneous casting process
Mg2+ ions in the film, which supports the notion of increased was responsible. Subsequently, many of the corrosion fronts came to
protectiveness of the corrosion product film under these conditions. a stop which leads to decreasing of the HER and ORR rates.
With only gravimetric HER measurements, one uncertainty Interestingly, afterwards the deposition of a white precipitate can be
remains regarding the role of the ORR in Mg alloy corrosion under observed on parts of the sample and no ORR activity was detected
immersion conditions. In Part I of this paper series, for atmospheric anymore. It is possible that the precipitates blocked sites where the
corrosion, it was found that ORR can contribute to the cathodic ORR was occurring.
reactions on Mg alloy corrosion. Already with the gravimetric In general, the partial pressure of O2 in the liquid phase tends to
results in conjunction with mass loss it can be stated that ORR has follow the course of partial pressure in the gas phase, which means
a minor influence during 48 h immersion. The addition of an optical that gas exchange is fast enough and the concentration in both
O2 sensor that measures O2 partial pressure in the headspace of the phases is in equilibrium. Removal of O2 from the liquid phase can be
gravimetric setup would be a possibility to measure both HER and observed in the parts of the experiments with high H2 evolution rate.
ORR simultaneously. This measurement configuration was tested on H2 gas takes up dissolved O2 and leads to a degassing of the
Zn immersed in 0.1 M NaCl using the setup in Fig. 2d and the results surrounding solution. Eventually though, the bubbles will rise to
are shown in Fig. 8. Under neutral conditions, ORR is the dominant the gas phase and the solution will again reach equilibrium with the
cathodic reaction of Zn corrosion. The ORR leads to the removal of concentration in the gas phase. In the gas-tight chamber, O2 cannot
O2 from the headspace that can be detected with both the gravimetric escape the closed system, unless it is really consumed by corrosion.
measurement and the O2 sensor. The concentration changes of O2 in Comparing the changes in the moles of O2 in gas and liquid phase, it
the liquid phase were not monitored in this experiment. Because the becomes obvious that most changes occur in the gas phase. In a
electrolyte was stagnant, the corrosion rate was extremely low in this stirred solution and for the ratio of gas to liquid volume used in this
experiment. While there is some deviation in the signals of the two experiment, it seems that one O2 sensor that measures in the gasJournal of The Electrochemical Society, 2021 168 011502
Figure 11. Comparison of the results of the manometric respirometric
experiments with mass loss after 48 h immersion. The relative contribution
of QHER/Qtot and QORR/Qtot are given in percent in addition to the values of
Qtot/QML in percent.
Figure 13. Intermittent-flow respirometric determination of O2 consumption
of Zn immersed in 0.1 M NaCl. The O2 concentration curve shows a
sawtooth shape that is the result of alternating 30 min measurement periods
and 30 s flush periods. The O2 consumption rate was extracted from the
slopes of the measurement periods.
AZ91 is less susceptible to corrosion in 0.1 M NaCl compared to
AZ31. This trend that was already found with the gravimetric
measurements can be confirmed with the manometric method. In
addition, with the manometric setup it is possible to quantify the
amount of O2 that was consumed due to the ORR in real-time. For
48 h immersion, the influence of ORR is not as pronounced as in the
90 h experiment in Fig. 9. However, a small but steady O2
consumption can be resolved with the O2 sensors for all alloys
Figure 12. Simultaneous HER and ORR monitoring of a hot-dip galvanized and solutions.
steel sample with scratches and cut edges immersed in 1 M NaCl solution. A Comparing the influence of the different electrolytes for AZ31, it
time-lapse video can be found in the supporting information. follows that the HER and ORR rates increase in the order: inorganic
DMEM without NaHCO3 < 0.1 M NaCl < DMEM without
phase would to be sufficient to monitor O2 consumption. Since the NaHCO3. This can be explained, on the one hand, with the formation
changes in the moles of O2 in the liquid phase are not very of corrosion product layers with the ions present in the DMEM
pronounced, this contribution could be calculated with adequate medium. For example, it is commonly observed that Mg in
accuracy from the O2 partial pressure in the gas phase. simulated physiological solutions forms an amorphous layer of
More manometric experiments of AZ31 and AZ91 Mg alloys (Mg,Ca)x(PO4)y(CO3)z(OH)i that can increase the protectiveness
were carried out in 0.1 M NaCl, in a solution that contained the afforded to the substrate.59–61 On the other hand, it seems that amino
inorganic parts of DMEM without NaHCO3 and in DMEM without acids and the other organic compounds present in the DMEM
NaHCO3 for an exposure time of 48 h. The resulting averaged HER electrolyte have an accelerating effect on the corrosion rate of AZ31.
and ORR charge curves of multiple replicate samples are depicted in This could be explained by the chelating interaction of the organic
Fig. 10. NaHCO3 was not added to the DMEM electrolyte because molecules with Mg2+− or Ca2+− ions that can encourage Mg
of possible interference with the pressure measurements by out- dissolution and retard the formation of insoluble surface layers.62
gassing CO2. DMEM is a cell culture medium that contains organic A comparison of the HER, ORR and total respirometric charge
molecules such as amino acids, vitamins and glucose as nutrients for with mass loss charge for the different samples is carried out in
cell growth. Unfortunately, this medium favors also the growth of Fig. 11. A very good agreement between the total respirometric
microorganisms and their metabolism can lead to considerable charge and mass loss was found. This implies that reliable real-time
background respiration. The influence of background respiration monitoring is possible with the manometric respirometric method
was determined by parallel experiments without a sample and by and that the cumulative amount of HER and ORR charge gives a
testing the solution at the end of the experiment with the sample good measure for the amount of corrosion that has occurred. In
removed. It was found that the high pH that evolved due to Mg general, the contribution of ORR to the total cathodic charge is
corrosion effectively supressed the growth of microorganisms for the around 10%. These findings are in line with recent studies that
duration of the experiment, which is in accordance with literature.41 provide evidence for the partial role of ORR in Mg corrosion underYou can also read