Delinquent Development Among eArly-onset offenDers identifying and Characterizing trajectories Based on frequency Across types of offending
←
→
Page content transcription
If your browser does not render page correctly, please read the page content below
876306
research-article2019
CJBXXX10.1177/0093854819876306Criminal Justice and Behaviorvan Hazebroek et al. / Delinquent Development Among Early-Onset Offenders
Delinquent Development Among Early-
Onset Offenders
Identifying and Characterizing Trajectories Based on
Frequency Across Types of Offending
Babette C. M. Van Hazebroek
Leiden University
Arjan A. J. Blokland
Netherlands Institute for the Study of Crime and Law Enforcement
Leiden University
Hilde T. Wermink
Jan W. De Keijser
Leiden University
Arne Popma
Amsterdam University Medical Center
Lieke Van Domburgh
Amsterdam University Medical Centers
Intermetzo-Pluryn
Early-onset offending is generally recognized as a risk factor for persistent criminal behavior. However, variation in long-
term delinquent development among early-onset offenders remains rather underexplored and poorly understood. We, there-
fore, used multitrajectory modeling to identify distinct subgroups of early-onset offenders (n = 708) based on the frequency
of offending across several types of offenses up to age 25. We used multinomial regression analysis to characterize subgroups
on gender, ethnicity, and childhood neighborhood characteristics. Six offender subgroups could be distinguished in our data:
nonrecidivists (51%), sporadic recidivists (25%), and low-rate (8%), moderate-rate (10%), high-rate adult-peaked (3%), and
high-rate adolescence-peaked recidivists (3%). Males, minorities, and children from disadvantaged neighborhoods were more
likely to follow re-offending trajectories characterized by increased levels of property crime, vandalism, and violent and
AUTHORS’ NOTE: We thank the Research and Documentation Centre of the Dutch Ministry of Justice and
the Dutch Public Prosecutors Office for facilitating access to the data and providing advice for their use. The
author(s) disclosed receipt of the following financial support for the research, authorship, and/or publication
of this article: This study was supported by the municipalities of Utrecht and Amersfoort, the Rotterdam met-
ropolitan region, and the province of Utrecht; the Kinderpostzegels Nederland Foundation. Further financial
support was provided by The Netherlands Organization for Scientific Research (Grant 451-17-018), and by a
center grant from Leiden University. Correspondence concerning this article should be addressed to Babette
C. M. van Hazebroek, Department of Criminology, Leiden University, Steenschuur 25, 2311 ES, Leiden, The
Netherlands; e-mail: b.c.m.van.hazebroek@law.leidenuniv.nl.
CRIMINAL JUSTICE AND BEHAVIOR, 201X, Vol. XX, No. X, Month 2019, 1–24.
DOI: 10.1177/0093854819876306 ogdr/.oi/p:stht
Article reuse guidelines: sagepub.com/journals-permissions
© 2019 International Association for Correctional and Forensic Psychology
1
2   Criminal Justice and Behavior

sexual offenses. Findings are discussed in relation to criminological theory, and recommendations are made for future life-
course criminological research.

Keywords:    offending trajectories; early-onset offenders; life-course criminology; multitrajectory modeling

E    arly-onset offenders—those offenders who start before the age 12—are at high risk of
     developing persistent criminal behavior across the life-course (Loeber & Farrington,
2000; Loeber, Slot, van der Laan, & Hoeve, 2008; Snyder, 2001). Childhood-onset offend-
ers are 2 to 3 times more likely to become chronic offenders than youth who start offending
in adolescence (Loeber, Farrington, & Petechuk, 2003; Moffitt, Caspi, Harrington, & Milne,
2002). Early-onset offenders also tend to engage in more serious types of offending, includ-
ing violence (Loeber et al., 2003).
   Despite their elevated risk of becoming persistent offenders, a substantial portion of
early-onset offenders desists from crime before reaching adulthood (Moffitt, Caspi, Dickson,
Silva, & Stanton, 1996; Stouthamer-Loeber, Loeber, Stallings, & Lacourse, 2008). In fact,
only half of all children displaying antisocial and offending behavior during childhood per-
sist in offending in adulthood (Moffitt et al., 2002). Heterogeneity among early-onset
offenders poses a challenge to policy-makers. Although intervening at an early age may
seem necessary to prevent further escalation into chronic offending, unnecessary interven-
tion resulting from false-positive identification of high-risk youth should be avoided. Apart
from being cost-ineffective, excessive interventions and potential stigmatization may even
be harmful (Hill, Coie, Lochman, & Greenberg, 2004). At present, however, identification
of would-be chronic offenders is hampered by a lack of knowledge on differential re-offense
patterns of early starters and factors associated with distinct delinquent pathways.
   Extant studies aimed at identifying distinct offending patterns across the life-course (for
reviews, see Jennings & Reingle, 2012; Piquero, 2008) unfortunately offer very limited
insight into differences in delinquent pathways among early-onset offenders. Current trajec-
tory-based studies largely use general population and general offender samples (Allard,
Chrzanowski, & Stewart, 2017; Blokland, Nagin, & Nieuwbeerta, 2005; Broidy et al., 2015;
Ferrante, 2013; Jennings & Reingle, 2012; Yessine & Bonta, 2009). Such samples, how-
ever, might have precluded meaningful differentiation among childhood-onset offenders, as
the expected prevalence of early-onset offenders in general and offender populations is low
(Moffitt et al., 2002; Snyder, 2001; van der Laan, van Domburgh, Hoeve, Loeber, & Slot,
2008). As a result, variation in offending patterns among childhood-onset offenders is over-
shadowed by the identification of large non-rate (e.g., D’Unger, Land, McCall, & Nagin,
1988; Land, McCall, & Nagin, 1996; Piquero, Farrington, Nagin, & Moffitt, 2010) and
low-rate (e.g., Allard et al., 2017; Blokland et al., 2005; Broidy et al., 2015; Ferrante, 2013)
offending subgroups.
   The inability to differentiate between offending patterns of childhood-onset offenders
constitutes an important gap in our knowledge, as identifying and characterizing their dis-
tinct re-offense patterns has both theoretical and practical merit. First, it could help confirm
or challenge theoretical assumptions (Moffitt, 1993, 2006) on the existence of distinct
offending patterns of early-onset offenders and associated offender characteristics. Second,
to the extent that individual and neighborhood characteristics differentiate between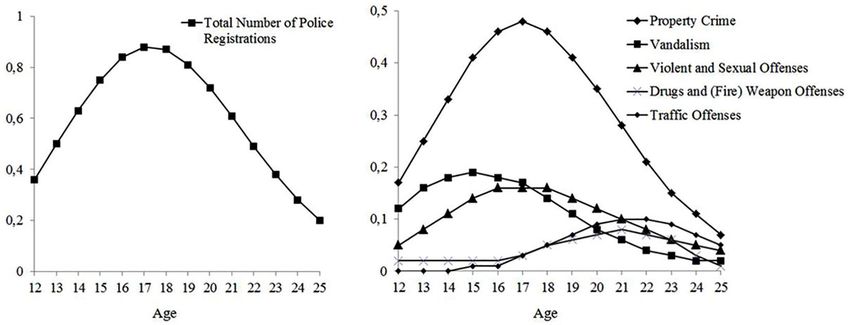
van Hazebroek et al. / Delinquent Development Among Early-Onset Offenders       3

offending trajectories (see Moffitt, 1993; Moffitt et al., 1996), this could strengthen efforts
to identify children at low and high risk of long-term criminal involvement.
   To fill this knowledge-gap, two key methodological challenges need to be overcome.
First, studies have to include solely known childhood-onset offenders to be able to explore
meaningful variation in delinquent pathways within this specific offender subgroup. Second,
early starters have to be identified in childhood and followed beyond adolescence (Jennings
& Reingle, 2012), during which delinquent behavior is theorized to peak for all individuals
regardless of age of onset (Moffitt, 1993).
   The purpose of the current study was to address the abovementioned issues by asking (a)
whether subgroups of early-onset offenders can be identified based on patterns in the fre-
quency and nature of their offending from childhood into adulthood and (b) whether gender,
ethnicity, and childhood neighborhood characteristics can help characterize subgroups fol-
lowing distinct offense patterns. To address these questions, data were used on more than
700 individuals who were registered by the police for an offense before age 12. As a police
contact/arrest at a young age has emerged as the most consistent indicator of persistence in
offending (DeLisi, Neppl, Lohman, Vaughn, & Shook, 2013), this sample enables us to
draw a detailed picture of heterogeneity in delinquent development among childhood-onset
offenders.

  Theories on Delinquent Development of Early-Onset Offenders
Moffitt’s (1993, 1997, 2006) developmental taxonomic theory is the most influential theo-
retical model arguing that offense patterns in the general population can be divided into
distinctive offending trajectories. Moffitt (1993) originally stated that, while the majority of
offenders are theorized to only temporarily engage in crime during adolescence, a small
number of individuals will start offending early in the life-course and continue offending at
a high-rate during adolescence. Based on emerging empirical findings, Moffitt later
expanded her original taxonomic theory by including a third offending pathway. By then,
several longitudinal studies had identified a small group of early starters who engaged only
in low-to-moderate delinquency during adolescence (Moffitt et al., 1996; Nagin, Farrington,
& Moffitt, 1995; Raine et al., 2005). From this, Moffitt (2006) concluded that some early-
onset offenders will show delinquent behavior up to age 18 that is too infrequent to be clas-
sified as classic life-course-persistent offending (see Moffitt, 2006, for her altered theory
and empirical underpinnings). Thus, while Moffitt (2006) still argues that the majority of
early-onset offenders will follow the delinquent pathway of the original life-course-persis-
tent offender, she now anticipates that a small group of early starters will show low-rate
offending behavior during adolescence and will desist before reaching early adulthood (i.e.,
low-level chronics; Moffitt, 2006).
   In addition to duration and overall levels of offending, the offender subgroups are hypoth-
esized to commit different types of crime. Although life-course-persistent offending is gen-
erally thought to be more versatile than that of adolescence-limited delinquents, persistent
offenders are believed to increasingly commit violent types of offenses with age (Moffitt,
2003, 2006). Offenders on the life-course-persistent trajectory are thought to continuously
suffer from the individual and familial risk factors that instigated their problems in child-
hood (i.e., contemporary continuity). As life-course persisters are exposed to new life
domains with age (e.g., school, peers, neighborhood), accumulating negative experiences
4   Criminal Justice and Behavior

enhance a process of escalation of offending (i.e., cumulative continuity). Longer involve-
ment in crime and new social circumstances are believed to change the manifestation of
tendencies toward offending with age (i.e., heterotypic continuity). As a result, life-course
persisters are thought to engage in all types of age-appropriate delinquent behaviors in all
stages of life; they are thought to hit and kick at onset, exhibit theft and drug use throughout
the teenage years, and turn toward violent offending upon entering adulthood (Moffitt,
1993; Moffitt et al., 2002). In contrast, low-level chronic offenders are thought to suffer
from depression and anxiety, excluding them from deviant social peer groups. As a result,
while low-level chronics are subject to both contemporary and heterotypic continuity, they
would be less affected by the process of cumulative continuity causing the escalation of
offending among their high-level counterparts (Moffitt, 2006).
   Moffitt’s (1993) taxonomy also offers expectations on the associations between gender,
ethnicity, and early environmental differences and offending subgroups. Life-course-persistent
offending would mainly be limited to males, as they tend to suffer more from the neuropsy-
chological deficits assumed to underlie this pathway than females. Minorities would also be
at elevated risk for life-course-persistent offending, because as a group, they are likely to grow
up in the most disadvantaged familial and economic environments (see Piquero, Moffitt, &
Lawton, 2005). Childhood environmental characteristics are also thought to distinguish
between low- and high-rate persistent offenders, with low-level offenders residing in more
adaptive social environments than their high-level counterparts (Moffitt, 2006).
   The Moffitt taxonomy leads us to expect that most early starters frequently commit
crimes across the entire life-course, whereas a small group of early-onset offenders engage
only in low-to-moderate delinquency during adolescence. In addition, we would expect
persistent offenders to engage in all types of offending and high-rate chronic offenders to
disproportionally, and increasingly, engage in violent crime. Furthermore, males, minori-
ties, and children from low socioeconomic status (SES) and highly urban neighborhoods
would be most likely to show persistent and violent delinquent behavior.

                                     Prior Research
The potentially meaningful differentiation of re-offense patterns among childhood-onset
offenders is vastly understudied. To exemplify a systematic review on delinquent trajecto-
ries, Jennings and Reingle (2012) found that out of the 105 studies included, only one study
(i.e., van Domburgh, Vermeiren, Blokland, & Doreleijers, 2009) was based on a sample of
childhood-onset offenders. To provide empirical groundwork to the current study, we,
therefore, draw from trajectory-based studies using juvenile offender samples.
    Prior work among adolescent offenders has identified between three and seven offending
trajectories (Baglivio, Wolff, Piquero, & Epps, 2015; Day et al., 2012; Laub, Nagin, &
Sampson, 1998; Livingston, Stewart, Allard, & Ogilvie, 2008; Monahan, Steinberg, Cauffman,
& Mulvey, 2009; Mulvey et al., 2010; van der Geest, Blokland, & Bijleveld, 2009; Ward et al.,
2010). Trajectory subgroups generally include low-, moderate-, and high-rate offending
groups. The low-rate group typically consists of the largest portion of the sample, whereas the
high-rate group makes up the smallest trajectory subgroup (Day et al., 2012; Laub et al., 1998;
Monahan et al., 2009; Mulvey et al., 2010; van der Geest et al., 2009; Ward et al., 2010).
    Studies on juvenile offender samples confirm Moffitt’s assumptions on (heterotypic)
continuity among early-onset offenders, by reporting that early-onset offenders follow the
van Hazebroek et al. / Delinquent Development Among Early-Onset Offenders 5 most chronic delinquent pathways, and commit the highest amount and most diverse types of offenses (Broidy et al., 2015; Day et al., 2012). In a large sample of youth arrested before age 18, Baglivio et al. (2015) found distinct delinquent pathways among juveniles who started offending in childhood. While some early starters desisted shortly after age 13 years (32%), others either had a steady, but low number of arrests up to the age of 17 years (29%), or showed high-rate persistent offending throughout the adolescent period (7%). Data on 287 male childhood-onset offenders also revealed heterogeneity in re-offending patterns by supporting a model with three distinct subgroups: a low-rate group (68.3%), an escalating group (24.7%), and a high-rate group (7.0%; van Domburgh, Vermeiren, et al., 2009). Unfortunately, it remains relatively unclear whether offending subgroups vary by demo- graphic factors such as gender, as most trajectory-based studies are based on male subjects (Day et al., 2012; Laub et al., 1998; Monahan et al., 2009; Mulvey et al., 2010; van der Geest et al., 2009; Ward et al., 2010). Studies that were able to characterize trajectory subgroups based on demographic characteristics found that males were more likely to populate the chronic offending groups than females (Block, Blokland, van der Werff, van Os, & Nieuwbeerta, 2010; Livingston et al., 2008; Piquero, Brame, & Moffitt, 2005). Findings on ethnicity seem context dependent. In the United States, minorities (i.e., non-Whites) were more likely to belong to the trajectory subgroup demonstrating an early-onset and chronic offending trajectory (Baglivio et al., 2015), whereas Australian Indigenous offenders were more likely than non-Indigenous offenders to populate the early-onset/chronic trajectory (Livingston et al., 2008). After gender and ethnicity were controlled for, neighborhood dis- advantage was no longer associated with trajectory group membership (Livingston et al., 2008). In a childhood-onset sample (van Domburgh, Vermeiren, et al., 2009), minorities were found to be more likely to follow the high-level than the low-level offending pathways, and children from disadvantaged neighborhoods were overrepresented in the escalating offender subgroup. Although abovementioned studies highlight heterogeneity in offending patterns, the lit- erature is characterized by a number of limitations. First, the generalizability of findings among juvenile offenders to childhood-onset offenders is limited. Childhood-onset offend- ers without an arrest during adolescence are not included in juvenile offender samples, whereas variation in offending among children that do re-offend might be overshadowed by offending behavior of the more common adolescent-onset offender. Second, in previous studies, offending subgroups were categorized based on frequency of offending alone (Day et al., 2012; Laub et al., 1998; Ward et al., 2010) or broad distinctions between nonserious and serious types of crime (van der Geest et al., 2009; van Domburgh, Vermeiren, et al., 2009). However, a relevant taxonomic theory (Moffitt, 1993) as well as critiques of life- course criminological research (Evans, Simons, & Simons, 2016; Hasking, Scheier, & Abdallah, 2011; Odgers et al., 2007) highlights that the complexity of delinquency is under- estimated when it is defined solely as the frequency of offending. Scholars state that it is important to distinguish between several types of offending behaviors when identifying offender subgroups (Evans et al., 2016; Hasking et al., 2011; van Domburgh, Vermeiren, et al., 2009). Third, a limitation of past research featuring early-onset offenders is the use of short follow-up periods (van Domburgh, Vermeiren, et al., 2009). This is unfortunate because to test the popular notion that an early onset elevates the risk of becoming a chronic offender (see Moffitt, 1993), studies have to be focused on delinquent development beyond adolescence, during which delinquent behavior is theorized to peak for all offenders.
6   Criminal Justice and Behavior

                                    The Current Study
Given the paucity of studies focused on long-term re-offense patterns of childhood-onset
offenders, the current study explores the extent to which distinct delinquent trajectories can
be identified within a sample of approximately 700 early-onset offenders. These data pro-
vide us with a follow-up period of 3 to 14 years, which gives us insight into re-offending in
the theoretically relevant period beyond adolescence. To take offense types into account, we
use a multigroup trajectory model to identify clusters of individuals following similar tra-
jectories across multiple types of crime. In doing so, we hope to uncover the most useful
taxonomy of early-onset offenders by accurately reflecting the full range of their offending
behavior. Finally, the current study incorporates key demographic and early neighborhood
explanatory factors to examine the assumption that males, youths from non-Western back-
grounds, and individuals from disadvantaged neighborhoods are overrepresented in the
high-rate persistent delinquent trajectories.

                                            Method
Participants and Procedures

This study was based on participants of the Dutch Childhood Arrestees Study1, a prospective
longitudinal study on children registered by the police for committing a first offense prior to
age 12. Although offenses committed before the age of criminal responsibility (i.e., 12 years
in the Netherlands) are not registered in national crime statistics, they are documented in
local police registration systems. These registration systems were used to select first-time
registered children from three different Dutch police districts (Gelderland-Midden, Utrecht,
and Rotterdam-Rijnmond) in the Netherlands, ensuring that neighborhoods with a sufficient
range in levels of SES and urbanization were included. Children were not eligible for inclu-
sion when (a) they committed status offenses (i.e., behavior that is only prosecutable for
certain [age] groups, such as truancy), (b) they were not legal residents of the Netherlands
(because of foreseeable problems at follow-up), (c) they committed the crime on the com-
mand of their parents, or (d) inclusion would complicate police procedures.
   Data from two cohorts were combined: (a) children registered in 2000 to 2001 (n = 351,
82.6% male, 46.2% non-Western) and (b) children registered between 2003 and 2005 (n =
357, 84.9% male, 44.8% non-Western). The total sample encompassed 708 childhood
arrestees (83.8% male, 45.5% non-Western) who were registered by the police between the
ages of 5 and 11 years (M = 9.66, SD = 1.50, Mdn = 10). Most participants (52.3%) were
registered for committing vandalism prior to age 12, approximately one fourth (25.3%) was
registered for property crime, and 14.7% was registered for a violent offense. Comparison
with available data from the United States (Snyder, 2001) suggests that sample characteris-
tics are similar in terms of gender and offense profiles.

Measures

    Measures used for multitrajectory modeling

Two registration systems were used to reconstruct participants’ criminal history. We used
the Dutch police registration system HKS (Herkennings Dienst Systeem) to gather informa-
tion on frequency and type of re-offending from age 12 years and above over a 3- to 14-year
follow-up period, from January 2000 until February 2015. The HKS has information on all
van Hazebroek et al. / Delinquent Development Among Early-Onset Offenders 7 the times a person was identified as a suspect in a criminal case from age 12 years and above. As such, HKS contains information on suspects and not-convicted offenders. However, given that cases that are discarded in an early stage of investigation do not end up being registered in HKS and given that approximately 90% of all HKS-registered suspects are found guilty at a later stage (Besjes & van Gaalen, 2008), HKS data are closer to convic- tion than to arrest data. To correct for reduced time at risk, we gathered information on date of death and criminal sanctions from the Research and Policy Database Judicial Documentation (“Onderzoek- en Beleidsdatabase Justitiële Documentatie,” OBJD) of the Research and Documentation Centre of the Ministry of Justice (WODC). As there was no participant mortality during the follow-up, we corrected for the possible reduction in police registrations due to time spent incarcerated (Piquero et al., 2001).2 Relatively few partici- pants (n = 75, 10.59%) had been incarcerated during the observation period. The average incarceration time among recidivists was 6.5 months (SD = 1 year and 2 months, Mdn = 1.4 months). We determined frequency of re-offending per type of offense per age based on date of birth, date of police registrations, and crime descriptions from the police registration system (HKS). Crime descriptions in HKS were based on the following standard crime categoriza- tion employed by Statistics Netherlands (2019; see Kalidien, de Heer-de Lange, & van Rosmalen, 2011): (a) property crime (including theft, embezzlement, and fencing), (b) van- dalism and crimes against the Public Order and Authority (such as discrimination and sedi- tion), (c) violent and sexual offenses (including rape and [sexual] assault), (d) traffic offenses (including DUI, hit and run, joyriding and refusal of a breathalyzer test), (e) drug crimes (such as owning or selling illegal amounts of soft and hard drugs),3 and (f) weapons offenses (including carrying a weapon in public). To correct for spells of incarceration, we calculated the number of offenses individuals might have committed had they not been imprisoned (see Bijleveld, van de Weijer, Ruiter, & van der Geest, 2015). We multiplied the number of times participants had been registered by the police during the time they were free within a year’s time period, by the inverse of the proportion of that year. For example, if an individual was detained for 6 months at age 20 and committed two offenses during the remaining 6 months of that year, this person was expected to have committed four offenses were he or she not have been incapacitated at age 20 years. As this correction led to disproportionately high offending rates per age for a few participants (e.g., because they had two police registrations in a year during which they were incarcerated for 11 months), we stabilized the correction effect (see also van der Geest et al., 2009) by capping their offending rates at the maximum of offenses committed by any individual in the sample without stabilization +1. Thus, stabilizing the correction for incar- ceration put them within the sample’s observed range, but still indicated that these individu- als were more likely to have committed a disproportionately high number of offenses in the years they were incapacitated. Predictors As ethnicity was not registered at participants’ arrest below age 12, we determined ethnic background based on family name. This method is likely to be accurate in the vast majority of the cases, as intercultural marriages of foreign women to Dutch men (in which case, the child is likely to have a Dutch family name) were rare at the time our participants were born
8   Criminal Justice and Behavior

(Statistics Netherlands, 2001). Most non-Western family names were easily recognizable.
However, when a specific family name was common in both the Netherlands and in foreign
countries, ethnicity was coded as “unknown” (n = 57). This process led to high agreement
among three coders (89%), and a high degree of interrater reliability was achieved (ĸ > .86,
p < .001). As country of birth was registered at follow-up, we were able to check our initial
coding among recidivists. We found that of the 66 recidivists born in non-Western coun-
tries, 89% was correctly classified as having a non-Western ethnicity based on their family
name. For the 8% (n = 5) that were wrongfully categorized as Western, and the 3% (n = 2)
originally categorized as “unknown,” we adjusted their ethnicity into non-Western based on
their country of origin.
   Postal codes were used as a proxy for neighborhood levels of SES and urbanization prior
to age 12. The postal code classification of neighborhood SES was available in quintiles
based on mean income, unemployment, and education level (Knol, 1998; Social and Cultural
Planning Office of the Netherlands, 2002), with higher scores representing lower neighbor-
hood SES. Information on urbanization levels was based on the number of households per
square kilometers (Statistics Netherlands, 2006) and ranged from (1) “no-urbanization: less
than 500 households per km²” to (5) “very high urbanization: 2,500 or more households per
km².” With the intent of using analytical techniques to compare groups, we increased the
likelihood of having observations per trajectory group and levels of SES and urbanization by
dichotomizing the neighborhood-related variables. We combined the lower three (low risk)
and upper two (increased risk) categories for both variables. Hence, we separated “very high
to average neighborhood SES” (1-3) from “low to very low neighborhood SES” (4-5) and
“very low to average urbanization” (1-3) from “high to very high urbanization” (4-5). To
deal with missing data, we added a category “unknown” to all predictor variables.

Analyses

Our analyses proceeded in three steps. First, we studied the overall delinquent development
in our sample by examining total recidivism rates and recidivism rates per type of offense.
Second, we used a group-based multitrajectory model (Nagin, Jones, Passos, & Tremblay,
2018) to identify distinctive clusters of individuals displaying similar offending patterns
across several types of offending. Parameters defining these patterns were allowed to vary
freely across groups, so that groups could differ in both the level and shape of their delin-
quent pathways. When estimating offending trajectories, we excluded participants without
an additional police registration during the follow-up period (Broidy et al., 2015; Ferrante,
2013), as including nonrecidivists would only add a flat trajectory to the model. Furthermore,
it would increase the risk of low-level recidivists being pulled into the nonrecidivist group,
which would complicate distinguishing between non- and low-level recidivists. In the third
step, we assigned individuals to subgroups based on their maximum posterior group prob-
abilities, and used group membership—with nonrecidivists denoted as a separate group—as
a multiple nominal outcome in a series of multinomial logistic regression analysis. We
studied whether gender, ethnicity, and levels of childhood neighborhood SES and urbaniza-
tion (all dummy-coded) differentiated between trajectory subgroups. Additional analysis
showed that there was no evidence of multicollinearity among these predictors, as variance
inflation factor (VIF) scores were between 1 and 10 (Bowerman & O’Connell, 1990;
Mertler & Vannatta, 2005) and tolerance values above 0.2 (Menard, 1995).
van Hazebroek et al. / Delinquent Development Among Early-Onset Offenders         9

  Multitrajectory model

The multitrajectory models were run using the STATA Trajectory Procedure (Jones, Nagin,
& Roeder, 2001) in STATA 13. We identified the best-fitting model based on cubic-shaped
trajectories, and a count-specific zero-inflated Poisson regression model. In doing so, we
were able to prevent disproportional change in delinquent trajectories caused by years with
zero police registrations (Lambert, 1992).
   Due to low rates of participation in drug and weapons offenses, we combined these two
types of offending to display delinquent development across different types of crime. As a
result, trajectory subgroups were identified based on similarity of their offending patterns
across five outcome variables: (a) property crime, (b) vandalism and crimes against the
public order and authority, (c) violent and sexual offenses, (d) drug and weapons offenses,
and (e) traffic offenses.
   In line with Nagin’s recommendations (see Nagin, 2005, 2010), the best-fitting model
was selected based on three criteria: (a) Bayesian information criterion (BIC; Schwartz,
1978) values closest to zero, indicative of increased model fit compared with alternative
models; (b) highest average posterior probabilities, representing higher degrees of classifi-
cation certainty of each individual to his or her most likely trajectory; and (c) highest odds
of correct classification (OCC; Nagin, 2005), indicating improvement of assignment accu-
racy over random assignment, while accounting for differences in group sizes. Mean poste-
rior probabilities above .70 and OCCs of 5 or larger for all trajectory groups were considered
indicative of satisfactory model fit and assignment accuracy (Nagin, 2005, 2010). In addi-
tion, Wald tests were performed to test for group differences in terms of intercepts and cubic
slopes across all outcome variables.

  Attrition. As the year of inclusion and age at first offense differed between participants,
the average age at the end of follow-up ranged from 15 to 27 years (M = 22.10, SD =
2.47, Mdn = 22; see bottom part of Table 1 for percentages of original sample across
age). To avoid problems associated with defining parts of offending trajectories based
on a small number of individuals, we limited the trajectories to ages for which data were
available on at least 100 individuals. We, therefore, ended our observation of offending
trajectories at age 25. In addition, we corrected for differences in participants’ age at the
end of the observation period, by coding nonobserved years as missing (see also van der
Geest et al., 2009). For example, when participants reached the age of 20 at the end of the
follow-up period, we coded their police registrations from ages 21 to 25 years as missing.
As a consequence, they did not contribute to the estimation of the trajectories from age
21 to 25 years.
   Independent sample t tests showed that there were no significant differences in partici-
pants’ age at the end of the follow-up period across gender, t(699) = 1.56, p = .12; ethnic-
ity, t(648) = .82, p = .41; or neighborhood urbanization levels, t(668) = 1.80, p = .07.
However, there was a significant difference in the level of neighborhood SES. Children
from higher SES neighborhoods were older (M = 22.20, SD = 2.32) at the end of the obser-
vation period, than children from lower SES neighborhoods (M = 21.80, SD = 2.36),
t(699) = 2.23, p = .03.4 Thus, although attrition led to decreasing power with age, substan-
tial bias due to differential attrition is not likely to be an important threat to the validity of
our conclusions.
10
     Table 1: Percent of Sample With a Police Registration by Age and Offense Types

     Offense Types and Attrition                     Total   12    13     14     15     16     17     18     19     20     21     22     23     24     25

                                                      %      %     %      %      %      %      %      %      %      %      %      %      %      %      %

     Total                                           48.9    7.8   13.3   16.1   17.4   18.4   17.9   17.1   14.9   15.9   11.9    9.4   10.7    5.9   1.2
     Property crime                                  35.3    3.7    8.6   10.6   11.3   11.2   11.0    9.2    7.7    7.6    6.5    5.3    4.4    2.1   0.6
     Vandalism                                       29.7    4.2    5.8    5.9    6.2    6.8    5.6    5.7    4.1    2.2    2.5    1.8    1.7    1.3   0
     Violent and sexual offenses                     25.4    2.0    3.0    3.7    5.1    6.6    5.3    4.4    3.9    4.0    3.1    3.0    3.4    1.3   0
     Drug offenses                                    6.1    0.1    0      0.3    0.3    0.4    0.7    0.9    0.8    1.5    1.7    1.5    1.3    0.8   0.6
     Weapons offenses                                 6.6    0.3    0.4    0.6    1.0    0.7    0.9    0.7    1.1    1.2    1.0    1.3    1.0    0.4   0
     Traffic offenses                                10.7     0     0      0.3    0.3    0.4    1.0    2.0    2.4    3.8    1.9    3.3    3.4    1.3   1.2
     Percentage of original sample size across age           100   100    100    99.9   98.9   96.8   93.1   85.2   73.4   55.6   42.1   33.6   23.4   8.3
van Hazebroek et al. / Delinquent Development Among Early-Onset Offenders 11
Figure 1: Average Number of Police Registrations per Age, Corrected for Days of Incapacitation
Results
Development of Re-Offending
Results showed that half (48.9%, n = 346) of early-onset offenders had a second police
registration between the ages of 12 and 25 years (see Table 1). Most participants were reg-
istered for property crime (35.3%), vandalism (29.7%), and violent or sexual offenses
(25.4%), whereas drug (6.1%), weapons (6.6%), and traffic (10.7%) offenses were less
common.5 Regarding involvement in crime across age, Table 1 shows that early-onset
recidivists were typically criminally active during adolescence, as the largest share of par-
ticipants was registered by the police at ages 16 and 17 years.
Regarding frequency of re-offending, Figure 1 shows that re-offending rates across age
displayed the age–crime curve, with police registrations increasing up to age 17 and then
declining into adulthood. However, the typical age–crime curve did not apply to all types of
crime. On one hand, property crime, vandalism, and violent and sexual offenses followed
the typical age–crime curve. Traffic offenses, and drug and weapons offenses, on the other
hand, were virtually absent up to late adolescence to peak only in early adulthood.
Offending Trajectories
To select the optimal number of trajectory groups, we estimated multitrajectory models
with up to six groups and compared their fit. As illustrated in Table 2, the fit indices indi-
cated that the five-group model described the data best. In this five-group solution, BIC
values were lowest. In addition, average posterior group membership probabilities were
high: all averaging above .90. The OCC ranged from 12 to 1,091, indicating high assign-
ment accuracy. Although this five-group model identified two relatively small subgroups
(less than 5%), model fit was substantially better than that of the four-group model. Further
examination of the five-group model indicated that distinguishing between the two smallest
groups yielded unique information about their levels as well as developmental patterns of
recidivism (see Figure 2 and Table 3)—information that was lost in the four-group model.
We opted for the model with five re-offending subgroups. We note, however, that additional12 Criminal Justice and Behavior
Table 2: Fit Measures for One- to Six Multigroup Models (n = 346)
Average posterior
Groups BIC 2(∆BIC)a probabilities OCC Group membership (n)
1 −7,800.55 1 346
2 −7,061.60 1,477.9 .99; .96 28; 82 270; 76
3 −6,947.57 228.06 .98; .93; .96 25; 45; 207 231; 77; 38
4 −6,926.55 42.04 .93; .90; .94; .98 12; 42; 58; 325 181; 58; 70; 37
5 –6,853.07 146.97 .93; 90; .94; .97; .98 12; 42; 65; 549; 1,091 180; 59; 68; 21; 18
6 −6,882.12 −29.05 .88; .89; .98; .98; .97; .76 9; 39; 94; 651; 610; 31 154; 61; 60; 21; 19; 31
Note. Starting values were required to converge the five- and six-group models. We, therefore, reestimated these
models, using intercepts and cubic slopes from the k – 1 group model as starting values. Bold text represents
model fit indices for final group model. BIC = Bayesian information criterion; OCC = odds of correct classification.
a2(∆BIC) > 10 indicates there is very strong evidence that the more complex model is favored above the simpler
model (Jones et al., 2001).
analyses (not reported here, but available upon request) showed that current conclusions
were not substantively affected by choosing the five- over the four-group model.
Apart from the a priori defined group of nonrecidivists (NON; 51.1%, n = 362), the five
recidivist groups were assigned the following labels based on overall level differences in
re-offending: sporadic recidivists (SPR; 25.4%, n = 180), low-rate recidivists (LR; 8.3%, n
= 59), moderate-rate recidivists (MR; 9.6%, n = 68), high-rate adult-peaked recidivists
(HRADL; 3.0%, n = 21), and high-rate adolescence-peaked recidivists (HRADOL; 2.5%,
n = 18). Re-offending patterns for each group across five types of crime are illustrated in
Figure 2, with columns representing offending trajectories per subgroup.6 Figure 3 builds
on the findings presented in Figure 2, by displaying the total frequency of offending, as well
as the relative share of each type of offense per subgroup.
Most participants belonged to the subgroup that is characterized by noninvolvement in
any type of offending as registered by the police during the observation period. Mean
offending rates per year were low in both the SPR (M = 0.20, SD = 0.16) and LR (M =
0.44, SD = 0.20) subgroups. The SPR and LR groups differed in their development of prop-
erty crime and vandalism, which peaked at age 13 to 14 for the SPR group, whereas the LR
group showed a (low) peak at age 18. The MR group had higher average offending rates per
year (M = 1.25, SD = 0.57) than the first three trajectory subgroups. The MR group was
mostly characterized by higher levels of violent and sexual offenses than the SPR group and
an earlier peak in property crime (age 16) than the LR group (age 18; see Figures 2 and 3).
In addition, Figure 2 shows that mean offending rates per year were highest in the
HRADL (M = 1.94, SD = 1.00) and HRADOL (M = 2.36, SD = 0.74) subgroups. These
two high-rate groups differed in levels of offending at age 12 and developmental patterns of
property crime, vandalism, and violent and sexual offenses (see Table 3 for Wald tests).
Although the HRADL group had higher initial levels of property crime, vandalism, and
violent and sexual offenses, their patterns of offending started to steadily rise around age 18,
peaked around age 22, and decreased toward age 25. The HRADOL group, however,
showed lower levels of offending at age 12, but police registrations increased rapidly to a
high frequency at age 18.
Regarding distributions of offense types, Figure 3 shows that SPR and MR offenders
resembled each other in that for offenders in both trajectory groups property offendingvan Hazebroek et al. / Delinquent Development Among Early-Onset Offenders 13
Figure 2: Multitrajectory Model of Observed and Predicted Frequency of Offense Types per Trajectory
Subgroup
Note. NON = nonrecidivists; SPR = sporadic recidivists; LR = low-rate recidivists; MR = moderate-rate recidivists;
HRADL = high-rate adult-peaked recidivists; HRADOL = high-rate adolescence-peaked recidivists.
started to decline from the mid-teens onward to a low rate in the early 20s, followed by a
small increase up to age 25. Only MR offenders also showed an increase in the proportion
of drug and weapons offenses during this period. For the other recidivist groups, the propor-
tion of property crimes did not decline until the early 20s, before giving way to traffic
offenses in the LR and HRADL group, and violent and—to a lesser extent—drug and weap-
ons offenses in the HRADOL group. Thus, violent and sexual offenses made up an increas-
ing part of total crime among the HRADOL subgroup, indicating possible escalation of
delinquent behavior toward the end of the follow-up period.14 Criminal Justice and Behavior
Table 3: Wald Tests on Differences Between Intercepts and Cubic Slopes per Type of Offense Across
Five Trajectory Subgroups
Intercept / LR vs. MR vs. HRADL HRADOL MR vs. HRADL HRADOL HRADL HRADOL HRADOL
Offense Types Slope SPR SPR vs. SPR vs. SPR LR vs. LR vs. LR vs. MR vs. MR vs. HRADL
Property Intercept 4.88* 2.09 45.81*** 5.45* 2.26 15.29*** 0.00 99.47*** 2.63 15.16***
Property Slope 10.19** 2.68 43.78*** 12.00*** 6.69** 8.93** 0.18 94.25*** 8.77** 5.05*
Vandalism Intercept 2.20 0.55 4.44* 4.28* 1.71 0.77 5.82* 2.09 5.89* 9.48**
Vandalism Slope 3.97* 0.64 3.67 1.77 3.27 2.33 6.04* 1.21 3.02 5.35*
Violence Intercept 0.02 10.12** 22.68*** 0.01 1.64 5.04* 0.01 4.91* 5.72* 14.64***
Violence Slope 0.45 9.79** 22.55*** 0.29 0.71 3.51 0.12 4.28* 4.40* 13.15***
Drug/Weapons Intercept 0.13 0.00 0.06 1.92 0.13 0.12 0.02 0.05 2.01 1.51
Drug/Weapons Slope 0.10 0.00 0.00 1.92 0.10 0.10 0.00 0.00 2.14 2.01
Traffic Intercept 0.01 0.64 0.14 0.00 0.77 0.10 0.00 0.76 0.72 0.12
Traffic Slope 0.17 1.47 0.10 0.08 1.91 0.00 0.02 1.57 1.72 0.02
Note. Lower group is reference category. LR = low-rate recidivists; SPR = sporadic recidivists; MR = moderate-rate recidivists;
HRADL = high-rate adult-peaked recidivists; HRADOL = high-rate adolescence-peaked recidivists.
*p < .05. **p < .01. ***p < .001.
Figure 3: Total Predicted Amount of Police Registrations and Distribution of Types of Offenses per Tra-
jectory Subgroup Across Age
Note. SPR = sporadic recidivists; LR = low-rate recidivists; MR = moderate-rate recidivists; HRADL = high-rate
adult-peaked recidivists; HRADOL = high-rate adolescence-peaked recidivists.
Characterizing Trajectory Subgroups
As the trajectory model identified two small subgroups with high rates of offending, the
high-rate adult and adolescence-peaked groups were combined to form the “high-rate”
(HR) recidivist group in follow-up analysis to create sufficient power.7 The overall multino-
mial model with group membership as dependent variable was statistically significant (see
Table 4), although predictors explained no more than 17% of group assignment.
In the model with nonrecidivists as the comparison group, Table 4 shows that males were
more likely to belong to the SPR (odds ratio [OR] = 2.39), and MR (OR = 6.06) groupsTable 4: Odds Ratio Results From Multinomial Regression Analysis: Effects of Demographic and Childhood Neighborhood Factors on Group Membership
(n = 708)
Total
Predictors sample, % SPR vs. NON LR vs. NON MR vs. NON HR vs. NON LR vs. SPR MR vs. SPR HR vs. SPR MR vs. LR HR vs. LR HR vs. MR
Sex
Female (reference)
Male 83.8 2.39** 1.84 6.06** NI 0.77 2.54 NI 3.29 NI NI
1.38-4.14 0.83-4.11 1.83-20.02 0.31-1.91 0.72-8.99 0.82-13.13
Unknown 1.0 10.38* NI NI NI NI NI NI NI NI NI
1.74-61.78
Ethnicity
Western (reference)
Non-Western 45.5 1.01 3.08** 2.04* 6.36*** 3.06** 2.03* 6.31** 0.66 2.06 3.12
0.67-1.53 1.57-6.05 1.10-3.81 2.25-18.00 1.50-6.24 1.05-3.91 2.18-18.25 0.28-1.55 0.63-6.77 0.98-9.88
Unknown 8.2 0.73 1.49 1.24 5.57* 2.03 1.69 7.59** 0.83 3.73 4.49
0.35-1.52 0.46-4.80 0.42-3.63 1.47-21.01 0.57-7.20 0.53-5.43 1.87-30.86 0.19-3.68 0.70-19.97 0.91-22.16
SES
High (reference)
Low 48.0 1.15 0.94 2.06* 2.62* 0.82 1.80 2.29 2.19 2.78 1.27
0.74-1.76 0.50-1.78 1.06-3.99 1.04-6.63 0.42-1.63 0.89-3.63 0.88-5.95 0.95-5.05 0.97-7.98 0.44-3.70
Unknown 1.0 0.63 NI 1.40 NI NI 2.24 NI NI NI NI
0.08-5.02 0.10-20.23 0.14-35.94
Urbanization
Low (reference)
High 69.9 1.13 1.55 1.32 0.66 1.38 1.17 0.59 0.85 0.43 0.50
0.70-1.82 0.67-3.61 0.56-3.14 0.21-2.05 0.56-3.36 0.47-2.91 0.18-1.88 0.27-2.67 0.11-1.63 0.13-1.93
Unknown 5.4 2.49 3.75 3.61 2.39 1.51 1.45 0.96 0.96 0.64 0.66
0.84-7.41 0.84-16.69 0.90-14.56 0.48-12.03 0.34-6.61 0.37-5.75 0.19-4.77 0.18-5.27 0.10-4.15 0.11-3.96
Note. Percentages may not sum to 100 due to rounding. R² = .15 (Cox and Snell), .17 (Nagelkerke). Model χ²(32) = 117.27***. Lower group is reference category. Odds
ratios that could not be calculated—for example, because trajectory subgroups consisted entirely of males—were labeled as “not identified” (NI). As the high-rate group
consists entirely of males, odds ratios for comparing the high-rate group to other subgroup in terms of gender were not identified (NI). Odds ratios greater than 1.00
indicate increased probability of group membership. NON = nonrecidivists (n = 362); SPR = sporadic recidivists (n = 180); LR = low-rate recidivists (n = 59); MR =
moderate-rate recidivists (n = 68); HR = high-rate recidivists (n = 39); SES = socioeconomic status.
*p < .05. **p < .01. ***p < .001.
1516 Criminal Justice and Behavior
than to the NON group. In addition, non-Western participants were more likely to be clas-
sified to the LR (OR = 3.08), MR (OR = 2.04), and HR (OR = 6.36) groups than to the
NON group. Furthermore, residing in low SES neighborhoods as a child substantially
increased the chances of being assigned to the MR (OR = 2.06) and HR (OR = 2.62)
groups compared with the NON group.
When offender subgroups were compared, non-Western participants were more likely to
belong to the LR (OR = 3.06), MR (OR = 2.03), and HR (OR = 6.31) groups than to the
SPR group. Members of the LR, MR, and HR groups did not differ in terms of gender, eth-
nicity, or neighborhood levels of SES and urbanization.
In sum, multinomial regression analyses indicated that gender differentiated the SPR and
LR groups from the NON subgroup. Minorities were more likely to be classified to the LR,
MR, and HR groups than to the NON and SPR groups. Residing in a low SES neighborhood
as a child only differentiated the MR and HR groups from the NON subgroup.
Discussion
The aims of the current study were to identify delinquent trajectories and demographic and
neighborhood characteristics related to trajectory group membership in a Dutch sample of
early-onset offenders. We employed multitrajectory modeling to identify subgroups among
approximately 700 early starters, following similar offense patterns across several types of
offending. Results showed that delinquent development in early-onset offenders is highly
heterogeneous. Next to an a priori defined nonrecidivist trajectory, five re-offending trajec-
tories were identified: a sporadic, low-, moderate-, and two high-rate re-offending sub-
groups, whose offending peaked either in adulthood or adolescence. These findings extend
prior trajectory-based studies, as knowledge of heterogeneity in long-term offending trajec-
tories within the early-onset offender population is at present virtually absent. Charting
delinquent development in children experiencing their first police contact prior to age 12,
this study represents an important contribution to our understanding of distinct delinquent
pathways of early starters into young adulthood, and how these different childhood-onset
trajectories are related to demographic and neighborhood characteristics. This is important,
as assumptions on the delinquent development of early-onset offenders constitute an impor-
tant cornerstone of criminological theory and drives policies and treatment of delinquent
children. Revealing that delinquent development in early starters is highly heterogeneous
and often discontinuous, the current findings advance theory and policies as well as fuel
future empirical work on offenders with an onset in childhood. Directions for future studies
are described below.
Contrary to expectations of taxonomic theories, we found that over half of the early-
onset offenders did not come into contact with the police again over the 10- to 14-year fol-
low-up period. Even among those early-onset offenders who did re-offend, over 25% did so
only sporadically. To the extent that childhood-onset offending is taken to signal personal
or familial characteristics that continuously increase the likelihood of offending (i.e., con-
temporary continuity), the (near) absence of re-offending in a large part of the cohort is
unexpected. This finding also diverges from prior empirical results. Among early-onset
offenders in the youngest cohort of the Pittsburgh Youth Study for instance, only 20%
desisted offending—as reported by child, parent, or teacher—between ages 14 and 19 years
(van Domburgh, Loeber, Bezemer, Bezemer, Stallings, Stouthamer-Loeber, 2009). However,van Hazebroek et al. / Delinquent Development Among Early-Onset Offenders 17 despite high levels of desistance, prevalence of offending in the current sample was still 3 times higher than that of the general Dutch population, as only 14% of a Dutch birth cohort was registered by the police between 12 and 22 years of age (Blokland, Grimbergen, Bernasco, & Nieuwbeerta, 2010). Thus, compared with the general population, childhood- onset offenders are at increased risk of having a police contact at the ages of criminal responsibility. Moreover, compared with adolescent-onset (age 12 years and above) offend- ers, Dutch childhood-onset (below age 12 years) offenders report higher rates of property crime, vandalism, and violent offenses (Hoeve et al., 2015). Thus, while childhood onset does not predestine offenders to a frequent and prolonged criminal career, in line with the Moffitt taxonomy, the present study still found that an early onset of offending elevates the risk of becoming a chronic offender (see Moffitt, 1993). Early-onset offenders who did re-offend at higher than sporadic rates showed re-offend- ing patterns that differed both in shape and nature of offending, emphasizing the importance of distinguishing between types of offenses when categorizing subgroups of offenders. In line with a study by Ward et al. (2010), we found two high-rate groups; one with a peak in late adolescence and one with a peak in offending in early adulthood. The adolescence- peaked subgroup was the smallest subgroup with the highest average offending rates up to early adulthood. Future research could examine whether this finding still holds when child- hood or adolescent-onset offenders are followed into late adulthood, as adult-peaked high- rate offenders might have longer criminal careers. Regarding distributions of offense types, the current study, as well as the study by Ward et al. (2010), indicated that high-rate offend- ers committed relatively more property crime than other trajectory subgroups. In the current study, the high-rate adolescence-peaked offenders also displayed increasing amounts of violent and sexual offenses. Relating trajectories to demographic and childhood neighborhood characteristics revealed that males, non-Western participants, and participants residing in low SES neigh- borhoods below age 12 were likely to populate the more frequent re-offending pathways. These results are in accordance with the Moffitt taxonomy (Moffitt, 1993, 2006), and with findings from previous trajectory-based studies on associations between gender (Block et al., 2010; Livingston et al., 2008), ethnicity (van Domburgh, Vermeiren, et al., 2009), and trajectory group membership. Theoretical Implications Although some trajectories identified in this study resemble those hypothesized by taxo- nomic theories, there are also clear differences. Besides the nonrecidivists, the low- and moderate-rate recidivists do not necessarily fit within Moffitt’s taxonomy. Although their total number of offenses was higher than that of the sporadic recidivists, their offending rates were lower than that of high-rate subgroups. The high-rate adolescence-peaked recidivists come closest to resembling the classic life- course-persistent offender, as they displayed high-rate re-offending patterns into adulthood. Furthermore, the distribution of types of crime among high-rate adolescence-peaked offend- ers showed an increase in overall violent and sexual offenses over time. Their tendency to increasingly commit violent offenses seems to be in accordance with Moffitt’s (1993) assumption that violent crimes make up an increasing part of total crime among high-rate chronic offenders. In contrast, the high-rate adult-peaked offenders did not seem to
18   Criminal Justice and Behavior

disproportionately commit violent crimes toward the end of the observation period. Rather,
property crime, vandalism, and traffic offenses made up a large part of total crime rates
among high-rate adult-peaked offenders. The process of cumulative continuity thus seems
to especially apply to adolescence-peaked offenders, causing escalation of offending in this
trajectory subgroup.
   In addition, the sporadic recidivists seem to resemble Moffitt’s low-rate chronic group,
as they showed intermittent patterns of delinquent behavior up to age 18. As predicted by
Moffitt (2006), these sporadic offenders seemed to desist from committing property crime,
vandalism, as well as violent and sexual offenses upon entering adulthood. According to
Moffitt (2006), the low levels of offending in adolescence would result from specific indi-
vidual characteristics (depression and anxiety) that exclude sporadic offenders from deviant
social peer groups. As a result, offenders in the sporadic trajectory subgroup would not be
exposed to the same process of cumulative continuity as their high-level counterparts.
   Finally, there is evidence of heterotypic continuity among all recidivist subgroups. With
increasing age, vandalism made up a smaller part of the total criminal repertoire for all tra-
jectory subgroups. In contrast, the proportion of traffic offenses and the proportion of
offenses including drugs and weapons generally increased. The decrease in vandalism most
likely reflects a shift in age-appropriate behavior (see Blokland & Palmen, 2012). Increases
in traffic and drug and weapons violations predominantly signal increased opportunities for
such behaviors with increasing age.

Limitations and Recommendations

Although this study offers unique insights into the delinquent pathways of early-onset
offenders, some limitations need to be considered. First, this study used a first police regis-
tration below age 12 as a proxy for early-onset offending. Although we expected that by
doing so, a group was selected that shows stable patterns of disruptive behavior in child-
hood, it may have also caused the inclusion of subjects whose registration was more or less
coincidental. Although one might think that this would especially be the case for subjects
registered for committing vandalism below age 12, type of first offense was unrelated to
trajectory group membership. An important task for future research is to examine whether
current findings can be replicated among other samples of childhood-onset offenders—for
example, defined as confessing to having committed more than one delinquent act before
age 12 in a self-report survey. In this way, the generalizability of current findings to other
samples of early-onset offenders can be examined.
   Second, shapes of delinquent trajectories might have been influenced by our reliance on
police registrations as a measure for offending. As a result, we lack information on delin-
quent behavior unknown to the police. In addition, it remains unclear whether participants
were only suspects in the criminal case registered by the police or were eventually found
guilty by a judge. On the contrary, police records have the advantage of being more reliable
than self-report data regarding the timing of offenses as well as the occurrence of more seri-
ous offenses. In addition, police records contain more information on less serious offenses
than conviction data, as minor offenses are less likely to end up in court.
   Third, rates of re-offending might have been affected by the method used to correct for
imprisonment. By calculating the number of offenses individuals might have committed with-
out being imprisoned, we may have overestimated offending rates at the ages individuals were
van Hazebroek et al. / Delinquent Development Among Early-Onset Offenders      19

incapacitated. However, as completely ignoring information on imprisonment has shown to
affect group shape and membership (see Piquero et al., 2001), our attempt at correcting for
exposure time probably led to a more accurate estimation of offending trajectories than if we
had disregarded information on criminal sanctions. Future research may strive to include
information on the actual dates individuals entered and left detention.
   Fourth, the current study lacked information on noncriminal justice interventions early-
onset offenders may have been subjected to during the observation period. To the extent
their childhood police contacts signaled severe behavioral or familial problems, it is likely
that parents, schools, child protection services, and other professionals were actively trying
to curb these youths’ delinquent development. The observed trajectories in our study could
thus have evolved either because of or despite such efforts. If not for such interventions,
low-rate recidivists might have developed into high-rate recidivists, while efforts to make
high-rate recidivists refrain from further offending may have been absent or in vain.
Relatedly, the association between these delinquent trajectories and personal and back-
ground characteristics may reflect differential availability of these interventions for certain
demographic groups as much as the direct influences of these individual characteristics.
   Finally, the multinomial model explained a limited amount of variance in group member-
ship. Childhood characteristics may be insufficient to differentiate between (especially
low-, moderate-, and high-rate) offending trajectories into adulthood in a group of children
with histories of delinquency. Future research should, therefore, make an effort to incorpo-
rate important time-varying risk factors for offending, including noncriminal justice inter-
vention efforts, which might explain more variance in group assignment.

Implications

Trajectories identified in the current study illustrate heterogeneity among early-onset
offenders in terms of the frequency and type of re-offending. This heterogeneity poses a
challenge to policy-makers that focus on young offenders. The following key consider-
ations need to be addressed in discussions on criminal justice interventions for early-onset
offenders.
    To the extent that discontinuity of offending among a large share of early-onset offenders
(i.e., nonrecidivist subgroup) does not result entirely from prevailing intervention policy,
this finding indicates that intervening at a young age might be unnecessary for a large group
of justice-involved children. Intervening would be particularly troubling in the light of find-
ings on the effects of interventions directed toward individuals at low risk of re-offending.
Although focusing intervention efforts on children at high risk of re-offending has been
shown to substantially reduce offending rates (Andrews & Dowden, 2006), targeting low-
risk offenders might actually increase re-offending behavior (Lowenkamp & Latessa,
2002). It has, therefore, been suggested that low-risk youth should be diverted away from
the juvenile justice system to avoid labeling (Campbell et al., 2019) and deviancy training
(Lowenkamp, Latessa, & Holsinger, 2006). An overemphasis on the timing of a first police
contact may lead to inaccurate decisions on the appropriateness of managing early-onset
offenders in the criminal justice system. As yet, the causal mechanisms that either inhibit or
promote persistent offending among low-risk children remain subject to future study.
    Regardless of a lack of continuity in offending, previous research based on the Dunedin
(Moffitt et al., 2002) and Cambridge (Jennings, Rocque, Fox, Piquero, & Farrington, 2016)
You can also read