Electrosynthesis of Ethylene oXIDE - CO2-based - CO2EXIDE
←
→
Page content transcription
If your browser does not render page correctly, please read the page content below
Deliverable 2.1:
        Potential of green CO2 sources for
                ethylene synthesis

           By AXIOM, Energy Institute JKU

    CO2-based
Electrosynthesis of
  Ethylene oXIDE
                           Grant Agreement Number: 768789
                                       H2020-SPIRE-2017

                      DELIVERABLE REPORT

This project has received funding from the European Union’s Horizon 2020 research
                     and innovation programme under grant agreement No 768789.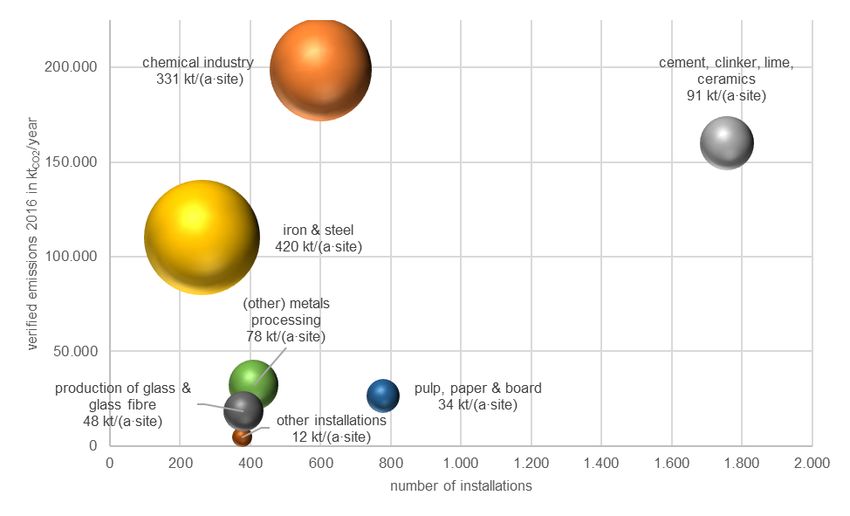
ABSTRACT
This deliverable report covers the aspect of the potential and limitations of green carbon diox-
ide sources for the electrochemical ethylene synthesis addressed in the CO2EXIDE project.
In Europe around 437 Mt CO2 /year are released from the combustion of solid biofuels. [1, 2,
p. 17] Furthermore, in industrial bioethanol fermentation 4.3 Mt CO2/year are produced taking
into account the annual ethanol production [3, 4]. In the food and beverage industry, the wine
and beer production account for approximately 1.5 Mt CO2/year each. These numbers are
projections according to production statistics [5, 6]. From biogas upgrading 3.44 Mt CO 2/year
and combustion of remaining biogas 58 Mt CO2/year are released. Summing up approximately
506 Mt biogenic CO2 are produced annually in Europe via assessed process routes. The de-
tailed theoretical quantification and characterisation show that only part of this CO2 potential is
available in reality for valorisation. Nevertheless, the amounts are vast related to the targeted
utilization pathway in the CO2EXIDE project.

Deliverable Fehler! Verweisquelle konnte nicht gefunden werden.Potential of green CO2 sources           Page 1 of 3
for ethylene synthesis
GA No.: 768789 (H2020-SPIRE-2017)                                                               Version Fehler! Ver-
                                                                                                 weisquelle konnte
                                                                                                nicht gefunden wer-
                                                                                                     den., 07/04/21
1 Introduction............................................................................................................. 3
2 Potential of green CO2 sources ............................................................................. 3
2.1 CO2 from solid biofuels – combustion of biomass and renewable waste 4
CO2 potential from solid biofuels in Europe 4
Global CO2 potential from solid biofuels 5
2.2 CO2 from fermentation processes 5
Liquid biofuels – fermentation of industrial bioethanol 5
Fermentation processes in the industry 8
2.3 Gaseous biofuels 9
CO2 from biogas upgrading 9
CO2 from combustion of biogas and biomethane 14
Biogas substrates 16
Composition of biogas 18
Upgrading technologies for biogas 19
3 Potential sources of fossil CO2 ............................................................................ 21
3.1 Categorisation of fossil CO2 sources 21
3.2 Centralisation of emissions as point sources 23
4 Consideration of technological capture rates .................................................... 24
4.1 CO2 capture efficiencies for industrial processes 24
4.2 Resulting utilisation potentials for CO2 25
5 Current costs for CO2 capture ............................................................................. 27
5.1 CO2 from biogas or bioethanol plants 27
5.2 Assessment of literature data on carbon capture cost 28
6 Conclusions .......................................................................................................... 30
References ..................................................................................................................... 32
List of Figures ................................................................................................................ 40
List of Tables.................................................................................................................. 40
ACKNOWLEDGEMENTS................................................................................................ 41
CO2EXIDE
Deliverable Fehler! Verweisquelle konnte nicht gefunden werden. Potential of green CO2 sources Page 2 of 41
for ethylene synthesis
GA No.: 768789 (H2020-SPIRE-2017) Version Fehler! Ver-
weisquelle konnte
nicht gefunden wer-
den., 07/04/211 INTRODUCTION
This deliverable report covers the aspect of the potential and limitations of green carbon diox-
ide sources for the electrochemical ethylene synthesis. Ethylene oxide is a very important
chemical in global industry [9, pp. 22-26], therefore the ethylene oxide production via CO2-
based electrochemical synthesis offers a promising pathway for Carbon Capture and Utiliza-
tion. Up to now, the state-of-the-art production processes usually consist of direct oxidation
where ethylene, oxygen and a recycle gas are mixed together in a catalytic reactor [9, p. 23],
resulting in ethylene oxide, carbon dioxide and water [9, p. 36]. In recent years, research on
replacing the oxygen by carbon dioxide is in the focus of actual research activities, e.g. by
Mobley et al. [10]. CO2EXIDE aims to produce ethylene by electrolysis from CO2 and H2O,
followed by the chemical conversion of the intermediates to ethylene oxide.
To ensure the climate neutrality of the produced ethylene oxide, the usage of biogenic CO 2 is
preferred. Therefore, the main focus is on the use of already available biogenic CO 2 from in-
dustrial sources, which is defined as carbon neutral to the environment. [11, p. 11] Using bio-
genic CO2 enables the production of fully renewable ethylene and ethylene oxide.
Completing the short assessment, fossil CO2 sources will be discussed and compared to the
biogenic renewable sources based on available quantities and qualities. Further CO2 sources
like ambient air are not in the focus of this project, since the required processes of direct CO 2
capture from air are relatively energy and cost intensive at the actual development stage. [12]
2 POTENTIAL OF GREEN CO2 SOURCES
Different sources of biogenic CO2 can be classified as illustrated in Figure 2-1. The main
sources are combustion of biomass, CO2 from biogas upgrading to biomethane and industrial
fermentation processes, e.g. brewing processes and other fermentation processes in the food
and beverage industry (FAB). Industrial bioethanol is also produced through fermentation [13]
but listed here in an own category, since it is used as a biofuel to significant extent and as raw
material in several industries different from FAB industry. CO2 from the atmosphere is not
available as a point source from existing industrial plants but as a diffuse source which would
demand a high technical effort to separate the CO2 and yield it as a raw material. For subse-
quent chemical conversion therefore, ambient air is not counted as an available existing source
of biogenic CO2 here and not further discussed in this assessment. Nevertheless, CO2 sepa-
ration from ambient air may still play an important role in the sequestration of CO2 from diluted
and dispersed sources in the long-term, as the technology has the potential for significant fur-
ther development and optimization. [14]
CO2EXIDE
Deliverable Fehler! Verweisquelle konnte nicht gefunden werden. Potential of green CO2 sources Page 3 of 41
for ethylene synthesis
GA No.: 768789 (H2020-SPIRE-2017) Version Fehler! Ver-
weisquelle konnte
nicht gefunden wer-
den., 07/04/21Figure 2-1: Classification of potential biogenic CO 2 sources including the available typical CO2
concentration
CO2 from combustion CO2 from the
CO2 as by-product from industrial processes
processes atmosphere
coal biogas upgrading ethylene cement ambient air
12 – 15 vol.-% 40 vol.-% 12 vol.-% 20 vol.-% 0.039 vol.-%
natural gas bioethanol ammonia iron & steel
3 – 10 vol.-% up to 100 vol.-% up to 100 vol.-% 15 vol.-%
fuel oil fermentation refineries
3 – 8 vol.-% up to 100 vol.-% 3 – 13% vol.-%
solid biofuel
3 – 8 vol.-%
Biotechnological Industrial production
biogas processes Chemical industry processes
8 – 15 vol.-%
Source: own illustration Energieinstitut based on [15]
2.1 CO2 from solid biofuels – combustion of biomass and renewable waste
Solid biofuels are defined here according to Eurostat:
Solid biofuels covers solid organic, non-fossil material of biological origin (also known as
biomass) which may be used as fuel for heat production or electricity generation. In en-
ergy statistics, solid biofuels is a product aggregate equal to the sum of charcoal, fuel-
wood, wood residues and by-products, black liquor, bagasse, animal waste, other vege-
tal materials and residuals and renewable fraction of industrial waste. [16]
CO2 potential from solid biofuels in Europe
Solid biofuels are utilized by combustion to the predominant extent but some amounts also
statistically contribute to biogas production. The combusted amount however is responsible for
the highest biogenic CO2 emissions in Europe, which account for approximately
437 Mt CO2/year according to Eurostat statistics of 2016 and IPCC 2006 emission factors for
stationary combustion. [1, 2, p. 17] Solid biofuel combustion takes place not only in large plants
but also at various small scale facilities like household fireplaces and central heating systems
of buildings. The amount of CO2, which could be utilized is therefore significantly lower than
the theoretical potential of 437 Mt CO2/year, as can also be concluded, if the global statistics
for solid biofuels and the fraction of direct heat use is considered (see Chapter 2.1.2.
As can be seen in Figure 2-1, flue gases from the addressed combustion processes consist of
only 3-8% CO2. In flue gases there are many other components that make the utilization of CO2
CO2EXIDE
Deliverable Fehler! Verweisquelle konnte nicht gefunden werden. Potential of green CO2 sources Page 4 of 41
for ethylene synthesis
GA No.: 768789 (H2020-SPIRE-2017) Version Fehler! Ver-
weisquelle konnte
nicht gefunden wer-
den., 07/04/21in a pure form a technically challenging task. Because of the technical effort, high financial
effort is expected, therefore there is a lower economic feasibility obvious in comparison to CO2
from industrial bioethanol and biogas production based on the source concentration.
An overview of existing and actual initiatives for the development of new CO2 separation tech-
nologies for combustion processes can e.g. be found on the CCS browser [17] of the CO2
Capture Project (CCP) [18].
Global CO2 potential from solid biofuels
According to the Global Bioenergy Statistics 2017 of the World Biogas Association (WBA) [19,
p. 30] municipal waste, industrial waste and mainly solid biomass account for 54.72 EJ/year
(for 2014) worldwide. Municipal waste and industrial waste include non-renewable fractions.
42.88 EJ of this solid biomass energy are converted to direct heat, which means direct con-
sumption of energy sources in the residential, agriculture and commercial sectors (not CHP or
heat or electricity only plants) [19, p. 52]. Therefore, only CO2 deriving from 11.84 EJ1 could
be utilized for Carbon Capture and Utilization, but only 6.86 EJ2 of solid biomass are utilized in
CHP, electricity only and heat only plants. The respective CO2 amounts are 1184 Mt and
686 Mt per year. 3
2.2 CO2 from fermentation processes
Liquid biofuels – fermentation of industrial bioethanol
Liquid biofuels are defined here according to Eurostat:
Liquid biofuels includes all liquid fuels of natural origin (e.g. produced from biomass
and/or the biodegradable fraction of waste), suitable to be blended with or replace liquid
fuels from fossil origin. […] [16]
1 Difference of 54.72 EJ and 42.88 EJ
2Summed up the energy utilized 2014 in CHP (2.4 EJ), heat only plants (0.48 EJ) and electricity only
plants (3.98 EJ), Source: [19, p.47 and p.49].
3 Conversion from energy to CO2 with IPCC emission factors [2, p. 17] Approx. 100,000 kg CO2/TJ
CO2EXIDE
Deliverable Fehler! Verweisquelle konnte nicht gefunden werden. Potential of green CO2 sources Page 5 of 41
for ethylene synthesis
GA No.: 768789 (H2020-SPIRE-2017) Version Fehler! Ver-
weisquelle konnte
nicht gefunden wer-
den., 07/04/21There are several liquid biofuels like biodiesel, biogasoline and bio jet kerosene but especially
during the fermentation process resulting in bioethanol, a considerable CO 2 amount is pro-
duced. Concurrent to the stoichiometric equation, the gas produced during the fermentation
consists of up to 99-100% CO2. [20]
Basic equation of ethanol fermentation: C6H12O6 → 2 C2H5OH + 2 CO2
Carbon dioxide from bioethanol production is pure enough to be directly utilized in the food
and beverage (FAB) industry, e.g. as carbon acid in beverages [21] and it can be expected
that it fulfils fundamental requirements for the production of ethylene oxide as well.
There are regulations for the quality of food grade carbon dioxide released by the European
Industrial Gases Association (EIGA) [22] and the International Society of Beverage Technolo-
gists (ISBT) [23] as presented in Table 2-1. The aforementioned regulations are strict, however
for some impurities like water, O2, hydrocarbons and CO the limitations are not as demanding
as for CO2 gases for the chemical industry according to EN ISO 14175: C1. As examples on
the purity requirements for CO2, the product data sheets from e.g. the Linde Group could po-
tentially be taken into account: BIOGON® C flüssig E290 - Kohlendioxid 3.0 [24] for food grade
CO2 and Kohlendioxid 4.5 [25] for chemical industry CO2. Depending on the requirements for
the ethylene and ethylene oxide synthesis, further purification of the food grade CO 2 or CO2
for chemical industry may be needed, for example by activated carbon technologies [26, 27].
The requirements of CO2 input for the ethylene synthesis will be evaluated within the preceding
work packages of the current project.
Table 2-1: EIGA limiting characteristics for CO2 to be used in beverages.
Component Concentration
Assay 99.9% v/v min.
Moisture 20 ppm v/v max.
Ammonia 2.5 ppm v/v max.
Oxygen 30 ppm v/v max.
Oxides of Nitrogen (NO/NO 2) 2.5 ppm v/v max. each
Non-volatile residue (particulates) 10 ppm w/w max.
Non-volatile organic residue (oil and grease) 5 ppm w/w max.
Phosphine (only for CO2 from phosphate rock 0.3 ppm v/v max.
sources)
Total volatile hydrocarbons (calculated as me- 50 ppm v/v max. of which 20 ppm v/v max.
thane) non-methane hydrocarbons
Acetaldehyde 0.2 ppm v/v max.
Aromatic hydrocarbon 0.02
Carbon monoxide 10 ppm v/v max.
Methanol 10 ppm v/v max.
CO2EXIDE
Deliverable Fehler! Verweisquelle konnte nicht gefunden werden. Potential of green CO2 sources Page 6 of 41
for ethylene synthesis
GA No.: 768789 (H2020-SPIRE-2017) Version Fehler! Ver-
weisquelle konnte
nicht gefunden wer-
den., 07/04/21Hydrogen cyanide (only for CO2 from coal gasifi- 0.5 ppm v/v max.
cation sources)
Total sulfur (as S for total content 0.1 ppm v/v max.
< 0.1 ppm v/v)4
Taste and odor in water No foreign taste or odor
Appearance in water No color or turbidity
Odor and appearance of solid CO2 (snow) No foreign odor or appearance
Source: European Industrial Gases Association (EIGA) [cf. 22, p. 11]
An important aspect to be considered is the fact, that the FAB industry offers possible compet-
ing utilization pathways for CO2 especially from industrial bioethanol production. According to
ePURE bioethanol producers in Europe commercialized 0.4 Mt CO2 utilization in 2016 [3]. The
estimations within this project based upon the information available on the producers’ websites
[4, p. 17] and upon some approximations from ethanol outputs indicate the amount of 1.52 Mt
CO2/year, which is possibly commercialized by the European bioethanol producers in the mid-
term future.
2.2.1.1 CO2 potential from bioethanol industry in Europe
The total amount of CO2 produced during bioethanol fermentation is approximately 4.3 Mt
CO2/year according to production statistics from 2016. Most European bioethanol fermentation
plants are based in France (17) followed by Germany (8) and the UK (5). Other European
countries have none or up to 3 plants. In total there are around 57 plants in Europe of which
43 are present in the European Union. [1, based on 3, 4, p. 17] The total installed production
capacity for bioethanol in Europe is about 6.3 billion litres a year while the total production
accounts for 5.2 billion litres in the year 2016 [3].
The approximated theoretical amount of CO2 produced in the European industrial bioethanol
industry in 2016 is summarized in Figure 2-2.
4If total sulphur content > 1 ppm v/v, then: Carbonyl Sulphide 0.1 ppm v/v max., Hydrogen Sulphide
0.1 ppm v/v max., Sulphur Dioxide 1.0 ppm v/v max.
CO2EXIDE
Deliverable Fehler! Verweisquelle konnte nicht gefunden werden. Potential of green CO2 sources Page 7 of 41
for ethylene synthesis
GA No.: 768789 (H2020-SPIRE-2017) Version Fehler! Ver-
weisquelle konnte
nicht gefunden wer-
den., 07/04/21Figure 2-2: Amount of CO2 produced in the bioethanol industry of the EU in 2016 including
amount of possibly commercialized CO2 according to projections.
Carbon Dioxide [million tons / year] from bioethanol fermentation for the EU
1,52 Commercially utilized (projection)
35,4%
Further potential bioethanol (Carbon
Dioxide utilization unkown)
2,78
64,6%
Total: 4.30 Mt/y
Source: own illustration Energieinstitut [based on data from 3, and 4, p. 17]
According to ePURE [3], FAB and other industries represent 11% each of the European indus-
trial bioethanol consumption. The remaining 78% are used as fuel. The possibilities to yield
CO2 “end-of-pipe” from the ethanol utilisation pathway in the FAB and other industries is com-
plex and consequently relatively unattractive. Similarly, while gaining CO2 from ethanol flue
gases would theoretically be possible, it is technically and economically not feasible at the
current stage since bioethanol is usually used as component of vehicle fuel.
2.2.1.2 Global CO2 potential from bioethanol industry
The global bioethanol production however is much higher and accounted for 78 billion litres
bioethanol produced in 2014. The European fraction is only 8.4%, comparing ePURE figures
from 2014 [28, p. 2] to the 2014 global production. Industrial bioethanol from America account
for the biggest amount with 88% market share, while Asia ranks similar as Europe, followed
by Oceania and Africa. Since CO2 from bioethanol is very pure and the capture process rela-
tively simple, establishing ethylene and ethylene oxide production in North and South America,
where large bioethanol production sites can be found, is basically an option for further consid-
eration of a broad technology roll out of the CO2-based electrosynthesis of ethylenoxide.
.
CO2EXIDE
Deliverable Fehler! Verweisquelle konnte nicht gefunden werden. Potential of green CO2 sources Page 8 of 41
for ethylene synthesis
GA No.: 768789 (H2020-SPIRE-2017) Version Fehler! Ver-
weisquelle konnte
nicht gefunden wer-
den., 07/04/21Fermentation processes in the industry
In addition to the CO2 deriving from bioethanol industry, CO2 from fermentation processes in
the FAB industry, like brewing processes, are of interest. In the beverage industry mainly beer
brewing and wine production lead to considerable CO2 amounts. Furthermore, the fermenta-
tion of acids, e.g. citric acid, produces considerable amounts of CO2.
According to [6] 41.1 billion litres of beer were brewed in Europe in 2016. Using an average
value of 5 vol.-% of alcohol and 5 g/l carbon acid for beer, it can be estimated that 35 g CO2/l
are released during the fermentation process. [29, 30] According to the European annual beer
production, approximately 1.44 million tons of CO2 are released. The CO2 amounts, which can
be utilized, are smaller, since approximately 5,845 out of 8,130 European breweries in 2015
were so called microbreweries with an annual beer output of maximum 1,000 hl [6], which
corresponds to approximately 3.5 t CO2/year. Therefore, the technical effort is quite high to
gather large CO2 amounts. Furthermore, some breweries already utilize their own CO2 as pro-
tective gas for filling. [31, 32] Therefore, most of the CO2 is not applicable for CCU (Carbon
Capture and Utilisation) processes.
A comparable estimation could be conducted for the CO2 potential from fermentation in Euro-
pean wine production. The average value of the European wine production is approximately
17 billion liters of wine annually. [5] The average alcohol content is 11 vol.-% while the carbon
acid content is quite low, around 1 g/l, which correspond to approximately 87 g CO2/l released
during the production process. [33, 34] The carbon acid amount depends on the type of wine.
Especially red wine has a very low content and gets decarbonated very often, while the car-
bonation of white wines and sparkling wines is quite common. The annual CO 2 amount, esti-
mated from the previous average values, is 1.48 million tons CO2 for the EU wine industry.
Similar to beer brewers, wine producers protect their wine against air using CO2 or use it for
carbonation and in practice this CO2 is not available for chemical syntheses. The small scaled
structure of producers this sector is another barrier for implementation of CCU.
2.3 Gaseous biofuels
Gaseous biofuels are defined here according to Eurostat:
Biogas is a gas composed principally of methane and carbon dioxide produced by an-
aerobic digestion of biomass or by thermal processes from biomass, including biomass
in waste. In energy statistics, biogas is a product aggregate equal to the sum of landfill
gas, sewage sludge gas, other biogases from anaerobic digestion and biogases from
thermal processes. [16]
There are in principle two ways of utilizing CO2 from biogas, independently of the source of the
biogas. Firstly, biogas consists approximately of 60% methane and 40% carbon dioxide. [35,
CO2EXIDE
Deliverable Fehler! Verweisquelle konnte nicht gefunden werden. Potential of green CO2 sources Page 9 of 41
for ethylene synthesis
GA No.: 768789 (H2020-SPIRE-2017) Version Fehler! Ver-
weisquelle konnte
nicht gefunden wer-
den., 07/04/21based on 36] Therefore, biogas upgrading to biomethane offers a large potential for the gen-
eration of biogenic CO2. Furthermore, the combustion of biogas and biomethane generates
CO2 as a compound of the flue gas during the generation of heat and power. The following
chapters will give an overview of both basic possibilities.
CO2 from biogas upgrading
2.3.1.1 Biogas upgrading in Europe
In end 2016 there were about 17,662 biogas plants in Europe existing, while about 497 up-
grading plants were installed in Europe at early 2017 [7]. Figure 2-3 gives an overview of the
number of biogas plants per country in Europe in 2015. Since then the distribution changed
marginally.
Figure 2-3: Biogas plant distribution in Europe in 2015
Source: European Biogas Association (EBA) [37]
In 2016 /2017 for example countries like the UK [38], Poland [39], Denmark [40], Norway [41],
Lithuania [42], Greece [43–46], Slovenia [47, p. 177] and Serbia [48] expanded their biogas
capacities. For Italy different numbers are available from the World Biogas Association [49] to
the ones from the European Biogas Association. The updated numbers are listed in Table 2-
2.
CO2EXIDE
Deliverable Fehler! Verweisquelle konnte nicht gefunden werden. Potential of green CO2 sources Page 10 of 41
for ethylene synthesis
GA No.: 768789 (H2020-SPIRE-2017) Version Fehler! Ver-
weisquelle konnte
nicht gefunden wer-
den., 07/04/21Table 2-2: Collection of updated data on number of biogas plants in some European
countries.
Country Number of biogas plants (update)
Italy 1,924 (2015)
United Kingdom 578 (2017)
Poland 301 (2016)
Denmark 166 (2017)
Norway 138 (2016)
Lithuania 47 (2017)
Greece 36 (2017)
Slovenia 32 (2016)
Serbia 14 (2017)
Sources are listed in the passage above.5
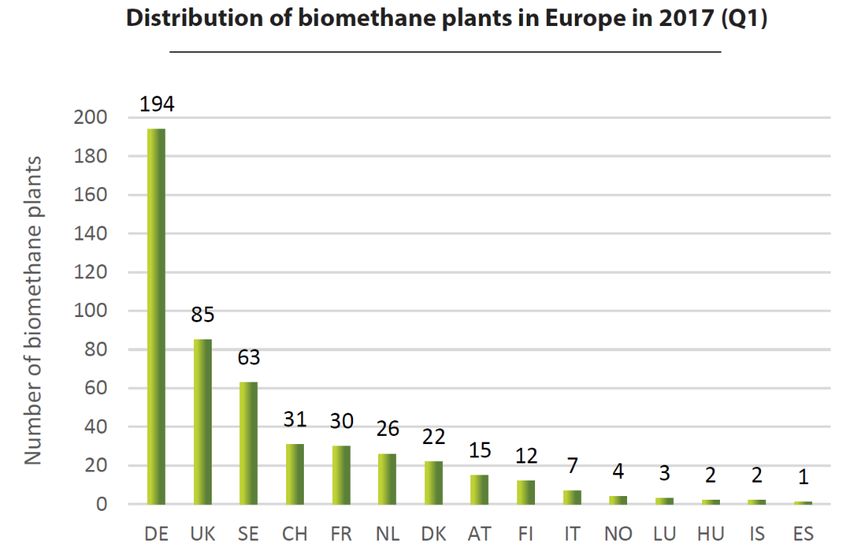
In 2018 the European Biogas Association (EBA) and Gas Infrastructure Europe (gie) in collab-
oration with several partners published the European Biomethane Map 2018 [7], which in-
cludes detailed data from all known European biogas upgrading plants. According to the map,
Germany, the United Kingdom and Sweden are pioneers on the field, in terms of the number
of upgrading plants, as can be seen in Figure 2-4. Comparing Figure 2-3 and Figure 2-4 it
becomes clear, there is still a huge potential for biogas upgrading, which also results in a huge
potential for CCU for CO2 from biogas by combining it with the biogas upgrading wherever
surrounding conditions would allow for.
5Data underlie constant change and are only an orientation guide for the development of European
biogas economy and implementation of CCU. Eventually there are more countries with changed num-
ber of plants compared to 2015, which are not listed here due to insufficient public data
CO2EXIDE
Deliverable Fehler! Verweisquelle konnte nicht gefunden werden. Potential of green CO2 sources Page 11 of 41
for ethylene synthesis
GA No.: 768789 (H2020-SPIRE-2017) Version Fehler! Ver-
weisquelle konnte
nicht gefunden wer-
den., 07/04/21Figure 2-4: European country ranking according to the number of biogas upgrading plants in
early 2017
Source: European Biogas Association (EBA) [7].
Since not only the number of biogas and biomethane plants is of interest but the CO2 potential
in specific, annual CO2 amounts deriving from biogas and biomethane production in Europe
are presented here. The numbers include the CO2 potential from the biogas composition (~
40 vol.-% CO2) and biogas upgrading (~ 99 vol.-% CO2) and exclude the CO2 emitted during
the combustion of biogas in a CHP facility or utilisation of upgraded biomethane. Figure 2-5
and Figure 2-7 show the approximated cumulative CO2 potential in 2016 in the European Union
for biogas and biomethane plants. Figure 2-6 shows the CO2 potential from biogas production
per country for whole Europe. The minor difference in the volumes between Figure 2-5 and
Figure 2-7 is originating from different primary data sources. Germany is in first place for most
biogas produced except for landfill gas for which the UK accounts for the biggest present
amounts. Biogas from thermal processes account for a very small amount of CO2 and is mostly
based in Finland.
CO2EXIDE
Deliverable Fehler! Verweisquelle konnte nicht gefunden werden. Potential of green CO2 sources Page 12 of 41
for ethylene synthesis
GA No.: 768789 (H2020-SPIRE-2017) Version Fehler! Ver-
weisquelle konnte
nicht gefunden wer-
den., 07/04/21Figure 2-5: Cumulative CO2 potential from biogas production
Carbon Dioxide [million tons / year] from biogas production for the EU
(additionally including Iceland, Norway, Switzerland)
2,03 0,11
8,76% 0,48% Biogases from fermentation in general
Landfill gas
3,73 Sewage sludge gas
16,13%
Biogases thermal processes
17,28
74,63%
Total: 23.15 Mt/y
Source: own illustration Energieinstitut based on Eurostat data on EU biogas production in 2016 [1]
CO2EXIDE
Deliverable Fehler! Verweisquelle konnte nicht gefunden werden. Potential of green CO2 sources Page 13 of 41
for ethylene synthesis
GA No.: 768789 (H2020-SPIRE-2017) Version Fehler! Ver-
weisquelle konnte
nicht gefunden wer-
den., 07/04/21Figure 2-6: CO2 potential from biogas production per country
Total CO2 from biogas [million tons] per country in Europe in 2016
Sweden Finland Latvia Hungary
0,24 0,16 Greece
0,13 0,12
1% 1% 0,14
Belgium 1% 1%
1%
0,32 Portugal
1% Denmark Slovakia
0,30 0,21 0,11
1% 1% 0%
Spain
Poland 0,34 Other < 0,1
0,36 1%
2%
Austria
0,44
2%
Netherlands
0,44
2% Turkey
0,49
2%
France Germany
Czech Republic 1,06 11,29
0,84 4% 48%
4%
Italy
2,61
11%
Total: 23.75 Mt/y United Kingdom
3,63
15%
Source: own illustration Energieinstitut based on Eurostat data on European biogas production in 2016
[1]
As illustrated in Figure 2-7 the approximated CO2 potential from biomethane upgrading repre-
sents only 14% of the cumulated CO2 from biogas production still excluding the CO2 emitted
during utilisation (combustion of biogas in a CHP facility or utilisation of upgraded biomethane
in different applications – heat, electricity or transport).
CO2EXIDE
Deliverable Fehler! Verweisquelle konnte nicht gefunden werden. Potential of green CO2 sources Page 14 of 41
for ethylene synthesis
GA No.: 768789 (H2020-SPIRE-2017) Version Fehler! Ver-
weisquelle konnte
nicht gefunden wer-
den., 07/04/21Figure 2-7: CO2 potential in 2016 from biomethane upgrading as part of total CO 2 potential from
biogas production.
Carbon Dioxide [million tons / year] from biomethane production for the EU
(additionally including Iceland, Norway, Switzerland)
3,14
14%
Biomethane upgrading
Biomethane upgrading
(CO2 utilization unknown)
Further potential
Further potentialCO 2 from biogas
biogas
20,01
86% Total: 23.15 Mt/y
Source: own illustration Energieinstitut based on data from [7]
2.3.1.2 Global potential of biogas upgrading
According to data from the WBA [19, p. 59] in 2014 approx. 1.2 EJ biogas were produced
globally. This accounts for a potential of around 40 Mt CO2 from biogas production assuming
the CO2 content of approximately 40% and the biogas heating value of
21.6 MJ/Nm3 / 6 kWh/Nm3. Around 50% of the global biogas is produced in Europe, while Asia
accounts for a third and America for roughly 17%.
CO2 from combustion of biogas and biomethane
During the combustion of biogas and biomethane, besides to some trace compounds, mainly
CO2 and water are produced. The exact amounts depend on the composition of the fuel gas
and the air supply during the combustion. Therefore, only approximate carbon dioxide amounts
can be given.
2.3.2.1 CO2 potential from biogas and biomethane combustion in Europe
In 2016 approx. 695 PJ of biogas were produced in the EU according to Eurostat [1]. Taking
data from the EBA [8] into account, 62 PJ biomethane were produced in 2016. This is equal to
CO2EXIDE
Deliverable Fehler! Verweisquelle konnte nicht gefunden werden. Potential of green CO2 sources Page 15 of 41
for ethylene synthesis
GA No.: 768789 (H2020-SPIRE-2017) Version Fehler! Ver-
weisquelle konnte
nicht gefunden wer-
den., 07/04/218.9% of the total biogas production. Therefore, 633 PJ or approximately 26.5 billion m³ of bio-
gas6 are utilized in CHP and other plants, while the remaining part is upgraded. The above
estimations are based on the gas composition of 60 vol.-% methane and 40 vol.-% CO2. There-
fore, with an air–fuel equivalence ratio λ = 1, around 15 vol.-% CO2 in the flue gas are possi-
ble.7 Consequently, it can be deduced that around 178 billion m³flue gas (wet) are produced annu-
ally, containing roughly 26.5 billion m³ of CO2. This is equal to 52.5 million tons of CO2 per
year8, considering a density of 1.98 kgCO2/m³CO2.
The upgraded biogas is injected into the gas grid in most cases. Therefore, in practice, the
CO2 deriving from the combustion of biomethane is not available for CCU, unlike the CO2 sep-
arated during the upgrading process. In 2017, 73 of 497 biomethane upgrading plants in Eu-
rope were not connected to the gas grid [7]. At these plants the biomethane is directly utilized,
which means in some cases the CO2 from combustion could be potentially harnessed for the
electrochemical synthesis, except for places where the biomethane is used as biofuel for motor
vehicles. In the latest Statistical Report of EBA [51, p. 10] the development of several incen-
tives to increase the use of upgraded biogas as a fuel are presented. Especially in Sweden
(88%) and Finland (25%) large amounts of the national production are already used as fuel for
vehicles. Other countries like e.g. Estonia, Norway and Italy are planning to strengthen this
utilization pathway in the upcoming years.
2.3.2.2 Global CO2 potential from biogas and biomethane combustion
Taking the global biogas production of 1.2 EJ for 2014 into account, around 110 Mt CO2/year
are released by biogas combustion. The conversion considers a CO2 fraction of 40 vol.-% of
the biogas and the CO2 from combustion, which leads to an emission factor of
91.5 g CO2/MJLHV. Basing the calculations on the emission factor from IPCC 2006 [2, p. 17],
which is equal to 54.6 g CO2/MJLHV and is based on the calorific value, 65.5 Mt CO2/year are
released. The 65.5 Mt CO2/year do not include the 40 vol.-% CO2 fraction from biogas produc-
tion but only CO2 from combustion of biogas (approx. 40 vol.-% CO2, 60 vol.-% CH4). Summing
up the latter and the CO2 amount from biogas upgrading, which corresponds to the 40% CO2
6
Converted with higher heating value of 6.64 kWh/m³
7 Calculations with pdf-sheet "Verbrennung gasförmiger Brennstoffe“ from Lehmacher
8
Stoichiometric calculation with pure oxygen as reagent for comparison: 49.6 million tons CO 2 per
year. Source: Own calculation.
CO2EXIDE
Deliverable Fehler! Verweisquelle konnte nicht gefunden werden. Potential of green CO2 sources Page 16 of 41
for ethylene synthesis
GA No.: 768789 (H2020-SPIRE-2017) Version Fehler! Ver-
weisquelle konnte
nicht gefunden wer-
den., 07/04/21fraction (see Chapter 2.3.1.2), it can be calculated the comparable order of magnitude that
around 110 Mt CO2/year are emitted. This is the same as using 91.5 g CO2/MJLHV as emission
factor. Small deviations derive from different data sources and rounding errors.
Biogas substrates
Biogases from anaerobic digestion derive from biogas plants with highly different biomass
feedstock. Table 2-3 provides an overview of possible compounds of biogas substrates. Most
plants are supplied with varying mixtures of substrates. Some substrates demand special treat-
ment and plant design. Depending on the substrates, the composition of the biogas, concern-
ing methane and CO2 concentrations and trace compounds, varies. Since the CO2 stream
needed for the electrochemical ethylene synthesis ideally is highly pure, some biogas sub-
strates may be not suitable for this application without extensive purification processes of the
potentially utilised CO2.
Table 2-3: Selection of possible substrates for biogas plants.
Category Possible feedstocks
Agricultural energy crops maize silage
sugar beet silage
silage from different grains
crop residues in general
manure pig
cow
sheep
poultry
FAB industry liquor industry grain stillage
potato stillage
sugar and starch industry sugar beet residues
beverage industry fruit pomace
food industry production residues
slaughter waste and blood
dairy residues
Waste indus- municipal renewable waste
try
industrial renewable waste
sewage sludge
production residues leather
CO2EXIDE
Deliverable Fehler! Verweisquelle konnte nicht gefunden werden. Potential of green CO2 sources Page 17 of 41
for ethylene synthesis
GA No.: 768789 (H2020-SPIRE-2017) Version Fehler! Ver-
weisquelle konnte
nicht gefunden wer-
den., 07/04/21Textile indus- fur
try biological textiles
Wood indus- panels and furniture wood residues
try
paper industry paper and cardboard residues
pulp residues
Source [based on 52, p. 17, 53]
According to the Statistical Report of EBA 2017 [51, pp. 7-8] the feedstock use for biogas
production differs for every country. Using the substrates mass percentage as an indicator for
biogas production excluding landfill gas), energy crops are the main substrates in Latvia, Aus-
tria and Germany while in Greece, Cyprus, France, Serbia, Poland and Italy agricultural resi-
dues are the main feedstock. In the UK, Finland, Sweden, Spain, Denmark and especially in
Switzerland [51, p. 31], sewage accounts for the largest share. In some countries like Belgium,
Croatia and Hungary the distribution is more even.
Considering landfill gas, the statistics shift. Estonia covers about a third of its feedstock origin
with landfill waste. [51, p. 51] Two thirds of the produced biogas in Greece is landfill gas [51,
p. 56] and for Norway it is almost the half [51, p. 92]. Portugal is exceptional in using landfill
gas, since it accounted for over 95% of produced biogas in 2016 [51, p. 99]. Other countries
making significant use of landfill gas are the UK, Sweden, Romania, Poland, Ireland, France
and Finland.
Figure 2-8 is compiled based on data from EBA [51, p. 7] and shows the share of feedstock
use for biogas according to substrate mass percentages and electricity production per sub-
strate in each country for Europe. Agricultural wastes and energy crops represent the highest
share with 39% each, followed by “other”, which includes organic waste from households and
industry, sewage, FAB and bio-waste/municipal waste. Sewage is underestimated according
to EBA.
CO2EXIDE
Deliverable Fehler! Verweisquelle konnte nicht gefunden werden. Potential of green CO2 sources Page 18 of 41
for ethylene synthesis
GA No.: 768789 (H2020-SPIRE-2017) Version Fehler! Ver-
weisquelle konnte
nicht gefunden wer-
den., 07/04/21Figure 2-8: “Estimation of relative significance of each feedstock in the biogas industry in Eu-
rope in 2016
Significance of each feedstock in the biogas industry in Europe in 2016
4%
4% Energy Crops
5%
Agricultural residues
9%
39%
Other
Sewage
Bio-waste, municipal waste
Industrial (FAB)
39%
Source: own illustration Energieinstitut based on feedstock mass percentages and electricity production
per feedstock in each country […].” [51, p. 7] The share of sewage sludge is underestimated due to
missing information on the share of sewage sludge for some countries. The diagram is adapted from
Figure 9-EU of the Statistical Report 2017 from EBA [51, p. 7].
The main substrates by mass percentage excluding landfill gas for current biomethane plants
are slightly different to the main substrates for biogas in general. Especially bio- and municipal
waste, agricultural residues and to some extent unknown feedstocks are of major relevance.
In Germany most biomethane plants base on energy crops, followed by agricultural residues
and bio-/municipal waste, while in the UK “other” (municipal waste etc.) and agricultural sub-
strates play the biggest role. These two countries are the ones with most biomethane plants
(see Figure 2-4). For Sweden, which ranks third among European countries with the most
biomethane plants, “other” and sewage are the feedstock for most biomethane plants. [51, p.
106]
Composition of biogas
Depending on the substrates, the plant system, operating temperature and various other pa-
rameters, different trace compounds can be found in biogas resulting from biological processes
in anaerobic digestion. Typical impurities are water vapour, O2, N2, NH3, H2, H2S, siloxanes
and biogas specific VOCs. [52, p. 41, 54, p. 33] Table 2-4 provides a more detailed overview
of possible impurities and their typical concentrations in the biogas.
CO2EXIDE
Deliverable Fehler! Verweisquelle konnte nicht gefunden werden. Potential of green CO2 sources Page 19 of 41
for ethylene synthesis
GA No.: 768789 (H2020-SPIRE-2017) Version Fehler! Ver-
weisquelle konnte
nicht gefunden wer-
den., 07/04/21Table 2-4: Detailed overview of biogas components.
Components Concentration range
Main components
Methane (CH4) 50 - 70 mol.-%
Carbon dioxide (CO2) 30 – 50 mol.-%
Nitrogen gas (N2) 0 – 3 mol.-%
Oxygen (O2) 0.0 – 0.5 mol.-%
Hydrogen (H2) 0.0 – 1.5 mol.-%
Water vapor (H2O) 1 – 7 mol.-%
Carbon monoxide (CO) 0 – 1 mol.-%
Trace components
Ammonia (NH3) 0 – 308 ppm(mol)
Hydrogen sulphide (H2S) 20 – 850 ppm(mol)
Terpenes 0 – 500 ppm(mol)
Benzene, Toluene, Xylene (BTX) 0 – 7 ppm(mol)
Hydrocyanic acid (HCN) 0 – 0.003 ppm(mol)
Fluorine compounds (R-F, incl. HF) 0 – 1.3 ppm(mol)
Chlorine compounds (R-Cl, incl. HCl) 0.1 – 5 ppm(mol)
Siloxanes (D4 & D5) 0 – 3.4 ppm(mol)
Source: adapted from [55, p. 5]
Rasi et al. give an even more detailed overview of biogas components, depending on the uti-
lised substrates for biogas production. [56] Especially landfill gas often contains high amounts
of H2S and VOCs. Additionally – for example for industrial wastes – several potentially hazard-
ous trace compounds can be part of the landfill gas, for example fluorinated and chlorinated
hydrocarbons, aromatic compounds, and higher hydrocarbons. [57] Other common trace com-
pounds are siloxanes, which are also present in sewage sludge gas, since siloxanes are orig-
inating e.g. from ingredient for cosmetics, soaps and detergents. Depending on the substrate
also agricultural biogas plants can produce biogas with a very high H2S content, for example
deriving from manure feedstock. [58]
Upgrading technologies for biogas
There are several upgrading technologies for biogas available: water scrubbing, amine scrub-
bing, pressure swing adsorption (PSA), physical scrubbing, chemical scrubbing, membrane
separation and cryogenic separation. [7, 54, p. 33, 59] Since biogas upgrading aims mainly on
the separation and purification of the methane content in the biogas, trace compounds are
often removed together with the CO2 stream as can be seen in Figure 2-9. Consequently, the
CO2 stream may contain considerable amounts of impurities and is potentially not suitable for
most utilization applications for chemical synthesis without further treatment.
CO2EXIDE
Deliverable Fehler! Verweisquelle konnte nicht gefunden werden. Potential of green CO2 sources Page 20 of 41
for ethylene synthesis
GA No.: 768789 (H2020-SPIRE-2017) Version Fehler! Ver-
weisquelle konnte
nicht gefunden wer-
den., 07/04/21product gas
H2S
NH3, VOC, N2
product gas
O2 Membrane permeate
H2S, H2O Separation (CO2-stream)
O2, N2, H2 Amine
Scrubber
H2S, NH3
CO2-stream
product gas
VOC
Organic H2S Condensate
Physical
O2, N2, H2
Scrubber product gas
VOC, H2S, NH3 stripper air
H2O Water
product gas O2, N2 Scrubber
VOC, H2S stripper air
NH3
H2
N2
PSA CO2-stream H2S H2O bleed
VOC, H2S
NH3, O2
Figure 2-9: Some exemplary paths of impurities from biogas upgrading technologies
Source: own illustration Energieinstitut based on Hoyer et al. [54, p. 33, Fig. 12]
According to [51, p. 13] most current upgrading plants use water scrubbers, followed by chem-
ical absorption, PSA, membrane separation and physical absorption. In Germany, the Euro-
pean country with most upgrading plants, all upgrading technologies are represented, chemical
absorption and water scrubbing however are each implemented in 30% of the plants, PSA in
22% of the plants. In Sweden, ranked number three among European biomethane countries,
69% of the biomethane plants use water scrubbers, followed by chemical absorption, PSA and
membrane separation. [51, p. 14] For the UK, ranked number two, no information on upgrading
technologies is available. [51, p. 115] The only European countries known for implementing
physical absorption are Germany, Norway and Switzerland. Combining this information with
the path of impurities according to Figure 2-9 most CO2 from upgrading plants requires further
purification before it can be utilized as raw material for electro synthesis of ethylene oxide.
The available CO2 concentration in biogas upgrading off gases depends on the applied up-
grading technology. In processes like membrane separation, amine scrubbing and pressure
swing adsorption, relatively high CO2 contents are reached in the off gas streams (typicallyOn the other side, processes that involve stripping with air like the pressurised water scrubbing
produce more dilute CO2 off gases. This means that CO2 from such processes would need
further gas upgrading steps in order to get rid of air components and increase the CO2 content.
A review on upgrading technologies for biogas to biomethane from Vijayanand and Singara-
velu [60] gives an overview especially for CO2 separation techniques for biogas, as well as
Singhal et al. [61] for the transformation of biogas to biological compressed natural gas (bio-
CNG). A comprehensive review on biogas generation factors, enhancements of biogas pro-
duction techniques, upgrading and cleaning techniques offer Al Mamun and Torii [62] as well
as Andriani et al. [63] and Sun et al. [57]. Pellegrini et al. [64] gives an overview of the purifi-
cation costs of biogas, depending on the source of biogas.
A relatively new technique for biogas upgrading is the cryogenic CO2 separation, which in-
volves many different process steps using very low temperature processes. One example,
resulting in partially food grade CO2, is the CO2 Wash® process developed by US based Acrion
Technologies. It applies the effect of impurities solubility in liquid CO2. After H2S removal and
drying, the biogas is mixed with liquid CO2. This process results in biomethane, food grade
CO2 and a CO2–VOC mixture as products. [59, pp. 56-58] Depending on the requirements for
the ethylene and ethylene oxide synthesis, further purification of the food grade CO 2 may be
needed, for example by activated carbon technologies. [26, 27]
A new technique of CO2 capture at room temperature using aqueous Na2CO3 is presented by
Barzagli et al. [65]. Chaemchuen et al. [66] and Cavenati et al. [67] present metal-organic
frameworks (MOFs) for upgrading biogas.
Not only since Carbon Capture and Storage (CCS) became more popular in recent time, but
also because of quality requirements of the chemical and food and beverage industry, purifi-
cation processes of the CO2 are of higher interest. Some impurities have corrosive properties
for example, which is a problem in transport and longtime storage [68], others are harmful to
chemical processes or toxic in terms of food and beverage industry. For CCU - or ethylene
synthesis and ethylene oxide synthesis in specific – not only because of transport but also for
the chemical conversion of the CO2and possible poisoning of electrochemical equipment, very
low impurity concentrations are required. CO2 purification processes are state-of-the-art pro-
cesses, but there is still much development work ongoing.
3 POTENTIAL SOURCES OF FOSSIL CO2
Though the CO2EXIDE approach is mainly targeting on biogenic, and therefore “green”,
sources for CO2 as feedstock material, the main emitters of carbon dioxide are based on fossil
CO2EXIDE
Deliverable Fehler! Verweisquelle konnte nicht gefunden werden. Potential of green CO2 sources Page 22 of 41
for ethylene synthesis
GA No.: 768789 (H2020-SPIRE-2017) Version Fehler! Ver-
weisquelle konnte
nicht gefunden wer-
den., 07/04/21fuels. Due to increasing interest in utilisation of CO2 to reach ambitious goals of decarbonisa-
tion and closed carbon cycles, these fossil sources will have to be partly considered as relevant
input sources as well. Therefore, this section is about to give a rough overview on potentially
available carbon sources and their relevance to the CO2EXIDE process chain.
In the same way as biogenic sources, fossil CO2 sources can be classified according to their
emitting processes and industry sectors. This classification is shown in Figure 3-1 below.
Figure 3-1: Classification of potential fossil CO2 sources including the available typical CO2 con-
centration
CO2 from combustion CO2 from the
CO2 as by-product from industrial processes
processes atmosphere
coal biogas upgrading ethylene cement ambient air
12 – 15 vol.-% 40 vol.-% 12 vol.-% 20 vol.-% 0.039 vol.-%
natural gas bioethanol ammonia iron & steel
3 – 10 vol.-% up to 100 vol.-% up to 100 vol.-% 15 vol.-%
fuel oil fermentation refineries
3 – 8 vol.-% up to 100 vol.-% 3 – 13% vol.-%
solid biofuel
3 – 8 vol.-%
Biotechnological Industrial production
biogas processes Chemical industry processes
8 – 15 vol.-%
Source: own illustration Energieinstitut based on data from [15]
The emissions of CO2 from fossil sources, especially from energy production and industry, are
mainly registered in the Emission Trading System of the European Union (EU ETS). Therefore,
the latest report data released by the European Commission in April 2018 was used as primary
data source [69]. As data for 2017 is incomplete in this report, year 2016 data was used as
reference for subsequent analysis.
3.1 Categorisation of fossil CO2 sources
The available data for verified emissions allows a classification of the emissions according to
their industrial sector. Since the given information is rather fine-grained and diverse, the data
was grouped to following main sectors:
• power & heat from fossil fuels; en- • production of glass & glass fibre
ergy industry chemical industry • pulp, paper & board
• iron & steel • other installations
• (other) metals processing • aircraft operator activities
CO2EXIDE
Deliverable Fehler! Verweisquelle konnte nicht gefunden werden. Potential of green CO2 sources Page 23 of 41
for ethylene synthesis
GA No.: 768789 (H2020-SPIRE-2017) Version Fehler! Ver-
weisquelle konnte
nicht gefunden wer-
den., 07/04/21• cement, clinker, lime, ceramics
This results in an allocation of verified emissions on those sectors as shown in Figure 3-2
below.
Figure 3-2: Total verified CO2 emissions in the EU per industry sector
Source: own illustration Energieinstitut based on data from [69]
Figure 3-2 clearly illustrates that on the one hand, the energy industry, and therefore the pro-
duction of power and heat from fossil fuels, is by far the main emitter of fossil CO2 in the Euro-
pean Union. On the other hand, it is the only sector that continuously shows significant reduc-
tions in absolute emissions over the last years. Nevertheless, the use of fossil fuels in the
energy sector has to be reduced substantially, or rather completely avoided, to achieve the
goals of GHG emission reduction by 80% to 90% compared 1990 levels as stated by the Eu-
ropean Commission [70]. Therefore, the utilisation of fossil CO2 from this sector is excluded in
the further analysis.
In this context, it also has to be stated that the mobility sector has not been investigated ac-
cording to its potential for serving as a carbon source for CO2-based process chains. This is
justified by the aspect that efficient capturing from the source is not expected to be feasible in
CO2EXIDE
Deliverable Fehler! Verweisquelle konnte nicht gefunden werden. Potential of green CO2 sources Page 24 of 41
for ethylene synthesis
GA No.: 768789 (H2020-SPIRE-2017) Version Fehler! Ver-
weisquelle konnte
nicht gefunden wer-
den., 07/04/21the mid-term with acceptable capture rates. Additionally, the high decentralisation of the emit-
ters makes an industrial usage of the captured CO2 unviable.
3.2 Centralisation of emissions as point sources
In order to establish a system, as it is developed in the CO2EXIDE project, in an industrial
scale, the centralised availability of resources is an important aspect. To maximise economic
and ecological advantages of such CO2-based applications, their operation near to carbon
emitting processes is highly preferable to reduce costs and efforts for transportation and stor-
age. To get an overview, which industry sectors provide highly centralised emissions of CO2,
average per site emissions have been evaluated based on the categorization and data de-
scribed above. The results are shown in Figure 3-3.
Figure 3-3: Average CO2 emissions in the EU per site and industry sector
Source: own illustration Energieinstitut based on data from [69]
Figure 3-3 illustrates the highly centralised CO2 emissions from iron & steel and chemical in-
dustry, providing an average amount of about 420 and 330 kilotons CO2 per year and site,
respectively. Another remarkable sector is represented by the cement industry (including
clinker, lime and ceramics production). While average emissions per site are well below the
CO2EXIDE
Deliverable Fehler! Verweisquelle konnte nicht gefunden werden. Potential of green CO2 sources Page 25 of 41
for ethylene synthesis
GA No.: 768789 (H2020-SPIRE-2017) Version Fehler! Ver-
weisquelle konnte
nicht gefunden wer-
den., 07/04/21two major ones, the number of sites in total is significantly higher, which would allow a more
distributed installation of CO2 utilising technologies and therefore be advantageous in site se-
lection.
With regard to these high amounts of centrally available CO2, together with the fact that many
industrial processes are highly established and efficient that are expected to be still available
in the mid-term, a consideration of these carbon sources for renewable products is at least
reasonable. This especially applies to the steelmaking and cement industry, where a decar-
bonisation of steel making would imply a complete revision of the process chain. Therefore,
these point sources should be considered as well when investigating resource potentials for
future CO2-based process chains at an industrial scale like electrochemical synthesis of eth-
ylene oxide.
4 CONSIDERATION OF TECHNOLOGICAL CAPTURE RATES
The amounts of CO2 discussed in the previous sections provide an overview on overall direct
emissions from different sources. To evaluate the real potentials for utilizable CO2, it has to be
considered that certain technologies for separation come with appropriate efficiencies limiting
the amounts of CO2 that can be captured and used. In the following sections, affordable cap-
ture rates and resulting utilisation values are analysed.
4.1 CO2 capture efficiencies for industrial processes
To get an overview on technically affordable capture rates for industrial processes an appro-
priate literature review was carried out on that topic. This review basically covers the industrial
sectors discussed in the previous sections. Since some of these sectors include various tech-
nologically different processes, the analysis was performed on a finer grained level, resulting
in a categorisation as provided in the table below.
Table 4-1: Categorization of CO2 providing industrial processes
Main industry sector Sub-category
power & heat from fossil fuels; en- coal
ergy industry
natural gas
energy industry
chemical industry refinery
ammonia production
other chemicals
iron & steel iron & steel
(other) metals processing (other) metals processing
cement, clinker, lime, ceramics cement, clinker, lime
CO2EXIDE
Deliverable Fehler! Verweisquelle konnte nicht gefunden werden. Potential of green CO2 sources Page 26 of 41
for ethylene synthesis
GA No.: 768789 (H2020-SPIRE-2017) Version Fehler! Ver-
weisquelle konnte
nicht gefunden wer-
den., 07/04/21ceramics by firing (bricks, tiles, …)
production of glass & glass fibre glass & glass fibre
pulp, paper & board pulp, paper & board
biogenic processes biogas upgrading
bioethanol (fermentation only)
bioethanol (fermentation & cogeneration)
The industrial processes covered by the categorisation in Table 4-1 are significantly different
from each other in terms of volume flows and purity of CO2 in their flue or by-product gases. In
addition, each process allows the use of one or more different capture technologies being
suitable for efficient separation, while efficiency often is a compromise between both, process
and capture efficiency. This results in highly different capture rates being technically and eco-
nomically achievable and therefore being actually used in existing processes and considered
state of the art. These results are summarized in Figure 4-1 showing determined ranges and
averages for selected processes.
CO2EXIDE
Deliverable Fehler! Verweisquelle konnte nicht gefunden werden. Potential of green CO2 sources Page 27 of 41
for ethylene synthesis
GA No.: 768789 (H2020-SPIRE-2017) Version Fehler! Ver-
weisquelle konnte
nicht gefunden wer-
den., 07/04/21Figure 4-1: Affordable capture rates for various industrial processes (ranges and average)
capture rates range capture rates avg.
100,0 91
90 88 88 90
87
90,0
77
80,0 73 72
CO2 capture rates in %
70,0
60,0
50,0
40,0
30,0
20,0
10,0
0,0
coal
refinery
natural gas
iron & steel
ammonia production
cement, clinker, lime
biogas upgrading
pulp, paper & board
bioethanol fermentation
Source: own illustration Energieinstitut based on data from [15, 71–81]
As it can be seen in Figure 4-1, not for all sub-categories listed in Table 4-1 appropriate values
for can be provided. This is on the one hand caused by the rough definition related to the
available data for the CO2 potentials which does not further specify the underlying process
(e.g. other chemicals, (other) metals processing). On the other hand, some processes and
industry sectors do not provide sufficient data to estimate appropriate capture rates (e.g. glass
& glass fibre production, ceramics by firing) or do not allow feasible CO2 capturing at all.
4.2 Resulting utilisation potentials for CO2
The capture potentials given in the previous section do significantly reduce the amount of CO2
being utilisable from the total amounts emitted. Presuming the average capture rates as shown
in Figure 4-1 the resulting potentials for CO2 from industrial sources are reduced to the
amounts shown in Figure 4-2.
CO2EXIDE
Deliverable Fehler! Verweisquelle konnte nicht gefunden werden. Potential of green CO2 sources Page 28 of 41
for ethylene synthesis
GA No.: 768789 (H2020-SPIRE-2017) Version Fehler! Ver-
weisquelle konnte
nicht gefunden wer-
den., 07/04/21Figure 4-2: Comparison of produced and theoretically utilizable CO 2 per industrial sector
1.400.000
1.200.583
1.200.000
CO2 produced
910.370
cumulated amount of CO2 in ktCO2/year
CO2 utilizable
1.000.000
800.000
600.000
400.000
198.659
160.024
127.796
114.456
110.034
80.691
200.000
26.312
18.912
2.794
2.431
327
295
0
1 2 3 4 5 6 7
Source: own illustration Energieinstitut
The capture efficiency also has impact on the utilisable CO2 emissions per site as shown in
Figure 4-3 according to the categorisation given in Table 4-1. It can be seen, that refinery and
ammonia production processes, followed by iron & steel and cement production, would provide
highest amounts on utilisable CO2 per site if fossil sources are taken into account. In contrast,
per site amounts for biogenic sources are rather low. Therefore, for large scale application of
carbon capture and utilisation, fossil processes should be considered as a potential source for
CO2, as long as there are no environmental drawbacks and it does not support or prolongate
the deployment of processes that can and should instead be substituted by renewable ap-
proaches.
CO2EXIDE
Deliverable Fehler! Verweisquelle konnte nicht gefunden werden. Potential of green CO2 sources Page 29 of 41
for ethylene synthesis
GA No.: 768789 (H2020-SPIRE-2017) Version Fehler! Ver-
weisquelle konnte
nicht gefunden wer-
den., 07/04/21You can also read