Review of the Contribution which Irish Racecourses make to the Horseracing Industry and the Finances of those Racecourses
←
→
Page content transcription
If your browser does not render page correctly, please read the page content below

Review of the Contribution which
                            Irish Racecourses make to the
                             Horseracing Industry and the
                            Finances of those Racecourses

                                     Petrus Consulting

                                      Brookfield House
                                      Carysfort Avenue
                                    Blackrock, Co. Dublin

                                                            September 2013
Institute of Management
Consultants and Advisors
   Registered Practice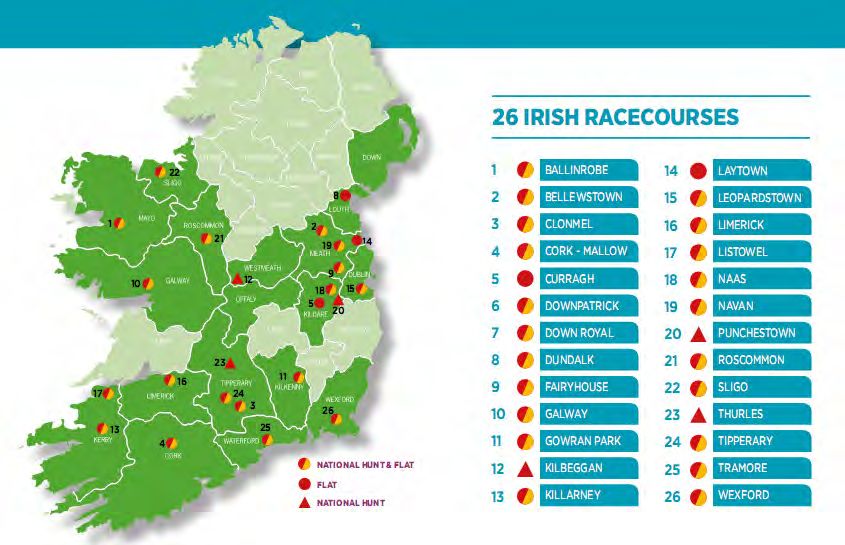
The Economic Contribution and Financing of Racecourses in Ireland

Petrus Consulting                                                                 2
The Economic Contribution and Financing of Racecourses in Ireland
CONTENTS PAGE
1. EXECUTIVE SUMMARY...................................................................................................................................... 4
2. TERMS OF REFERENCE AND METHODOLOGY .................................................................................................... 7
2.1. BACKGROUND ..................................................................................................................................................... 7
2.2. METHODOLOGY .................................................................................................................................................. 7
2.3. SCOPE OF THE REVIEW.......................................................................................................................................... 8
2.4. STRUCTURE OF THE REVIEW................................................................................................................................... 8
3. ECONOMIC CONTRIBUTION OF RACECOURSES.................................................................................................. 9
3.1. OVERVIEW ......................................................................................................................................................... 9
3.2. KEY TRENDS RELATING TO RACECOURSES................................................................................................................ 12
3.3. SERVICES PROVIDED AT RACECOURSES ................................................................................................................... 16
3.4. ECONOMIC INPUTS AND OUTPUTS RELATING TO RACECOURSES .................................................................................. 17
3.5. IMPACT ON LOCAL ECONOMIES: TOURISM .............................................................................................................. 19
3.6. EMPLOYMENT BY RACECOURSES .......................................................................................................................... 21
3.7. EMPLOYMENT IN THE OVERALL HORSERACING INDUSTRY ......................................................................................... 21
3.8. HORSERACING INDUSTRY EMPLOYMENT BY OCCUPATIONAL GROUP .......................................................................... 22
3.9. IMPACT ON HORSE BREEDING SECTOR .................................................................................................................. 24
3.10. PRIZE MONEY AND SPONSORSHIP ........................................................................................................................ 24
3.11. QUALITATIVE DATA FROM QUESTIONNAIRES .......................................................................................................... 25
4. FINANCIAL REVIEW OF RACECOURSES ............................................................................................................ 28
4.1. OVERVIEW OF RACECOURSE FINANCING ................................................................................................................ 28
4.2. ATTENDANCES .................................................................................................................................................. 29
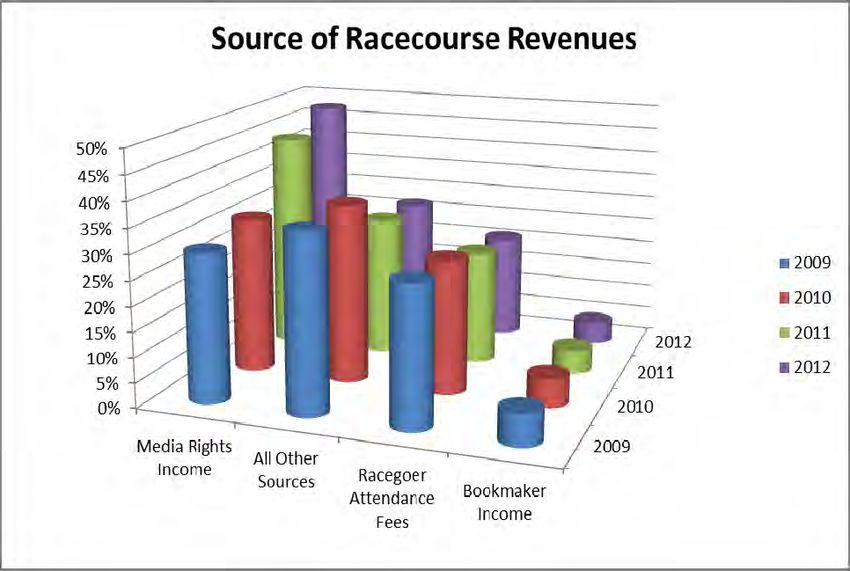
4.3. REVENUE STREAMS ............................................................................................................................................ 30
4.4. PROFITABILITY OF RACECOURSES .......................................................................................................................... 35
4.5. PUBLIC INFORMATION FILED WITH THE COMPANIES REGISTRATION OFFICE ................................................................. 35
4.6. RATIO ANALYSIS ................................................................................................................................................ 38
4.7. CAPITAL EXPENDITURE ‐ PAST AND FUTURE ........................................................................................................... 40
4.8. CASH FLOW IMPLICATIONS AND FUNDING FUTURE CAPITAL EXPENDITURE .................................................................. 40
4.9. TAXES AND CHARGES ......................................................................................................................................... 42
4.10. LAND AND BUILDINGS ........................................................................................................................................ 43
APPENDIX 1 LIST OF RACECOURSES ................................................................................................................. 44
Petrus Consulting 3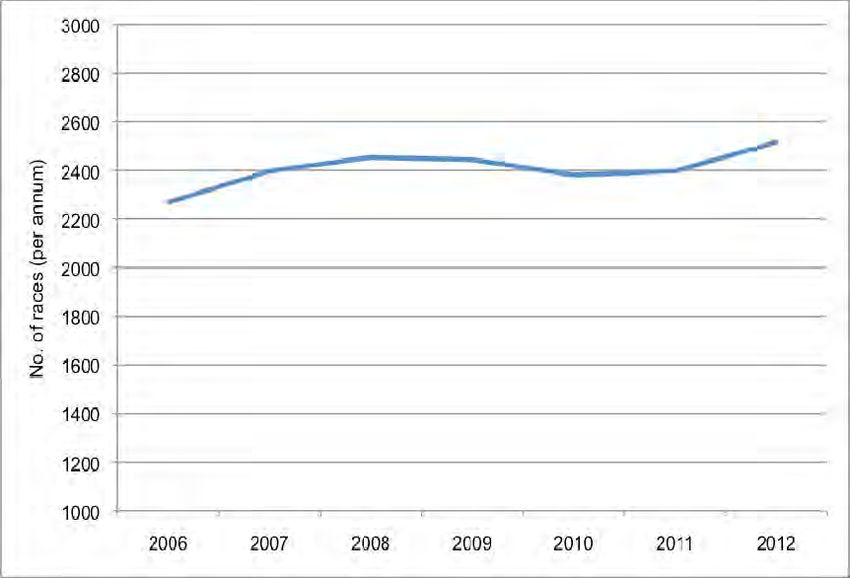
The Economic Contribution and Financing of Racecourses in Ireland

    1.   EXECUTIVE SUMMARY
    The horse racing and breeding sector contributes c. €1bn annually to the Irish economy; employs in excess of
    16,000 people and is responsible for exports worth €174m1.

    Racecourses are the critical element for horseracing to take place – without the well‐developed network of 26
    racecourses located in nineteen different counties on the island, which are capable of hosting both National
    Hunt and flat race meetings, horseracing in Ireland simply would not happen and the related economic
    activities such as training, horse breeding, and betting would either not be possible or would be seriously
    curtailed. In this sense, racecourses may be seen as the underlying ‘network infrastructure’ over which the
    spectacle of horseracing, with all its ancillary add‐on activities, is provided to the public.

    Key Indicators. ‐ In recent years, horseracing has seen significant declines in almost all the key indicators.
    Attendances have fallen by 18% between 2007 and 2012 with over 250,000 fewer attendances at meetings in
    2012 compared to 2007. On‐Course betting activity has fallen by over 50% and the number of racehorse
    owners and horses in training are down by about one third. However, there are some recent indications that
    the declines may have stabilized.

    Racecourses play an important part in Ireland’s tourism industry, with a number of racing festivals coinciding
    with peak holiday times within the country. As a result, racing festivals held at Irish racecourses have an
    important role to play in the development of tourism within the country by attracting attendance at race
    meetings from domestic sources and from overseas. A research study commissioned for Horse Racing Ireland
    (HRI) in 20092 estimated the annual expenditure in the economy by overseas visitors who attend race
    meetings in Ireland came to just over €67 million. The same study found that overseas visitors made up 9% of
    all attendees at race meetings in Ireland. The 2009 report commissioned by the Irish Thoroughbred Breeders’
    Association on the economic impact of the Irish Thoroughbred industry (‘the Dukes report’)3 estimated that
    the combined economic contribution of Irish racing festivals in 2008 totalled €260.6 million.

    Employment. ‐ Wages and salaries for full time, part time and casual staff amount to over €10 million
    annually. It is estimated that there are approximately 380 full time equivalent (FTE) jobs supported by
    racecourses directly and employment has remained stable over the 4 year period 2009 – 2012 but with a
    reduction of 15% in average employee cost. The figure of 380 FTEs is made up of 193 full time FTEs, 67 part
    time FTEs and 120 casual FTEs. On‐course and off‐course activities in areas such as training, breeding, catering,
    betting, regulation and transport, all have high employment content and are supported or enabled by the
    existence of the racecourses. The most recent figures from HRI for 2012 suggest that 16,000 people are
    employed in the overall horseracing, breeding, betting etc. sectors. Each job on the racecourse supports over
    40 jobs off the racecourse.

    Racecourses are only one part of the overall horseracing and breeding industry but, if it is accepted that
    racecourses are an essential precursor to all the related activities, then the direct employment on racecourses
    is critically important and has a very high multiplier effect for all the other related employment in the wider
    horseracing industry.

    Financial Assessment. – The overall assessment of the financial position of racecourses is that up until 2011
    they were loss making entities making negative returns on the assets and on capital employed. This situation
    was unsustainable without some change in the underlying business model. The change which has brought
    racecourses to a moderate level of profitability is the increase in media rights income. Debt levels were high
    but have reduced over the period. Racecourses would have been under pressure because of their relatively

1
  Horse Racing Ireland Factbook, 2012
2
  Overseas Visitors Quantitative Research 2008/09 Prepared August 2009 by Behaviour & Attitudes for Horse Racing
Ireland.
3
  Analysis of the economic impact of the Irish Thoroughbred Horse Industry, Directed by Alan Dukes, commissioned for
the         Irish       Thoroughbred            Breeders’       Association,        2009,        available       at:
http://www.goracing.ie/AssetLibrary/Files/HRI/Resource_Centre/Dukes%20Report%20%202009%20.pdf
    Petrus Consulting                                                                                            4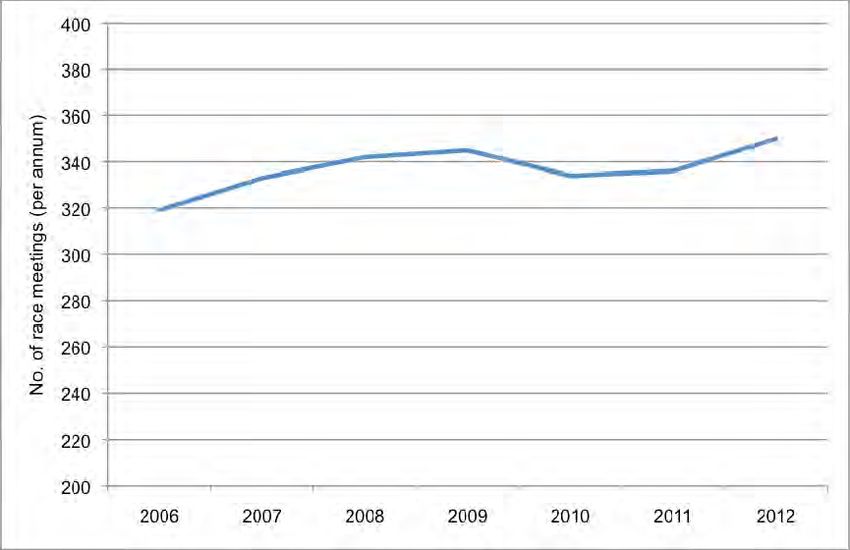
The Economic Contribution and Financing of Racecourses in Ireland

weak working capital position. The loss making position of earlier years has recently been overcome but the
level of profitability is still low. Racecourses do not pay dividends and any surplus is reinvested into the
racecourses for the benefits of all users.

Operating a racecourse is a capital intensive business which is generally loss making or earns low returns
which, if they are made, are reinvested for the future. The benefits provided by racecourses do not accrue to
the racecourses themselves but, rather, to the other horseracing participants such as owners, trainers,
jockeys, bookies, breeders, support and ancillary service providers. Benefits also accrue to the wider economy
in the form of employment and taxes/charges paid. Racecourses are distinguished by the fact that their
objective is not to earn a return for shareholders but to maintain and develop their facilities in order to
provide safe and enjoyable venues for holding race meetings. They do not pay dividends or directors’ fees and
if profits are earned such profits are re‐invested in the racetrack and associated facilities.

Revenues. ‐ In real terms, the revenues of racecourses have increased marginally by about 1.7% in total in the
4 years 2009 – 2012. Maintaining overall revenue at just slightly above 2009 levels is a highly creditable
performance by racecourses in the period of severe economic turbulence experienced in recent years.

Total revenue for all racecourses is estimated to have been €42 million in 2012. Revenues from all sources
other than media‐related income have been in sharp decline as a result of falling attendances and lower
economic activity levels. Between 2009 and 2012, income from all sources other than media rights income fell
by over €6 million. Media Rights income rose by just over €8 million in the same period.

Media Rights Income. ‐ The rise in media rights income in recent years compensated for the underlying
decline in revenue from all other revenue sources. The increase in media rights income, which now represents
48% of total revenues, has been essential in order to overcome the underlying systemic decline in revenues
from more traditional sources. Media rights income is masking the underlying or core loss making activities
and position of practically all racecourses. Any reduction in media rights income would compromise the ability
of racecourses to maintain and invest in the racetrack asset, threaten the ability of many racetracks to
continue as going concerns and, ultimately, endanger the future of the overall horseracing industry. Without
media rights income, racecourses would have experienced aggregate losses of over €13.7 million in 2012.

Non‐racing income is also very significant, does not have a high related cost of sales in most cases and is
equivalent to over 85% of the reported profit after tax for all racecourses combined.

Profitability expressed as a percentage of turnover is estimated at 15% but this is heavily dependent on media
rights and non‐racing income levels as seen above. There is also a significant variation between individual
racecourses and racecourse types with Grade II type courses earning just 3% profit on turnover and Grade I
type courses earning 7%. The level of profitability of racecourses has to be considered in terms of their core
purpose which is to generate funds in order to provide venues for fixtures and races to take place for the
benefit of all horseracing stakeholders including owners, trainers, jockeys, bookies, breeders and the
racegoing public. The on‐going capital investment required is provided by means of capital grants, by
borrowings and by the level of cash reserves that racecourses can provide directly from profits generated and
retained for investment purposes.

Return on Assets and Return on Capital Employed Ratios. ‐ Up to and including 2009 these ratios were
showing either a loss making position or a negligible return. The 2010 position was distorted by an exceptional
item and after adjusting for this the level of return in 2010 is also negative. In 2011, the return on assets and
capital employed ratios were positive at a level of about 4‐4.5%. In 2012, based on questionnaire data the
return on asset ratio was 3.2%. If replacements costs are used the ratio falls to 1.55%. Such a level of return is
insufficient to ensure long term sustainability and support future capital investment.

Taxes and Charges. ‐ Racecourses are estimated to pay over €5 million annually in taxes and charges for costs
such as rates and local authority charges.

Petrus Consulting                                                                                             5
The Economic Contribution and Financing of Racecourses in Ireland

Historic Capital Investment. ‐ In total, an estimated €270 million has been spent on capital expenditure by
racecourses in the last 15 years. This expenditure was funded by a combination of grants, loans and
contributions by the racecourses.The estimated replacement cost of land and buildings for all racecourses is
over €400 million.

Future Capital Investment. – Racecourses have estimated that €116 million will be required to upgrade
facilities across all racecourses over the next 15 years, that grant funding of approximately €40 million will be
provided and the balance of €76 million will be provided by racecourses either directly or by borrowings
undertaken for the purpose. Whether through borrowings or by direct contribution by the racecourses, the
cost of the racecourse investment in terms of interest and capital payments and to provide racecourses’ own
contribution can only come from profits generated and retained for reinvestment.

Funding Future Capital Expenditure. ‐ Racecourses, in aggregate, need to generate net cash flow of c. €11.2
million each year for 18 years to repay their loans for new investment, repay existing borrowings, and allow
them to contribute their portion of the own funding. This figure compares to the €11.2 million cash flow that
racecourses are estimated to have generated in 2012 meaning that it is just feasible for racecourses to
undertake the investment programme. This is however totally dependent on all assumptions being met and in
particular that there are no cost increases or additional operating costs incurred, that the decline in all revenue
sources apart from media rights income is stopped and that these revenue sources remain stable into the
future. This is also an aggregate calculation taking all racecourses together and it is clear that individual
racecourses differ greatly in terms of their profitability and cash position. In general, medium and small
racecourses will find it far more difficult than the larger racecourses to fund future capital investment.

Critical assumptions for all racecourses are that there will be no adverse changes in revenue or costs, that
capital grants of at least €40 million will be provided, that loan funding of an additional c. €21 million will be
provided by banks on top of existing loans on borrowing terms of 6.5% over 18 years or better and, most
critically, that racecourses can fund their cash contribution.

Racecourses have only recently become profitable and the level of profitability and cash flow generated is
essential in order to enable racecourses to fund future capital investment. The racecourse asset requires
considerable investment over the coming years which can only be provided from grant aid, borrowings and
cash reserves. Racecourses need to maintain at least the current level of profitability or else the necessary
capital investment cannot be made. If racecourses cannot invest to maintain and develop the racecourse asset
then horseracing itself and all the related stakeholders will suffer.

Petrus Consulting                                                                                              6
The Economic Contribution and Financing of Racecourses in Ireland

2.   TERMS OF REFERENCE AND METHODOLOGY

2.1. BACKGROUND
Petrus Consulting was engaged by the Association of Irish Racecourses (“the Association”) to carry out a
review of the financing and economic contribution of Irish racecourses. Every racecourse in Ireland is a
member of the Association and a list of racecourses is included as Appendix 1. The summarised objectives of
the Association include furthering the interests of horseracing generally in Ireland and particularly the interests
of racecourse owners and executives and advising and assisting members individually and, or, collectively on
all matters appertaining to their separate and collective interests.

The background to this review is that several studies and reviews have been carried out in recent years on
aspects of the horseracing industry but these studies either did not include the racecourses directly or did not
give sufficient weight to the critical importance of the racecourse element to the overall horseracing industry.

A key issue for racecourses is the perception that their contribution to the overall horseracing industry and
associated sectors such as to the horse breeding industry is not sufficiently recognised. The second key issue
for racecourses is that there appears to be little understanding among other industry participants about their
high cost structure and capital investment requirements and their low level of profitability. Recent increases in
media rights income are both welcome and necessary but only compensate for the steep decline in all other
revenue sources for racecourses and continuing cost increases.

The terms of reference for the review follow from the key issues highlighted above namely to:

Review the contribution which the racecourses make to the overall horseracing industry (including to owners,
trainers, breeders, on and off course betting, attendees at meetings, sponsors and all the other associated
direct and indirect social and economic benefits.)

Review and examine the overall finances of the racecourses with particular attention to the following:

•    income streams from all sources including attendances, sponsorship, media rights, grants

•    the costs associated with operating these racecourses

•    the level of capital expenditure which has taken place over the last 15 years

•    future aggregate investment requirements

•    borrowings, loans and cash position of the racecourses.

2.2. METHODOLOGY
The methodology for the review comprised the following:

A questionnaire was circulated to all racecourses requesting quantitative information on, for example, their
income and expenditure levels and the trends therein, past and future capital expenditure and employment
levels. Respondents were also asked to provide qualitative information on their views about the current and
future issues facing their racecourses. The Association of Irish Racecourses assisted in circulating the
questionnaire and used its influence to obtain responses from a high proportion of racecourses. The
responding racecourses are considered to be representative of all levels and types of course. We wish to thank
all those racecourses who responded to the questionnaire and provided us with their detailed financial
information and views on racecourses.

A desk analysis of previous reports and reviews on the horseracing and related industries was carried out. In
some cases, aspects of these reports which have a direct bearing on the racecourse element of the overall
industry were updated based on more recently available data.

Petrus Consulting                                                                                              7
The Economic Contribution and Financing of Racecourses in Ireland

Financial information for racecourses was obtained from the returned questionnaires and also from the
annual financial statements which several racecourses also provided. These annual financial statements were
supplemented by accessing information from the Companies Registration Office (“CRO”) which in many cases
was available in great detail. However, some racecourses are exempt from filing full financial statements or
became exempt during the period examined. Similarly, most racecourses have filed financial statements for
years up to and including 2011. Some, but not all racecourses, have filed financial statements for 2012. This
means that care must be taken in examining trend information based on CRO information throughout this
report because the base of racecourses in succeeding years may not be comparable. Ratio analysis based on
individual years is considered to be reliable.

Where meaningful or where the confidentiality of data provided by individual racecourses would not be
compromised we analysed the financial data according to the grade of racecourse in the categories of
Premier, Grade I and Grade II to highlight differences in financial performance according to the size of
racecourse.

A set of ratios related to profitability and return on investment was developed and applied to the financial
data for each racecourse, the separate grades of racecourse and the racecourses in aggregate.

2.3. SCOPE OF THE REVIEW
The time period covered by the review is based on the most recently available information. The
questionnaires provided information in all cases based on 2009 ‐ 2012 income and 2012 expenditure levels.
CRO financial statements were obtained from 2006 up to the most recently available time period which in
most cases was 2011 with, in some cases, information for 2012. The racecourses included in the review
comprise all the members of the Association of Irish Racecourses. There are 26 such racecourses as set out in
Appendix 1.

The economic review deals mainly with issues related to racecourses directly and also take into consideration
several of the closely related horseracing activities such as betting. The review does not go beyond the
horseracing industry into the wider economy although it is recognised that the horseracing industry is a key
contributor to the overall economy in terms of breeding, betting and, in addition, provides social and amenity
benefits not captured in economic terms as well as being an employer in its own right.

The scope of this review therefore concerns the horse racing industry and it is not the intention to consider
the overall economy wide impact of racecourses. However, in certain areas we have considered the wider
contribution of racecourses such as, for example, the role that racecourses play in tourism or the linkages
between horseracing and the bloodstock, media and gambling industries.

Our main focus is on the horse racing industry and we only consider wider social and economic impacts to the
extent necessary to provide a clear view of the overall impact of racecourses with the pool of related and
supporting activities.

2.4. STRUCTURE OF THE REVIEW
This report is structured as follows:

Section 1     Executive Summary contains a summary of the main findings from the review.

Section 2     Background, terms of reference and methodology for the report.

Section 3     An assessment of the economic contribution of racecourses.

Section 4     An assessment of the financial position of racecourses and their future outlook.

Petrus Consulting                                                                                          8
The Economic Contribution and Financing of Racecourses in Ireland

3.   ECONOMIC CONTRIBUTION OF RACECOURSES

3.1. OVERVIEW
It is an indisputable fact that Irish racecourses make an important economic contribution to the
horseracing sector within the country. At a basic level, racecourses are the critical element for
horseracing to take place – without the well‐developed network of 26 racecourses located in nineteen
different counties on the island, which are capable of hosting both National Hunt and flat race
meetings, horseracing in Ireland simply would not happen and the related economic activities such as
training, horse breeding, and betting would either not be possible or would be seriously curtailed. In
this sense, racecourses may be seen as the underlying ‘network infrastructure’ over which the
spectacle of horseracing, with all its ancillary add‐on activities, is provided to the public.

Location of Racecourses in Ireland

Source: Horse Racing Ireland Factbook 2012

It would be easy to extend this analogy to imagine that the network of racecourses which exists bears
strong similarities to other types of networks, over which services are provided to end‐users. It is quickly
apparent, however, that any such analogy is quite limited, given that the economic activities that occur
over the racecourse network involve very different kinds of relationships between the various parties
involved compared to the provision of services over other network industries, such as electricity, gas,
telecommunications, railways and so forth.

These other network industries were for many years characterised by monopoly provision of services to
end‐users, with a vertically integrated monopolist both owning the infrastructure and providing all the
services along the value chain. In those network industries where competition has been allowed to take
place, the ex‐monopolist incumbents have typically retained a very strong presence within their
respective sectors, with intervention from sectoral regulators required to ensure that other players are
granted access to the incumbents’ networks in order to provide their own services to end‐users. In a
number of these sectors – such as the retail supply of electricity and gas – the ex‐monopolists have
retained high market shares while in others – for example, railway services – competition has yet to be

Petrus Consulting                                                                                        9
The Economic Contribution and Financing of Racecourses in Ireland

    introduced at all. In this case, the integrated monopoly that owns and operates the network
    infrastructure also controls and operates every facet of production in relation to the service provided.

    In contrast, racecourses have never acted – and would never have been in any position to act ‐as
    monopolists in the provision of horseracing services on their network of racecourses. Instead,
    racecourses4 have actively co‐operated with other parties ‐ such as regulators, owners, trainers, on‐
    course bookmakers, facilities providers, sponsors, media companies, the racegoing public etc. ‐ to create
    between them an attractive year‐round programme of race meetings across the country. In this regard,
    while the existence of racecourses themselves is a necessary condition for horseracing to take place, it is
    not in itself a sufficient condition. For horseracing to happen, the active input of all the other key players
    listed above is required as well.

    It is also instructive to view the provision of horseracing services – and, in particular, the active
    collaboration in doing so by a number of disparate and different economic agents – as a type of
    economic ‘ecosystem’, whereby the different parties bring very different resources, inputs and skills to
    horseracing overall which, when combined together, enables the provision of an attractive and
    important sporting spectacle. As well as providing their own inputs to the process, these different
    entities have their own individual expectations about the kind of outputs they expect to derive from
    their involvement in horseracing.

    The kinds of inputs provided and outputs derived by the various parties involved in horseracing tend to
    be well established amongst the parties involved. Sudden changes in commercial arrangements
    governing any of these inputs or outputs – say, for example, a rapid decrease in the amount of
    sponsorship money being made available or a significant rise in entrance ticket charges to the racegoing
    public – would clearly have the capability of upsetting the quite delicate balance that currently exists
    between the various economic agents operating in the horseracing sector. Changes in what entities pay
    for services provided to them by others or in payments for services they themselves provide therefore
    require careful consideration in terms of the impact such shifts might have for the financial and
    economic wellbeing of the sector as a whole.

    We review a number of key trends within the industry before setting out a description of the services
    that are typically provided at Irish racecourses. We then focus on the inputs to horseracing made by
    Irish racecourses and the outputs the courses derive from their involvement on the industry. We
    examine indirect as well as direct economic effects and focus on the positive spin‐off effects generated
    by horseracing, focusing in particular on the key areas of tourism and employment. Finally, we set out a
    forward‐looking assessment by the racecourse operators themselves of the prospects for Irish
    racecourses derived from the qualitative responses to the questionnaire.

4
  There are many racecourse owners and the racecourse ‘network’ is not owned by a single entity: four of the 26
racecourses are owned by HRI but the remainder are owned and operated by local committees and/or companies. In
contrast, in other network industries the entire network infrastructure tends to be owned by a single entity (aside
from telecommunications, where a number of competing networks exist).
    Petrus Consulting                                                                                         10
The Economic Contribution and Financing of Racecourses in Ireland
Irish Horse Racing and Betting Industries in Numbers (2006 ‐ 2012)
Key Indicators for Horseracing 2006 2007 2008 2009 2010 2011 2012 % Change from Annual Average
Peak to 2012 Change 2008 ‐ 2012
Betting and Exchequer Funding
Total Betting € M 3,667 3,926 3,903 3,281 3,257 2,858 2,838 ‐28% ‐266.25
Total On Course Betting €M 262 282 237 182 164 153 130 ‐54% ‐26.75
Total Off‐Course Betting €M 3,405 3,644 3,666 3,099 3,093 2,705 2,708 ‐26% ‐239.5
Previous Year's Betting Duty (HRI 80%) €M 36.7 43 29.1 29.3 24.8 24.7 21.6 ‐50% ‐1.875
Further Government Funding of HRI €M 19.4 15.1 32 25.2 22.6 21.1 23.4 ‐27% ‐2.125
Total Government Funding of HRI €M 56 58.5 61 54.5 47.4 45.8 45 ‐26% ‐4
Prize Money
Total Irish Horse Racing Prize Money €M 55.1 59.6 60 52.9 46 44.4 44.9 ‐26% ‐3.875
HRI Funding of Prize Money 30.6 32.3 34 30.3 28.3 28.1 28 ‐18% ‐1.5
Commercial and Other Funding of Prize Money 8.6 10 9.2 7.9 5.4 5.2 5.9 ‐39% ‐0.825
Owners' Funding of Prize Money 15.9 18 17.2 14.7 12.3 11.1 11 ‐38% ‐1.55
Attendance, Fixtures, Races, Entries
Total Racecourse Attendance 1,447 1,461 1,392 1,237 1,198 1,238 1,194 ‐18% ‐49.5
Average Attendance 4,536 4,387 4,070 3,586 3,587 3,685 3,411 ‐25% ‐165
No of Fixtures 319 333 342 345 334 336 350 1% 2
No of Races 2,268 2,397 2,454 2,444 2,381 2,397 2,516 3% 15.5
No of Race Entries 87.4 105 96.5 94.7 72.5 65.9 64 ‐39% ‐8.125
Racehorse Numbers and Sales
No. of Stallions Mares and Foals in Ireland 31.7 34 32.8 29.3 23.2 21.5 20.7 ‐39% ‐3.025
of which foals born 12 13 12.4 10.2 7.6 7.6 7.6 ‐40% ‐1.2
No. of Irish Foaled Horses Exported n/a n/a 5,016 5,315 5,181 4,987 4837 ‐9% ‐44.75
Aggregate Value of Irish Horses sold in Irish Sales 192 179 100 68 68 81 93.8 ‐51% ‐1.55
No. of Horses in Training 6,585 6,742 6,817 6,483 5,769 5,030 4,846 ‐29% ‐492.75
No. of Racehorse Owners 5,207 5,588 5,641 5,107 4,667 4,278 3,779 ‐33% ‐465.5
Source: Indecon Report 2012 updated using HRI Factbook 2012. Peak figures indicated in bold.
Petrus Consulting 11The Economic Contribution and Financing of Racecourses in Ireland Table 1 on the previous page sets out a number of key indicators for the overall horseracing and betting industries in Ireland from 2006 to 2012. Almost without exception every indicator has decreased substantially over the period. The peak to trough falls in some cases are over 50% as in the case of Total On‐Course Betting and in the case of Aggregate Value of Irish Horses Sold in Sales. Examining the peak to trough falls, it is clear that there has been a very large change in the nature of the industry over the period. In order to look at the more recent years we also calculated the average level for each indicator over the 4 year period 2009 to 2012 so that earlier peak figures would not cloud any more recent improvement or dis‐ improvement in the figures. In almost all cases, the indicators have continued to dis‐improve although not at the rate experienced earlier. Two indicators which increased were the number of fixtures and the number of races. 3.2. KEY TRENDS RELATING TO RACECOURSES If viewed from a supply and demand perspective, it is clear that the provision of the entertainment spectacle of horseracing has increased in recent years, despite the severe economic downturn since 2008. As Figures 1 and 2 below show, the number of racing fixtures (Figure 1) and races run (Figure 2) have increased since 2006. Although both witnessed a decline in 2010 and 2011 compared to 2009, the number of fixtures and races in 2012 were higher than those recorded in the earlier peak year of 2009. Figure 1: Number of racing fixtures, 2006 ‐ 2012 Source: Indecon Report 2012, HRI Factbook 2012 Update, Petrus Analysis Petrus Consulting 12
The Economic Contribution and Financing of Racecourses in Ireland

Figure 2: Number of races held, 2006 ‐ 2012

Source: Indecon Report 2012, HRI Factbook 2012 Update, Petrus Analysis

Seen from a demand perspective, however, Figure 3 below illustrates clearly that, despite the increase
in fixtures, attendances have been falling steadily since 2007 – from a peak of 1.46 million recorded in
that year attendances had fallen to 1.19 million by 2012, an 18% decrease. It is worth noting that this
decline set in well before the national economic downturn began in 2008 but, as Figure 3 shows, the
largest decline in attendances took place between 2008 and 2009, i.e. when the economy was
contracting sharply.

Figure 3: Attendances at race meetings, 2006 ‐ 2012

Source: Indecon Report 2012, HRI Factbook 2012 Update, Petrus Analysis

The effect of national economic contraction, and in particular the rapid deterioration in the public
finances, on the horseracing industry may also be seen by the reduction in government funding
provided to Horse Racing Ireland (HRI) in recent years. This is illustrated in Figure 4 below which shows
that funding for HRI peaked at €61 million in 2008 but then fell sharply to €45 million – a decrease of
26% ‐ by 2012.

Petrus Consulting                                                                                    13
The Economic Contribution and Financing of Racecourses in Ireland

Figure 4: Total Government funding of Horse Racing Ireland, 2006 – 2012

Source: Indecon Report 2012, HRI Factbook 2012 Update, Petrus Analysis

A similar picture emerges in relation to the amount of prize money available for horseracing. This is
illustrated in Figure 5 below. The strong correlation between the trend shown in Figure 4 above and that
for prize money in Figure 5 may be explained by the fact that a significant proportion of prize money
comprises funding provided by HRI and so the observed decline in the former relates in large part to the
substantial reductions in the latter since 2008. That is not, however, the entire picture – since the peak
year of 2008 the proportion of HRI funding of total prize money has risen from 56% in that year to 62%
in 2012. During this time, other principal sources of prize money – i.e. from commercial sources and
from owners – fell even more sharply, with the former down 39% from its peak level and the latter
down 38%. The relative stabilisation in government funding of HRI (as may be seen in Figure 4 above)
had, therefore, the result of also arresting the sharp decline in prize money for horseracing, as Figure 5
shows.

Figure 5: Prize money, 2006 – 2012

Source: Indecon Report 2012, HRI Factbook 2012 Update, Petrus Analysis

Petrus Consulting                                                                                    14
The Economic Contribution and Financing of Racecourses in Ireland

Figures 6 and 7 show that, like prize money, betting revenues have also fallen significantly in recent
years. However, as Figures 6 and 7 show, the decline in betting revenues set in as far back as 2007 and,
in the case of on‐course betting, this fall has been precipitous. Total betting revenues have fallen from a
peak of €3.9 billion in 2007 to €2.8 billion in 2012 (a 28% reduction) while on‐course betting receipts
have collapsed from €282 million in 2007 to just €130 million by 2012, representing a 54% decline over
the period.

Figure 6: Betting revenues (total), 2006 ‐ 2012

Source: Indecon Report 2012, HRI Factbook 2012 Update, Petrus Analysis

Figure 7: On‐course betting revenues, 2006 – 2012

Source: Indecon Report 2012, HRI Factbook 2012 Update, Petrus Analysis

Petrus Consulting                                                                                     15
The Economic Contribution and Financing of Racecourses in Ireland

    While the macroeconomic contraction since 2008, allied to falling attendances at race meetings, may
    partly explain the steep decline in on‐course betting receipts, it seems clear that other factors – possibly
    related to technological change and the rise in online betting – may be at play here5.

    The years since 2008 have also seen a significant decline in the numbers of racehorse owners, as Figure
    8 below illustrates. The number of owners peaked in 2008 at 5,641 but have seen fallen by one‐third to
    stand at 3,779 by 2012.

    Figure 8: Number of racehorse owners, 2006 ‐ 2012

    Source: Indecon Report 2012, HRI Factbook 2012 Update, Petrus Analysis

    3.3. SERVICES PROVIDED AT RACECOURSES
    As well as providing the locations at which owners, trainers, jockeys and race‐goers can all benefit from
    and enjoy the spectacle of horseracing, racecourses also provide the occasion and the facilities for other
    horseracing industry participants to supply a number of important services. Such services include the
    provision of dedicated, serviced areas for on‐course catering, stabling and on‐course betting.
    Racecourse venues are also used for a variety of other non‐racing purposes, ranging from conferences
    to car boot sales, and some racecourses have facilities such as co‐located golf courses and gyms.

    Racecourses provide and pay for a number of services that enable race meetings to take place. The most
    important of these services are the racetracks themselves, which are located on land holdings
    encompassing 3,500 acres owned and operated by the 26 racecourses. As well as the racetracks,
    racecourses also have other facilities such as turnstiles, stands, car parks, enclosures, bars, restaurants,
    weighing rooms, first‐aid rooms, stable yards and facilities for on‐course betting (comprising both on‐
    course bookmakers, typically located in a bookmakers’ ring, and the Tote).

5
 In this respect, it is worth noting that the research company Econsultancy recently reported that the online gambling
market in the UK increased by 80% in value between 2008 and 2012, with the sector valued at £2bn in the latter year.
This research found that sports betting continues to be the most popular online gambling activity (accounting for 45%
of the market) but that, within this segment, betting on football – driven by the increasing popularity of in‐game
betting – has experienced the largest growth, with a 69% increase since 2009. See UK’s gambling sector worth £2bn in
2012: stats at http://econsultancy.com/ie/blog/62407‐uk‐s‐online‐gambling‐sector‐worth‐2bn‐in‐2012‐stats
    Petrus Consulting                                                                                            16
The Economic Contribution and Financing of Racecourses in Ireland
Racecourses also provide and pay for necessary racing‐related equipment such as starting tapes,
number cloths, public address systems, closed‐circuit TV systems, race cards and race form information,
telephones and media facilities, including dedicated press rooms.
Racecourses also arrange for the provision of important support personnel and services at race
meetings. Key personnel include stewards, doctors (usually a minimum of two), Order of Malta
personnel (usually at least 12), two ambulances, two veterinary surgeons (in addition to the vet
provided by the Turf Club), a Blue Cross horse ambulance, farriers and security personnel. Racecourses
provide support to and liaise with An Garda Siochana in the area of traffic management in the vicinity of
racecourses on race meeting days. Racecourses are also obliged by the Health and Safety Authority
(HSA) to prepare and maintain event emergency plans in relation to race meetings held at their tracks.
Racecourses are also subject to stringent regulation from a variety of bodies such as the Health and
Safety Authority, Local County Councils regarding fire, water, waste and development planning, the
Food Safety Authority for catering facilities, Revenue Commissioners for tax purposes, the Turf Club for
participant facilities and Horse Racing Ireland for physical infrastructure. This regulatory oversight has
improved horseracing and racecourses for the benefit of everyone involved in the sport but the burden
of regulation itself falls principally on racecourses.
3.4. ECONOMIC INPUTS AND OUTPUTS RELATING TO RACECOURSES
Table 2: Racecourse Benefits Provided and Received to and from Stakeholders
Stakeholders Benefits/Inputs from Outputs from Stakeholders
Racecourses to
Stakeholders to Racecourses
Owners Racecourse Facilities Racehorses (but no financial benefit to
racecourses)
Trainers and Racecourse Facilities Racehorses (but no financial benefit to
Jockeys racecourses)
Caterers Racecourse Facilities Concession fees
On‐course Racecourse Facilities Pitch fees
Bookmakers
Off‐course Race meeting content Media rights income
Bookmakers provided
Sponsors Exposure/publicity Fees for Sponsors guests (indirect spin‐off
benefit to racecourses)
Advertisers Exposure/publicity Advertising fees
Racegoers Racecourse Facilities ‐ Entrance money
Race meetings
Media Race meeting content Exposure/publicity (but no financial benefit
and press facilities to racecourses)
Breeders Showcase/Shop window Racehorses (but no financial benefit to
racecourses)
Government/HRI Racecourse Facilities, Capital Grants/Fixture Management,
Taxes and Charges Regulatory
Source: Petrus Analysis
Petrus Consulting 17The Economic Contribution and Financing of Racecourses in Ireland The economic activities of racecourses may be seen in the context of a number of key inputs and outputs. These are summarised in Table 2 above. As can be seen, racecourses provide a variety of important inputs to various other entities or stakeholders involved in the horse racing industry, some of which are remunerated in the form of monetary outputs but others which are not. A critical input provided by racecourses is the range of on‐course facilities which are made available to owners and trainers when they bring their horses to race meetings. Racecourses provide on‐course facilities such as stabling, changing facilities for jockeys, parking etc. as well as the track itself over which the races take place. Racecourses also provide on‐course facilities to other stakeholders that in turn provide retail services to the racegoing public at race meetings. The main providers of such services include the different on‐ course caterers (which range from table service offered to premium ticket holders to fast food outlets) as well as on‐course bookmakers, including the Tote. Racecourses also provide important exposure and publicity – both on‐course and over TV and other media – for companies and organisations who rent advertising space at strategic locations around the course. Race sponsors are also provided with the same kind of on‐course and off‐course exposure and publicity. The key input provided by racecourses is, however, the venues themselves, with the racegoing public gaining access to the entertainment spectacle of an Irish race meeting, while media organisations gain access to valuable race meeting content for use in their TV programming. Live content from Irish race meetings is broadcast over a variety of Irish, UK and international TV channels, as well as being broadcast on a closed circuit TV basis and to off‐course betting shops. Races held at Irish racecourses also provide breeders with important opportunities for showcasing equine talent. In this sense, racecourses act as the ‘shop window’ for the breeding industry. For Government, too, racecourses are an important outlet for showcasing an important national industry, which means that racecourses may be seen as a key input to national policy aiming at the development of the Irish horseracing industry. Associated with each of these inputs provided by the racecourses, there are a series of corresponding outputs that racecourses may or may not receive. Owners pay race entry fees to HRI, trainers do not pay fees to racecourses, caterers, on‐course bookmakers and other on‐course service providers pay concession/pitch fees to the racecourses in return for the facilities provided to them by the racecourses to enable them to trade at race meetings. Companies and organisations who take advertising space at racecourses pay fees to racecourses for doing so and in return receive marketing exposure for their products or services. Race sponsors also get exposure but in this case the racecourse tends not to receive direct remuneration as the winning owners take this in the form of prize money. Racecourses may receive a small percentage of revenues from sponsors indirectly through the payments made by caterers. In recent years, an important benefit for racecourses has been generated via media rights income ultimately paid by off‐course bookmakers in return for the supply of race meeting content. Racecourses also derive monetary gains from racegoers and from the Government (via HRI), the former by way of entrance fees to race meetings and the latter via capital grants for the development of Petrus Consulting 18
The Economic Contribution and Financing of Racecourses in Ireland

    racecourses. HRI also provides important fixture management services to the horseracing industry,
    which services are of benefit to racecourses.

    The inputs made and outputs that are derived from horseracing are not, of course, limited to those that
    directly involve the racecourses themselves, although it remains the case that without the existence of
    racecourses none of these inputs or outputs would occur. Examples of these include the relationships
    between bookmakers on the one hand and racegoers and owners on the other in relation to bets laid
    and winnings paid out on races, food and drink provided by caterers to racegoers, owners and trainers
    and the revenues earned by them arising from this and the relationship between breeders and owners,
    which is so dependent on the results garnered by horses in races held at Irish racecourses. Taken
    together, these relationships of themselves constitute a significant volume of economic activity.

    3.5. IMPACT ON LOCAL ECONOMIES: TOURISM
    Racecourses play an important part in Ireland’s tourism industry, with a number of racing festivals
    coinciding with peak holiday times within the country. As a result, racing festivals held at Irish
    racecourses have an important role to play in the development of tourism within the country by
    attracting attendance at race meetings from domestic sources and from overseas6.

    A research study commissioned for HRI in 20097 estimated the annual expenditure in the economy by
    overseas visitors who attend race meetings in Ireland came to just over €67 million. This study
    estimated that the number of overseas visitors attending race meetings in the period June 2008 to May
    2009 came to 68,405 who, between them spent an average of €980 per visit, yielding a total spend over
    the period of €67,036,900.

    The same study found that overseas visitors made up 9% of all attendees at race meetings in Ireland.
    Of this percentage, a sizeable proportion stated that attendance at a race meeting was the primary
    purpose of their visit to the country. Overseas visitors were found to be very similar to their Irish
    counterparts in terms of age and gender and, like Irish racegoers, had a slight preference for attending
    racing festivals. Three‐quarters of all overseas visitors came from the UK (60%) or the United States
    (14%) and over half of them attended race meetings in Dublin (14%) or the rest of Leinster (38%).

    The same study conducted market research with overseas visitors to determine their reasons for visiting
    the country to attend race meetings. The principal reasons provided are illustrated below. The quality of
    the spectacle and the atmosphere at Irish race meetings were the two principal reasons provided for
    attending race meetings here.

6
  Irish racing is broadcast live to 14 million UK and Irish homes and to over 33,000 retail betting outlets/shops in over
20 countries and with a total broadcast and online audience of tens of millions of viewers.
7
  Overseas Visitors Quantitative Research 2008/09 Prepared August 2009 by Behaviour & Attitudes for Horse Racing
Ireland.
    Petrus Consulting                                                                                               19
The Economic Contribution and Financing of Racecourses in Ireland Figure 9: Reasons for Visiting Ireland for a Race Meeting Source: Horse Racing Ireland ‐ Overseas Visitors Quantitative Research 2008/09 Other studies have also confirmed the value of race meetings to local economies. A 2012 study carried out by National University of Ireland Maynooth (NUIM) estimated the value of the previous year’s Punchestown festival at just under €60 million.8 This study estimated that in addition to the direct economic contribution of €59,800,000 a further €9 to €12 million could be added to take account of indirect spin‐off benefits to the local economy. The study estimated that the €59.8 million direct economic effect comprised spending inside the racecourse of €21.4 million, spending outside the racecourse of €24.8 million, spending on attire of €7 million and spending on travel of €6.6 million. An earlier 2003 study estimated that the value to the local economy arising from the Galway festival was at a similar level to that of Punchestown. This study, carried out by the Marketing Development Programme of the Michael Smurfit Graduate School of Business, UCD found that the full economic impact of the Galway festival totalled €58 million.9 The 2009 report commissioned by the Irish Thoroughbred Breeders’ Association on the economic impact of the Irish Thoroughbred industry (‘the Dukes report’)10 estimated that the combined economic contribution of Irish racing festivals in 2008 totalled €260.6 million. As Table 3 below shows, this estimate placed Galway as the most valuable festival (contributing €60 million to the total), followed by Punchestown (€43 million), Listowel (€38.4 million), Leopardstown (€21.3 million), the Curragh (€15.6 million) with other festivals together contributing the remaining €62.1 million. It should also be remembered that the opposite is also true so, for example, without the Galway festival there would be a €60 million economic dis‐improvement experienced. 8 The Economic Contribution of the 2011 Irish National Hunt Festival at Punchestown to the Economy of Kildare and its Surrounding Regions, Report for Punchestown Racecourse by NUIM, January 2012, available at: http://www.goracing.ie/pics/2012/NUIMREPORT.PDF 9 ‘See Galway races €60 million win for local economy’, Irish Independent, 9th July 2003 available at: http://www.independent.ie/irish‐news/galway‐races‐60m‐win‐for‐local‐economy‐25938172.html 10 Analysis of the economic impact of the Irish Thoroughbred Horse Industry, Directed by Alan Dukes, commissioned for the Irish Thoroughbred Breeders’ Association, 2009, available at: http://www.goracing.ie/AssetLibrary/Files/HRI/Resource_Centre/Dukes%20Report%20%202009%20.pdf Petrus Consulting 20
The Economic Contribution and Financing of Racecourses in Ireland

Table 3: Economic Contribution of Irish Racing Festivals:
    Festival                  No. of days              Attendance                  Value (€m)

    Galway                           7                   192,321                      60.0
    Punchestown                      5                   105,669                      43.0
    Listowel                         7                   106,822                      38.4
    Leopardstown                     4                    59,379                      21.3
    Curragh                          3                    43,336                      15.6
    Others                          39                   228,942                      62.1
    Totals                          65                   736,469                      260.6
Source: Dukes Report, Table 3.3.1, citing HRI Fact Book 2008.

3.6. EMPLOYMENT BY RACECOURSES
Table 4: Employment Numbers and Cost – Estimate All Racecourses
         Employee Numbers            2009             2010                  2011              2012

    Core Full Time Employees              206              199              198               193
    Core Part Time Employees               93              101              104               133
    Race Day Full Time                    115              114              116               110
    Employees
    Race Day Part Time                   1,098            1,150            1,154              1,195
    Employees
    Total Employee Costs €            12,041,025       10,829,590        10,837,290       10,601,681
Source: Petrus Questionnaire

Full time and part time employment on racecourses is estimated to be 193 and 133 respectively. On
racedays it is estimated that 1,195 casual employees are employed in total across all 26 racecourses or
an average of 46 employees. Total employee costs are estimated at €10.6 million in 2012 having
reduced from €12.04 million in 2009.

To estimate an average cost per person we have taken each part time position as representing 50% of a
full time position and each race day employee as representing 10% of a full time position. Using this
approach there has been a decrease in the cost per employee over the years 2009 to 2012. In 2009 the
average cost per employee was €33,240, reducing to €29,721 in 2010, €29,712 in 2011 and €28,028 in
2012. This represents a 15.6% decrease in average cost per employee over the period.

Using the same approach to estimate full time equivalents, it is estimated that there are approximately
380 full time equivalent (FTE) jobs supported by racecourses directly and that employment has
remained stable over the 4 year period 2009 – 2012 but with a reduction of 15% in average employee
cost. The figure of 380 FTEs is made up of 193 full time FTEs, 67 part time FTEs and 120 casual FTEs.
The number of full time staff has reduced slightly since 2009. The number of part time staff has
increased suggesting that part time staff positions have replaced full time positions. Casual race day
staff have increased slightly.

3.7. EMPLOYMENT IN THE OVERALL HORSERACING INDUSTRY
The job numbers estimated above represent only a small part of the overall employment in the
horseracing industry. On‐course and off‐course activities in areas such as training, breeding, catering,
betting, regulation, and transport all have high employment content and are supported or enabled by
the existence of the racecourses. In the report, “Analysis of the economic impact of the Irish

Petrus Consulting                                                                                     21
The Economic Contribution and Financing of Racecourses in Ireland
Thoroughbred Horse Industry – The “Dukes Report” ‐ Update October 2010 it was estimated that the
total employment in the industry was 17,35111.
The most recent figures from HRI for 2012 suggest that 16,000 people are employed in the overall
horseracing, breeding, betting etc. sectors. Each job on the racecourse supports over 40 jobs off the
racecourse.
The breakdown of employment from the Dukes report is set out in the table below and shows the wide
range of activities and occupations involved in the horseracing industry.
Table 5: Overall Horseracing Industry Employment 2008 – 2010
Sector 2008 2009 2010
Breeding ‐ Stallions, Broodmares, Sales Prep etc. 6,107 4,738 3,982
License Trainers 784 785 785
Jockeys ‐ Flat, N.H. Apprentice and qualified Riders 619 591 570
Racing and racing support services ‐ Stable staff, PTP training yards, 3,920 3,469 3,080
Pre Training, Breaking yards, Breeze ups and Administration staff
Racecourse employment ‐ General (incl. catering and security) 996 950 935
Betting ‐ Bookmakers, On course clerks, Total Bookmakers off 6,998 6,528 6,034
course, Tote
Educational institutes ‐ Third level, RACE, FETAC courses, PLC's 151 126 119
Other ‐ Farrier, Feed producers, HRI, Transport, Turf Club, Auxiliary 2,509 2,196 1,846
services
Total Employment 22,084 19,383 17,351
Source: Dukes Report Update October 2010
The Dukes report identified that jobs in the horseracing industry had already declined significantly
between 2008 and 2010 and that almost 5,000 jobs had been lost in the period.
Bearing in mind the “network” and “ecosystem” concepts referred to earlier, the racecourses are only
one part of the overall horseracing and breeding industry but, if it is accepted that racecourses are an
essential precursor to all the related activities, then the direct employment on racecourses is critically
important and has a very high multiplier effect for all the other related employment in the wider
horseracing industry employment.
3.8. HORSERACING INDUSTRY EMPLOYMENT BY OCCUPATIONAL GROUP
The Central Statistics Office provided a special tabulation extracting information from the 2011 census
as it relates to horseracing. The tabulation shows persons aged 15 years and over classified by
occupational group and industrial group. This shows a lower level of employment than is shown in the
previous and other reports on employment in the horseracing industry which can be explained by the
categorization of occupation and industry used by the CSO to record activity where, for example,
Gambling and betting activity (CSO employment 5,912) is a separate industry group, (included as part of
Arts, Entertainment and Recreation) to horseracing (included as part of Agriculture, Forestry and
Fishing). The different categorisations of occupations and industries explain the main differences
11
According to the HRI Factbook 2012 this figure is believed to have reduced to 16,000.
Petrus Consulting 22You can also read