JANUARY 2021 - Arvada Economic Development Association
←
→
Page content transcription
If your browser does not render page correctly, please read the page content below

JANUARY 2021

EXECUTIVE SUMMARY                  03

METHODOLOGY                        07

SEGMENTATION                       12

RESIDENT SATISFACTION              21

ATTITUDES TOWARD GROWTH            25

UNDERSTANDING OF CITY’S REVENUES   37

ATTRACTING NEW BUSINESSES          45

SELF-CONTAINED COMMUNITIES         63

APPENDIX                           66
                                        2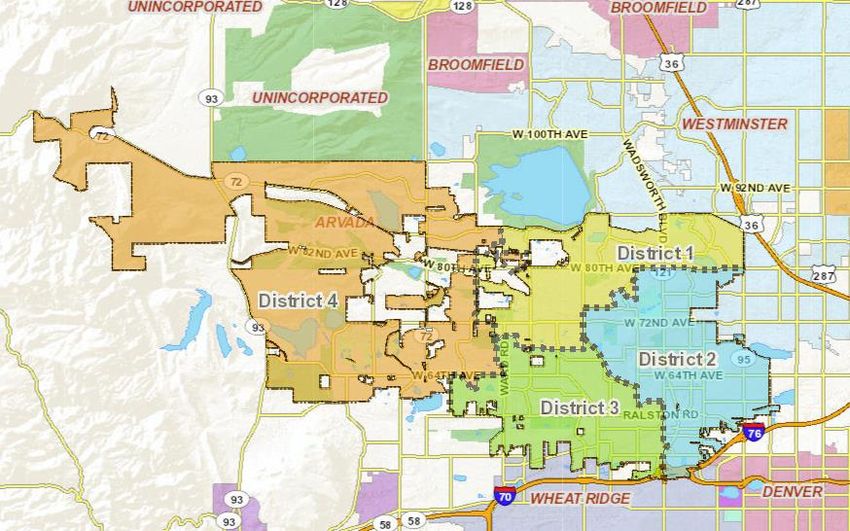
The mission of Arvada’s Community and Economic Development Department is to enhance residents’ quality of life through planned and balanced development
that aligns with residents’ wants and needs. The goal of this research is to quantify the various wants and needs and to determine the extent to which attitudes
toward development are malleable with increased understanding of the linkages between development and the city’s ability to provide the requested services.

While most respondents support the idea of economic growth (85%), less than half are strong supporters and 43% already believe the City is growing at a rate
faster than they would like. In fact, respondents represent a continuum of attitudes toward growth in Arvada: those who are Enthusiastic, those who are Reluctant
and those who fall In-Between. It makes sense that the segment most satisfied not only with living in the City of Arvada but also with how well they see the City’s
government performing in managing growth and development are those in the In-Between segment, since they are neither disappointed that the City is not
growing fast enough nor frustrated that the City is growing too quickly. But they are also not strong supporters of growth.

The question then is, is it possible to create a more favorable opinion of growth by sharing different sorts of information about why growth and development is
important and what can offer to residents? The answer to that question is yes.

Perhaps the least surprising finding from this survey is that respondents do not have a clear understanding of where the City’s revenues come from. Most believe
their City’s revenues come from property taxes, followed quite distantly by revenues from local sales tax. Nearly all were surprised to learn only 3% of the City’s
revenues come from property taxes and instead, that the City of Arvada relied heavily on local sales tax and service fees such as water usage and drainage to
support its operations.

It was also not very surprising to find that residents wanted to see more businesses in their City, especially small “mom-and-pop” retails stores, casual dining
restaurants and walkable shopping areas with a variety of stores, restaurants and bars. And when it comes to a specific store they want to see, the overwhelming
choice is Trader Joe’s. Respondents also want to see the City attract businesses that can offer professional- and entry-level jobs.

But there is a serious disconnect, with respondents saying they want these types of businesses to come to their community and then rate the City of Arvada not
very positively in terms of the types of characteristics a business would look for in order to come there. Fewer than two out of ten respondents rated the City of
Arvada as “Excellent” in terms of providing businesses with any of the seven key criteria they were told businesses look for when choosing a community in which
they will operate.
                                                                                                                                                                      3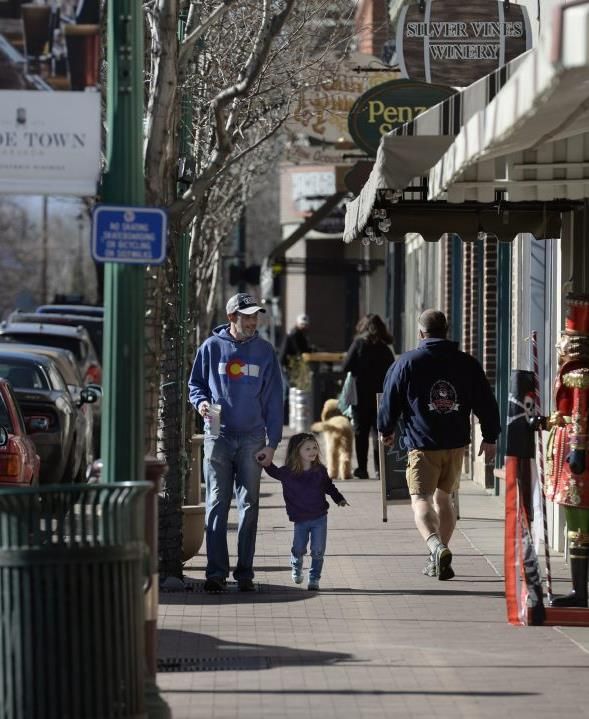
(Continued)

How do we bridge this gap between wanting more restaurants and retail shopping as well as quality jobs, and to see the City provide improved services,
especially the maintenance and expansion of roads and bike paths, when support for economic growth is limited? Several pieces of information were
helpful for bridging that gap.

First, we saw how important it was for residents to understand the City’s reliance on sales tax revenues to fund city services, which requires an
understanding that the City receives little of residents’ property tax payments. High property taxes are a sore spot for many, and they need to understand
where those dollars go if not supporting their City (information which was not provided to them in this survey).

We also saw that most respondents are not strong supporters of population growth, nor do they want to see increases in their sales taxes, which made
attracting visitors who come to shop and stay in the city the most preferred method of bringing additional revenues to the City. However, they also needed
to understand that it will require having more residents, not just tourists, to attract more businesses, which can then create new jobs, which in turn will
attract more residents. While necessary to understand these linkages, this information also has the potential to create fear, that their City is going to get
caught up in a vicious cycle that will turn it into a metropolis rather than the more peaceful, rural community that led them to move to Arvada in the first
place.

This fear of growing too quickly was evidenced throughout the survey as respondents commented on the importance of careful, thoughtful, sustainable
growth. For those who support growth, it is probably fair to say that they do so as long as it is done well. At the same time, it is important for the City to
remember that respondents are divided at near equal numbers between those wanting more growth, those wanting less growth and those happy with how
things are today. No matter what the City chooses to do, there is not an option that will keep everyone happy.

However, we did find that the discussion surrounding self-contained, sustainable, environmentally-friendly communities can have a place in this
conversation. In fact, eight out of ten thought self-contained communities, when done right, are at least an “okay” idea, and four out of ten thought such self-
contained communities are a “great” idea. Discussions of “high-density, low-cost housing” would likely not fare well, but the idea of communities that allow
its residents to live, shop, dine, and catch public transportation all within walking distance – that had an appeal.

                                                                                                                                                                   4
(Continued)

What we learned from this research is that:

1.   Residents of Arvada who participated in this survey overwhelmingly want their City to continue to improve the services it provides, such as open space,
     trails, and road maintenance.

2.   Many residents do not realize that the funding for these City services comes largely from local sales taxes and service fees, such as water usage and
     drainage. To increase the City’s revenues, respondents were more receptive to increasing tourism rather than increasing the number of residents or
     raising property or sales taxes.

3.   Respondents also wanted to see more businesses operating in their communities that offer the kinds of services they want, especially restaurants,
     small mom-and-pop stores and open/walkable shopping areas with restaurants and bars. They also wanted to see more businesses that could offer
     entry- and professional-level jobs to residents.

4.   However, at the same time, most recognized that the City of Arvada does not have the characteristics businesses typically look for when choosing
     communities where they will locate, including not having a sufficient number of residents who could become customers or even employees of the new
     businesses.

5.   The challenge of course is to connect these dots in ways that shows how residents can have what they want in terms of city services, business
     offerings and quality jobs through careful planning, protecting the rural qualities of the City while still increasing the population. Small, self-contained
     communities can become a way to accomplish this as many were receptive to this idea by the end of the survey.

                                                                                                                                                                    5
The City of Arvada wishes to gain a better understanding of how residents feel about
economic growth and development. To obtain these insights, the city’s Community and
Economic Development Department commissioned Market Perceptions, Inc., a Denver-
based research and evaluation firm, to conduct this assessment.

This Economic Development Survey has two constituent audiences: residents and
businesses. This report focuses on residents, and a separate research project will be
conducted in the fall of 2021 among the city’s businesses to learn more about their
perspectives.

This Residential Economic Development Survey will be conducted bi-annually, tracking
changes in residents’ attitudes and needs over time.

                                                                                        6
Postcard Only: 9% Response Rate

                                                                                   Postcards were sent to households on October 6, being
                                                                                   delivered to households where an email address was not
                                                                                   available. Information on the postcard included background
Data used for this survey were obtained by utilizing a mixed methods
                                                                                   about the study, why their participation is important, and
approach of mail-to-online and email-to-online data collection. Five-thousand
                                                                                   instructions for accessing the survey (i.e., website URL, access
Arvada households were selected at random, stratified equally across its four
                                                                                   code, and deadline for submission). A reminder postcard was
City Council Districts.* Approximately half of these households (47%) initially
                                                                                   mailed on October 23rd.
received invitations to participate in the survey via postcard and the remainder
(53%) were initially contacted via email, depending upon whether an email          Two of the 2,350 residents who received a postcard contacted
address was available for that household.                                          the City of Arvada stating that they could not participate due to
                                                                                   a lack of internet access and/or computer. Future survey efforts
                                                                                   will include an option where residents can request a printed
 Surveying occurred between October 6th and November 25th, 2020.                   copy of the questionnaire if they are not able to access the
 Randomly selected participants only needed to be current residents of             survey online.
 Arvada to qualify for participation in the survey.

 A total of 500 interviews were completed. The maximum margin of
                                                                                             Email plus Postcard: 11% Response Rate
 sampling error on a sample size of 500 interviews is +/- 4.4 points.
 Margins of error are greater when looking at smaller subsets of data.
                                                                                   A soft launch of 100 email invitations was sent to residents on
 Once survey responses were checked for accuracy and integrity, the data
                                                                                   October 6th to ensure the survey is working properly. Minor
 were weighted to mirror the City’s population estimates by City Council
                                                                                   adjustments were made, followed by a second soft launch to
 District as well as by residents’ age.
                                                                                   400 recipients on October 7th. The full launch to the remaining
                                                                                   2,168 residents occurred on October 8th followed by three
                                                                                   reminder emails. On November 6th, additional postcards were
* The City Council District map is shown in the appendix.                          mailed to the residents who received the email invitation but did
                                                                                   not complete the survey in the event that the email address on
                                                                                   record was incorrect.
                                                                                                                                                       7
The survey instrument used for this assessment was developed jointly by Market Perceptions, Inc. and
the City of Arvada’s Community and Economic Development Department. Topics explored in the survey
include, but are not limited to, the following:

     •   Residents’ level of satisfaction with living in the City of Arvada                                 The survey included three video clips
     •   Attitudes and beliefs toward economic growth and development                                       that explain specific topics of interest
     •   Desired services in terms of housing, employment, transportation, and outdoor recreation           before presenting respondents with
                                                                                                            questions about those topics.
     •   Residents’ knowledge of the City’s revenue sources                                                 Respondents were asked to try a test
     •   Preference for attracting new businesses in the City                                               link at the beginning of the survey to
     •   Level of interest in developing self-contained communities in the City                             determine if they’re able to see and
                                                                                                            hear the video content. Just 3% of
     •   Demographics                                                                                       respondents said they were not able
The questionnaire consists of 92 questions, including five open-ended questions. The questionnaire took     to do so, and for them, the information
                                                                                                            was presented to them by text and
an average of 31 minutes to complete. The survey utilized skip logic in order to present individuals with   graphics.
questions that are most relevant to them, based upon their previous responses. Respondents were
allowed to indicate when they did not know the answer to a particular question or to not respond if they
felt uncomfortable providing an answer. Individuals who did not respond or said “Don’t Know” were
excluded from the percentage base on a question-by-question basis. Due to both skip logic and missing-
value exclusions, the response base varies by question, and is therefore noted on each slide.

                                                                                                                                                       8
This report uses terminology that is somewhat unique to survey research:

Top-Box Responses
Several survey questions provide respondents with different options to choose from, such as “Strongly Agree,”
“Agree,” etc. When we refer to the “Top-Box,” this is in reference to the highest level of agreement on any of
these types of scales, such as the percentage of respondents who said, “Strongly Agree.”

Top-Two Box Responses
The “Top-Two Box” response includes the second-highest response along with the top-box response. For
example, on a question with an agreement scale, participants who answered, “Strongly Agree” are combined
with those who answered, “Somewhat Agree,” and the percentage of these respondents represents the top-two
box response.

Statistical Significance Testing
Statistical tests (typically t-tests of proportions) are used throughout the analysis to indicate which results are
most likely to represent real differences in the data (as opposed to differences which fall within the margin of
sampling error). Significance testing is performed only when the sample size is at or greater than 30. The level
of confidence used for all statistical significance testing in this document is 95%. When a difference is said to
be statistically significant, it is notated by either an arrow (in charts) or a shaded cell (in tables).              9

When gathering survey data, thought must be given to the representativeness of the
results. While many believe that good data is achieved by simply gathering more of it,
larger sample sizes only serve to reduce sampling error, or the reliability of the results,
but do not necessarily relate to whether the results are representative of the population,
which is an assessment of the validity of the data.

    Validity From a data collection standpoint, validity considers the extent to which
    the sampling method is able to produce results which are representative of the
    population of interest. For this assessment, a random sampling of residents was
    employed rather than convenience sampling (e.g., social media recruitment or
    posting a link to the survey in newsletters). Multiple attempts were made to
    encourage respondents to participate and statistical adjustments (i.e., data
    weighting) were applied to further refine the representativeness of the data.

    Reliability Reliability refers to the reproducibility of the data, meaning the extent to
    which similar results would be obtained if the study were to be repeated in the
    same manner. Larger sample sizes create more reliable data due to their smaller
    margin of sampling error. However, consistency does not equate to validity, making
    it necessary to strive for both reliability and validity.

                                                                                               10
The survey data gathered for this study have been statistically weighted so that the demographics
of the survey participants are representative of the City’s population estimates in terms of Council
District and age. Other demographic characteristics such as household income and race/ethnicity
do not align as well, mostly because many participants chose not to provide answers to these
more sensitive questions (21% not responding to the question about income and 16% not
responding to the race/ethnicity question).
Weighted Base (n=500) Sample Population Sample Population Sample Population
Council District 1 25% 24% Male 38% 49% White 76% 77%
Council District 2 26% 27% Female 51% 51% Hispanic 7% 14%
Council District 3 24% 25% Other 1% 0% BlackWe begin this analysis with a statistical segmentation* of Arvada’s residents. A statistical segmentation allows us to identify
groups of people who share similar attitudes, beliefs, or behaviors, based on what are often referred to as “latent variables,”
characteristics that are more conceptual than specific and therefore cannot be measured through a single question.
Of interest in this research was how residents feel about economic growth and development. Recognizing this cannot be
fully captured through a single question, we used the eight following questions as inputs to classify residents in terms of
their attitudes toward this concept:
o Attitudes toward economic growth in the City of Arvada (from Strongly Support to Strongly Oppose)
o Satisfaction with how the City is managing economic growth and development (Extremely to Not At All Well)
o Extent to which residents agree or disagree with the following statements about economic growth in Arvada:
• Economic growth will destroy the very fabric that makes our community special
• Economic growth is essential for the city to remain competitive and to thrive in the future
• Economic growth is necessary for us to have the kinds of services, restaurants and jobs that we want in our
community
• Economic growth should be kept to a minimum to support only the most essential services
• Economic growth will encourage people to move to our community who we don’t want living here
• Economic growth will allow the City to make much-needed improvements to existing infrastructure, parks and
open space
13
* Segments were derived using a polytomous variable latent class analysis from the poLCA Package (Version 1.4.1) in R (Version 3.6.1).From the segmentation modeling, three unique segments were Support Growth Oppose Growth
identified, each representing different attitudes toward economic
growth and development. Not surprisingly, these segments range
from those who strongly support economic growth and
development to those who strongly oppose it. And also, not too
surprisingly, members of these three segments tend to be quite
different in terms of their demographic characteristics. Meet the
Enthusiastic, In-Between, and Reluctant.
The Enthusiastic
Thirty-six percent of respondents are in the segment called The Enthusiastic.
Members in this segment are the strongest supporters of economic growth in
the City, feel largely comfortable with the current pace of development but
wouldn’t mind it if things were to speed up a bit. The Enthusiastic are often
newer residents of the City, younger, more affluent, and have higher
educational attainment.
The Reluctant
The Enthusiastic The In-Between The Reluctant
On the opposite end of the spectrum are The Reluctant, representing 26
percent of respondents. The Reluctant oppose economic growth and
development and feel the City has already grown too quickly for their comfort.
Members of this segment are often older and longer-time residents of Arvada. 36% 38% 26%
The In-Between
And of course, between these extremes is a middle category, aptly named The In-Between. Thirty-eight percent of Arvada’s respondents fall into this segment. While these respondents are
“in-between” when it comes to attitudes toward growth and development, they are the most satisfied when it comes to how they feel things are progressing in their City. Demographically,
they are also in-between, with few statistically significant differences from the average, especially in terms of their age and length of residency. 14Enthusiastic Reluctant In-Between
(n=182) (n=130) (n=188)
%%
Attitudes Toward Economic Growth in Arvada
% Strongly Support 81% 6% 31%
% Somewhat Support 18% 35% 66%
Looking at how participants responded to the eight questions used to
identify these segments shows the dramatic differences in attitudes % Somewhat Oppose 1% 37% 2%
between them.
% Strongly Oppose 0% 22% 1%
• Nearly all of the Enthusiastic respondents (81%) “Strongly Support” Economic Growth in Arvada (% Definitely + Probably)
economic growth in the City of Arvada, whereas virtually none of the
Reluctant do (6%). Will destroy the fabric that makes our community special 0% 55% 9%
• Every member of the Enthusiastic segment (100%) agrees that Is essential for the city to remain competitive 100% 6% 75%
economic growth is essential for the City to remain competitive in the `
Is necessary to have the services and jobs in our community 100% 24% 84%
future, and that growth is necessary in order to have the kinds of
services and jobs that are wanted in the community. Should be kept to a minimum to support essential services 3% 50% 23%
• Similarly, nine out of ten (92%) of the Enthusiastic believe that Will encourage people to move here who we don't want here 8% 57% 23%
economic growth will allow the City to make much-needed
improvements to existing infrastructure, parks, and open space. Two Will allow the City to make improvements to infrastructure 92% 19% 60%
out of ten Reluctant (19%) agree with this statement.
Growth Pace
While the Enthusiastic are the strongest supporters of economic
development, it is noteworthy that half (54%) are content with the % We are stuck in the past and not moving forward 3% 2% 1%
current pace of growth, saying that the City is growing at a safe, stable,
% We are growing slowly, but not fast enough to keep up 31% 0% 10%
and sustainable pace, while just three out of ten (31%) feel the City is
not growing fast enough, suggesting that while they are the strongest % We are growing at a safe, stable, and sustainable pace 54% 1% 46%
supporters of growth, they are not entirely dissatisfied with Arvada’s
current pace. % We are growing a little faster than I am comfortable with 8% 31% 40%
% We are growing much too quickly and it is not good 4% 66% 3%
In addition, half (47%) of the Enthusiastic segment say they are either
“Extremely” or “Very Satisfied” with the way in which the City of Arvada Arvada’s Managing of Growth and Development
is managing economic growth and development for its residents, which
is the highest approval rating of all three segments. % Extremely + Very Satisfied 47% 4% 36%
Significant differences noted by arrows are measured against all others using the 95% level of confidence. 15Statistically significant demographic differences between members of the Enthusiastic segment and other
respondents are that they are younger (51% being under 45 years of age compared to 27% on average for other
respondents) and often newer residents to Arvada (36% having lived here less than five years versus 17%). In addition,
four out of ten (42%) have a post graduate degree (versus 31% for everyone else) and half (47%) have annual
household incomes of $150,000 or more (versus 20%), making them the most affluent of the three segments.
That said, these segments were developed from attitudes, not demographics, and as such, it is important to keep in
mind that not all members of the Enthusiastic segment are young, new to the City, and have the highest educational
attainment. Some are older (31% are 55 and over) and some have lived in Arvada for a long time (37% being residents
for 20 years or more). But in general, and in contrast to the others, the Enthusiastic tend to be younger, newer
residents, affluent, and have higher educational attainment than the average Arvada resident.
All
Age SEGMENT
All
OTHERS △ Household Income SEGMENT
OTHERS △
18 - 34 29% 13% +16 Less than $50K 9% 15% -6
35 - 44 22% 14% +8 $50-99K 21% 34% -13
45 - 54 16% 19% -3 $100-149K 23% 31% -8
55 - 64 14% 24% -10 $150-199K 25% 12% +13
65+ 17% 29% -12 $200K or more 22% 8% +14
Residency Education
Less than 3 years 18% 8% +10 High School/GED 5% 7% -2
4 – 5 years 18% 9% +9 Some College/Training 19% 23% -4
6 – 10 years 10% 10% 0 College Graduate 34% 39% -5
11 – 19 years 17% 14% +3 Post Graduate 42% 31% +11
20 years or longer 37% 59% -22
“Prefer not to answer” responses are excluded.
16Reluctant Enthusiastic In-Between
(n=130) (n=182) (n=188)
%
Attitudes Toward Economic Growth in Arvada
% Strongly Support 6% 81% 31%
% Somewhat Support 35% 18% 66%
% Somewhat Oppose 37%
` 1% 2%
Opposite of the Enthusiastic are the Reluctant, representing 26%
`
% Strongly Oppose 22% 0% 1%
of all respondents, having little desire to see further economic
growth and development in the City of Arvada. Economic Growth in Arvada (% Definitely + Probably)
Will destroy the fabric that makes our community special 55%
` 0% 9%
• Six out of ten respondents in the Reluctant segment (59%)
are in opposition to economic growth, with 22% “Strongly” Is essential for the city to remain competitive 6% 100% 75%
opposing. In contrast, only 1% of the Enthusiastic express any
Is necessary to have the services and jobs in our community 24% 100% 84%
opposition to growth. `
Should be kept to a minimum to support essential services 50% 3% 23%
• Reasons for their opposition are largely found in concern that `
Will encourage people to move here who we don't want here 57% 8% 23%
it will encourage people to move to the City who are not
wanted in the community (57%), that it will destroy the very Will allow the City to make improvements to infrastructure 19% 92% 60%
fabric that makes the community special (55%), and therefore
Growth Pace
should be kept to a minimum to support only the most
essential services (50%). % We are stuck in the past and not moving forward 2% 3% 1%
% We are growing slowly, but not fast enough to keep up 0% 31% 10%
When it comes to the current pace of growth, two thirds (66%)
feel the City is growing much too quickly, and almost all the rest % We are growing at a safe, stable, and sustainable pace 1% 54% 46%
(31%) believe the City is growing a little faster than they are
comfortable with. Not too surprisingly, their satisfaction with % We are growing a little faster than I am comfortable with 31% 8% 40%
how the City is managing growth and development is low, with % We are growing much too quickly and it is not good 66% 4% 3%
just 4% either “Extremely” or “Very Satisfied” and 68% “Not Very”
or “Not At All Satisfied.” Arvada’s Managing of Growth and Development
% Extremely + Very Satisfied 4% 47% 36%
Significant differences noted by arrows are measured against all others using the 95% level of confidence. 17Demographically, those in the Reluctant segment differ from the others mostly in terms of their
length of residency and its correlate of age. Three quarters of those in the Reluctant segment (73%)
have lived in Arvada for 20 or more years (versus 43% for all others) and 58% are 55 years of age or
older (versus 41%). But once again, demographics do not completely define them, with 17% having
lived in the City for 10 years or less and 25% being under the age of 45.
All
Age SEGMENT
All
OTHERS △ Household Income SEGMENT
OTHERS △
18 - 34 5% 25% -20 Less than $50K 14% 12% +2
35 - 44 20% 16% +4 $50-99K 32% 27% +5
45 - 54 17% 19% -2 $100-149K 37% 25% +12
55 - 64 26% 19% +7 $150-199K 11% 19% -8
65+ 32% 22% +10 $200K or more 6% 16% -10
Residency Education
Less than 3 years 5% 14% -9 High School/GED 9% 6% +3
4 – 5 years 4% 15% -11 Some College/Training 29% 19% +10
6 – 10 years 8% 10% -2 College Graduate 34% 38% -4
11 – 19 years 10% 17% -7 Post Graduate 27% 38% -11
20 years or longer 73% 43% +30
“Prefer not to answer” responses are excluded.
18In-Between Enthusiastic Reluctant
(n=188) (n=182) (n=130)
%
Attitudes Toward Economic Growth in Arvada
% Strongly Support 31% 81% 6%
% Somewhat Support 66% 18% 35%
% Somewhat Oppose 2% 1% 37%
Respondents who are in the In-Between segment lean slightly more
toward supporting economic growth, but at the same time, are a bit % Strongly Oppose 1% 0% 22%
wary of developing too quickly.
Economic Growth in Arvada (% Definitely + Probably)
• Nearly all (97%) say they support economic growth in Arvada, but
Will destroy the fabric that makes our community special 9% 0% 55%
only 31% do so “Strongly,” compared to 81% of the Enthusiastic.
Is essential for the city to remain competitive 75% 100% 6%
• Three quarters (75%) believe that economic growth is essential for
the City to remain competitive and to thrive in the future, and 84% Is necessary to have the services and jobs in our community 84% 100% 24%
also agree that it’s necessary to have the kinds of services and jobs
Should be kept to a minimum to support essential services 23% 3% 50%
that are wanted in the community, making them more similar to the
Enthusiastic than the Reluctant. Will encourage people to move here who we don't want here 23% 8% 57%
However, when it comes to whether Economic growth should be kept Will allow the City to make improvements to infrastructure 60% 92% 19%
to a minimum to support only the most essential services and Growth Pace
Economic growth will encourage people to move here who we don't
want here, those In-Between are more in the middle between the two % We are stuck in the past and not moving forward 1% 3% 2%
other segments (23% agreement versus 57% for the Reluctant and 8%
for the Enthusiastic). % We are growing slowly, but not fast enough to keep up 10% 31% 0%
% We are growing at a safe, stable, and sustainable pace 46% 54% 1%
In addition, while half (46%) of the In-Between feel the current pace of `
growth is just right, 40% think the City is growing a little faster than % We are growing a little faster than I am comfortable with 40% 8% 31%
they are comfortable. When it comes to their satisfaction with the
City’s management of growth and development, 36% are at least % We are growing much too quickly and it is not good 3% 4% 66%
“Very Satisfied,” making them more like the Enthusiastic (47%) than Arvada’s Managing of Growth and Development
the Reluctant (4%).
% Extremely + Very Satisfied 36% 47% 4%
Significant differences noted by arrows are measured against all others using the 95% level of confidence. 19Demographically, residents in the In-Between segment are also in-between, with few statistically
significant differences from the average, especially in terms of their age and length of residency.
They do differ somewhat in terms of income, with half (50%) earning less than $100,000 a year
(compared to 36% among the others) which is interesting given that they tie the Enthusiastic
segment for having a college or post-graduate degree (75% for the In-Between and 76% for the
Enthusiastic).
All
Age SEGMENT
All
OTHERS △ Household Income SEGMENT
OTHERS △
18 - 34 19% 21% -2 Less than $50K 16% 11% +5
35 - 44 10% 21% -11 $50-99K 34% 25% +9
45 - 54 21% 16% +5 $100-149K 27% 27% 0
55 - 64 23% 19% +4 $150-199K 13% 20% -7
65+ 27% 23% +4 $200K or more 9% 17% -8
Residency Education
Less than 3 years 11% 13% -2 High School/GED 6% 7% -1
4 – 5 years 12% 13% -1 Some College/Training 19% 23% -4
College Graduate 42% 34% +8
6 – 10 years 11% 9% +2
Post Graduate 33% 37% -4
11 – 19 years 17% 14% +3
20 years or longer 50% 51% -1
“Prefer not to answer” responses are excluded.
20“Overall, how satisfied are you with living in the City of Arvada?”
Not Very Satisfied, 4%
17% 52% 26%
Extremely Satisfied Very Satisfied Somewhat Satisfied
(n=499)
Not At All Satisfied, 1%
Seven out of ten respondents (69%) said they are at least “Very Satisfied” with living in Arvada, with 17% saying they are “Extremely Satisfied.”
Respondents in the In-Between segment are the most satisfied (82%), followed by the Enthusiastic (72%). The Reluctant are significantly less
satisfied with living in the City, at just 42%.
Female respondents, those who have lived in the City for 11 to 19 years,
and those 75 years of age or older have the highest level of satisfaction, at Enthusiastic Reluctant In-Between
79%, 79%, and 82%, respectively (at the top-two box level).
Extremely + Very Satisfied 72% 42% 82%
No statistically significant differences are found in satisfaction ratings in Extremely Satisfied 21% 8% 19%
terms of respondents’ income, education, or Council District (detailed
demographic tables with these results are included in the appendix).
22Respondents’ ratings of how well they believe the City
is providing different services varied widely, ranging
from 85% who are pleased with the City’s maintenance
of public outdoor spaces such as parks, trails and
sports fields, to just 39% satisfied when it comes to
maintaining and expanding the City’s transportation
network. For managing crime and safety, 65% gave
positive ratings, while for maintaining an efficient and
effective local government, half said the City is doing
this well (48%).
“How well do you think the City of Arvada is providing the following services to its residents?” (% Extremely + Very Well) Enthusiastic Reluctant In-Between
Public Outdoor Spaces 91% 68% 90%
Maintaining city parks, trails and sports fields 62% 23% 85% Safety and Crime 67% 49% 73%
Local Government 61% 22% 51%
Maintaining a city that is safe from crime Transportation 43% 22% 46%
(e.g., police services, ticket enforcement, 51% 14% 65%
criminal prosecution)
Those in the Reluctant segment are the least likely to
give the City favorable ratings on any of these
Maintaining an efficient and effective local services, with the lowest scores coming on having an
41% 7% 48%
government effective local government and maintaining/updating
transportation network, both at 22%.
Maintaining and expanding the city's Respondents in the Enthusiastic and In-Between
transportation network (e.g., road 33% 6% 39% segments are quite similar in terms of how they rate
(n=499)
maintenance, bike pathways, etc.) the City on these services, with the highest scores
coming on the maintenance of public outdoor spaces
Very Well Extremely Well
(at 91% and 90%, respectively) and the lowest being
on the maintenance of the City’s transportation
network, with just under half giving top-two box
ratings of support (at 43% and 46%, respectively).
23Correlations
Service Ratings x Overall Satisfaction
Looking at the extent to which ratings of City service are associated with
satisfaction living in the City reveals that maintaining an efficient and
effective local government has the strongest statistical relationship, with a
Ratings of the City’s services varied widely depending upon
correlation coefficient of 0.57. Maintaining city parks, trails and sports fields–
respondents’ demographic characteristics:
the highest rated at 85% — is the least associated to respondents’ overall
satisfaction, with a correlation coefficient of 0.34. Maintaining and expanding
Younger respondents (under 35 years of age), newer the city’s transportation network — the lowest rated service at 39% – is also
residents (less than five years living in Arvada), and those not very strongly correlated with respondents’ overall satisfaction of living in
with post graduate degrees are significantly more likely to the city, at 0.39.
give positive ratings to the City for its management of
public outdoor spaces and for being an efficient and
effective local government. Top-Two Box
Maintaining an efficient and effective local
0.57 48%
Respondents who have lived in Arvada for 20 or more years government
are significantly less likely to say the City is maintaining city
parks, trails and sports fields at least “Very Well,” at 77%. In Maintaining a city that is safe from crime 0.46 65%
addition, only 31% of these long-time residents said the City
is doing well when it comes to maintaining/expanding its Maintaining and expanding the city's
transportation network, significantly lower than average. 0.39 39%
transportation network
Maintaining city parks, trails and sports 85%
0.34
Those living in Council District 4 have the lowest level of fields
satisfaction with the management of the City’s Correlation coefficients range from -1.0 to 1.0, where -1.0 indicates a perfect negative relationship, and 1.0 indicates a perfect positive relationship.
transportation network, with just 30% saying the City is A correlation coefficient of zero indicates no statistical relationship between the two variables whatsoever.
handling this well.
24Half of all respondents (46%) “Strongly” support economic growth in Arvada, and an
additional 39% “Somewhat” support it (total of 85% supporting growth to some extent).
Younger, newer, and more affluent residents are significantly more likely to “Strongly”
support economic growth, as was seen in the demographics of the Enthusiastic
segment, the strongest supporters of growth.
Respondents’ support of economic growth and development varied depending on the
type of growth we asked about. Business growth is supported nearly unanimously, at
94%, with 53% supporting it “Strongly,” while residential growth is the least popular, at
54% and just 15% “Strongly” supporting. Visitor and tourism growth is supported by
84%, but only 37% offering “Strong” support.
“How much do you support or oppose economic growth in the City of Arvada?”
• Respondents who have lived in Arvada for less than five years are the most likely
to “Strongly” support residential growth, at 25%.
• Respondents who earn $150,000 or more are the most likely to “Strongly” support
Strongly business growth, at 76%.
Oppose, 5%
Somewhat
Oppose,
10%
“Are there certain aspects of economic growth that you would support or
oppose more than others?”
Strongly
Support,
Somewhat 46%
Support, Business Growth 41% 53% 94%
39%
Visitor/Tourism Growth 47% 37% 84%
(n=485)
Residential Growth 39% 15% 54%
Somewhat Support Strongly Support
26Economic Development
% Strongly + Somewhat Support
Respondents in the Enthusiastic segment have the strongest
support for all types of growth, with nearly all being supportive of
business growth (99%), followed closely by visitor/tourism growth
Enthusiastic Reluctant In-Between (93%). When it came to residential growth, enthusiasm tapers
slightly, with 74% supporting it (although still significantly higher
Residential Growth 74% 20% 54% than all other segments).
Among the Reluctant, residential growth also was the least
Business Growth 99% 76% 98% popular, at 20%, but the majority in the Reluctant segment at least
“Somewhat” support business and tourism growth, at 76% and
Visitor/Tourism Growth 93% 63% 84% 63%, respectively.
Those In-Between show very strong support for business growth
(98%), but when it comes to tourism and residential growth, their
ratings are just average, at 84% and 54%, respectively, giving us
insights into why members of this segment are not fully
supportive or strongly opposed to growth, with mixed support
depending upon the type of growth.
27Participants were asked to share their thoughts about why they either support or oppose different types of growth in an open-ended manner.
THE ENTHUSIASTIC THE RELUCTANT THE IN-BETWEEN
The most frequently mentioned theme among this segment Among the Reluctant, the concern over residential Respondents in this segment express similar concerns as
was that they support business growth (19%), followed by growth was the greatest (31%), followed by worsening the Reluctant, with 28% mentioning residential growth as
that Arvada needs more good restaurants (16%). traffic (25%) and growing too quickly as a city (20%). problematic, and 22% commenting on traffic congestion.
Support BUSINESS growth 19% Residential growth is not good 31%
Arvada needs more restaurants 16% Residential growth not good 28%
Traffic is getting worse 25%
Traffic is getting worse 14% Arvada is growing too fast 20% Traffic is getting worse 22%
Need more outdoor recreation 13% 14%
Losing small town feel Not enough infrastructure 14%
Arvada needs more retail shops 13% Not enough infrastructure 14% Roads need improvement 14%
Support growth (general) 12% City does not listen to the people 11%
Residential growth is not good 11% More outdoor recreation 11%
Roads need improvement 11%
Roads need improvement 11% Need more outdoor recreation 9% Arvada is growing too fast 10%
Support local, small business 10% 8%
Oppose growth (general) Losing small town feel 10%
Arvada is growing too fast 10% Homelessness/crime increasing 7%
Support BUSINESS growth 9%
Expensive housing/Difficult to buy 10% Support local, small business 6%
Support reasonable growth 10% Need more restaurants 9%
Expensive housing 6%
Not enough infrastructure 9% Environmental concerns 6% Expensive housing 6%
Losing small town feel 7% Against highway expansions 5% Support reasonable growth 6%
Businesses in walking distance 5% Support BUSINESS growth 5%
Arvada needs more diversity 5%
Support JOB growth 6%
Arvada needs more restaurants 5%
Environmental concerns 5% West Arvada still quiet/rural 5% Environmental concerns 5%
Support JOB growth 5% Complaints on trash service 4% Support local business 4%
City does not listen to the people 4% Arvada needs more retail shops 4% Other (each ≦3%) 22% (n=116)
Other (each ≦3%) 5% (n=94) Other (each ≦3%) 9% (n=108)
Sum of percentages exceed 100% due to multi-coded responses.“Please feel free to share your thoughts and opinions on why you support or
oppose different types of growth for our City.”
“Growth in any of the areas represents a better lifestyle for all residents. Non-growth represents death, slowly but surely.” – Male, 75-84 years of age, Enthusiastic
“A main reason I chose to live near the west side of Arvada was [because] I wanted to be closer to nature. It is a beautiful part of town - please protect that rural area in
the vicinity of Indiana going north. That said, it would be great to see more affordable housing (maybe repurposing?) and efforts to encourage diversity and small
businesses, esp. those owned by women and people of color. I have never lived anywhere with as little diversity as this and it's a weird feeling. Maybe it's better in other
parts of Arvada? Please don't steer everyone to old town though. It would be nice to have places spread out more.” – Female, 45-54 years of age, Enthusiastic
“I'd like to see more growth of small businesses, especially in restaurants. Arvada is primarily filled with chains that are not enticing to go out to eat often. The local
places we do have are great, but we need more of them!” – Male, 35-44 years of age, Enthusiastic
“I am leery of residential growth because automobile traffic is already bad and I don't want it to get worse. Regarding business growth, I don't know if it's possible but I'd
like to see more areas set up for foot traffic with cars kept out. Olde Towne Arvada would be so much more pleasant if the streets were restricted to bicycles and
pedestrians. I'm from Madison, Wisconsin. I'm thinking about State Street, which has been a pedestrian-only arcade for as long as I've been around (early 1980s and
beyond, I'm sure). City buses and emergency vehicles are allowed, but otherwise, no motor vehicles. It's glorious. I find the presence of automobiles ruins the Olde
Towne Arvada experience for me. Big box stores are great and have their place, but the model of enormous parking lot and low walkability is unpleasant from a
community standpoint.” – Male, 35-44 years of age, Enthusiastic
“My main hope is that Arvada does not fall into the trap that Boulder has. I do want us to be able to provide a mix of housing options for different demographics, parks
and greenbelts, and retail, business, and light industrial settings so that the tax base is diversified and that we don't create policy that is too restrictive and elitist. I live
on the west side of the city and of course it is more suburb/exurb based, and recent development proposals for high density developments (senior living, multi-family)
get citizens up in arms about 'not-in-my-backyard,' or 'this will affect the value of my property.' The fact is that the city is urbanizing and we can do it smartly, with
projects like the redevelopment of 58th and Independence neighborhoods being good examples. If I can have more mix of options nearby, I won't need to drive miles in
my vehicle to do my shopping or work, alleviating some of the traffic woes everyone complains about. Those options should include higher density, and appropriate
retail. I would also like to see a resolution to the Parkway (being built!) - the growth is coming, the city is changing, things will not stay the way they are and the traffic on
Indiana traversing to McIntyre to traverse the western side of the metropolitan area is already high and going to get higher. The belt is needed or traffic will be
unbearable crossing the western side of the city.” – Male, 55-64 years of age, Enthusiastic“I feel the city is just going overboard with the new construction of multiple residents building, we are tired of the constant building of more and more big box multiple house buildings. The city seems to just be going after the new tax base and not looking after the residents who have spent their entire lives here trying to raise families.” – Male, 75-84 years of age, Reluctant “Growth brings more traffic, more demand for City services and potentially increases cost for fire, water and sewer, schools, and other essential services.” – Female, 65- 74 years of age, Reluctant “Residential homes have grown significantly over the past 5 plus years. However there hasn't been a huge increase in businesses to support these new residents. Also the roads are over -crowded now and the building just continues.” – Female, 55-64 years of age, Reluctant “I am not all that enthusiastic about unattractive and cheaply constructed low-income housing which - given those weaknesses - could well turn into virtual slums twenty years or so down the road.” – Male, 75-84 years of age, Reluctant “Arvada is becoming a high density city with all the new apartments and condos. This not only takes away from the openness Arvada once had but also increases traffic and other issues.” – Male, 65-74 years of age, Reluctant “I miss the rural feel some of Arvada had when we bought in 2003. It made Arvada a unique part of Denver. Also much of the growth has not been done in an attractive manner.” – Female, 45-54 years of age, Reluctant “We are jam-packed. Traffic is too heavy on major roads most of the day. Traffic lights are too many and terribly timed. We need some traffic circles. Before we add more cars to our roads we need to fix those roads.” – Male, 65-74 years of age, Reluctant “Our city council, In spite of the majority of public opinion at town hall meetings and letters, agreed to build a large apartment living in our area... on 64th and McIntyre. Now shopping at our local King Soopers is overcrowded, the traffic is much too busy, our values must be going down with renters, school will now be crowded when resumed and wear and tear on roads has become obvious. It was discussed and citizens were over ruled by the council, in order to bring in more revenue I assume, which will cost all of us more in the outcome plus a much more negative life style in our what was lovely area.” – Female, 75-84 years of age, Reluctant
“Preserve open spaces and green belts; restrict high density housing in already established single family neighborhoods.” – Female, 35-44 years of age, In-Between

“All for growing but the roads need to be widened in areas for all of the new housing and traffic. Indiana needs to be widened from 64th to Broomfield this road is a
disaster even widening through Arvada would help out tremendously.” – Female, 35-44 years of age, In-Between

“So many massive condos and apartment buildings are coming up all over Arvada and I feel like they are hurting the look of the city. The new business area over off
Independence and Ralston looks beautiful, a lot better than it used to. It's sad to see small businesses go though, but it's helping with the cities image. It just feels like
we are trying to put so many houses in when we could have more parks and open spaces for the community.” – Female, 25-34 years of age, In-Between

“I'm not opposed to residential growth, per se, but the infrastructure doesn't seem to be keeping up. Road maintenance, in particular, seems to be lagging behind.” –
Male, 65-74 years of age, In-Between

“Residential density is quite high as it is so more residential units does not appeal to me. Some business growth helps create a larger tax base for local government
operations.” – Male, 55-64 years of age, In-Between

“As a life long resident, I'm tired of seeing every open space filled with ugly apartments, or homes that are too close together. No matter where you travel, there is
always traffic. I would like to see more retail and restaurants so I don't have to drive to neighboring cities to have a better options.” – Female, 45-54 years of age, In-
Between

“I live in west Arvada. We like it here because of it's proximity to the mountains and our great neighbors. We understand that some growth is necessary and would not
oppose it, however, we also appreciate the open spaces around us and would hate to see them go away. We just discovered we are losing a big chunk at the corner of
Indiana and 80th Avenue. Why do we have to fill in all these little parcels. If we continue to grow residential areas, there needs to be a like growth of industry and
business. This helps the tax base for us all. There are some problem intersections such as the aforementioned 80th and Indiana, 82 Avenue and SH 93 (very
dangerous) that need attention, particularly with the new growth. Those of us in Leyden Rock would like to see an egress point under or over the rail line to the north,
especially with the new Fire Station going in there. Overall it's still a good place to live.” – Male, 65-74 years of age, In-Between
When asked why they feel the way they do about
                                                                                                                 economic growth and development, most
                                                                                                                 respondents agree that economic growth is
                                                                                                                 necessary to have the services and jobs that are
                                                                                                                 wanted in the community (77%), is essential for
                                                                                                                 the City to remain competitive and thrive in the
                                                                                                                 future (70%) and will also allow the City to make
                                                                                                                 much-needed improvements to existing
   “I believe that economic growth in Arvada…”
                                                                                                                 infrastructure (64%).
                                                                                                                 For the three statements that conveyed negative
                                                                                                                 aspects of development, only 16% agree that
  Is necessary for us to have the kinds of services,
                                                               29%                   48%                   77%   economic growth would destroy the very fabric
restaurants and jobs that we want in our community                                                               that makes our community special, 21% agree that
                                                                                                                 it should be kept at a minimum to support only
Is essential for the city to remain competitive and to                                                           essential services and 24% believe that growth
                                                                34%                 36%              70%         will encourage people to move to the City who we
                   thrive in the future
                                                                                                                 don’t want living here.
     Will allow the City to make much-needed
 improvements to existing infrastructure, parks and             34%                30%           64%
                    open space                                                                                             Those with high school education or
                                                                                                                           less are the most likely to agree that
  Will encourage people to move to our community                                                                           economic growth would bring
                                                         14%     10%    24%
           who we don't want living here                                                                                   unwanted people to the City (43%), and
                                                                                                                           that growth should be kept to
   Should be kept to a minimum to support only the                                                                         minimum (41%).
                                                         13%    8%     21%
               most essential services
                                                                                                                           Those earning $150,000 or more are
                                                                                                                           the most likely to agree that economic
         Will destroy the very fabric that makes our
                                                         10% 6% 16%                                                        growth is essential for remaining
                     community special                                                     (n=487)
                                                                                                                           competitive, and that it would lead to
                                                                                                                           infrastructure improvements.
                                                                        Probably    Definitely
                                                                                                                                                                     32
“How satisfied are you with the way in which the City of Arvada is managing economic growth and development for its residents?”
4% 29% 42% 17% 9%
Very Satisfied Somewhat Satisfied Not Very Satisfied Not At All
Satisfied (n=472)
Extremely Satisfied
When asked how satisfied they are with the way in which the City is managing economic growth and development, the most common response
is “Somewhat Satisfied,” chosen by 42% of respondents. In addition, 29% said they are “Very Satisfied,” but only 4% chose the strongest positive
response of “Extremely Satisfied.”
Respondents in living in Council District 4 are significantly less likely to say they’re satisfied with the City’s managing of
development, at 20% (at the top-two box level).
Long-term residents (20+ years) are also significantly less satisfied, at 26% in the top-two box categories.
33“Which of the following phrases would you say BEST describes your
view of economic growth in the City of Arvada?”
When it comes to the current pace of growth, the most common
response, selected by four out of ten Arvada residents surveyed We are growing much too quickly
(39%), was that “we are growing at a safe, stable, and sustainable and it is not good for our city
pace.” A similar percentage (43%) believe Arvada is growing too
quickly (25% choosing “we’re growing a little faster than I am
comfortable,” and 18% selecting “we’re growing much too quickly
and it is not good for our city”). On the other hand, only 18% chose We are growing a little faster
either of the two options about not growing fast enough, 16% than I am comfortable with
saying “we’re growing slowly but not fast enough to keep up with
neighboring cities,” and just 2% who believe “we’re stuck in the past
and not moving forward.”
Half of the newer (“Would you like to see more or less of each of the following
in the City of Arvada?”
Want Less Want More
Top-Two Box
Employers that offer highly-skilled, professional-level
39% 44% 83%
jobs
Open space 29% 48% 77%
Paved paths for walking and biking 33% 39% 72%
Participants were asked if they
would want more or less housing,
Unpaved running and walking trails 33% 36% 69%
employment, transportation, and
outdoor recreation in the City of
Employers that offer entry-level, semi-skilled jobs 49% 20% 69%
Arvada.
Public parks and sports fields 28% 34% 62%
• The types of services most
desired include highly-skilled jobs
Public transportation such as buses and commuter rail 26% 22% 48%
(83%), open space (77%), paved
paths (72%), unpaved trails (69%), Affordable housing to make it easier to purchase a home
24% 20% 44%
and entry-level jobs (69%). in Arvada
Higher-density housing that have restaurants, shopping
23% 10% 33%
• On the other hand, respondents and services integrated
showed little appetite for more Scooter and bike-sharing options such as Lime, Bird and
23% 7% 30%
minimum-wage jobs (19%), large Jump
luxury homes (24%), ride-sharing
Ride-sharing companies such as Lyft, Uber and Zipcar 20% 10% 30%
options (30%), and high-density
housing (33%).
Luxury, high-end custom homes with large yards 13% 11% 24%
Employers that offer unskilled, minimum-wage jobs 15% 4% 19%
35
(n=480)Across the segments, the strongest level of
agreement is in support of more open space and
unpaved running/walking trails (75%+), and
virtually no one in any of the segments agrees
that there is a need for more minimum-wage jobs
(all segments under 25%).
The Enthusiastic show the strongest desire for
more highly-skilled jobs (91%), which are also
strongly supported by those In-Between (87%).
The Enthusiastic are significantly more likely to
want higher-density housing (48%), large luxury
Enthusiastic Reluctant In-between homes (35%), and public transportation options
% Want More (Top-two Box) than those in the other segments.
Sample Size 182 130 188
Affordable housing to make it easier to purchase a home in Arvada 49% 32% 46% While the Reluctant provide high levels of support
for more open space (77%) and unpaved
Higher-density housing that have restaurants, shopping and services integrated 48% 10% 32% running/walking trails (63%), not all public
outdoor spaces are as welcomed by this
Luxury, high-end custom homes with large yards 35% 21% 13% segment, with just half (51%) wanting to see
more public parks and sports fields and 61%
Employers that offer unskilled, minimum-wage jobs 23% 15% 18% wanting more paved paths for walking/biking,
both of which are significantly lower than the
Employers that offer entry-level, semi-skilled jobs 77% 54% 70% other two segments.
Employers that offer highly-skilled, professional-level jobs 91% 58% 87% • Demographically, respondents living in
Council District 4 as well as those earning
Public transportation such as buses and commuter rail 55% 36% 50% $150,000 or more showed the highest level of
interest for luxury homes (34% and 45%,
Ride-sharing companies such as Lyft, Uber and Zipcar 42% 14% 27%
respectively)*. On the other hand, those
Scooter and bike-sharing options such as Lime, Bird and Jump 38% 15% 32% earning less than $50,000 were significantly
more likely to want to see more affordable
Open space 75% 77% 79% housing in the City (70%).
Public parks and sports fields 65% 51% 66% • Those younger than 35 years of age have the
highest level of interest for unpaved running/
Unpaved running and walking trails 73% 63% 68% walking trails (85%), public transportation
such as buses and commuter trail (68%),
Paved paths for walking and biking 76% 61% 74% scooter/ bike sharing options (59%), and
higher-density housing (59%).
36
* 40% of those living in Council District 4 earn $150,000 or more.You can also read