Bureau of Business & Economic Research - West ...
←
→
Page content transcription
If your browser does not render page correctly, please read the page content below

Bureau of Business & Economic Research
COAL PRODUCTION
              IN WEST VIRGINIA:
                  2018 - 2040
                       is published by:
         Bureau of Business & Economic Research
West Virginia University College of Business and Economics

       P.O. Box 6527, Morgantown, WV 26506-6527
          (304) 293-7831 bebureau@mail.wvu.edu
                  business.wvu.edu/bber

                              WRITTEN BY

                       Brian Lego
                Research Assistant Professor

                      John Deskins, Ph.D.
                            Director

              The opinions herein are those of the authors and do not
                necessarily reflect those of West Virginia University
              or the West Virginia University Higher Education Policy.

                  © Copyright 2018 WVU Research Corporation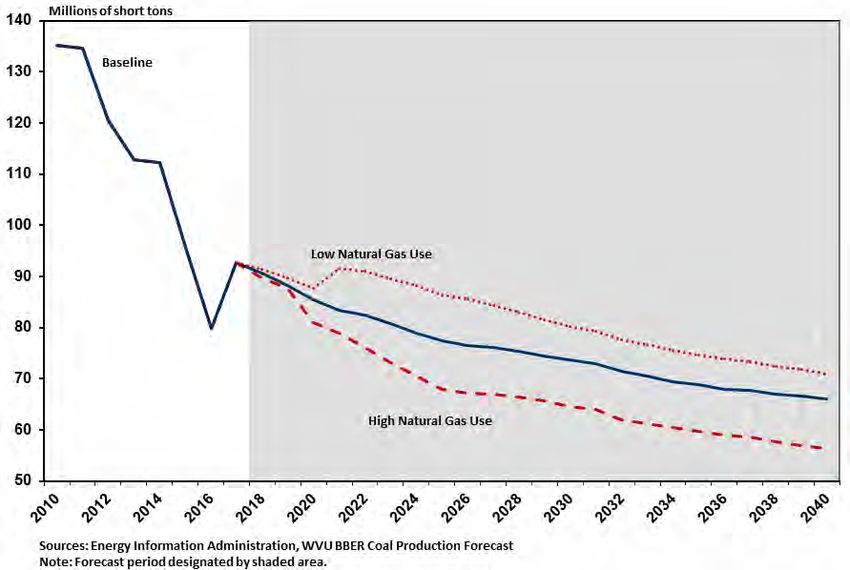
Table of Contents

List of Figures and Tables......................................................................................................................... ii
Executive Summary .................................................................................................................................... i
1       Recent Trends in Coal Production ................................................................................................. 1
2       Electric Power Sector Coal Demand ............................................................................................. 3
3       Industrial/Commercial Coal Demand............................................................................................. 8
4       Coal Export Demand........................................................................................................................ 9
5       Prices and Mine Productivity ........................................................................................................ 11
6       West Virginia Coal Production and Price Outlook ..................................................................... 13
        6.1      Short-Term Outlook .............................................................................................................. 13
        6.2      Long-Term Outlook............................................................................................................... 16
7       Alternative Scenarios for Coal Production .................................................................................. 19
        7.1      Sensitivity Analysis: Differences in Economic Growth .................................................... 19
        7.2      Sensitivity Analysis: Natural Gas Use ............................................................................... 20
        7.3      Sensitivity Analysis: Carbon Dioxide Tax.......................................................................... 23
        7.4      Sensitivity Analysis: Changes in Export Demand ............................................................ 25
Appendix: Coal Forecast Model Description and General Forecast Assumptions .......................... A

                                                                           i

                                            Bureau of Business & Economic Research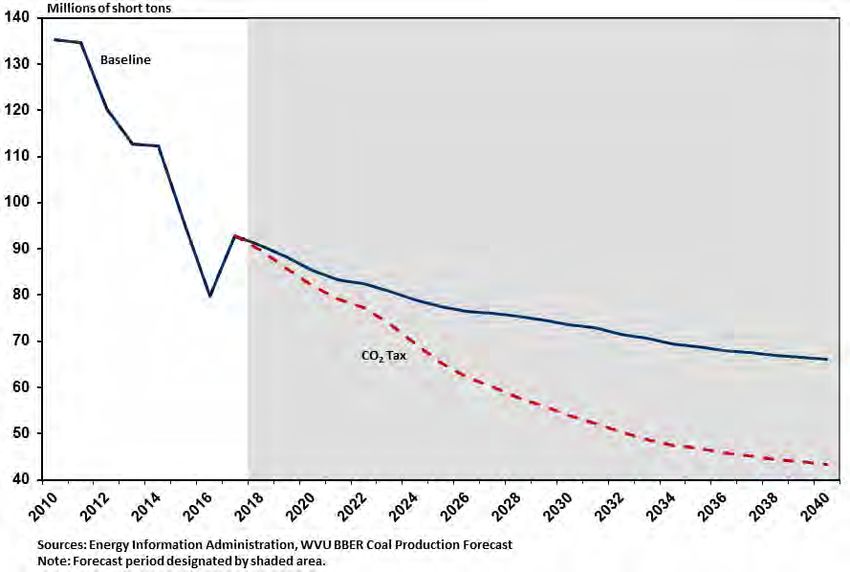
List of Figures and Tables

Figure 1: Historical Coal Production Levels ........................................................................................... 1
Figure 2: Historical Coal Production by Region in West Virginia ........................................................ 2
Figure 3: Distribution of West Virginia Coal Shipments by End-Use Market .................................... 3
Figure 4: Destination States for WV Coal Shipments to Electric Utilities, 2011 vs 2017 ................ 4
Figure 5: Ratio of Natural Gas Prices to Coal Prices per Btu Paid by Electric Utilities ................... 6
Figure 6: Electricity Generation by Fuel Source – Primary WV Coal Destination States ............... 7
Table 1: Top Destination Countries for West Virginia Coal Exports, Ranked by 2013 Value ...... 10
Figure 7: Average Coal Sales Price by Region ................................................................................... 11
Figure 8: Average Mine Productivity by Region .................................................................................. 12
Figure 9: Coal Production Forecast by Region.................................................................................... 13
Figure 10: Average Coal Price Forecast by Region ........................................................................... 15
Figure 11: Change in West Virginia Coal Production by GDP Growth Scenario (2016-2040) .... 19
Figure 12: Coal Production Forecast – Baseline vs Natural Gas Use Scenarios .......................... 21
Figure 13: Regional Coal Production Forecast – Baseline vs Natural Gas Use Scenarios ......... 22
Figure 14: Coal Production Forecast – Baseline vs CO2 Tax Scenario .......................................... 23
Figure 15: Coal Production Forecast – Baseline vs Export Demand Scenarios ............................ 26

                                                                   ii

                                       Bureau of Business & Economic Research
Executive Summary
Recent Market Trends: After seeing statewide production fall by nearly in half between 2008 and 2016,
West Virginia’s coal industry has rebounded over the past several quarters as output increased nearly 27
percent between mid-2016 and mid-2018. Export demand has accounted for nearly all of the improvement
in production over the past two years or so due to significant increases in coal shipments to India, Brazil,
Ukraine and a few other countries. This has enabled Southern West Virginia to account for a majority of
growth in statewide coal output in recent quarters. By contrast, domestic demand has remained negative,
but more so for mines in Northern West Virginia, as the US electric power sector transitions away from
coal-fired generation over to natural gas.
Short-Term Forecast: The baseline forecast calls for coal production to total approximately 91 million
short tons in 2018, which represents a slight drop versus 2017 levels. Overall state output is expected to
decline 3 percent annually over the next two years, leaving mined coal tonnage at just over 85 million by
the end of the decade. Weakening export activity will likely drive most of the anticipated drop in
production through 2020, but the retirement and/or conversion of several gigawatts worth of coal-fired
generating capacity that sources coal from West Virginia mines will also account for some of this decline.
Long-Term Forecast: Coal production will continue to decline over the remainder of the outlook period,
though most of the declines are expected to end by the early 2030s. Output is expected to fall by more
than 12 million short tons between 2020 and 2030, with an additional loss of 7 million tons by 2040.
Domestic shipments of thermal coal are expected to wane over the next decade as aging coal-fired
generation capacity deals with rising maintenance costs and lack of competitiveness against natural gas,
and in some markets, renewables. Both of the state’s producing regions will be affected by this trend, but
Northern West Virginia will be affected to a greater extent. Southern West Virginia’s production should be
buoyed by what is expected to be fairly stable levels of export demand, but output is likely to trend lower
during the outlook as a growing portion of the region’s reserves become unprofitable to recover.
Alternative Forecast Scenarios – Natural Gas Use: We examine different trajectories for natural gas
utilization on coal production. In a scenario characterized by stronger natural gas use in both domestic
and international markets, coal output would slip below 80 million short tons within a couple of years and
sink below 70 million short tons by the mid-2020s. By contrast, should natural gas utilization be much
weaker-than-expected going forward, coal production in this scenario would decline overall but exceed
the baseline forecast by more than 6 percent in 2040. Northern West Virginia’s coal production exhibits
the largest sensitivity to future changes in natural gas utilization.
Alternative Forecast Scenarios – CO2 Tax: We analyze the potential effects on West Virginia coal
production created by a tax on CO2 emissions. An initial tax of $15 per ton of CO2 emissions in 2023, with
built-in annual increases of two percent above the rate of inflation, leads to an estimated 20 million short
ton drop in statewide coal production between its hypothetical effective date through 2030. Output is
expected to decline an additional 10 million short tons or so over the remaining outlook period, leaving
West Virginia coal production in 2040 at 43 million short tons, or just over half of 2016 levels.
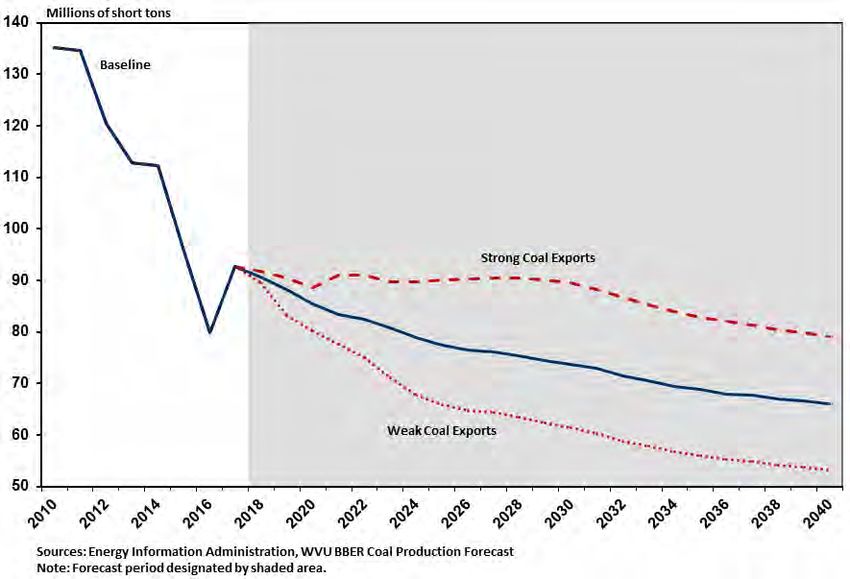
Alternative Forecast Scenarios – Export Demand: The impacts of stronger and weaker export demand
on statewide coal production were also assessed. For example, higher-than-expected global demand for
coal would cause mined tonnage to remain around 90 million short tons through 2030 before falling to 79
million tons by the end of the next decade. In an environment of appreciably weaker export demand,
whether due to more aggressive reductions in coal use or some other underlying cause, production would
plunge to 65 million short tons by the mid-2020s and roughly 53 million short tons by 2040.
Bureau of Business & Economic Research1 Recent Trends in Coal Production
WEST VIRGINIA OVERVIEW: Surging export demand enabled West Virginia’s coal industry to register
an output increase of nearly 15 million short tons during 2017, falling just short of 93 million short tons.1
This marked the largest percentage gain in statewide production for the industry since 1994, but output
still lags behind levels posted as recently as 2015. Indeed, West Virginia coal production in 2017 was 40
percent below the previous cyclical peak in 2008 and still trailed the annual total from 2014 by more than
17 percent. Output briefly surpassed 100 million short tons on a seasonally adjusted annual basis in late-
2017/early-2018, but this was due to a sustained cold snap boosting heating demand and surging coal
exports. Although export demand remained strong during the first half of 2018, coal-fired generation has
weakened, causing statewide output to slip back to an average of just over 90 million tons.
NATIONAL OVERVIEW: Coal output increased in most major coal-producing regions during 2017.
Overall, US coal production (excluding West Virginia) increased 5 percent over the 2016 level, totaling
681 million tons for the year as a whole. Production activity across other coal basins has been more
mixed in recent quarters, with growth occurring largely in areas that possess healthier reserves of
metallurgical coal. Indeed, non-West Virginia coal mine production has trended lower in the past year,
falling nearly 3 percent during the first half of 2018 compared to the same period in 2017.
Figure 1: Historical Coal Production Levels
1
The production figure for 2017 is an estimate and will not be considered final until the Annual Coal Report 2017 is released by the US Energy
Information Administration in November 2018.
1
Bureau of Business & Economic ResearchWEST VIRGINIA’S SHARE OF NATIONAL COAL OUTPUT: Despite the significant declines in coal
production that have been recorded in West Virginia over the past decade, the state continues to rank as
the nation’s second-leading producer of coal by a wide margin. In fact, West Virginia’s northern and
southern coal-producing regions each produced more coal tonnage on their own than all but three states
(Wyoming, Illinois and Pennsylvania). West Virginia did see its share of national coal output increase to
12 percent in 2017, marking its highest proportion of nationwide production since 2011. This share has
risen further during the first half of 2018 as states lying in the Powder River (portions of Wyoming and
Montana) and Illinois (Indiana, Illinois and portion of Western Kentucky) coal basins are dealing with the
ongoing shift away from thermal coal use by US electric utilities. Ultimately, however, these two basins
still account for more than 56 percent of overall US coal production, and the Illinois Basin in particular
remains a key competitor in the domestic electric power market because of its abundant high-sulfur coal
reserves.
WEST VIRGINIA REGIONAL COAL OUTPUT: While coal production has shifted westward
geographically in the US in relative terms over the past decade, production within West Virginia is now
more evenly distributed across the state’s two producing regions. As recently as 2011, Southern West
Virginia mines accounted for well over two thirds of coal produced within the state. By mid-2015, both
regions were producing roughly equivalent levels of coal tonnage, but over the course of the next seven
quarters Northern West Virginia accounted for more than half of the state’s overall production.
Figure 2: Historical Coal Production by Region in West Virginia
2
Bureau of Business & Economic ResearchOutside of the surge in output linked to stronger-than-normal winter demand, coal production from the
West Virginia’s northern coal mines has trended lower since the second half of 2016. In fact, preliminary
data indicate mined tonnage during the first half of 2018 is nearly 8 percent lower than its year ago level
for the state’s northern producing region. By comparison, Southern West Virginia coal output has
increased in seven of the last eight quarters, with the seasonally adjusted annual rate of production
improving by more than 40 percent since mid-2016. Overall, the region’s mines have witnessed a 7
percent increase in production year-to-date in 2018 versus 2017. The difference in performance between
the state’s two producing regions over the past year or so derives in large part from the fact that most of
Northern West Virginia’s coal output is shipped to domestic coal-fired power plants while Southern West
Virginia has benefited from strong export demand for its premium met and thermal coal reserves.
2 Electric Power Sector Coal Demand
Coal demand is affected by a blend of domestic and international market and regulatory forces, and each
of these has played a significant role in shaping not only the trend in statewide coal production, but also
the different paths for the state’s northern and southern coal-producing regions. Even as coal accounts
for a dwindling share of electricity generation in the US, domestic power plants still represent the top
destination market for West Virginia coal by a wide margin. Of the nearly 51 million short tons distributed
to domestic coal buyers in 2017, roughly 80 percent (42 million tons) was shipped to coal-fired power
plants in 14 states. Shipments of coal from West Virginia mines to domestic utilities have fallen in 9 of the
last 10 years and are down 46 percent from the tonnage delivered to US power plants in 2011.
Figure 3: Distribution of West Virginia Coal Shipments by End-Use Market
3
Bureau of Business & Economic ResearchAs coal use by the electric power sector has plunged nationwide over the past several years, and the fact
that so much of the state’s coal is used by domestic power plants, the trend has clearly had a significant
effect on West Virginia’s coal mining industry. One noteworthy trend, however, is that coal shipments to
West Virginia power plants has actually increased slightly between 2011 and 2017 despite the retirement
of the Philip Sporn, Kanawha River and Kammer power plants. Since every other state that received
thermal coal shipments from West Virginia mines in 2011 has cut back the number of tons purchased, by
large margins in several instances, in-state power plants are accounting for a much larger share of
domestic shipments over this time period. Indeed, West Virginia power plants now account for 40 percent
of domestic thermal coal shipments from the state’s mines, nearly double the share from just six years
earlier.
Figure 4: Destination States for WV Coal Shipments to Electric Utilities, 2011 vs 2017
A combination of reduced coal consumption and shifts in coal sourcing by power plants in several states
that were traditional leading destination markets in the past has accounted for the bulk of losses in
domestic shipments of thermal coal from West Virginia mines. For example, North Carolina,
Pennsylvania, Ohio and Florida have each seen the amount of coal tonnage burned by electric power
plants (via retirement or reduced utilization rates) cut by nearly half over the last six years. Additional
retirements this year will cause Ohio to see an additional reduction in thermal coal use following the
recent decommission to the JM Stuart power plant and Killen Generating Station. All told, these two
plants had a combined nameplate capacity of roughly 3 GW and purchased nearly 1.1 million tons of coal
from the Tunnel Ridge Mine in Ohio County during 2017.
Even among states that sourced smaller tonnages from West Virginia mines in years past have throttled
back these purchases even further or cut them out entirely as their coal-fired capacity has diminished in
size. For example, New York, New Jersey, Mississippi, Massachusetts and a handful of other states
4
Bureau of Business & Economic Researchreceived more than 6 million tons of thermal coal shipments in 2011, but that quantity dropped to a
cumulative 690,000 tons among these states in 2017 as coal-fired generators in these states were closed
or had much lower capacity factors.
In some cases, however, utilities operating in these key states have lowered the coal they source from
West Virginia mines in an even more disproportionate manner due to relative prices for coal from other
basins and/or satisfying compliance standards for certain environmental regulations. For instance, electric
utilities in North Carolina reduced coal consumption by 14 million short tons (50 percent overall) between
2011 and 2017, but coal shipments sourced from West Virginia mining operations dropped by nearly two
thirds (10 million short tons) over that same time frame.
The shift in sourcing patterns was even more dramatic for Florida. Coal shipments to electric utilities in
the Sunshine State have fallen by just over seven million short tons (~33 percent) since 2011. Of the
nearly 23 million short tons of coal used by coal-fired generators in 2011, roughly 4 million tons were
sourced from West Virginia mines. By 2017, of the nearly 15 million short tons of thermal coal consumed
in Florida, just over 200,000 tons originated in West Virginia as the coal-fired fleet had shifted domestic
coal purchases mostly to the Illinois Basin and imported nearly 3 million short tons of coal from Colombia.
Shifts in coal sourcing by power plants have also helped to push the diverging production trends observed
for Northern and Southern West Virginia in recent years. During the 2000s, West Virginia’s southern
coalfields produced on average nearly two-thirds of the state’s coal shipments destined for domestic
power plants. By 2017, that share fell to 30 percent as much of the state’s thermal coal production had
shifted already toward higher-sulfur deposits found in more productive and lower-cost mines in Northern
West Virginia.
TECHNOLOGICAL CHANGE: This pronounced shift away from Southern West Virginia coal for
electricity generation emanates from the interplay of geological, technological, economic and regulatory
factors. Costs of flue gas desulfurization (FGD) “scrubbers” or dry sorbent injection (DSI) systems, which
help to remove sulfur dioxide, nitrogen oxides, hydrogen chloride gas, mercury and other particulates
from smokestack emissions, fell appreciably in the past decade or so. This has enabled electric utilities to
burn lower-cost coal from Northern Appalachia (which includes Northern West Virginia) and Illinois Basin
mines with higher concentrations of these emissions, while still satisfying the overall portfolio of federal
and state emissions requirements.
REGULATORY POLICY: The deployment of FGD and DSI systems were an even more crucial
technological change since they also allowed utilities to meet compliance standards for the Mercury and
Air Toxics Standard (MATS) rule. This rule requires fossil-fuel steam electric generators to meet
emissions limits for a range of toxic elements and compounds. The rule is now under review by the Trump
Administration and has been subject to significant amounts of litigation, but most generators are in
compliance as the rule’s original implementation window (including extensions) ended in 2016. In
addition, utilities have recently indicated they would prefer the rule be enforced as is going forward since
they have already undertaken the massive capital investments to achieve compliance.2
2
“In about-face, utilities urge EPA to keep mercury rule,” Energy & Environment News,
https://www.eenews.net/stories/1060088801. Accessed July 11, 2018.
5
Bureau of Business & Economic ResearchFigure 5: Ratio of Natural Gas Prices to Coal Prices per Btu Paid by Electric Utilities
Overall, more than 50 GW of coal-fired capacity was retired between 2012 and 2017. Disentangling
whether these capacity reductions can be attributed solely to the MATS rule or in conjunction with a
broader portfolio of other previous regulatory changes (such as CSAPR, etc), a generator’s age or falling
prices for other fuel sources requires a micro-level analysis at the power plant level. Nevertheless,
whether it was the most important contributor or not, the time frame for many of these power plant
retirements does indicate the MATS rule played a factor in altering the US electric power sector.
Other major environmental regulatory policy changes of the past several years that affect coal demand
directly or indirectly, including the Clean Power Plan (CPP), performance standards for new, modified and
reconstructed generators and the Stream Protection Rule, have either been repealed or are under some
combination of judicial or legislative review. Some states have decided to forge ahead with their own
mass-based reductions in power plant emissions that correspond with the goals set forth in the CPP. In
addition some major utilities, such as American Electric Power, Duke and Southern Company, have
chosen to shift their portfolio of generation assets away from coal and toward natural gas and renewables
independent of federal regulatory changes.
CHANGING FUEL SOURCES: While regulatory policy changes and geographic shifts in utilities’ coal
sourcing have affected the state’s coal industry over the past several years, burgeoning domestic natural
gas-fired electric generation capacity has also presented significant difficulties for thermal coal demand
produced in West Virginia. Indeed, the dramatic growth in natural gas production since 2010 in
Pennsylvania, West Virginia and Ohio due to the large-scale development and exploration of the
Marcellus and Utica shale plays - along with falling costs in the construction and operation of natural gas-
fired power plants - has allowed natural gas to emerge as an alternative to coal for baseload generation.
6
Bureau of Business & Economic ResearchAs recently as the late-2000s/early-2010s, natural gas had a price disadvantage compared to other fuel
sources due to supply constraints and insufficient infrastructure. Thus, in most parts of the country natural
gas served as a fuel for industrial users or a back-up source of generation to be dispatched during peak-
load demand periods. Prior to the collapse in energy prices created by the Great Recession, electric
utilities paid nearly 6 times more for natural gas relative to coal on a per Btu basis. Moreover, hurricanes
that threatened the Gulf of Mexico had the ability to cause natural gas prices to spike and remain high for
extended periods of time given that other dependable supply sources were not available. Since the
beginning of 2012, however, the massive supplies of natural gas flowing from the Appalachian Basin
have yielded structurally lower prices for natural gas relative to coal. Even during instances of extreme
weather that have occurred over this time period, such as the 2014 Polar Vortex and an extended cold
snap in early-2018 (the Bomb Cyclone), price spikes have been smaller and shorter lived.
A key measure of how natural gas has evolved as a primary fuel for electricity generation is the utilization
rate of gas-fired plants. Per the US Energy Information Administration (EIA), capacity factors, which
measure the ratio of a plant’s actual output to its potential output if the facility were operating at peak
levels, for natural gas plants averaged 35 percent in 2005 while the corresponding figure for coal plants
was 67 percent. By 2017, natural gas combined-cycle (CC) plants had an average operating rate of 55
percent (56 percent during 2015 and 2016) while coal plants operated at less than 54 percent on
average. Preliminary data indicate this multi-year trend has continued in 2018 as CC natural gas plants
are operating at nearly 8 percentage points higher on average during most of the first and second
quarter.
Figure 6: Electricity Generation by Fuel Source – Primary WV Coal Destination States
7
Bureau of Business & Economic ResearchThis shift in fuels to fulfill baseload demand has also helped to exacerbate the divergent patterns of coal
output for the northern- and southern coal-producing regions in West Virginia, since Southern West
Virginia is more expensive on a per Btu basis. In the late 2000s, coal accounted for more than half of the
electricity generation, on average, among states that sourced coal from West Virginia mines. These
shares were roughly identical for both fuel sources in much of 2015 and 2016, but in all but two months
since then natural gas has maintained a higher share of electricity generation versus coal in these 14 or
so states that purchase thermal coal from West Virginia.
The change in electricity generation is having an even more apparent impact if one weights coal-fired
generation by the tonnage of shipments delivered to power plants in destination states. For example, the
shipments-weighted share of coal-fired generation fell from 55 percent down to 46 percent between 2014
and 2017 for Southern West Virginia. For states receiving shipments from Northern West Virginia mines,
the weighted share of generation coming from coal fell by seven percentage points during that time
period, but remains at 64 percent due to the fact that such a large percentage of coal from the northern
coalfields ends up being burned by West Virginia-based power plants.
3 Industrial/Commercial Coal Demand
Aside from electricity generation, industrial and commercial uses constitute the other major domestic
source of demand for West Virginia coal. Specific grades of coal mined primarily in the state’s southern
coalfields are used in the coking process to manufacture steel. However, the secular decline in the US
steel industry has reduced domestic demand for premium grade coal. Domestic coking coal use has
fallen from a national total of 30.2 million short tons to 17.5 million short tons between 1997 and 2017. For
West Virginia, domestic metallurgical coal shipments have declined by 27 percent since 2011, totaling
just below 10 million tons in 2017.
In addition to its direct uses in steel production, coal is also a prominent fuel source for CHP generation at
various types of manufacturing facilities and some commercial buildings. At the same time, however,
consumption of non-coke coal sourced from West Virginia mines for industrial, commercial and
institutional uses has also been on a downward trend for many years. In concert with a reduced footprint
for the manufacturing sector, increases in heat-rate efficiencies for coal-fired CHP boilers as well as
production facilities switching over to natural gas as the primary fuel source for CHP have driven the
domestic use of non-coke industrial coal lower over time. Higher efficiency standards for lighting, electric
motors and other electrical machinery and equipment have reduced the energy intensity of the industrial
and commercial sectors. Overall, non-coke industrial and commercial coal shipped from West Virginia
coal mines has dropped from 4.5 million short tons in 2011 down to 1.4 million short tons in 2017.
8
Bureau of Business & Economic Research4 Coal Export Demand
Given the downward trend in coal use across all domestic end-markets, export markets have represented
the one opportunity for growth for West Virginia’s coal producers. While not completely offsetting the
losses in domestic shipments that have occurred over the course of the last decade or so, coal exports
have at least provided some offset and now account around one third of the state’s overall production.
Exports are an even more crucial base for Southern West Virginia’s coal mines. During 2017, of the 46
million short tons of coal produced by the state’s southern counties, preliminary data indicate that
approximately half of that production was exported. Even though most of the exported coal tonnage from
these mines is used to manufacture steel, thermal coal exports have picked up in parts of the world as
some developing countries have ramped up construction of coal-fired generation capacity.
Coal exports from West Virginia, peaked in 2012 and proceeded to fall sharply until late-2016. Several
years of significant overcapacity in Chinese steel production, slowing economic growth in Asia and
collapsing wholesale power prices throughout much of Europe left global markets for both thermal and
metallurgical coal oversupplied. Indeed, coal exports from West Virginia averaged fewer than 24 million
tons per year during 2015 and 2016, marking a 41 percent drop from the tonnage exported between 2011
and 2013. With both thermal and metallurgical coal export prices cratering, many of the state’s mines that
were heavily exposed to the global coal trade became unprofitable. Ultimately, this helped to precipitate a
wave of financial struggles and bankruptcies throughout the industry and forced many of the major
operators in West Virginia to idle, close or sell mines.
Market conditions have improved visibly for coal exports over the past several quarters. Nearly 97 million
short tons of coal was exported from US ports during 2017, with preliminary estimates indicating West
Virginia mines accounted for 34 million short tons of these shipments. Although coal from the state’s
southern and northern mines was exported to least 37 countries, shipments to a handful of countries
accounted for most of the exported tonnage. India was the state’s largest customer, accounting for nearly
20 percent of West Virginia exports and thermal coal comprised a significant share of these shipments.
EXPORT MARKETS: While India’s recent build-up in coal-fired generation capacity boosted its thermal
coal demand, other coal-consuming industries connected to the developing country’s rapid economic
growth, particularly cement, have had to ratchet up purchases of coal following the banned usage of
petroleum coke by several northern Indian states in an effort to reduce air pollution. India has remained
West Virginia’s top overseas market thus far in 2018 by a sizable margin, importing nearly double the
tonnage of thermal and metallurgical coal through the first five months of 2018 that it received over the
same time period in 2017.
Ukraine represents another increasingly important coal export market for West Virginia in recent years.
Most of the shipments from the state destined for Ukraine have been metallurgical grade coal, as the
Eastern European nation has sought to bolster its met coal imports since losing Crimea—and the
anthracite coal mines located there—to Russian-backed separatists in 2014. Metallurgical coal exports
from West Virginia to Ukraine more than doubled between 2016 and 2017, and through the first half of
2018 have increased nearly 70 percent on a year-over-year basis.
9
Bureau of Business & Economic ResearchTable 1: Top Destination Countries for West Virginia Coal Exports, Ranked by 2013 Value
Apart from India and Ukraine, which account for roughly 30 percent of coal exports from West Virginia by
tonnage (and one-third in overall value), Brazil ranked third among importing countries in terms of the
coal tonnage shipments received from West Virginia. Although Brazil has fairly sizable reserves of sub-
bituminous coal that is utilized by its power plants, it possesses no appreciable production of premium
grade metallurgical coal that is needed to drive its large domestic steel industry. In fact, Brazil ranked first
among all nations in terms of the tonnage of met coal it imported from the US during 2017 at 7.3 million
short tons--and more than 2.2 million short tons coming from West Virginia. With continued strong growth
in Brazil’s steel industry, demand for met coal out of West Virginia remained strong during the first six
months of 2018, rising more than 50 percent over 2017 levels for the same span of months.
Coal shipments from West Virginia to the European Union as a whole declined by nearly 75 percent
between 2013 and 2016. Aside from the hit to met coal demand caused by the correction in global steel
markets, the electric utility sector across much of the continent witnessed the initial stages of a large-
scale transition in generation away from coal and over to utility-scale renewables. The Netherlands,
Germany and Poland still rank as the heaviest coal users among EU nations, but by 2017, wind, solar
and biomass accounted for nearly 21 percent of generation for the entire set of member states. This
slightly edged out the share of generation attributed to coal and lignite. Due to the massive build-up in
renewable generation and the continent’s lack of growth in power demand, wholesale power market
prices have remained extremely low, which has caused many coal-fired power plants to face significant
financial problems and caused many individual countries to phase coal out even faster due to the
potential for large bailouts.
10
Bureau of Business & Economic Research5 Prices and Mine Productivity
Coal prices increased rapidly over the course of the 2000s. Between 2001 and 2011, the inflation-
adjusted sales price of coal rose at an average annual rate of 8.5 percent per year for the state. Real
sales prices increased nationally during this timeframe as well, but at a slower pace of 5.8 percent
annually.
As has been the case with trends in production, there were notable differences in both the level and rate
of growth in prices between the state’s northern and southern coalfields. Real average sales prices
increased 10.7 percent per year, reaching $105 per short ton (in 2017 dollars) by 2011 in Southern West
Virginia due to high-cost productive capacity entering service just to meet increased market demand and
higher production of metallurgical coal bound for overseas export markets. By comparison, inflation-
adjusted sales prices for Northern West Virginia’s (primarily high-sulfur thermal) coal increased just over 7
percent annually to a peak of $68 per short ton in 2012.
Figure 7: Average Coal Sales Price by Region
Coal prices generally bottomed out in early- to mid-2016 and have increased substantially over the last
several quarters. Metallurgical coal export prices averaged more than $144 per short ton during the first
quarter of 2018, more than double what was observed two years earlier. Export prices were actually
higher during the first two quarters of 2017, though that was due in large part to the global supply shortfall
created by Cyclone Debbie’s destruction in Queensland, Australia. Thermal coal prices have followed
different tracks since the broader cyclical upswing began for coal markets nearly two years ago. Domestic
11
Bureau of Business & Economic Researchthermal coal prices have generally trended lower since 2012, as shrinking coal-fired generating capacity
is weighing on demand and most output is being supplied by highly-productive mining operations. Strong
demand growth in India is providing a boost to thermal coal export prices to some extent, but as has been
the case in the US, the transition to renewable fuels is keeping a lid on prices.
COAL MINE PRODUCTIVITY: In addition to being affected by broader shifts in global coal demand,
prices are also directly affected by supply-side issues that are determined by a combination of regulatory
burden, capital/labor utilization, fuel prices and geological constraints. In the short run, labor use tends to
have the greatest direct influence on the relative cost of extracting coal from a given seam and thus
changes in productivity, as is usually measured in short tons per labor hour, explains a sizable portion of
the movement in coal prices over time.
Though mine productivity has declined in most US coal basins since the beginning of the 2000s,
Southern West Virginia endured a major drop-off in productivity, but has stabilized around 2.2 tons per
miner hour. The region’s underground (UG) and surface mines have experienced substantial declines in
productivity, since thin or fragmented seams require more manpower to extract a given ton of coal.
Average productivity levels for both mining methods have fallen by half in the region since 2001, from 3.8
to 1.9 short tons per miner hour and 5.7 down to 3.2 short tons per miner at UG and surface mines,
respectively. Productivity in Northern West Virginia tracked Southern West Virginia’s during the 2000s, but
the two regions have seen an appreciable divergence in this trend over the past five years or so. Indeed,
several major mines expanded or opened in the past decade in Marshall, Ohio, Marion and Taylor
counties. Overall, the region has seen average productivity levels increase by 47 percent since 2012.
Figure 8: Average Mine Productivity by Region
12
Bureau of Business & Economic Research6 West Virginia Coal Production and Price Outlook
6.1 Short-Term Outlook
We utilize an econometric model to forecast coal production for the state’s northern and southern
coalfields through 2040 based upon a series of variables that influence the demand and supply for each
region’s coal reserves.3 Overall, the baseline forecast calls for state coal production to fall to an annual
total of 91 million short tons during calendar year 2018, which would represent a decline of just over 2
percent from 2017. Coal output is expected to weaken further over the next two years, falling at an
average annual rate of 3 percent during 2019 and 2020, leaving production at roughly 85 million tons by
the end of this decade.
Figure 9: Coal Production Forecast by Region
Total statewide production is expected to slow during the second half of the year, but this will stem in
large part from weaker output for some mines in Northern West Virginia. Regional output is expected to
total just over 42 million short tons in 2018, or nearly a 10 percent decline from 2017. One immediate
factor for the region’s production drop is the loss of roughly 3 GW in coal-fired capacity, as the mid-2018
retirement of two power plants in Ohio will likely lead to a one-million-ton loss of shipments from Ohio
County, WV’s Tunnel Ridge Mine. In addition, natural gas is expected to supplant coal-fired generation
further within several states that purchase coal from mines in Northern West Virginia this year, as some
3
For a more detailed description of the model and major underlying forecast assumptions, see the Appendix.
13
Bureau of Business & Economic Researchcoal plants remain uncompetitive, particularly in deregulated markets. On a positive note, a handful of
northern mines will continue to benefit from strong export demand for metallurgical coal in markets such
as Brazil, South Korea and Italy.
By comparison, Southern West Virginia coal production is expected to total more than 48 million tons in
2018, a 6 percent increase from 2017. While the region’s output is still far below what it produced as
recently as 2014, coal production has jumped by nearly 13 million tons since 2016 and will finish the year
with two consecutive calendar year gains for the first time in a decade. While exports are expected to
decline slightly in the second half of the year, Southern West Virginia coal mines should continue to
benefit from their exposure to high-growth markets such as India and the recent expansion in energy-
related trade ties with Ukraine.
Losses in domestic thermal coal demand will hurt both of West Virginia’s coal-producing regions over the
next two years, though Southern West Virginia will likely be affected to a greater extent. Duke Energy is
on track to shift its portfolio even further toward natural gas over the next several years as several of its
coal-fired power plants in North Carolina are being (or will soon be) retrofitted to run partially or totally on
natural gas, which will result in the likely loss of at least part of the 6 million short tons of thermal coal
shipped from Southern West Virginia mines to North Carolina. In addition, coal export demand will likely
cool from the 100 million short tons or so that is anticipated for 2018, though a repeat of the 2014-2016
global crash in coal demand is not expected. Export tonnage is expected to average roughly 95 million
short tons in 2019 and 2020.
While the global economic backdrop for coal demand will likely remain healthy over the next couple of
years, deteriorating trade relations between the US and many of its trading partners over the past several
months pose an appreciable risk to the state’s coal producers going forward. Indeed, the Trump
Administration has already instituted a broad import duty of 25 percent on steel and 10 percent on
aluminum. Several countries have responded with retaliatory tariffs on US-produced steel along with a
host of other goods, including coal, which has the effect of making coal from West Virginia mines more
expensive to overseas buyers.
Exemptions were granted to South Korea, Brazil and a handful of other countries that buy relatively large
quantities of coal from West Virginia, which will reduce the tariff’s overall impact on coal. However, the
steel and aluminum tariffs were only part of a larger shift in US trade policy by the Trump Administration,
which includes much greater scrutiny of NAFTA and other multi-lateral trade deals as well as targeting
China for tariffs on a wide range of goods that are imported into the US.
While each of these actions individually are not expected to cause lasting harm to global economic
growth (or coal demand, in particular), a burgeoning trade war could emerge if more countries decide to
assess retaliatory tariffs of their own on broad baskets of goods produced in the US. For example, the
administration has proposed tariffs on imported cars and parts, which along with the other enacted and
proposed tariffs would affect more than $870 billion in imports. In addition to a direct import price increase
on cars and parts, these tariffs would build in an additional layer of inflation as steel and aluminum make
up a significant portion of an assembled car and for individual components. In addition, met coal exports
from the US would likely be hurt as well since the hit to imported autos would dampen steel demand.
From a global economic perspective, aside from weighing on car purchases in the US, the direct impact
would affect overall consumer spending and eventually precipitate broader economic impacts in the US
and abroad over time as many nations would respond in kind with their own retaliatory tariffs on US
exports—which could ultimately trigger an economic slowdown or an outright recession.
14
Bureau of Business & Economic ResearchThe federal regulatory environment presents another source of downside risk to West Virginia’s coal
industry over the next few years. Although the Trump Administration’s decision to repeal and/or replace
several major EPA rules established during the Obama Administration’s years in office, including the
Clean Power Plan, New Source Performance Standards and others, any changes will likely be subjected
to legal challenges that could last for several years. Uncertainty over the ultimate legal fate of these
challenges along with the potential of a future presidential administration altering policy goals one way or
another combine to create significant regulatory risk, especially for electric utilities and other related
industries that require the policy stability needed to formulate and implement their long-term resource
plans.
PRICE OUTLOOK: Healthy global demand for premium grade metallurgical coal will keep average
market prices for mines in Southern West Virginia at an elevated level over the next couple of years.
Prices for the state’s southern mines are expected to average $94 per short in 2017 dollars for calendar
year 2018, marking a 12 percent increase from 2017 and the highest level since 2012. Some
retrenchment in export demand during 2019 and 2020 will weigh on pricing, but the region’s average
market sales price is expected to fall between $85 to $90 per ton (in 2017 dollars). Weak domestic
thermal coal demand will keep a lid on average sales prices for the state’s northern coal-producing mines
increases over the next few years. Overall, market prices for Northern West Virginia coal will increase
three percent annually through 2020, but will remain below 2016 levels after adjusting for inflation.
Figure 10: Average Coal Price Forecast by Region
15
Bureau of Business & Economic Research6.2 Long-Term Outlook
While the regulatory backdrop poses a risk to future coal production, on both the upside and downside,
the lingering uncertainty over what specific changes the Trump Administration decides to make to the
overall portfolio of environmental rules that affect the coal industry make their combined impacts on output
difficult to assess. Consequently, the baseline forecast follows a “business-as-usual” approach where
rules that are in place are incorporated into the model assumptions based upon how they affect the
demand or supply for coal from each of the state’s producing regions.
Even though conditions have improved measurably in Southern West Virginia’s coal industry over the
past two years or so, the long-term outlook for coal production from both producing regions in the state
has deteriorated since the previous report. The forecast calls for coal output to fall steadily after 2020,
dropping back below the 80 million short ton mark by the mid-2020s and then dipping below 70 million
short tons around a decade later. Ultimately, statewide coal production is expected to total 66 million
short tons in 2040, representing a 17 percent decline from 2016 levels.
ELECTRIC POWER SECTOR: For the domestic thermal coal market, both producing regions will face
pressure from the planned retirements of coal-fired power plants or their full or partial conversions to
natural gas. Utilities operating in Ohio, North Carolina, West Virginia, Pennsylvania and a few other states
have identified significant amounts of coal generating capacity for retirement or conversion (partial or
total) to natural gas. Further reductions in the coal-fired fleet are also expected to occur in the Eastern US
as falling production and generation costs put utility-scale wind and solar generation in a more competitive
position. Indeed, the intermittent nature of wind and solar remains more of a limiting factor in growth for
renewables in some eastern states at this time, compared to areas such as Texas and California, but
these obstacles are expected to dissipate over time due to anticipated improvements (and lower costs)
associated with scaling battery technology to utility-scale applications.
These generation portfolio changes are largely scheduled to occur through the early 2020s, but more of
West Virginia’s thermal coal production remains at an increased risk of even larger declines over the long
term. Even if the most efficient coal plants make up the coal fleet over the latter half of the outlook, older
plants are typically more costly since they require more equipment and facility maintenance on average
and also have to undertake capital investments to maintain compliance with a range of regulations. Given
that the capacity-weighted average age of the US coal-fired fleet currently stands at roughly 40 years old,
the bulk of coal-fired power plants still in operation during 2030 will likely have been in service for more
than 50 years.
Overall, the weighted share of electricity generation for Northern West Virginia is expected to fall to 55
percent or so by the mid-2020s and trend lower over the remainder of the outlook period, slipping several
more percentage points over the next decade. Shipments to coal-fired power plants in West Virginia will
buoy the coal share of generation for the state’s northern coal mines, but the likely construction of at least
one of the three proposed natural gas power plants will lower coal’s dominance in generating electricity.
By comparison, the weighted share of generation for states receiving shipments from Southern West
Virginia is forecast to dip below 40 percent within the next five years and continue falling in subsequent
years, falling into the lower 30-percent range by the mid-2030s.
16
Bureau of Business & Economic ResearchINDUSTRIAL DEMAND: Domestic demand for West Virginia coal will also be challenged by declines in
use via industrial and commercial applications. Fuel switching by industrial customers will account for the
majority of this drop, as an abundance of low-cost shale gas enables manufacturers to transition to
natural gas for CHP needs. Efficiency gains in industrial machinery and HVAC equipment, as well as the
design and construction of energy-efficient buildings and declining costs created by high-efficiency
lighting equipment also stand to reduce coal (and overall energy) use in commercial settings.4
EXPORTS: Given the diminishing use of coal in the US, global markets are expected to be a more
consistent source of demand for coal from West Virginia’s mines. The forecast calls for US coal exports to
fall in a relatively stable range of 80 to 87 million tons between 2020 and 2040, which would suggest
(based upon historical standards) West Virginia coal exports will likely average 25 to 30 million short tons.
However, this range of export tonnage for the state is only expected to last through the first half of the
outlook period before trending into the lower 20 million ton range during the second half of the forecast
horizon. First, a significant portion of the productive capacity that came on-line in the 2017-2018 rebound
can be characterized as swing production, smaller operations that ramp up output as global prices
increase due to growing demand and/or a major supply shortfall. With export prices expected to cool over
the next several years, production from these mines will decline in kind until the next boom in demand or
supply crunch. Secondly, some of the largest met coal operations in the state have been in operation for
many years, but have seen two large upswings in global coal demand in the space of less than a decade.
Given what is known about their recoverable reserves, several of these operations will likely begin to
approach the point of seam depletion (from an economic perspective) within the next decade.
Southern West Virginia will continue to account for most of the state’s export shipments due to its
abundant met coal reserves as well as increasing demand for the region’s thermal coal from Asia and
parts of Europe. Northern West Virginia has traditionally had a lower exposure to exports, but the forecast
assumes exports will become a larger role in the region’s end-market coal demand going forward as
mining companies in the area seek to offset declining coal-fired generation in the US by increasing sales
to developing countries that are expected to add significant coal capacity.
India will likely remain at or near the top in terms of the state’s top overseas buyer of coal from West
Virginia. The nation’s sheer energy needs that are created not only by a rapidly-growing economy, but
also the goal of providing electricity to all of its citizens, many of them who are located in rural and
impoverished regions, will require a lot of new electric generation capacity that cannot be met by
renewable generation alone. Indeed, India has an estimated 43 GW or so of coal-fired capacity under
construction and another 101 GW in the announced, permitted or in the pre-permit phases.
PRODUCTION BY REGION: Both producing regions in West Virginia are expected to endure declines in
coal production between 2020 and 2040, but Southern West Virginia will likely endure the largest overall
losses in output over this time frame. While the decline that occurred between 2012 and 2016 will not be
repeated, Southern West Virginia will see shipments of coal to domestic power plants shrink further as
Duke Energy accelerates the transition of its generation portfolio away from coal over to natural gas.
Export demand will buoy the region’s production going forward, but given that coal use is declining in
many parts of the world, opportunities for growth will be difficult. Southern West Virginia’s coal industry
4
Assumptions regarding domestic industrial demand for coal are derived in part from the EIA’s Annual Energy
Outlook 2018.
17
Bureau of Business & Economic Researchwill also be limited to a significant degree by its high cost structure compared to other coal basins, as
many decades of aggressive mining have left the region with a depleted base of recoverable reserves
and high operating costs. Overall, Southern West Virginia production is expected to fall from the lower 40-
million ton range down to just over 27 million tons by the late 2030s.
Given its large exposure to the ongoing shifts in the US electric power sector, coal production from
Northern West Virginia is expected to decline over the long term. Low production costs will enable the
region’s most highly-productive mines to navigate a shrinking domestic market for thermal coal, though
even these operations will also see shipments taper over time as additional coal-fired generation is
retired, converted or dispatched less frequently in Ohio, Pennsylvania and Kentucky. Export markets will
account for an increasing share of the region’s coal production over the long term and should help to
offset the loss in domestic demand. Developing economies such as India, Turkey and Vietnam are
potential destination markets as these countries are set to expand their coal-fired generation capacity in
the coming years and have indicated a desire to diversify the countries from whence they source coal.
Furthermore, even though the region contains a large quantity of recoverable reserves, some mines will
likely begin to approach the point of exhausting their economically-feasible reserves during the outlook
period as production has been strong and steadier (compared to Southern West Virginia) for much of the
last five years or so. Overall, coal output from the state’s northern mines is expected to decline roughly 10
percent between 2020 and 2040, falling to 38 million tons by the late 2030s.
18
Bureau of Business & Economic Research7 Alternative Scenarios for Coal Production
The baseline forecast is built upon a series of assumptions that can have significant impacts on the
state’s coal production outlook. These assumptions include expectations for domestic and global
economic growth, the competitive and regulatory environments and how each interact with costs to the
mining industry itself as well as those borne by the electric power and industrial sectors. The impact of
these assumptions can be substantial and, by consequence, illustrate the extent to which the baseline
forecast can deviate in a significant manner due to future changes in policy or markets. Each of the
following scenarios assume changes in policy or underlying economic conditions in isolation of one
another, with all other exogenous variables held constant.
7.1 Sensitivity Analysis: Differences in Economic Growth
Economic growth influences electricity demand and steel production, which are easily the pre-dominant
uses of coal. The baseline forecast utilizes some macroeconomic inputs from IHS Markit, which assumes
real GDP will grow at an average annual rate of 2.1 percent between 2016 and 2040—a rate that is well
short of growth observed during the post-WWII era. Using this assumption, statewide coal production is
expected to decline 17 percent from 2016 levels. By raising expectations for national economic growth to
a rate of nearly 2.5 percent per year would shrink the overall loss in the state’s coal production decline to
just over 10 percent, as stronger growth would require a higher level of met coal output from Southern
West Virginia and additional thermal coal from Northern West Virginia. By comparison, reducing the
assumption for real GDP growth down to a rate of 1.5 percent annually would cause production to fall by
19 percent compared to 2016.
Figure 11: Change in West Virginia Coal Production by GDP Growth Scenario (2016-2040)
19
Bureau of Business & Economic Research7.2 Sensitivity Analysis: Natural Gas Use
The first scenarios under consideration in this report examine differing trajectories for the channels of
end-market demand for natural gas. The baseline forecast assumes that natural gas production will rise
throughout much of the outlook period, with supply growth from the Marcellus, Utica, and other shale
plays responding to increased use of natural gas in electricity generation, new downstream processing
facilities in the Mid-Atlantic and Gulf Coast regions as well as rising international consumption of US shale
gas via LNG exports. The baseline forecast calls for natural gas use by industrial consumers to increase
by nearly 30 percent between 2016 and 2040 thanks to overall growth in manufacturing activity as well as
the increased conversion of CHP boilers from coal to gas. Inflation-adjusted prices paid by utilities for
natural gas are expected to increase during the outlook period, but will not surpass $4.00 per MMBtu on
an inflation-adjusted basis until the late-2030s.
LOW NATURAL GAS USE SCENARIO: An alternative scenario was developed, under which natural gas
use will be weaker than expected compared to the baseline forecast. The mechanisms by which natural
gas consumption could fail to match expectations would likely come from issues that affect the availability
of natural gas. These might include fracking bans, tighter rules on methane emissions from wells or
equipment, pipeline cancellations or weaker-than-expected productivity levels from US shale formations.
In one form or another, these changes would tend to raise the price of natural gas for both domestic and
overseas consumers and would make it more costly relative to coal and renewables as a fuel for electric
utilities and industrial consumers. Indeed, inflation-adjusted prices paid by utilities would surpass $4 per
MMBtu as soon as 2020 and continue rising at a rate of more than 2 percent per year. Real prices for
industrial electricity are also expected to be an average of more than 15 percent each year through 2040.
As Figure 12 suggests, this scenario would result in a higher level of coal output from West Virginia
relative to the baseline—roughly 4 million short tons higher overall in 2040. Most of this difference would
stem from electricity generation (both utilities and CHP) as higher-priced natural gas would encourage
more coal generation to stay on-line longer during the outlook period, assuming no changes in emissions
rules or the introduction of a tax on CO2 emissions from power plants and other users. However, the
difference in statewide coal production between the baseline and this alternative is expected to shrink as
time progresses. More coal-fired power plants would remain in operation for longer, but the fact that few
plants have been built in the past decade (and more than 50 GW has been retired in recent years) would
point to a large portion of the remaining coal fleet reaching the end of normal service lifetimes by the mid-
to late-2020s. The most efficient plants or the ones most critical to grid operability would likely be kept
open for extended periods, but rising maintenance costs for aging generators and facilities would cause
less efficient plants to be retired from service.
Natural gas generation would still be added under this scenario as it would likely retain competitiveness
against coal plants in areas closer to shale gas production, but new wind and solar capacity, which has
fewer regulatory and permitting issues to overcome (and thus takes less time to build) would eventually
account for a significant portion of new generation coming on line during the outlook period.
20
Bureau of Business & Economic ResearchYou can also read