POTASH OUTLOOK AND FUNDAMENTALS 101 - 17 JUNE 2021 DR HUW MCKAY CHIEF ECONOMIST DR PAUL BURNSIDE MANAGER POTASH ANALYSIS - BHP

Page created by Danny Le
 
CONTINUE READING
POTASH OUTLOOK AND FUNDAMENTALS 101 - 17 JUNE 2021 DR HUW MCKAY CHIEF ECONOMIST DR PAUL BURNSIDE MANAGER POTASH ANALYSIS - BHP
Potash outlook and fundamentals 101

Dr Huw McKay Chief Economist
Dr Paul Burnside Manager Potash Analysis

17 June 2021
POTASH OUTLOOK AND FUNDAMENTALS 101 - 17 JUNE 2021 DR HUW MCKAY CHIEF ECONOMIST DR PAUL BURNSIDE MANAGER POTASH ANALYSIS - BHP
Disclaimer
Forward-looking statements
This presentation contains forward-looking statements, including statements regarding: trends in commodity prices and currency exchange rates; demand for commodities; production forecasts; plans, strategies and objectives of management; assumed long-term scenarios; potential
global responses to climate change; the potential effect of possible future events on the value of the BHP portfolio; closure or divestment of certain assets, operations or facilities (including associated costs); anticipated production or construction commencement dates; capital costs and
scheduling; operating costs and shortages of materials and skilled employees; anticipated productive lives of projects, mines and facilities; provisions and contingent liabilities; and tax and regulatory developments.
Forward-looking statements may be identified by the use of terminology, including, but not limited to, ‘intend’, ‘aim’, ‘project’, ‘anticipate’, ‘estimate’, ‘plan’, ‘believe’, ‘expect’, ‘may’, ‘should’, ‘will’, ‘would’, ‘continue’, ‘annualised’ or similar words. These statements discuss future
expectations concerning the results of assets or financial conditions, or provide other forward-looking information.
These forward-looking statements are based on the information available as at the date of this presentation and/or the date of the Group’s planning processes or scenario analysis processes. There are inherent limitations with scenario analysis and it is difficult to predict which, if any, of
the scenarios might eventuate. Scenarios do not constitute definitive outcomes for us. Scenario analysis relies on assumptions that may or may not be, or prove to be, correct and may or may not eventuate, and scenarios may be impacted by additional factors to the assumptions
disclosed. Additionally, forward-looking statements are not guarantees or predictions of future performance, and involve known and unknown risks, uncertainties and other factors, many of which are beyond our control, and which may cause actual results to differ materially from those
expressed in the statements contained in this presentation. BHP cautions against reliance on any forward-looking statements or guidance, particularly in light of the current economic climate and the significant volatility, uncertainty and disruption arising in connection with COVID-19.
For example, our future revenues from our assets, projects or mines described in this presentation will be based, in part, upon the market price of the minerals, metals or petroleum produced, which may vary significantly from current levels. These variations, if materially adverse, may
affect the timing or the feasibility of the development of a particular project, the expansion of certain facilities or mines, or the continuation of existing assets.
Other factors that may affect the actual construction or production commencement dates, costs or production output and anticipated lives of assets, mines or facilities include our ability to profitably produce and transport the minerals, petroleum and/or metals extracted to applicable
markets; the impact of foreign currency exchange rates on the market prices of the minerals, petroleum or metals we produce; activities of government authorities in the countries where we sell our products and in the countries where we are exploring or developing projects, facilities or
mines, including increases in taxes; changes in environmental and other regulations; the duration and severity of the COVID-19 pandemic and its impact on our business; political uncertainty; labour unrest; and other factors identified in the risk factors discussed in BHP’s filings with the
U.S. Securities and Exchange Commission (the ‘SEC’) (including in Annual Reports on Form 20-F) which are available on the SEC’s website at www.sec.gov.
Except as required by applicable regulations or by law, BHP does not undertake to publicly update or review any forward-looking statements, whether as a result of new information or future events. Past performance cannot be relied on as a guide to future performance.

BHP Climate Change Report 2020
This presentation should be read in conjunction with the BHP Climate Change Report 2020 available at bhp.com. Some of the information in this presentation provides a concise overview of certain aspects of that Report and may omit information, analysis and assumptions and,
accordingly, BHP cautions readers from relying on that information in this presentation in isolation.

Presentation of data
Numbers presented may not add up precisely to the totals provided due to rounding.

No offer of securities
Nothing in this presentation should be construed as either an offer or a solicitation of an offer to buy or sell BHP securities in any jurisdiction, or be treated or relied upon as a recommendation or advice by BHP.

Reliance on third party information
The views expressed in this presentation contain information that has been derived from publicly available sources that have not been independently verified. No representation or warranty is made as to the accuracy, completeness or reliability of the information. This presentation
should not be relied upon as a recommendation or forecast by BHP.

BHP and its subsidiaries
In this presentation, the terms ‘BHP’, the ‘Company’, the ‘Group’, ‘our business’, ‘organization’, ‘Group’, ‘we’, ‘us’ and ‘our’ refer to BHP Group Limited, BHP Group Plc and, except where the context otherwise requires, their respective subsidiaries set out in note 13 ‘Related undertaking
of the Group’ in section 5.2 of BHP’s Annual Report and Form 20-F. Those terms do not include non-operated assets. This presentation includes references to BHP’s assets (including those under exploration, projects in development or execution phases, sites and closed operations)
that have been wholly owned and/or operated by BHP and that have been owned as a joint venture operated by BHP (referred to as ‘operated assets’ or ‘operations’) during the period from 1 July 2020 to 31 December 2020. Our functions are also included.
BHP also holds interests in assets that are owned as a joint venture but not operated by BHP (referred to in this presentation as ‘non-operated joint ventures’ or ‘non-operated assets’). Our non-operated assets include Antamina, Cerrejón, Samarco, Atlantis, Mad Dog, Bass Strait and
North West Shelf. Notwithstanding that this presentation may include production, financial and other information from non-operated assets, non-operated assets are not included in the Group and, as a result, statements regarding our operations, assets and values apply only to our
operated assets unless otherwise stated. References in this presentation to a ‘joint venture’ are used for convenience to collectively describe assets that are not wholly owned by BHP. Such references are not intended to characterise the legal relationship between the owners of the
asset.

Potash outlook briefing
17 June 2021                                                                                                                                      2
POTASH OUTLOOK AND FUNDAMENTALS 101 - 17 JUNE 2021 DR HUW MCKAY CHIEF ECONOMIST DR PAUL BURNSIDE MANAGER POTASH ANALYSIS - BHP
Potash: a future facing commodity with
attractive long term fundamentals
POTASH OUTLOOK AND FUNDAMENTALS 101 - 17 JUNE 2021 DR HUW MCKAY CHIEF ECONOMIST DR PAUL BURNSIDE MANAGER POTASH ANALYSIS - BHP
Potash fundamentals: key messages
A future facing commodity with attractive long term fundamentals from multiple angles

                                               • Potash sits at the intersection of global demographic, social and environmental megatrends
     A Future Facing                           • The environmental footprint of potash is considerably more attractive than other major
       Commodity                                 chemical fertilisers
                                               • Conventional mining with flotation is more energy and water efficient than other production routes

                                               • Traditional demand drivers of population and diet are reliable and slow moving
       Reliable base
                                               • Attractive upside over basic drivers exists due to the rising potash intensity-of-use needed to support
       demand with
                                                 higher yields and offset depleting soil fertility
     attractive upside
                                               • On top of the already compelling case, decarbonisation could amplify demand upside1

  The industry’s 4th                           • Demand is catching up to excess supply, and major supply basins are mature
  wave is underway:                            • Price formation regime accordingly expected to transition from current SRMC to durable inducement
 demand to catch-up                              pricing, with Canada well placed to meet market growth longer term at LRMC in the mid $300s
  over the course of                           • Post the balance point, long-run geological and agronomic arguments skew probabilistic risks upwards
      the 2020s                                  (LRMC plus fly-up) rather than downwards (SRMC), in our view
Note: Short Run Marginal Cost (SRMC); Long Run Marginal Cost (LRMC).
1. Based on BHP’s 1.5°C Scenario. Refer to the BHP Climate Change Report 2020 for information about this scenario and its assumptions.
Potash outlook briefing
17 June 2021                                                                                                          4
POTASH OUTLOOK AND FUNDAMENTALS 101 - 17 JUNE 2021 DR HUW MCKAY CHIEF ECONOMIST DR PAUL BURNSIDE MANAGER POTASH ANALYSIS - BHP
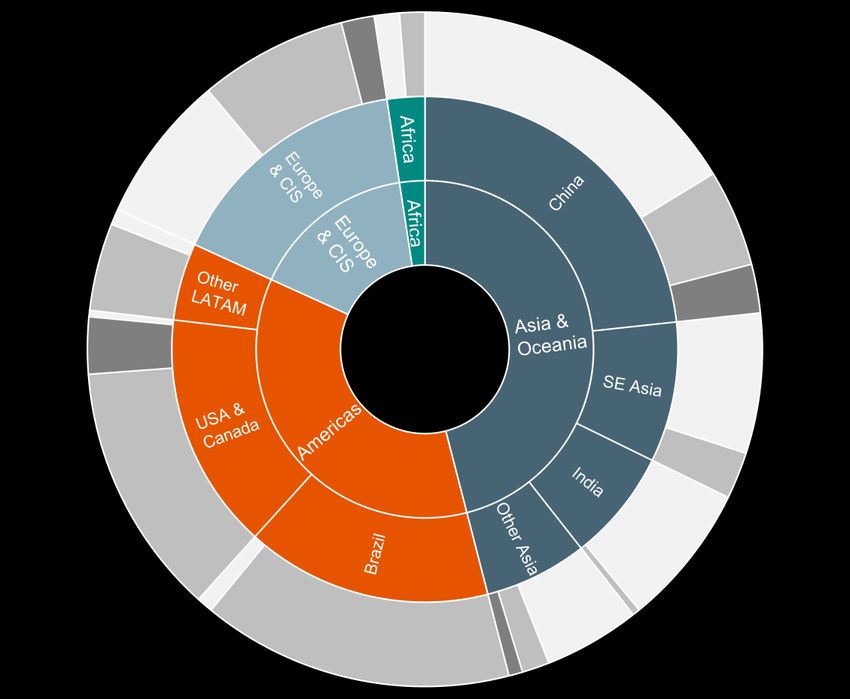
Potash attractiveness parameters
Transitioning towards inducement pricing as consistent demand uplift absorbs today’s excess supply

                      Favourable supply and demand gap                                                                                                 Large market size

                                                                                                                                                                                     

                                      Inducement pricing expected to
                                     emerge and sustain once demand
                                                                                                                                                   ~70 Mt today, 89-97Mt in 20351
                                   growth absorbs current supply excess

                              Differentiated demand drivers                                                                        Value creation and return potential

                                                                                                                                                                                     

                         Considerable differentiation from industrial metals                                                             Capital intensity of new supply creates
                           over the course of the development process:                                                                          steep inducement curve
                                no global demand peak in prospect                                                                    Operating margins superior in upstream segment

                                                                                  Thrive in a Paris-aligned world                                           
1. The rounded average of Argus, CRU and IHS is ~89 Mt. ~97 Mt is the level implied by Nutrien’s 2020s range midpoint of 2.25% extrapolated to 2035.
Potash outlook briefing
17 June 2021                                                                                                           5
POTASH OUTLOOK AND FUNDAMENTALS 101 - 17 JUNE 2021 DR HUW MCKAY CHIEF ECONOMIST DR PAUL BURNSIDE MANAGER POTASH ANALYSIS - BHP
Downstream potash drivers highly differentiated
Diversification in terms of demand drivers vs. our wider portfolio of steel making, non-ferrous and energy commodities

                           Fertiliser value chain                                                                    Metals value chain                                                                       Energy value chain
                     Population growth and dietary change                                      Urbanisation and industrialisation                                                        Motorisation, electrification, industrialisation

                     Food, feed, fibre, fuel                                                   Buildings, infrastructure, machinery, appliances                                          Transport, power, heat, chemicals

                     Low degree of recycling1                                                  High degree of recycling                                                                  Low degree of recycling2
                     Steady increase in intensity through the entire                           Swift increase in intensity on the way to middle                                          Swift increase in intensity on the way to middle
                     development journey, high income plateau                                  income, where a distinct peak forms                                                       income, flatter beyond, high income plateau
     Crop needs per head

                                                                                             Metal demand per head

                                                                                                                                                                                  Primary energy per head
                                                  GDP per head                                                                        GDP per head                                                                                  GDP per head
                                    Traditional growth drivers                       Major uses by society                                  Degree of Circularity                                           Relationship to living standards

Note: Illustrative only, reflecting stylised empirical path of major societies through time that have reached high income levels.
1. Recycling of nutrients via crop residue or manure occurs, but the food value chain is very inefficient and highly subject to waste.
2. Petroleum value chain specifically features plastics recycling, but this is a very small item in the entire value chain (a sub set of a sub set). Carbon capture use and storage (CCUS) expected to increasingly feature in industrial applications.
Potash outlook briefing
17 June 2021                                                                                                                  6
POTASH OUTLOOK AND FUNDAMENTALS 101 - 17 JUNE 2021 DR HUW MCKAY CHIEF ECONOMIST DR PAUL BURNSIDE MANAGER POTASH ANALYSIS - BHP
Fundamental relationships are extremely reliable
Crop production growth has exceeded population growth in the long run: potash has in turn exceeded growth in crop production

Population up ~2.5 fold since 1960, crops ~3.5 fold, potash ~4.5 fold                                                                       CAGR, 1960-1993
(Index, 1960 = 100)                                                                                                                         (%)
500                                                                                                                                         3
                                                                                                                              Potash
                                                                                                                              fertiliser
450                                                                                                                           demand        2

400                                                                                                                                         1
                                                                                                                              Crop
                                                          Collapse of                                                         production             1.9             2.3              2.4
350                                                                                                                                         0
                                                          Eastern Bloc
                                                                                                                                                  Population   Crop production Potash fertiliser

300                                                                                                                                         CAGR, 1993-2020
                                                                                                                                            (%)
250                                                                                                                           Population    3

200                                                                                                                                         2

150                                                                                                                                         1

                                                                                                                                                     1.2            2.1               2.7
100                                                                                                                                         0
   1960 1965 1970 1975 1980 1985 1990 1995 2000 2005 2010 2015 2020                                                                               Population   Crop production Potash fertiliser
Data: UN World Population Prospects 2019; International Fertilizer Association; BHP analysis based on multiple sources.
Note that ‘potash fertiliser demand’ relates to estimated underlying consumption at the farm-level rather than to upstream MOP shipments.
Potash outlook briefing
17 June 2021                                                                                                              7
Potash benefits in a decarbonising world
Rising biofuels production and land use implications of afforestation burnish an already attractive potash demand profile

Cumulative demand in the next 30 years compared to the last 30 years1
(%)
400
                                                                                                                                                                                                   1.5°C Scenario
                                        Already compelling
                                                                                                                                                                                                   Central Energy View
                                         demand case …
                                                                                                                                                                                                   Lower Carbon View
                                                                                                                                                                                                   Climate Crisis
300
                                                                                                   … potentially amplified under
                                                                                                      a 1.5 degree pathway

200

100

   0
                       Nickel 2                               Potash                                  Copper 2                               Iron ore 3                          Metallurgical 3                       Oil
                                                                                                                                                                                    coal
Data: BHP; Vivid Economics.
1. Our portfolio is tested across a range of futures. Refer to the BHP Climate Change Report 2020 for more information about these climate-related scenarios and their assumptions.
   Scenarios were developed prior to the impacts of the COVID-19 pandemic, and therefore any possible effects of the pandemic were not considered in the modelling.
2. Nickel and copper demand references primary metal.
3. Iron ore and metallurgical coal demand based on Contestable Market (Global seaborne market plus Chinese domestic demand).
Potash outlook briefing
17 June 2021                                                                                                             8
The waves that have defined the potash industry
 A 4th wave is underway, with demand in catch-up mode. Once it does, an inducement pricing regime is the most likely outcome

 Change over 5 years                                                                                                                                                                                                    MOP price
 (%)                                                                                                                                                                                                                     (US$/t real)
 75                                                                                                                                                                                                                             700
                                Supply led                                                                Supply led                               Demand led
                                 Wave #1                                                                   Wave #2                                  Wave #3                                              Wave #4

                                                                                                                                                                       Supply
 50                                                                                                                                                                  catch-up                                                   525
                                                                                                                                                                      (late and
                                                         Demand                                                                                                      excessive)
                                                         catch-up
                                                                                                                         Demand
                                                                                                                         catch-up
                                                                                                                                                                                           Demand
 25                                                                                                                                                                                        catch-up
                                                                                                                                                                                                                                350
                                                                                                                                                                                                              Inducement
                                                                                                                                                                                                                pricing
                                                                                                                                                                                                                regime

  0                                                                                                                                                                                                                             175

                                                                                                  Re-orientation
                     Development of                                                           of ex-Soviet capacity                      Demand boom,
                  Saskatchewan deposit                                                        to the global market                       price upswing
(25)                                                                                                                                                                                                                            0
       1960                       1970                         1980                         1990                         2000                         2010                          2020                         2030

                          Demand growth over last 5 years (LHS)                                  Capacity expansion over last 5 years (LHS)                                  Price level (RHS, not smoothed)

 Data: BHP analysis based on multiple sources
 Note: New supply from FSU is shown in 1990s when existing supply was re-directed from domestic and Eastern Bloc markets after local demand collapsed. Eastern Bloc demand excluded until 1992. 2009 demand excluded.
 Potash outlook briefing
 17 June 2021                                                                                                        9
How soon will demand catch-up in Wave #4?
Consensus view is that demand will catch-up in the late 2020s/early 2030s

MOP demand
(Mt)
110                                                                                                                                                                                                   3% average CAGR

100

                                                                                                                                                                                                      2% average CAGR
 90                                                                                                                                                                                                   Specialist average (1.7%)1
                                                                          Achievable production (w/o Jansen)

 80                                                                                                                                                                                                    1% average  CAGR
                                                                                                                                                                                                               Jansen  S1
                                                                                                                                                                                                         Greenfield under
                                                                                                                                                                                                         Spareconstruction
                                                                                                                                                                                                                capacity,,
                                                                                                                                                                                                               brownfield
 70                                                                                                                                                                                                            expansion
                                                                                                                                                                                        Existing supply

 60
                                          10 year linear trend (+1.8 Mt/y)

 50

 40
   2010                                    2015                                   2020                                   2025                                   2030                              2035
Historical data: CRU. Nutrien range of 2.0% to 2.5% in the 2020s as disclosed in 2021 Q1 earnings call. Achievable production is BHP analysis based on multiple sources.
Note that the chart shows linear interpolations that result in the same 2020-2035 aggregate tonnage increment as the stated CAGRs.
1. Specialist average based on CRU, Argus, Fertecon (IHS Markit). 2020-2035 CAGR calculated relative to trend level in 2020 (69.5 Mt) not to actual level estimated by CRU (71.6 Mt).
Potash outlook briefing
17 June 2021                                                                                                            10
What can be expected under inducement & fly-up pricing?
Forward looking LRMC is broadly in line with through-cycle averages, considerably above SRMC experience of the last few years

MOP price
(US$/t real)
 750

500
                   Upswing average                                                                                                          Indicative of multi-year “fly-up” pricing should a strong demand-led
                     2008-2013                                                                                                               cycle emerge with a delayed supply response from ageing basins
                                                                                   Through cycle average
                       $470
                                                                                       2008 to date
                                                                                          $350                                                                     Long-run marginal cost (LRMC)
                                                                                                                                                                    at mid case macro assumptions1

250
                                                                                                                                                                   Short-run marginal cost (SRMC)
                                                                                                                                                                across a range of macro assumptions1
                                                                                        Downswing average
                                                                                           2014 to date
                                                                                             $260

    0
     2000                     2005                     2010                     2015                     2020

Data: IHS Markit. Average trade value of Canadian MOP exports.
1. Macro assumptions include items such as FX rates, energy costs, carbon and labour. Shaded boxes are the approximate price range associated with the operating conditions described therein.
Potash outlook briefing
17 June 2021                                                                                                          11
Inducing solution mining will provide tilt to the cost curve
SRMC significantly higher than conventional flotation, forward looking LRMC for Canadian solution mining is mid-$300/t

                               Operating cost curve                                          Inducement cost curve
                                SRMC conditions                                                 LRMC conditions
 Solution mines use significantly more energy and more water                The inducement curve is steep due to the underlying capital
 than conventional mines. Sustaining capex is also higher                   intensity of projects

 This comes at a material operational cost disadvantage that is             Solution mining in Canada is expected to set the industry LRMC
 expected to amplify under rising carbon pricing                            • Other candidates are too small, or disparate, to serve as an
 • The lowest cost mines1 (~US$100/t FOB), and the vast majority              effective “bench” to anchor long run trend pricing
   of mines in Q1 of the operating- cost curve, are large scale             • This solution mining bench is still “available” because
   conventional operations                                                    conventional opportunities, with their favourable operating
 • Operating solution mines in Canada1 are currently in the range             costs, have been rightly prioritised for development
   of US$180-$210/t (FOB)                                                   • In bulk mining, you do not save the best for last
                                                                            • We estimate a trend price in the mid-US$300/t region will be
                                                                              required to induce a material portion of this Canadian bench
                                                                              into production

1. Source: CRU.
Note: Long Run Marginal Cost (LRMC); Short Run Marginal Cost (SRMC).
Potash outlook briefing
17 June 2021                                                           12
Fertiliser and the global
food supply chain
Crop yields hold the key to future food security
 Impressive gains in yields have offset declining cropland per head since the 1960s, but there remain major yield gaps between regions
 that could narrow with better farm practice, including scientific fertiliser application

        Competition for global land use                              Global             Global           Crop yields: large gaps between the frontier and the rest is
                                                                    crop use3       dietary profile1     cause for optimism                                Bubble width = yield
                                           Pasture land 24%
                                                                                                                                                                       1960s      1970s
                                                                     Fibre
What governs crop yields?
Potassium availability is just one of a complex web of interacting factors that impact crop yield

                     Potential yield                                                                    GEOGRAPHY

                     Determined by genetics                                                  FARM
                                                                                                                      WEATHER
                                                                                           PRACTICE

                                                                                                         YIELD

                     Attainable yield                                                      GENETICS                     SOIL

                     Limited by external factors – aspects of climate,
                                                                                                        NUTRIENTS
                     soil type and geography

                                                                                                          Nitrogen
                     Achieved yield                                                                          (N)

                     Dependent on farm practice to optimise                                Phosphorus                 Potassium
                                                                                              (P)                        (K)
                     availability of water and nutrients, to minimise
                                                                                                         Secondary
                     the impact of pests, disease and bad weather,                                        & micro-
                     and to condition the soil                                                            nutrients

Potash outlook briefing
17 June 2021                                                            15
Why do plants need potassium?
Potassium works as a chemical regulator – adequate potassium is needed for healthy growth

                                            Liebig's Law of the Minimum
                                                                                                                                             Building block
                                                                                                                                             Potassium is found in cells throughout
                                                                                                           Potassium availability is         a plant; It regulates critical processes
                                                                                                           one of dozens of factors          including photosynthesis, enzyme
                                                   Soil conditions                                        that influence crop yields         activation and temperature control
                                 Water

                                                     and other
                                                   growth factors

                                                                                                          Any one of these factors
                                                   YIELD
                                                                                                           may be yield-limiting
                                                                                               Iron

                                                                                                                                             Drought tolerance
        Phosphorus

                                                                                                                                             Potassium plays a major role in the
                                                                                    Nitrogen
                                                                          Calcium
                                                              Magnesium
                     Potassium

                                                                                                                                             transport of water, and in the uptake
                                         Sulphur

                                                                                                         If potassium availability isn’t
                                                                                                                                             of other nutrients
                                                                                                      yield-limiting then applying more
                                                                                                        won’t have any effect on yield

                                                                                                             Identifying existing or         The ‘quality nutrient’
                                                                                                         approaching yield limitations,      Potassium can improve appearance,
                                                                                                       including potassium, is critical in   taste, shelf life and nutritive value
                                                                                                      closing the gap to Attainable Yield

Potash outlook briefing
17 June 2021                                                                                                                            16
What is fertiliser?
Fertilisers are materials that contain essential nutrients that are the “building blocks” of plants

                                  Consumption of primary nutrients        Consumption of potash                 Potassium chloride (MOP) is the most
                                  via inorganic fertilisers               fertiliser in different forms         common type of potash fertiliser

• The primary nutrients are                  Potash fertilisers
  nitrogen (N), phosphorus           20%                                                                            Purity (KCl / K2O)
                                             account for 20%
  (P) and potassium (K) but                                                                                         Agricultural:   min 95% KCl (60% K2O)
  many other nutrients are                                                                                          Technical:      min 98% KCl
  also needed                                                                                                       Pharmaceutical: 99.9% KCl
                                             Phosphate fertilisers
                                     25%
                                             such as DAP and SSP
• Different nutrients perform
                                                                                                                    Particle size
  different functions in plants                                               90%      Potassium chloride
  and are not substitutable                                                            (MOP)                        Fine:            0.2 - 0.5mm
                                                                                                                    Standard:        0.5 - 1mm
                                                                                                                    Coarse:          2 - 3mm
• Plants can draw on native
                                             Nitrogen fertilisers such                                              Granular:        3 - 4mm
  potassium in the soil, but
                                     55%     as urea and
  farmers commonly provide                   ammonium nitrate
  additional nutrients by                                                                                           Colour
  spreading potash fertiliser                                                                                       Red
  and/or organic material like                                                         MOP derivatives              White
                                                                              6%
  animal manure                                                                        Other types of potash
                                                                              4%
                                                                                       (including polyhalite)
Data: BHP; IFA.
Potash outlook briefing
17 June 2021                                                             17
Most potash operations fall into three basic types
MOP is extracted from underground ore deposits or recovered from natural brines

      Conventional mining                           Solution mining of ore                             Natural brines

                                                                                Solution mining is
                                                                                more water-intensive
                                                                                than ore flotation

              Sylvinite ore                              Sylvinite brine                               Carnallite slurry

                                                                            Crystallising MOP
            Flotation-based                              Crystallisation-   from sylvinite brine is     Crystallisation-
                              Standard MOP
                   mill                                    based mill       more energy-intensive         based mill
                                                                            than flotation

                               Compaction
               Jansen is                                                                                  Fine MOP
                                 plant
              designed to
             produce MOP
              via flotation   Granular MOP

Potash outlook briefing
17 June 2021                                                   18
How is MOP used?
Most MOP is used as fertiliser, often in combination with other nutrients

                                                       Combination                  Bulk-blend NPKs
                                                       into multi-nutrient
                                                ~75%                                                               Jansen
                                                            fertilisers             Compound NPKs                 Most  MOPproduct
                                                                                                                              is used asisfertiliser,
                                                                                                                                            suitable for
                                                                                                                  eitherstraight
                                                                                                                        on its ownapplication
                                                                                                                                    or physically or
                          Fertiliser            ~20%                                                              combined
                                                                                                                  combinationwith other
                                                                                                                                   intofertilisers.
                                                                                                                                         multi-nutrient
                                                                                    Straight application
                           MOP                                                                                            fertilisers (NPKs)
                                                                             ~70%
                                   ~92%                Conversion                   Potassium sulphate
                                                ~5%
                                                        into derivative
                                                           fertilisers              Potassium nitrate
                                                                             ~30%

        MOP
                                                                                    Heavy industry

                                                                                    Animal nutrition
                                                        Direct use
                                   ~8%          ~30%                                Low-sodium table salt
                       Non-fertiliser
                                                                                    Water softeners & ice melts
                          MOP
                                                                             ~90%
                                                ~70%   Conversion                   Potassium hydroxide
                                                        into derivative
                                                          chemicals                 Other chemicals
Data: BHP analysis based on multiple sources.                                ~10%
Potash outlook briefing
17 June 2021                                                                              19
Geography of supply and demand
Production concentrated in Canada, Russia and Belarus; Biggest consumers China, Brazil, United States and India

                                                Supply                                                                                 Demand

         Conventional mining (~70%)               Surface brines (~25%)            Solution mining (~5%)        Standard/fine (~45%)    Granular (~45%)   Industrial (~10%)
Data: BHP analysis based on multiple sources.
Note: 2020, 70 Mt MOP production, 72 Mt MOP sales (CRU). Split by grade is approximate.
Potash outlook briefing
17 June 2021                                                                                               20
Major producers and trade flows
  Highly globalised commodity, most major markets have multiple sources of imports

                                                                                             Uralkali
                                                                                             EuroChem
                                          Nutrien
                                          Mosaic                               Belaruskali
                                             K+S

                                                                                             QSL Potash
                                                                         ICL
                                                                 Arab Potash
                                                                                                          Area producing:

                                                                                                             >10Mtpa MOP
Global overview
Potash supply chain
Supply chains are long with several steps even in-market

                                                                                                                                                                    Commonly, sales are
                                                                                                                                                                     made inclusive of
                                                                                                                                                                    ocean freight (CFR)

Raw potassium ore is processed                         Product for export is railed                              …and loaded onto bulk carriers1
    into MOP at the mine                                  to port terminals…

                                                                Retailer                        Blender                      Distributor                      Importer

   Local customers are served                           Retailers can offer a suite     Local blenders mix               National and regional
       by road, rail, barge                              of products: fertilisers,      bulk-blended NPKs                 distributors take the
                                                           seeds, equipment,                                               product to market
                                                          agronomic services
                                                                                                                                       Fertiliser factories
                                                                                            Fertilisers are
                                                                                         transported by rail,                          use MOP to make        NPK Factory
                                                                                        road or barge; farms                           compound NPKs
                                Farmers buy from local
                                                                                       may be over 1,000km                              or other potash
                                   retailers/blenders;
                                                                                      from the point of import                              fertilisers
                            larger agribusinesses may buy
                                directly from distributors

1. MOP is commonly shipped in Handysize, Handymax,
                                                             Jansen product will be sold both onshore
   Supramax or Panamax vessels (20,000-80,000dwt).           and offshore into upstream supply chain
Potash outlook briefing
17 June 2021                                                                               22
Potash: a low emission, biosphere friendly fertiliser
MOP is a critical nutrient with a modest environmental footprint, with conventional flotation route advantaged over solution mining

                                                                                                                              MOP                                MOP                           Nitrogen            Phosphate
                                                                                                                       (flotation-based)                 (solution mining)                    fertilisers          fertilisers
 Production footprint
 Low Scope 1+2 emissions (
Pricing realisation calculation
Prices are influenced by grade and volume, but there are also (fluid) variations between prices in different regions

                                      • Most sales are made on a delivered basis          US$/t MOP (quarterly average)
    Selling price                     • Sales may be spot or contract                     (nominal)
     Brazil CFR                       • Transacted prices are monitored by specialist     400
     China CFR                          price-discovery services
   US FOB w/house                     • Prices vary by product (e.g. standard/granular)                                                                                                                                                     CFR Brazil
                                                                                          350
              ‒                                                                                    CFR China                                                                                                                                (granular, spot)
                                                                                                   (standard, contract)

                                                                                          300
                                      • Sellers may offer volume-based discounts,
        Discounts
                                        conditional rebates or extended credit
                                                                                          250

              ‒                                                                                                                                                                                                                                            Vancouver netback range
                                                                                          200
        Seaborne                      • For CFR sales, sellers arrange ocean
         freight                        freight either using spot or long-term charter
                                                                                          150
                                                                                                                                                                                                                                                                                     Realised FCA

              ‒                                                                           100
                                                                                                                                                                                                                                                                                     (Nutrien)

                                                                                                Q1 2016
                                                                                                          Q2 2016
                                                                                                                    Q3 2016
                                                                                                                              Q4 2016
                                                                                                                                        Q1 2017
                                                                                                                                                  Q2 2017
                                                                                                                                                            Q3 2017
                                                                                                                                                                      Q4 2017
                                                                                                                                                                                Q1 2018
                                                                                                                                                                                          Q2 2018
                                                                                                                                                                                                    Q3 2018
                                                                                                                                                                                                              Q4 2018
                                                                                                                                                                                                                        Q1 2019
                                                                                                                                                                                                                                  Q2 2019
                                                                                                                                                                                                                                             Q3 2019
                                                                                                                                                                                                                                                       Q4 2019
                                                                                                                                                                                                                                                                 Q1 2020
                                                                                                                                                                                                                                                                           Q2 2020
                                                                                                                                                                                                                                                                                     Q3 2020
                                                                                                                                                                                                                                                                                               Q4 2020
                                                                                                                                                                                                                                                                                                         Q1 2021
                                                                                                                                                                                                                                                                                                                   Q2 2021
    Port costs and                          Realised price
    inland freight                    =       FOB mine
                                                                                             There  is no single “potash price”: for example, this chart shows a 5-yr history of Nutrien’s
                                                                                             FOB Mine
Data: CRU Fertilizer Week; Nutrien.                                                       realised price (FCA, offshore sales only) against benchmarks reported by CRU Fertilizer Week
Potash outlook briefing
17 June 2021                                                                              24
The outlook for potash
Demand drivers: from demographics to fertiliser demand
Forecasting long-term MOP demand is a 3-step process

                                                                                                Potash                               Potassium
           Socio-economic                                  Crop
                                                                                               fertiliser                             chloride
               drivers                                  production
                                                                                               demand                                 demand

                                       Step 1                               Step 2                                  Step 3
                          From population and income to        From crop production to potash               From potash fertiliser to
                          crop production                      fertiliser                                   potassium chloride
                          • How much do people eat?            • How much potassium nutrient do             • How much potash fertiliser
                                                                 crops take up?                               comes from other primary
                          • Which crops are needed to
                                                                                                              sources?
                            meet that requirement?             • Where does that nutrient come
                                                                 from?                                      • What about non-fertiliser
                          • Where are those crops grown?
                                                                                                              applications?
                                                                 Potash fertilisers
                          • What about crops for fuel and
                            fibre?                               Nutrient recycling
                                                                 Native potassium
                                                               • How much nutrient is lost in-situ?

Potash outlook briefing
17 June 2021                                                                   26
Forecasting Demand: Step 1 – crop requirements
Estimate the quantity of each crop required to meet demand for the 4Fs: food, feed, fibre, fuel

                                                               Food intake
           Population                           x            (kcal/person/day)

                                                           Wastage1

                                                                                 Animal     Animal feed
                                                          Global food supply     calories   requirement

                                                               (kcal/yr)         Vegetal
                                                                                 calories                 Global crop
                                                                                                          production
                                                                                              Fibres        (tonnes)

                                                                                             Biofuels

1. Wastage includes inbound supply-chain losses and post-retail waste.
Potash outlook briefing
17 June 2021                                                                     27
Forecasting Demand: Step 2 – potash requirements
Estimate the quantity, and source, of potassium nutrient needed to support crop production

                                                                                                          Plant biomass                 Observed K balance
                          Nutrient recycling
                                                                                                                                      = Observable K input
                                                                                                                      Yield
                                                                                                                                      – K output
                                                                                                                                      This “equality” is frequently negative as farmers “mine the
      Potash                    Animal                        Crop                                              Residue               soil” for the required potassium and do not provide sufficient
     fertiliser                 manures                     residues
                                                                                                                                      external sources to maintain soil quality.
                                                                                                     K uptake

                                                                                                                                        Inferred K balance
                       30%                        20%                        20%                                            30%
                                                                                                                                      = Observable K input
                                                                                                                                      + Inferred soil K mining
                                                                                                                                      – K output
                                                                                                                        Native
                       Intensity-of-Use = potash use                                                                                  This requires a step up in the supply of external potassium
                                                                                                                      potassium
                                        crop production                                                                 (soil K)      sources if yields are to be maintained, leading to a rising
                                                                                                                                      intensity of potash use.
Data: BHP analysis based on multiple sources.
Note: Figures are approximate estimated global average; regional/local contributions to K uptake vary widely.
Potash outlook briefing
17 June 2021                                                                                                              28
Fundamental relationships are extremely reliable
Crop production growth has exceeded population growth in the long run: potash has in turn exceeded growth in crop production

Population up ~2.5 fold since 1960, crops ~3.5 fold, potash ~4.5 fold                                                                      CAGR, 1960-1993
(Index, 1960 = 100)                                                                                                                        (%)
500                                                                                                                                        3
                                                                                                                              Potash
                                                                                                                              fertiliser
450                                                                                                                           demand       2

400                                                                                                                                        1
                                                                                                                              Crop
                                                          Collapse of                                                         production            1.9             2.3              2.4
350                                                                                                                                        0
                                                          Eastern Bloc
                                                                                                                                                 Population   Crop production Potash fertiliser

300                                                                                                                                        CAGR, 1993-2020
                                                                                                                                           (%)
250                                                                                                                           Population   3

200                                                                                                                                        2

150                                                                                                                                        1

                                                                                                                                                    1.2            2.1               2.7
100                                                                                                                                        0
   1960 1965 1970 1975 1980 1985 1990 1995 2000 2005 2010 2015 2020                                                                              Population   Crop production Potash fertiliser
Data: UN World Population Prospects 2019; International Fertilizer Association; BHP analysis based on multiple sources.
Note: ‘potash fertiliser demand’ relates to estimated underlying consumption at the farm-level rather than to upstream MOP shipments.
Potash outlook briefing
17 June 2021                                                                                                             29
Rising Intensity of Use (IoU): indicative ranges
Historical norm of potash growth exceeding crop growth is not under plausible threat. Attractive upside should IoU accelerate further.

Potash fertiliser demand: both rising crops and rising IoU have/will contribute
(Mt MOP-equivalent)

                                                                                                  IoU @         To reduce rates of soil K depletion,     Trend annual
                                                                                                  1.5% p.a.    IoU will have to accelerate; growth of      growth of
                                                                                                                     1.5% p.a. corresponds to
                                                                                                  IoU @
                                                                                                  0.75% p.a.
                                                                                                                   incremental demand of 42Mt              2 Mt
                                                                                                  IoU @
                                                                                                  0% p.a.
                                                                                +1.1%
                                                            +1.3%                p.a.
                                                             p.a.                                                                                        Trend annual
                                         +0.7%                                                                 If IoU continues to rise at roughly the
                                                           Increase            Increase                                                                    growth of
                                          p.a.
                                                            in crop             in crop
                                                                                                                historical trend, this corresponds to

                          +1.9%
                                        Increase
                                          in IoU
                                                          production          production                            incremental demand of 28Mt           1.5 Mt
                           p.a.

                        Increase
                         in crop
                       production
                                                                                                               We expect crop production to slow
                                                                                                                                                         Trend annual
                                                                                                               as a result of demographic factors;
                                                                                                                                                           growth of
                                                                                                               crop production alone is forecast to
                                                                                                                require 15Mt incremental potash
Potash demand outlook to 2030 by region
Soil depletion a global phenomenon, underscoring our belief that IoU is likely to rise across multiple regions

Additional tonnes 2020-2030

                          NORTH AMERICA                                                                  EUROPE & CIS                                             ASIA & OCEANIA
 Historical demand growth1                    0.2%                               Historical demand growth1              0.2%                  Historical demand growth1          4.3%
 BHP forecast growth2                         1-3%                               BHP forecast growth2                   1-3%                  BHP forecast growth2               1-4%
 External forecast growth3                    1.7%                               External forecast growth3              1.1%                  External forecast growth3          2.0%
 Soil nutrient imbalance4                     Poor, deteriorating                Soil nutrient imbalance4               Poor                  Soil nutrient imbalance4           Poor, deteriorating
 Potash contribution to K uptake5             30-35%,                            Potash contribution to K uptake5       20-25%,               Potash contribution to K uptake5   30-35%,
                                              recently improving                                                        stable                                                   improving

                  CENTRAL & SOUTH AMERICA                                                                     AFRICA
                                                                                                                                                                     WORLD
Historical demand growth1                     4.4%                                Historical demand growth1             6.1%
BHP forecast growth2                          2-4%                                BHP forecast growth2                  5-10%                 Historical demand growth1                 2.7%
External forecast growth3                     2.9%                                External forecast growth3             2.9%
                                                                                                                                              BHP forecast growth2                      1-3%
Soil nutrient imbalance4                      Poor, deteriorating                 Soil nutrient imbalance4              Poor, deteriorating
Potash contribution to K uptake5              35-40%,                             Potash contribution to K uptake5      5%,                  External forecast growth3                 2.0%
                                              stable                                                                    improving

1.   Average growth per annum of MOP shipments 2000-01 to 2019-20 (CRU).
2.   Forecast average growth per annum of MOP shipments 2019-20 to 2030 (BHP range).
3.   Forecast average growth per annum of MOP shipments 2019-20 to 2030 (Argus; CRU; IHS).
4.   Status of the World’s Soil Resources (FAO and ITPS, 2015).
5.   BHP analysis based on multiple sources.
Potash outlook briefing
17 June 2021                                                                                                   31
Big picture themes in agriculture
Climate change and “Precision Ag” are both principally opportunities for potash, in our view

                              Climate change                                                                    Precision Agriculture
 • Rapid decarbonisation:                                                              • Leverage advanced tech to
                                                                                         optimise farm practice
    − Greater pressure on land use       − Intensification positive for potash
                                           IoU                                           − Improve application efficiency        − In-situ losses of K are much lower
    − Possible resurgence of biofuels
                                                                                                                                   than N+P, so less potential
                                         − Biofuels still heavily dependent on           − Better identify nutrient deficiency
                                                                                                                                   efficiency gain
                                           crop-fed 1st-gen tech
                                                                                         − Adopt ‘nutrient-budget’ approach
                                                                                                                                 − Correcting K deficiency, reducing
 • Physical impacts of climate change:                                                                                             reliance on N fertiliser, ‘nutrient-
    − Harvests vulnerable to extreme     − Crop failures may become more                                                           budgets’ are all supported by
      weather events                       frequent                                                                                Precision Ag
    − Changing temperatures and          − Potassium aids drought tolerance
      rainfall

• Rapid decarbonisation offers potential upside for potash                            • There are many barriers to global adoption of Precision Ag, particularly if
                                                                                        labour is cheap, but even in the US farmers don’t always see positive
• Adaptation (technology and farm practice, cultivated area, crop choice)
                                                                                        cost:benefit in some technologies
  expected to prevent supply constraint on crop production
                                                                                      • But for potash, Precision Ag presents net upside and could accelerate
• Any supply constraint would likely push up food prices and potash IoU
                                                                                        potash IoU

Potash outlook briefing
17 June 2021                                                                     32
Big picture themes in agriculture
If the world cuts its meat intake, it is not a negative for potash demand. Food waste is likely to get worse before it gets better.

                            Meat consumption                                                                              Food waste
 • Negative aspects of meat                                                              • Up to one-third of food supply is lost
   consumption are in the headlines:                                                       or wasted
    − Major emitter of GHGs                                                                                                         − Tracking food waste over time is
                                                                                         • Upstream waste is highest in
                                                                                                                                      difficult – not commonly reported
    − Uses lots of land and water         − Replacing meat calories with plant-            developing economies:
                                                                                                                                    − Cutting waste requires both major
    − Ethical concerns                      based calories lowers overall crop             − Lack of cold-chain infrastructure
                                                                                                                                      investment and behavioural
 • Possible solutions include:
                                            production, but also removes K                 − Slow / inefficient distribution          change
                                            input from animal manure                       − Often hot / wet climates
   − Reduce meat consumption via                                                                                                    − Developed economies have not
                                          − Intensification will require greater                                                      made significant inroads on
     substitutes / flexitarianism                                                        • Consumer waste is highest in
                                            use of animal feed crops versus                                                           consumer waste
   − Intensify livestock production to      grazing                                        developed economies:
     reduce land use and manage                                                            − Diversified diets, including           − Can developing economies cut
     emissions                                                                               perishables                              upstream waste while avoiding
                                                                                                                                      rising consumer waste?
                                                                                           − Food cheap relative to income
                                                                                           − Strict food hygiene regulations

• Pace of dietary change is extremely slow                                              • Cutting food waste would reduce crop production required per capita
• Per capita meat consumption still rising in many parts of the world                   • Unfortunately global food waste is likely to get worse before/if it gets
                                                                                          better, given the interplay between economic development & food
• When/if meat consumption does start to decline this is not negative for
                                                                                          consumption behaviour
  potash: livestock currently supplies tens of millions of tonnes of K into
  agriculture that would have to be replaced with potash

Potash outlook briefing
17 June 2021                                                                       33
Geography of supply
Production concentrated in Canada, Russia and Belarus

    Canada (Saskatchewan)                                                                                       Russia and Belarus
     • 32% of production in 2020                                                                                 • 37% of production in 2020
     • 3 companies: Nutrien, Mosaic, K+S                                                                         • 3 companies: Uralkali, Belaruskali,
     • 7 conventional mines, 3 solution mines                                                                                      EuroChem
     • Industry dates back to 1950s                                                                              • All conventional mines, but some
                                                                                                                   refineries use thermal processing
                                                                                                                 • Industry dates back to 1930s, but
   China (Qinghai)                                                                                                 only returned to the seaborne trade
    • 10% of production in 2020                                                                                    in the 1990s
    • 1 major company: QSL Industry
      (+numerous smaller producers)                                        Supply
    • Production is based on natural brines
    • Industry dates back to 1990s

                                                                                                                Germany
   Middle East (Dead Sea)                                                                                        • 6% of production
    • 9% of production in 2020                                                                                   • 1 major company: K+S
    • 2 companies: ICL, Arab Potash                                                                              • All conventional mines, most production
    • Production is based on natural brines                                                                        based on Hartsalz ore
    • Industry dates back to 1930s                                                                               • Industry dates back to 19th century
                                              Conventional mining (~70%)    Surface brines (~25%)   Solution mining (~5%)

Data: 2020, 70Mt MOP production (CRU).
Potash outlook briefing
17 June 2021                                                                 34
Recent and forthcoming greenfield additions to supply
Centred on the three major basins: other deposits are either small, inaccessible or already extensively developed

                                                                                                                                            Uralkali Ust-Yaiva, Solikamsk-2
                                                                                                                          Acron Talitsky    EuroChem Usolskiy

                                                           Mosaic Esterhazy K3                         Belaruskali Petrikov    Slavkali Nezhinsky
                                     K+S Bethune                                                    Belaruskali Darasinsky
                                                                                                                                    EuroChem Volgakaliy
                                                                                                                                                                                   Under construction
                                               North America                                                                  CIS                                                  Under construction
                                               (Mtpa1, MOP)                                                                   (Mtpa, MOP)                                          (replacement)
                                               30                                                                             30                                                   In ramp-up phase
                                                                                                                                                                                   In ramp-up phase
                                                                                                                                                                                   (replacement)

                                               20                                                                             20

                                               10                                                                             10                                     Belaruskali
                                                                                                                                                                     Slavkali
                                                                                                                                                                     Acron
                                                                                                                                                                     EuroChem2
                                                                                                    Mosaic
                                                                                                    K+S                                                              Uralkali3
                                                0                                                                              0
                                                            Existing              Incremental                                          Existing        Incremental
Data: BHP analysis based on multiple sources.
1. Estimated Achievable Production (after disruption allowance but before voluntary curtailment).
2. Includes Phase I capacities only.
3. Includes new mine to recover lost capacity at Solikamsk-2.
Potash outlook briefing
17 June 2021                                                                                                      35
Identifying available capacity
Estimated 76 Mt Achievable Production in 2020, rising to 86 Mt with forthcoming additions

CY2020 capacity
(Mtpa MOP)
100

 90

                                                                                           Can be re-utilised in future
 80

 70

 60

 50
           Nameplate           Inaccessible     Allowance for   Achievable   Temporary         Expected          Shortfall     Actual     Re-utilisation      Capacity         Future
            capacity             capacity        unplanned      production   curtailment       production                    production                    under ramp-up /   achievable
                                                  downtime                                                                                                   construction    production

Data: BHP analysis based on multiple sources.
Potash outlook briefing
17 June 2021                                                                                    36
How soon will demand catch-up in Wave #4?
Consensus view is that demand will catch-up in the late 2020s/early 2030s

MOP demand
(Mt)
110                                                                                                                                                                                                 3% average CAGR

100

                                                                                                                                                                                                    2% average CAGR
 90                                                                                                                                                                                                 Specialist average (1.7%)1
                                                                          Achievable production (w/o Jansen)

 80                                                                                                                                                                                                  1% average  CAGR
                                                                                                                                                                                                             Jansen  S1
                                                                                                                                                                                                       Greenfield under
                                                                                                                                                                                                       Spareconstruction
                                                                                                                                                                                                              capacity,,
                                                                                                                                                                                                             brownfield
 70                                                                                                                                                                                                          expansion
                                                                                                                                                                                      Existing supply

 60
                                          10 year linear trend (+1.8Mt/y)

 50

 40
   2010                                    2015                                   2020                                   2025                                   2030                            2035
Historical data: CRU. Nutrien range of 2.0 to 2.5% in the 2020s as disclosed in 2021 Q1 earnings call. Achievable production is BHP analysis based on multiple sources.
1. Specialist average based on CRU, Argus, Fertecon (IHS Markit). 2020-2035 CAGR calculated relative to trend level in 2020 (69.5Mt) not to actual level estimated by CRU (71.6Mt).
Note that the chart shows linear interpolations that result in the same 2020-2035 aggregate tonnage increment as the stated CAGRS.
Potash outlook briefing
17 June 2021                                                                                                            37
Canada is well placed to meet long-term demand growth
Other deposits are either small, inaccessible or already extensively developed

Canada                                                                                                                                                                                    Deposits in Russia and Belarus
                                                                                         Western Europe                                                                                   are physically much smaller than
Canada is home to more than
                                                                                         Deposits in Western                                                                              in Canada.
half of global reserve base
                                                    60%                                 Europe are lower                                                 Russia
                                                                                                                                                                                          Limited greenfield opportunity
Options for conventional                            of global                            grade than Canada;
mining and solution mining                        reserve base                           some operations date                                                                             beyond current tranche of
                                                                                                                                       Belarus                                            projects (2 being replacement)
Ore body is generally flat,                                                              to early 1900s
thick and high-grade                                                                                                                                                                      Depletion will be an issue in
                                                              United States                                                                                                               2040s and beyond
                                                                                                                                                                             China
                                                                                                                                                                             Main salt playa in China is being fully exploited

                                                                                                                                     Middle East
                                                                                                                                                                                Southeast Asia
                                                                                                                                     Brine operations in
                                                                                                                  Africa                                                        Potash occurrences in Southeast Asia
                                                                                                                                     Middle East limited
                                                                                                                                                                                and Africa are scattered and small-scale
                                                                                                                                     by physical footprint
                                                                                                                                     and water withdrawal
                                                   South America
                                                   Production is South America,
                                                   mainly from salars, has declined
                                                   with focus shifting to lithium.
                                                                                                           Inducement cost of greenfield projects1 are typically US$300-500/t
                                                   Water stewardship an important
                                                   issue, especially in Chile.                          Large ‘bench’ of resource still available for future development in Canada

Data: USGS (2009). ‘Reserve base’ includes sub-economic reserves that may be developed in the future. USGS has switched to much smaller ‘reserves’ metric in recent years.
1. Greenfield inducement cost is all-in opex plus capital servicing, expressed in real US$ per tonne production, FOB Vancouver-equivalent. (CRU, Argus, Nutrien).
Potash outlook briefing
17 June 2021                                                                                                          38
Potash fundamentals: key messages
A future facing commodity with attractive long term fundamentals from multiple angles

                                               • Potash sits at the intersection of global demographic, social and environmental megatrends
     A Future Facing                           • The environmental footprint of potash is considerably more attractive than other major
       Commodity                                 chemical fertilisers
                                               • Conventional mining with flotation is more energy and water efficient than other production routes

                                               • Traditional demand drivers of population and diet are reliable and slow moving
       Reliable base
                                               • Attractive upside over basic drivers exists due to the rising potash intensity-of-use needed to support
       demand with
                                                 higher yields and offset depleting soil fertility
     attractive upside
                                               • On top of the already compelling case, decarbonisation could amplify demand upside1

  The industry’s 4th                           • Demand is catching up to excess supply, and major supply basins are mature
  wave is underway:                            • Price formation regime accordingly expected to transition from current SRMC to durable inducement
 demand to catch-up                              pricing, with Canada well placed to meet market growth longer term at LRMC in the mid $300s
  over the course of                           • Post the balance point, long-run geological and agronomic arguments skew probabilistic risks upwards
      the 2020s                                  (LRMC plus fly-up) rather than downwards (SRMC), in our view
Note: Short Run Marginal Cost (SRMC); Long Run Marginal Cost (LRMC).
1. Based on BHP’s 1.5°C Scenario. Refer to the BHP Climate Change Report 2020 for information about this scenario and its assumptions.
Potash outlook briefing
17 June 2021                                                                                                         39
Appendix
Fauna &                   Aspect &
What governs crop yields?                                                                 Flora                    Exposure
                                                                                                                                               Humidity

                                                                          Knowledge
Potassium availability is one of many factors                                                        Topography                    Wind
                                                                          limitations

                                                         Infrastructure                                              Rain
                                                                                         Altitude                                              Sunlight
                                                           limitations

                                                                           Financial
                                                                                                     GEOGRAPHY                  Temperature
                                                                          limitations

There are many interacting factors that influence crop yield                              FARM
                                                                                                                  WEATHER
                                                                                        PRACTICE
Any one factor may be yield-limiting
                                                                            Yield                                                  Micro-
                                                                           potential                  YIELD                      organisms
• The potential yield is determined by genetics              Harvest                                                                           Organic
                                                                                        GENETICS                     SOIL
                                                              Index                                                                            matter
                                                                           Drought
• The attainable yield is limited by external factors                       & flood                  NUTRIENTS
                                                                                                                                  Soil
                                                                                                                                 moisture
  – aspects of climate, soil type and geography                           resistance
                                                                                                                     Soil
                                                              Quick                      Disease
                                                                                                                                                 pH
                                                             maturing                   resistance                temperature

• The achieved yield depends on farm practice                                Pest
                                                                                                         N                      Soil texture
                                                                          resistance
  to optimise availability of water and nutrients, to
                                                                                         Minimal                  Secondary
  minimise the impact of pests, disease and bad                                          lodging                   nutrients
  weather, and to condition the soil
                                                                                                         P                        Salinity

                                                                                                                    Micro
                                                                                            K
                                                                                                                   nutrients

Potash outlook briefing
17 June 2021                                            41
Themes in agriculture
Good or bad for potash demand?

Climate change                                Precision Ag                                   Food waste                                    Plant-based meat                                 Potash ‘holidays’
 Shifts in average temperature and more       ‘PA’ is a broad term applied to tools or       Up to one-third of upstream food               Alternatives to conventional meat,              K does not leach out from soils as easily
 frequent extreme weather poses a risk to     services that leverage advanced                production is never eaten. Tackling food       including plant-based proteins, cultured        as nitrogen and phosphate fertilisers. Soils
 future food security.                        technologies to optimise farm practice.        loss and waste (FLW) is part of the UN’s       meat and insects have grabbed the               also contain ‘native’ K from naturally-
                                                                                             Sustainable Development Goals.                 headlines. People in some places are            occurring minerals.
 We expect that adaptation – both through     Examples include GPS guidance,
                                                                                                                                            choosing to eat less meat for
 biotechnology and farm practice – will       telematics, variable-rate technology of        • Developed economies have high rates                                                          Soils that have been well-maintained may
                                                                                                                                            environmental (as well as ethical) reasons.
 avoid food production becoming supply        seeds, fertiliser and pesticides, and aerial     of wastage at the retail and consumer                                                        be able to support several harvests
 constrained.                                 imagery.                                         level.                                         Livestock practices vary widely but, on       without further application.
                                                                                                                                              average, each meat-based calorie
 Water stewardship will be vital – adequate   PA technologies seek to reduce the cost of • Developing economies have high rates                                                             This gives farmers flexibility to adjust
                                                                                                                                              requires more crop input than each plant-
 potassium helps plant tolerate drought.      labour and/or crop inputs, or increase              of loss in processing and distribution.                                                   potash purchases from season to season
                                                                                                                                              based calorie. Usually, beef has more
                                              revenue via the quantity and/or quality of                                                                                                    in a way that is not possible with nitrogen
 Rapid decarbonisation pathways offer                                                           There is little data on FLW over time, but it feed-crop input than pork or lamb, which in
                                              production.                                                                                                                                   (or, to a lesser extent) phosphates. They
 potential upside to potash demand,                                                             may still be getting worse. Factors that can turn have more than poultry.
                                                                                                                                                                                            can ‘bank’ potash in the soil when it’s
 particularly through resurgent growth in     Some PA technologies are aimed                    increase FLW include:
                                                                                                                                              Reduction of meat consumption is thus         affordable or skip application when it’s not.
 biofuels and the pressure to accelerate      specifically at the efficient use of fertilisers.
                                                                                                • Varied diets that include many              associated with lower crop production for
 yield growth if large-scale afforestation    The main focus is the precise and timely                                                                                                      Other drivers of demand volatility include
                                                                                                  perishable foodstuffs                       the same calorie intake. However, animal
 diminishes available cropland.               application of nitrogen and phosphate                                                                                                         weather conditions, seasonality of
                                                                                                                                              manure contributes millions of tonnes of K
                                              fertiliser, which are it risk of high in-situ     • ’Cheap’ food relative to household          to crops every year. The substitution of
                                                                                                                                                                                            application, and stock-change through the
 However, outcomes that further decelerate
                                              loss.                                               income and consumer quality                                                               supply chain.
 population growth and/or depress income                                                                                                      animal manure with potash negates the
                                                                                                  expectations                                impact on potash demand of lower crop
 growth are negative for crop demand.         Potassium is applied in smaller quantities,                                                                                                   Farmer response to potash affordability
                                              less often and is less mobile in the soil –       • Food hygiene regulations                    production.                                   is a key driver of short-term demand
 Global agriculture will have to adapt to
                                              the potential efficiency gains are thus                                                                                                       volatility. However, K is an essential
 changing climate, but this does not                                                            Tackling FLW should be a global               Meat consumption patterns change
                                              much less.                                                                                                                                    ‘building block’ in plants and over the
 alter our basic thesis on potash                                                               priority and over time will allow the         very gradually. Despite temporary dips
                                                                                                                                                                                            long-term, consumption is driven by
 demand growth. A 1.5C Paris-aligned          Efficient application poses little threat         world to feed more people with less           resulting from swine fever and the
                                                                                                                                                                                            agronomic requirement. Crop prices
 pathway provides potential demand            to potash demand. However, regular                crop production. But doing so will need COVID-19 pandemic, meat                             will adjust if necessary to support the
 upside.                                      and accurate soil testing will help to            both big investment and big shifts in         consumption is still on an upward trend
                                                                                                                                                                                            appropriate use of fertiliser needed to
                                              identify under-application of K that              behaviour, so progress will likely be         globally. However, a reversal of this
                                                                                                                                                                                            achieve required crop yields.
                                              might otherwise be missed. Adoption               slow.                                         trend is not negative for potash
                                              of a ‘nutrient-budget’ approach, rather                                                         demand.
                                              than depleting native K, provides
                                              further demand upside.

Potash outlook briefing
17 June 2021                                                                                                    42
Potash operations fall into 3 basic types
MOP is extracted from underground ore deposits or recovered from natural brines

 Conventional mining                         Solution mining of ore                       Natural brines
     Usually 400m to 1,100m deep and           Hot water (or brine) is pumped               Potassium-bearing brines are channelled
     accessed by shaft                         underground to dissolve the potash ore       into ponds and concentrated by solar
     Usually room & pillar with continuous     Potash brine is pumped back to the           evaporation until potash salts crystallise
     mining machines                           surface for processing                       Salts are either harvested by cutting
     Widely used in Canada, Russia,            Employed on a large scale only in Canada     dredges or mechanical shovels
     Belarus                                                                                Employed in China, Israel, Jordan and Chile

Potash outlook briefing
17 June 2021                                                     43
Food and agriculture in numbers
Global diets dominated by crop and vegetable products

         Global dietary profile1                  Global crop production2          Global crop use3     Global land use4
                                                          Other crops                   Fibre
Potash fertiliser use by crop
Global agriculture is fragmented, but top 10 country-crop combinations account for 50%

  Potash fertiliser consumption by country

                                                                                                                          Indonesia and
                           China                                        Brazil                             USA                               EU-28      India                         RoW
                                                                                                                             Malaysia
                           24%                                          16%                                14%                 9%             9%         8%                           29%

 0%                                                                                                                                                                                                       100%
        China           12      Brazil                  Indo/Malay              USA                       USA              China              China           India          Brazil            China
                                               8%                      7%                      6%                    4%               3%               3%               3%                2%           2%
        F&V             %       Soybeans                Oil palm                Corn                      Soybeans         Rice               Wheat           Rice           Sugar cane        Corn

                                                                                                                                                                Sugar cane
           Fruit and vegetables                                 Corn                        Soybeans                      Rice            Oil palm    Wheat                   Other crops and grassland
                                                                                                                                                                 and beet
                   19%                                          14%                           12%                         11%                8%        7%          6%                   22%

 0%                                                                                                                                                                                                       100%
  Potash fertiliser consumption by crop

International Fertilizer Association “Assessment of Fertilizer Use by Crop at the Global Level” (2017).
Potash outlook briefing
17 June 2021                                                                                                              45
Forecasting Demand: Step 1 – crop requirements
Estimate the quantity of each crop required to meet demand for the 4Fs: food, feed, fibre, fuel

                                                                Food intake
          Population                              x           (kcal/person/day)                                                                                             For a
                                                                                                                                                                      region/country
                                                                                                                                        Livestock may be fed
                                                                                                                                      on crops (e.g. soybeans,    split, need to account
                                                                                                                Food intake and       corn) or waste products    for physical constraints
                                                                                                                 calorie mix are         (e.g. DDGs) or with       (land, water, yield),
                                                                                                            influenced by incomes               fodder            pace of development
                                                              Wastage2                                      and cultural practices                                     and projected
                                                                                                                                                                         trade flows

                                                                                                                      Animal                 Animal feed
                                                                   Global food                                        calories               requirement
                                                                     supply
                                                                                                                      Vegetal
                                                                     (kcal/yr)                                        calories                                   Global crop
                                                                                                                                                                 production
                                                                                                                                                 Fibres
                                                                                                                                                                   (tonnes)
                                                                                                               98%1 of biofuels are
                                                                                                               produced from food               Biofuels
                                                                                                                  crops like corn,
1. http://www.biofuelstp.eu/feedstocks.html.                                                                    sugarcane, palm oil
2. This includes inbound supply chain losses (e.g. crops rotting before they reach market due to lack of
   cold storage infrastructure) and post-retail waste (e.g. food expiring in homes before consumption,             and rapeseed
   unfinished portions in restaurants, etc). The former is principally a developing world problem and the
   latter is principally a developed world problem.
Potash outlook briefing
17 June 2021                                                                                                          46
Forecasting Demand: Step 2 – potash requirements
Estimate the quantity, and source, of potassium nutrient needed to support crop production

                                                           Residues have                                                Observed K balance =
                                                           alternative uses
                                                        including heat/power                                            Observable K input – K output
                                                         generation, animal                                             Potash fertiliser                     Crop K uptake
                                                          feed, construction                                            Animal manures
                                                                                          Plant biomass
                                                                                                                        Crop residues

                      Nutrient recycling                                                                                This “equality” is frequently negative. How so? Because
                                                                                                      Yield
                                                                                                                        farmers “mine the soil” for a proportion of the required
                                                                                                                        potassium, and do not provide sufficient external sources
       Potash              Animal                   Crop                                     Residue                    to maintain soil quality. Which gives the following:
      fertiliser           manures                residues

                                                                                      K uptake
                                                                                                                        Inferred K balance =
                                                                                                                        Observable K input +
                                                                                                                        inferred soil K mining – K output
                                                                                                                        At some point, the ability to “mine the soil” at historical rates
                                                                                                                        will decline, perhaps starkly in some regions. That will
                                                                                                                        require a step up in the supply external sources of
                                                                                                                        potassium if yields are to be maintained, with rising intensity
                   K doesn’t leach out of soils as easily as N and P. Healthy soils have a K
                   ‘reserve’ and farmers can “mine” this reserve based on short-term farm                    Native     of potash use being the logical conclusion.
                   economics, as a trade-off. As reserves are finite and this process degrades             potassium
                   natural soil fertility, it is not sustainable to continuously thrift on external          (soil k)
                   spoil of potassium. Long-term application must be driven by agronomics.                              Intensity-of-use = potash use
                                                                                                                                          crop production
Potash outlook briefing
17 June 2021                                                                                          47
Forecasting Demand: Step 3
Estimate the contribution of other primary potash fertilisers; Estimate non-fertiliser consumption of MOP

                                                                                                                                                              Potassium
    Potash fertiliser
                                                                                                                                                               chloride
     consumption
                                                                                                    SOP                NOP                                     Demand
     (tonnes K2O)
                                                                                                                                                            (tonnes MOP)
                                                                                                   NPK1                MKP
                                                                                Secondary
                                                                             potash fertilisers
                                                                                                                                                         Direct use         Chemicals
      SOP                  SOPM                                                                      Secondary                    Non-fertiliser
                                                                                                      Fertilisers                 applications
                                                                                                    are made from             include drilling fluids,
Other primary potash fertilisers                                                                  potassium chloride                                                 The principal
                                                                                                                                animal feed, water
                                                                                                      feedstock                                                  chemical derivative is
                                                          Primary                                                            softeners, ice melt, food
                                                                                                                                                               potassium hydroxide,
                                                         fertilisers                                                              additives and
                                                                                                                                                               used in batteries, soaps,
                                                       are based on                                                              pharmaceuticals
                                                                                                                                                                biodiesel manufacture
                                                    naturally-occurring
                                                                                                                                                                and as a precursor to
                                                    minerals like kainite,
                                                                                                                                                                   other potassium
                                                      langbeinite and
                                                                                                                                                                     compounds
                                                          polyhalite

1. NPK fertilisers can also be based on other primary potash materials.
Potash outlook briefing
17 June 2021                                                                                                      48
Potash: a low emission, biosphere friendly fertiliser
MOP is a critical nutrient with a modest GHG and broader environmental footprint

GHG emissions intensities inform our investment decisions:                                                                           Not all fertilisers have the same environmental footprint:
 Scope 1+2►
                                      Low                      Medium                          High
 ▼Scope 31
Jansen fits our strategic framework
Our strategy identifies how to position the portfolio to maximise long-term value and deliver high returns for shareholders

                             • Future fit, exposure to global mega trends: decarbonisation and land use
         Attractive
                              • Attractive fundamentals, supply-driven market, growing population and diet
        commodity
                              • Durable inducement pricing transition from short-run marginal cost

                             • High-quality resource, low-cost, high-margin, long-life in a stable mining jurisdiction
       World class
                              • Capital efficient expansion options
         asset
                              • Diversification of commodities, customer base, operating footprint

                             • Expertise in bulk mining, logistics and product marketing
       Operational
                              • High-performing culture, latest technology enabling top quartile operational performance
       excellence
                              • Low-carbon footprint and lower water intensity

Potash outlook briefing
17 June 2021                                                      50
Jansen offers structural, competitive advantages
Hard-to-replicate design, could be leveraged further in future stages

       Performance                Upfront               60% less                     Shaft design 40%        Leading equipment               Continuous,
          driven                 geological         equipment highest                larger than other          and material              automated loading
         culture                information            throughput                        producers            handling systems                 system
   Culture to drive higher   Leveraged 3D seismic    Automation approach            Increased ventilation,    Advanced predictive         Automation maximises
    productivity, lower        technology to gain   resulted in fewer higher         capacity for multiple     maintenance drives         efficiency and removes
      operating costs           understanding of       producing borers             brownfield expansions    higher plant availability,   all interactions between
                             underground resource                                                                operating hours                equipment and
                                                                                                                                                  personnel

                                   Across the value chain we have built in structural advantages,
                                   incorporated latest proven equipment and digital technologies

Potash outlook briefing
17 June 2021                                                                   51
You can also read