MOL GROUP INVESTOR PRESENTATION - August 2017
←
→
Page content transcription
If your browser does not render page correctly, please read the page content below
MOL GROUP

INVESTOR PRESENTATION
August 2017
MOL GROUP IN BRIEF

                                    INTEGRATED OIL & GAS COMPANY

          Upstream                   Downstream           Consumer Services          Gas Midstream

    CEE         International      R&M       Petchem

  CAPITAL MARKETS OVERVIEW                             BUSINESS/ASSETS OVERVIEW
     Tickers:                   MOL HB; MOLB.BU          Countries of operation:                     33
     Main listings:             Budapest, Warsaw         Number of employees:                 26,000
     Number of shares:                    102.4mn        Production (mboepd):                     110
     Free Float:                              45%        Reserves SPE 2P (MMboe):                459
     MCAP (1 Aug 2017):                  USD 8.9bn       Refineries and Petrochemical
                                                         facilities:                             4+2
     Liquidity (last 6M average): USD 10.2mn
                                                         Refinery capacity (mbpd):               417
     Corporate bonds outstanding:
               MOLHB 6 1/4 09/26/19 USD 500mn            Steam cracker (ethylene) capacity (ktpa):
              MOLHB 2 5/8 04/28/23 EUR 750mn                                                     890
     Dividend yield (2017):                3%            No. of Service Stations:             1,900+
     HSE - TRIR:                               1.3       Retail transactions per day:       1,000,000

MEMBERS OF
                                                                                                          2
AGENDA

1        Investment Case & Financial Framework

2        Q2 2017 Recap

3        Downstream

4        Consumer Services

5        Exploration and Production

6        Financials, Governance, Others

                                                 3
INVESTMENT CASE
& FINANCIAL
FRAMEWORK
MOL GROUP 2030: A VISION, A STRATEGY AND ONE
OVERRIDING OBJECTIVE

                            MOL 2030

 BUILD ON EXISTING      LEAD THE INDUSTRIAL    LEVERAGE ON CEE
    STRENGTHS            TRANSFORMATION           LEADERSHIP

                         DIVERSIFY AWAY FROM   USE EXISTING MARKET
 RESILIENT INTEGRATED           FUELS…            PRESENCE AND
   BUSINESS MODEL                                CUSTOMER BASE
                             …AND GROW
    HIGH-QUALITY          (PETRO)CHEMICAL       BUILD A CRITICAL
 LOW-COST ASSET BASE          EXPOSURE           MARKET SHARE

  SYSTEMATIC SAFETY      TRANSFORM RETAIL          CONQUER
    AND EFFICIENCY             INTO               TOMORROW’S
                         CONSUMER SERVICES          MARKETS

              BEST-IN-CLASS INVESTMENT STORY

                                                                     5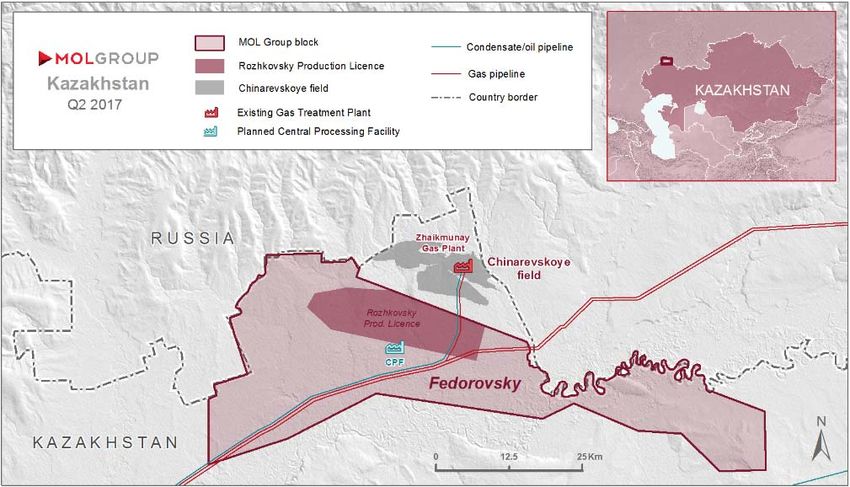
CONSERVATIVE MACRO ASSUMPTIONS FOR 2017-21

                 KEY MACRO ASSUMPTIONS                                                       EBITDA SENSITIVITY TO KEY EXTERNAL DRIVERS

                                                                                    Sensitivity1                Est. Clean CCS EBITDA                      % of Group
                                                                                                                   impact (USD mn)                         EBITDA 2016

                                         H1         5Y        2017       2018-
                  2015       2016
                                        2017       AVG         E          21E       +/‐ 50 USD/Mcm
                                                                                                                     ~30                                        1.4%
Brent                                                                               Gas Price (NCG2)
                                                               40-        40-
crude               52        44          52        75
                                                               60         60
(USD/bbl)
                                                                                       +/‐ 10 USD/bbl                                                           4%
MOL
                                                                                           Brent price
                                                                                                                                     ~80
Group
                                                              5.0-       4.0-
Refining            6.1       5.7        6.5        4.7
                                                              6.0        5.0
Margin                                                                                 +/‐ 100 EUR/t
(USD/bbl)                                                                                 Integrated                                       ~100                 5%
Integr.                                                                             petchem margin
Petchem                                                       500-       400-
                   680        613        562        471                                 +/‐ 1 USD/bbl
margin                                                        600        500
(EUR/t)                                                                                   MOL Group                                           ~110              5%
                                                                                      refinery margin

 NB:
 - Sensitivity calculated for the 2017-21 period on average
 -    Gas price sensitivity is the net impact of E&P sensitivity (around USD 50m) and an offsetting Downstream sensitivity
 -    Crude price sensitivity is the net impact of Upstream sensitivity (around USD 150m, including all liquids sensitivity and also the oil price-linked gas
      production sensitivity) and an offsetting Downstream sensitivity

 1   Ceteris paribus for current assets assuming full re-pricing of portfolio; all other premises and volumes remain unchanged
 2   Largest German trading point for natural gas (operated by NetConnect Germany)                                                                                     6
SOLID, CONSISTENT EBITDA GENERATION
RESILIENT INTEGRATED BUSINESS MODEL IN A HIGHLY VOLATILE ENVIRONMENT

                             EXTERNAL ENVIRONMENT* VS MOL CLEAN CCS EBITDA (USD MN)

100%                                                                                                                                         800

85%

                                                                                                                                             600

70%

55%                                                                                                                                          400

40%

                                                                                                                                             200

25%

10%                                                                                                                                          0
       Q1 12 Q2 12 Q3 12 Q4 12 Q1 13 Q2 13 Q3 13 Q4 13 Q1 14 Q2 14 Q3 14 Q4 14 Q1 15 Q2 15 Q3 15 Q4 15 Q1 16 Q2 16 Q3 16 Q4 16 Q1 17 Q2 17

                          Clean CCS EBITDA (r.s.)     MOL Group Refining Margin       Integrated Petchem Margin       Brent

 * The quarterly % values of the Refinery Margin, Petchem Margin and Brent price are measured against their respective
 maximum values (100%) in the period of Q1 2012 – Q2 2017
 100% equals to the following values:
 MOL Group Refining Margin: 6.8 USD/bbl; Integrated Petchem margin: 760 EUR/t; Brent crude: 119 USD
                                                                                                                                                 7
HIGH QUALITY, LOW COST ASSET BASE
VERY LOW BREAK-EVEN PRICES IN BOTH UPSTREAM AND DOWNSTREAM

                                    E&P UNIT OPEX1 (USD/BOE)                                                   MOL 2030
                                                                                           45
                                                                                           40
                                                                                           35
                                                                                           30
                                                                                                            MOL will build on existing

                                                                                                  USD/bbl
                                                                                           25               strengths
                                                                                           20
                                                                                           15
                                                                                                            Continued relentless focus
                                                                                           10               on efficiency...
                                                                                           5
                                                                                           0
                                                                                                            ...to maintain competitive
H2 2013           H1 2014       H2 2014      H1 2015       H2 2015       H1 2016      H2 2016               cost position...
                            Range          MOL Group          Average          MOL                          ...and top-tier margins in
                    CLEAN CCS-BASED DS UNIT EBITDA2 (USD/T)                                                 the sector...
         120
                                                                                                            ...to ensure each business
         100                                                                                                segment achieves cash
         80                                                                                                 neutrality even at the very
                                                                                                            bottom of the cycle
 USD/t

         60

         40

         20

          0
           2012                 2013               2014                 2015               2016

                     Range
                       MIN             MOL Group          Average          MOL + SN

(1) Range contains Enquest, Premier, OMV, Lundin, DNO, PGNiG
(2) Unit EBITDA range is based on volume sold and includes ELPE, Lotos, OMV, PKN, Tupras
                                                                                                                                         8
CONSTANT DRIVE FOR EFFICIENCY
 SUCCESSFUL EFFICIENCY PROGRAMS WITH MAJOR EBITDA CONTRIBUTION

          DOWNSTREAM EFFICIENCY PROGRAMS AND CLEAN CCS EBITDA (USD MN)

                                                                     ~500
  1,500                                                                            ~ 1,400‐1,500
                                   ~500
  1,000                                                874

   500               350

     0
                    2011                            2014                               2017

                            NEW UPSTREAM PROGRAM (USD MN, MBOEPD)

CONTROLLABLE      ~‐18%            ORGANIC                             CEE           +5%
    OPEX                            CAPEX                           PRODUCTION
                                                 ‐51%
                                          877
                                                 681
                                                                                               81
                                                             432
                                                                                     79
                                                                             77

           2015           2016            2014   2015        2016           2014    2015      2016

                                                                                                     9
SUSTAINED CASH GENERATION
IN 2016 AND IN THE NEXT 5 YEARS

                                     CLEAN-CCS EBITDA (USD BN)
    2.5
                2.3                                        2.5
                                  2.2                                               2.2                     2.3+
                                                           0.7                                                                 2.0‐2.2
                                                                                    0.7
    1.9
                1.6               1.2

                                                           1.7
                                                                                    1.5
                0.7               0.9                                                                       1.3          H1
    0.7

    0.3         0.3                  0.3                     0.2                    0.2
    ‐0.3        ‐0.3          ‐0.1                  ‐0.1                            ‐0.2

    2012       2013              2014                 2015                         2016                   2017 YTD            2017‐21E
                                                                                                                               Average
                 Upstream   Downstream     Gas Midstream         Corporate & Other (incl. intersegment)    Group total

           Robust EBITDA and cash generation to sustain in 2017-21E on the back of the existing
           asset base

                                                                                                                                         10
DS: OUTSTANDING „MID-CYCLE” FCF GENERATION
WITH CONTINUOUS FOCUS ON EFFICIENCY IMPROVEMENT
CLEAN CCS EBITDA (USD MN)
1,453 1,400-1,500
~150 ~160
~410 400-500
~170
~340 ~1000
874
24
500
350
2011 NDSP Macro* 2014 NxDSP Offsetting Macro 2,3 2016 Macro NxDSP 2017 Normalized Simplified
delivered items 1 CAPEX FCF
(1) Offsetting items were incurred in 2016 and were mostly related to availability issues (unplanned shutdowns) in both petchem and refining
(2) Including offsetting items and the reversal of previous offsetting items 11
(3) Based on normalised downstream margin assumptionsGRADUAL EBITDA TRANSFORMATION
TOWARDS „HIGHER-VALUE”, STABLE CONSUMER SERVICES CASH FLOW
EBITDA TRANSFORMATION IN 2013-2030 (USD MN)
Consumer services EBITDA (USD mn)
600 40%
Weight in Group EBITDA (%), right axis
550
500 450‐500
30%
450 30%
400 ~23%
350
307
300 20%
250 221 14%
200
151 9%
150 10%
7%
100
50
0 0
2013 2015 2016 2021E 2030E
Consumer Services EBITDA more than doubled in 4 years, to triple by 2021 (vs.
2013) and to grow further through 2030
Consumer Services cash flows typically trade at materially higher multiples
(~10x EV/EBITDA for listed peers 1 and ~11.5x implied EV/EBITDA in M&A 2) vs.
integrated oils (~5-6x EV/EBITDA) or downstream cash flows
(1) Peer group includes: Alimentation Couche-Tard, CST Brands, Casey’s General Stores, Sunoco, Cross America, Murphy USA, Petrol 12
(2) Retail/distribution M&A transactions in 2014-16; Source: Bank of America Merrill Lynch ResearchE&P DELIVERS SUBSTANTIAL FCF IN 2016-21
WITH MATERIAL FLEXIBILITY ON THE CAPEX SIDE
EBITDA, CAPEX AND FCF EXPECTATIONS (2016-21, USD MN) KEY MESSAGES
Brent @ 60
USD/bbl Next 5Y post-tax free
+USD
Less than 20% of cash-flow shall cover
~750mn
the total Upstream reserve replacement
EBITDA
CAPEX pool is necessary to maintain
Brent @ 50 committed
between 2017-21
today’s production @ 50
USD/bbl
USD/bbl
Next 5Y post-tax free
2,000-2,200 cash-flow shall be
sufficient for 100% reserve
replacement @ 60
USD/bbl
3,500-3,900
1,500-1,700
~600
900-1,100 268
1,200- 1,400
EBITDA CAPEX Simplified Tax & FCF 2016 FCF Total FCF FCF to FCF to
FCF other
1 (post-tax) delivered 2016 - 21 maintainshareholders
production
2017-21 expected 2016 actual
13STRONG „SUSTAIN” CAPEX DISCIPLINE
SUSTAIN CAPEX (USD BN)1
Organic US Organic DS Organic GM Organic C&O (incl. intersegment) Group total
1.8 1.7
1.6
1.4
1.3
1.2 0.9
1.2
1.0 1.0 1.0‐1.1
Around 1.0
1.0
0.7 0.7
0.8 0.5 0.4
0.6
0.4 0.7
0.4 0.4 0.5 0.5
0.2 0.4 H1
0.0
2012 2013 2014 2015 2016 2017 YTD 2017‐21E Average
USD 1.0-1.1bn sustain CAPEX annually on average in 2017-21 with continued strong
discipline
E&P spending plans realigned to reflect new oil price reality and the benefit of
cost deflation
(1) Fact & 2017 guidance represent total organic spending of MOL Group 14ROBUST SIMPLIFIED FREE CASH FLOW
ACROSS THE CYCLE AND ACROSS ALL BUSINESS SEGMENTS
SIMPLIFIED FREE CASH FLOW1 (USD BN)
Organic US Organic DS Organic GM Organic C&O (incl. intersegment) Group total
1.5
1.8
1.6
1.1 1.2
1.4 1.1
0.0 1.3+
1.2 0.2
1.0‐1.1
1.3
1.0 0.9
0.8 1.2
0.5
0.6 1.0
0.3 0.9
0.4 H1
0.2 0.3
0.1
0.2
0.2 0.2 0.2 0.2 0.2
0.0
‐0.2 ‐0.2 ‐0.2
‐0.3 ‐0.3
‐0.2
‐0.4
2012 2013 2014 2015 2016 2017 YTD 2017‐21E Average
15
(1) Simplified Free Cash Flow = Clean CCS EBITDA – Organic CAPEX (excluding transformational spending)TRANSFORMATIONAL CAPEX
MOL 2030 STRATEGY IMPLEMENTATION
TRANSFORMATIONAL CAPEX (USD BN) MOL 2030
Refining/Chemicals transformational capex:
tbd Consumers
a total of ~USD 4.5bn until 2030
Up to USD 1.9bn spending in
petchem/chemicals in 2017‐21
tbd E&P
Steam cracker integration and
debottlenecking and new product entries
0.4 INA‐Refining
2017‐2021 projects adding USD 250‐300mn
EBITDA at mid‐cycle margins (10‐15%
~2.6 Chemicals, 2022‐2030E targeted IRR)
Potential E&P reserves replacement
(production stabilisation)
Consumer services transformational
~1.9 Chemicals, 2017‐21E
spending
Potential INA refining capex (Rijeka heavy
2017‐30E residue upgrade) subject to
fiscal/regulatory environment
16FCF TO COVER STRATEGIC CAPEX IN 2017-21
AND TO CREATE HEADROOM FOR ADDITIONAL TRANSFORMATIONAL SPENDING
NEXT 5-YEAR CASH FLOW GENERATION AMBITIONS, 2017-21 (USD BN)1
10‐11 ‐1.4‐1.6
‐5.0‐5.5
‐2.0
‐1.0‐1.3
~0.6
Clean CCS EBITDA Funding cost/tax/FX Sustain Capex Transformational Dividends FCF‐post‐dividend Optionality/Flexibility
Capex
Substantial FCF generation over sustain capex in the next 5 years...
...which may fully cover (phase-1) transformational capex, dividends, small M&A,
and more
(1) Excluding changes in working capital 17INCREASING DISTRIBUTION TO SHAREHOLDERS
SECOND CONSECUTIVE YEAR WITH DOUBLE-DIGIT DPS INCREASE
DIVIDEND PAYMENTS (HUF BN)
Special dividend
Regular dividend MOL was one of the very few integrateds
13 who could increase DPS in 2016....
...and can comfortably cover dividends
55 58 and capex from cash flows even at USD
45 46 47 50
35/bbl oil price
2012 2013 2014 2015 2016 2017
DIVIDEND PER SHARE (HUF) MOL 2030
3.6 3.5 Dividend
2.5% 2.9% 3.3% 3.0% yield1
+1% +2%
Cash dividend is the primary distribution
Special dividend +10%
channel to shareholders
Regular dividend
128 Maintain rising trend in dividend stream
and DPS
Improving yields - growing importance
625
567 in investment story
455 462 462 485
2012 2013 2014 2015 2016 2017
18
(1) Calculated with publication date (AGM) share pricesROBUST BALANCE SHEET, AMPLE HEADROOM
REMAIN A PRIORITY IN „MOL 2030”
NET DEBT TO EBITDA (X) MOL 2030
2.5
1.96 Net debt/EBITDA to be in 1.0-2.0x tolerance
2.0
1.72 range on a forward-looking basis under
1.66
1.5 1.44 1.38
„normal” circumstances (covenant
1.31
threshold at significantly higher levels)
0.97
1.0 0.88
0.79 0.74 0.75
Credit metrics to remain commensurate
with investment grade credit rating
0.5
Higher/lower leverage may be tolerated
temporarily and/or for strategic reasons,
2008 2009 2010 2011 2012 2013 2014 2015 2016 Q1 H1
2017 2017 but would trigger action plan to bring it
back to target range
AVAILABLE LIQUIDITY (30.06.2017)
Maintaining strong liquidity and
USD 3.5bn comfortable financial headroom also
3.5
0.3 remain priority
3.0 0.1
2.5
2.0
1.5 3.0
1.0
0.5
0.0
Undrawn Marketable Cash Total available
facilities securities liquidity 19SIMPLER SHAREHOLDER STRUCTURE1
HIGHER FREE FLOAT AND LIQUIDITY
Considerable increase in free-float and liquidity following the CEZ divestment (of 7.4% MOL shares)
Crescent also exited fully in Q2 2017
AGM approved 8-for-1 stock split from September 2017
MOL Plc & MOL Investment Ltd. (treasury shares)
9.3%
UniCredit Bank AG
3.6%
ING Bank N.V.
4.7% Foreign investors (mainly institutional)
34.8%
OTP Bank Plc.
4.9%
Free‐float
OmanOil (Budapest) Limited
45.1%
7.1%
Domestic institutional investors
Hungarian State (MNV Zrt.) 5.7%
25.2% Domestic private investors
OTP Asset Management 3.4%
1.2%
(1) Shareholders structure as of 30 June 2017 20MOL 2030 WORKS WITH OR WITHOUT INA
FOCUS ON SECURING RETURN ON INVESTMENT
NET DEBT (USD MN), NET DEBT/EBITDA
INA: WHAT IS UNCHANGED?
(X) AND FCF (USD MN) IN 2016*
The priority is to maximise the value of the
Full consolidation of INA INA investment:
INA as Discontinued ops
Keeping and operating INA (on fully
market-based conditions and with a
controlling position for MOL) or
Selling/monetizing the investment
Legal proceedings continue
2 064 0.97 0.96 1 140 INA: WHAT HAS CHANGED?
1 713 980
MOL 2030 strategy can be and will be
implemented with or without INA
Croatia is an EU member state since 2013,
reducing the risk of any extreme, non-
Net Debt Net Debt/EBITDA Simplified FCF**
EU-conform scenario
Decreasing relative importance of INA
First arbitration completed; all Croatian
claims rejected
* Pro-forma financials as of 31 December 2016 show INA as „discontinued operations”, while all other P&L and Balance Sheet
lines represent MOL Group excluding INA 21
** Simplified FCF = Clean CCS EBITDA less Organic CAPEXSUNSTAINABLE DEVELOPMENT; HSE COMMITMENT
“SUSTAINABILITY PLAN 2020” AND RANKING INCLUSIONS
SD GOVERNANCE SD PLAN 2020
Sustainable Development Committee of MAIN OBJECTIVE: achieve and maintain an
Board of Directors since 2006; MOL Group internationally acknowledged leading position
CEO is a permanent member (top 15%) in sustainability performance.
Executive level Thematic Sustainability FOCUS AREAS: Climate Change, Environment,
Committee in place since 2013 Health & Safety, Communities, Human Capital
and Ethics & Governance
Highest ranking individual responsible for
sustainability is SD & HSE Senior VP, directly ACTIONS: 36 in total, of which 11 new actions
reporting to the Group CEO defined solely to improve SD performance
SUSTAINABILITY INDICES AND RANKINGS TRIR*
In 2016 MOL became component of the Dow
1.8
Jones World Sustainability Index, constituent
of the FTSE4Good Emerging Index 1.5 1.4
1.3
(maintained in 2017), and included in the
RobecoSAM Sustainability Yearbook for the
second consecutive year.
MOL is a constituent of MSCI ESG Emerging LEVEL B
Market Index since 2014.
In 2016 MOL Group received a 94%
percentile ranking (outperformer) by 2013 2014 2015 2016
Sustainalytics and obtained level B (above * Total Recordable Injury Rate
industry & regional average) in the CDP
22
Climate Change rankingThis page was left blank intentionally
23Q2 2017 RECAP
MATERIALLY UPGRADED FY 2017 FCF GUIDANCE
 WITH THE ESSENTIAL FUNDAMENTAL BUILDING BLOCKS IN PLACE

                                                                                2017
                                                   2016         H1 2017
                                                                              TARGETS
  RESILIENT
                               GROUP CLEAN                                    Upgraded to
INTEGRATED                      CCS EBITDA
                                                 USD 2.15 BN   USD 1,297 MN
                                                                              USD 2.3 BN+
  BUSINESS
   MODEL
                               GROUP CAPEX                                    Cut to around
                                                 USD 1.0 BN    USD 357 MN
                                (ORGANIC)                                      USD 1.0 BN
 FINANCIAL
 DISCIPLINE
                                                                               Upraded to
                               SIMPLIFIED FCF*   USD 1.15 BN   USD 940 MN
                                                                               USD 1.3 BN+
 SYSTEMATIC
  SAFETY &
 EFFICIENCY                         NXDSP        USD 130 MN     ON TRACK       USD 160 MN

HIGH-QUALITY                     OIL & GAS
  LOW-COST                                       112 MBOEPD    110 MBOEPD     ~ 110 MBOEPD
                               PRODUCTION**
 ASSET BASE

  MOL 2030:                   NET DEBT/EBITDA      0.97X          0.75X
ROBUST FCF GENERATION CONTINUED IN Q2 2017
IN A FAIRLY SUPPORTIVE EXTERNAL ENVIRONMENT
FINANCIAL HIGHLIGHTS
Clean CCS EBITDA rose 20% to USD 684mn in Q2 2017, bringing H1 EBITDA to USD 1.3bn (+20% YoY)
Simplified free cash flow was up 30% YoY to USD 436mn in Q2 2017, as organic capex was slightly up (USD
248mn); H1 simplified free cash flow jumped by 42% to USD 940mn
Full-year 2017 guidance is upgraded to above USD 2.3bn Clean CCS EBITDA, while organic capex
guidance is reduced to around USD 1bn, implying at least USD 1.3bn simplified free cash flow for the year
Upstream EBITDA grew strongly YoY and the segment continued to generate a massive amount of FCF
(USD 158mn in Q2 only), also supported by some non-recurring revenues
Refining strength offset softer petchems, as Downstream posted flat Clean CCS EBITDA of USD 327mn in
Q2
Consumer Services continued to benefit from strong volumes growth and non-fuel contribution, as
EBITDA rose by 17% to USD 95mn in Q2 2017 (the highest on record)
Credit metrics materially improved in Q2 (Net debt/EBITDA to 0.75x, net gearing to 21%) on the strong
cash generation, some working capital release and despite the HUF 58bn dividend payment. S&P revised
the outlook to positive from stable on MOL’s credit rating.
OPERATIONAL HIGHLIGHTS
Key licence agreements were signed for core technologies of the flagship „Polyol Project”, marking the
first milestone along this major petchem transformational journey
Oil and gas production declined by 2% QoQ in Q2 2017 to 109 mboepd, driven by lower UK and Croatia
The consortium of MOL Group, E.ON Group, HEP, Petrol, BMW and Nissan (the NEXT-E project) received
EUR 19mn EU funding to build a charging network (of 250+ units) for electronic vehicles in the CEE region
26SOLID EBITDA GROWTH (+20%) IN Q2 2017
HIGHEST Q2 EBITDA SINCE 2011
SEGMENT CLEAN CCS EBITDA (USD mn) Q2 COMMENTS
+20% +11% Downstream
614 684 Strong refinery margins were offset by softer
571 petchem margins and lower petchem sales
587
506 219 228
169 488 Consumer Services
Fuel volumes, margins and rising non-fuel
337 324 327 contribution all remained tailwind in Q2 2017
Upstream
55 95
81
30 70 ‐4 37 Also helped by some non-recurring revenues
‐46 ‐55
Q1 2016 Q2 2016 Q3 2016 Q4 2016 Q1 2017 Q2 2017 Gas Midstream
US DS CS GM C&O (incl. inters) Higher capacity bookings offset lower tariffs
SEGMENT CLEAN CCS EBITDA YTD (USD mn) H1 COMMENTS
+20% Downstream
1,297 Record-high H1 EBITDA on very strong refining
1,078 Consumer Services
447
315
Both fuel and non-fuel enjoyed sustained growth
618 652 Upstream
Higher oil prices, lower costs boosted EBITDA
97 107
129 150
‐82 ‐58 Gas Midstream
H1 2016 H1 2017
Strong volumes (cold weather) drove EBITDA
US DS GM CS C&O (incl. inters) growth
27OUTSTANDING SIMPLIFIED FCF IN 2017 YTD
UPSTREAM DRIVING THE YOY GROWTH IN FCF GENERATION
SIMPLIFIED FCF* (USD mn) Q2 COMMENTS
Group-level simplified FCF (Clean CCS EBITDA less
+30% ‐14%
organic capex) rose by 30% in Q2 2017 to USD
505 436mn
163 436 Upstream continued to post more than impressive
336
329 37 346 158 FCF growth
289
Downstream FCF was down on higher capex
265 159 191 (partly driven by maintenance schedules)
45
71
Positive momentum in FCF generation in
63
27 70 32 Consumer Services intact in Q2
‐16
‐56 ‐62
Q1 2016 Q2 2016 Q3 2016 Q4 2016 Q1 2017 Q2 2017
US DS CS GM C&O (incl. inters)
SIMPLIFIED FCF* YTD (USD mn) H1 COMMENTS
+42%
Group-level simplified FCF generation jumped by
940 42% in H1 2017 to USD 940mn, already exceeding
the original full-year guidance
665 321
74 Upstream turned into a material FCF contributor
and increased FCF by more than 4x YoY despite
492 480
rather low oil and gas prices
102 115 Downstream FCF was around stable YoY
95 102
‐98 ‐78
Consumer Sevices and Gas Midstream FCF
H1 2016 H1 2017 continued to rise in H1
US DS CS GM C&O (incl. inters)
28
* Simplified Free Cash Flow = Clean CCS EBITDA – organic CAPEXDS: STRONG & STABLE CCS EBITDA IN Q2 2017 YOY
AS IMPROVING R&M CONTRIBUTION OFFSET SOFTER PETCHEM
CLEAN CCS EBITDA YoY (USD mn) COMMENTS
13 Stronger middle distillate and
337 67 34
30 327 heavy product spreads and more
69
favourable wholesale margins in
258
Petchem 166 133 R&M
Shrinking integrated margin (IM)
by 11% in petchem
R&M 171 194
Lower volumes on Slovnaft
turnaround and small-scale
availability issues
Clean CCS R&M price Petchem price Volumes Other Clean CCS CCS EBITDA
EBITDA & margin & margin EBITDA modification Q2 2017 Other items: Higher OPEX on
Q2 2016 Q2 2017 & one‐off
rising natgas prices and weaker
EUR affecting petchem
CLEAN CCS EBITDA YTD (USD mn) COMMENTS
45 6 0.8 USD/bbl complex margin
618 132 59 652 627
25 expansion and higher realized
256
prices in R&M…
Petchem 326 … only partly offset by the 117
EUR/t drop in the integrated
petchem margin
395
R&M 292 Other items: Higher OPEX on
rising natgas prices and weaker
Clean CCS R&M price Petchem price Volumes Other Clean CCS CCS EBITDA EUR affecting petchem
EBITDA & margin & margin EBITDA modification H1 2017
H1 2016 H1 2017 & one‐off
29CS: STRONG GROWTH LEADS TO BEST EVER Q2
GROWTH IN FUEL CONSUMPTION DRIVES VOLUMES AND EARNINGS
QUARTERLY EBITDA (USD mn) EBITDA YoY (USD mn)
17% 74%
6 7 98 95
112
95 18 2
81 81
67
47 55
Q1 2016 Q2 2016 Q3 2016 Q4 2016 Q1 2017 Q2 2017
EBITDA Q2 Fuel volume Non‐fuel Others EBITDA FX EBITDA Q2
2016 & margin margin Q2 2017 2017
(Reported) (Constant (Reported)
FX)
KEY FINANCIALS (USD mn) EBITDA YTD (USD mn)
9 8 155
Q2 2016 YoY H1 2016 YTD
Q2 2017 H1 2017
Restated Ch % Restated Ch % 25 5
129
EBITDA 95.4 81.4 17 150.2 128.8 17
150
EBIT 74.6 59.7 25 108.0 86.4 25
CAPEX and
24.7 36.0 (31) 34.8 44.4 (22)
Investments
EBITDA H1 Fuel volume Non‐fuel Others EBITDA FX EBITDA H1
2016 & margin margin H1 2017 2017
(Reported) (Constant (Reported)
FX)
EBITDA up 17% YoY mainly on the back of higher Continued roll-out of Fresh Corner supports non-fuel;
volumes and stronger margins M&A contributes
Investments related to the continued roll-out of Fresh Higher OPEX partly driven by increases to minimum
Corners during Q2 make up more than 2/3 of total wage in Hungary and Romania, impacting ~1/3 of the
CAPEX network 30E&P: OVER 40% INCREASE IN YTD CLEAN EBITDA
ON HIGHER OIL PRICES AND FURTHER IMPROVING COST BASE
UPSTREAM EBITDA QoQ (USD mn) COMMENTS
228
219 Lower Brent (-4USD/bbl) and
5 3
9 0
29 shrinking gas prices QoQ...
2
…coupled with lower
production weighted on
120
EBITDA…
…but other items more than
offset (incl. the collection of
109
USD 20mn previously
impaired trade receivables in
Egypt)
EBITDA Prices FX Volumes Exploration Lifting cost Other EBITDA Depreciation EBIT ex‐
ex‐oneoff Expenses ex‐oneoff ex‐oneoff oneoff
Q1 2017 Q2 2017 Q2 2017
UPSTREAM EBITDA YTD (USD mn) COMMENTS
447
Brent rose by 30% from the
13 37 H1 2016 lows
13
8 2
0.5 USD/bbl lifting cost
100
reduction on efficiency
315 235 improvement
Other items driven by the
collection of receivables in
212 Egypt (+USD 20mn vs H1 16)
Lower production and
EBITDA Prices FX Volumes Exploration Lifting cost Other EBITDA Depreciation EBIT ex‐ unfavorable FX moves
ex‐oneoff Expenses ex‐oneoff ex‐oneoff oneoff weighed on EBITDA
H1 2016 H1 2017 H1 2017
31
Notes: consolidated figures, unless otherwise indicatedSLIGHTLY LOWER PRODUCTION IN Q2 2017
PRIMARILY ON REDUCED FLOW RATES AT SCOLTY & CRATHES IN THE UK
QUARTERLY PRODUCTION BY COUNTRY (mboepd) COMMENTS
QoQ:
‐4% ‐2% UK: -2.3 mboepd; constrained
114.4 113.1 Scolty&Crathes production on
112.4 111.2
Estimate 7.5 109.2 109.0 wax build-up in the pipeline
8.0 8.7 ~105
Associated 3.4 8.3 8.8 8.7
2.8 3.3 2.8
companies 4.1 3.0 3.8 2.6 2.4
3.8 3.8 3.9 YoY:
Other 10.2 8.3 7.4 9.0
5.9 6.8
KRI 7.5 Inorganic: -1.5mboepd on MV
7.4 7.4 7.9
UK 1.6 1.5 0.5 8.3 8.4 divestment (Russia)
1.5 0.0 0.0
Pakistan CEE : -2.2 mboepd (o/w -0.8
Russia mboepd off-shore)
Croatia 36.8 36.2 35.2 36.9 Material growth in Pakistan
36.0 35.7
(+0.9 mboepd) and Baitugan
(+0.8 mbeopd)
UK: -1.5 mboepd on Cladhan
July production:
Hungary 44.7 44.2 44.1 44.4 42.7 43.0 Affected by maintenance in
Hungary, Pakistan and the UK
Scolty&Crathes production
issues continued
Q1 2016 Q2 2016 Q3 2016 Q4 2016 Q1 2017 Q2 2017 July estimate
32This page was left blank intentionally
33DOWNSTREAM STRATEGY
DOWNSTREAM: CEE STRONGHOLD
TRANSFORMATIONAL PROJECTS TO ADD USD 3/BBL BY 2022 TO THE ALREADY
OUTSTANDING MARGIN CAPTURE

               MOL 2030 Downstream strategy prepares for peak fossil-fuel
               demand
                    R&M: raising the yield of high-value non-motor fuel product to
                    at least 50% by 2030
                    Petchem: debottlenecking existing assets, increasing
                    feedstock offtake from refining, extending the Downstream
                    value chain by entering new products and markets
               USD 1.9bn transformational capex in petchem in 2017-21 including a
               new polyol plant and revamping two steam crackers
               Focus on the efficiency and flexibility of the existing high quality,
               deeply integrated, land-locked asset base
               Maintain outstanding „mid-cycle” cash generation (USD 12+/bbl
               margin in 2016, nearly USD 1bn simplified FCF)
               Add USD 3/bbl margin through transformational projects by 2022

                                                                                       35
DOWNSTREAM WORLD IS UNDER PRESSURE
REGULATORY ENVIRONMENT AND CHANGING CUSTOMER BEHAVIOUR CAN
SERIOUSLY AFFECT CEE REFINERS
LOW-CARBON REVOLUTION
DECLINING DEMAND AND
BACKED BY PROGRESSIVE
ENERGY POLICY1 INCREASING IMPORT IN CEE
FOSSIL FUELS PUSHED ECO-FRIENDLINESS and
OUT FROM SOME OPENNESS TOWARDS
MARKETS1 ALTERNATIVE FUELS
INCREASED IMPORTANCE OF
TRENDS & VALUES
STATE AID & SUBSIDIZATION OF
NEW TECHNOLOGIES 2
PETROCHEMICALS DEMAND TO GROW
REGULATION MARKET & CUSTOMERS
(1) e.g. ECA for Fuel Oil 36
(2) e.g.: effect of EV subsidy – share of EVs in new car sales in 2015: Norway – 20%; Netherlands – 10%; EU average: 1%PREPARING FOR PEAK FUEL DEMAND
FOSSIL FUEL DOMINANCE TO DIMINISH BY 2030, BUT DEMAND STILL SUBSTANTIAL
CHEMICALS
FOSSIL FUEL DEMAND MAY
DECLINE,
AIR TRANSPORT
BUT STILL MATERIAL
OIL-BASED FUEL
CONSUMPTION
ALTERNATIVE FUELS LIKELY TO
TRUCKS
WORLD TRENDS GAIN SIGNIFICANT MARKET
SHARE PASSENGER CARS
INCREASE EXTEND THE MOBILITY &
FLEXIBILITY VALUE CHAIN SERVICES
P RODUCE 50% I NCREASE CHEMICAL E STABLISH A NEW
VALUABLE NON FUELS AND PETROCHEMICAL BUSINESS LINE TO
PRODUCTS PRESENCE RESPOND TO
CUSTOMERS ’ NEEDS IN
MOBILITY
37PRODUCTION: 50% NON-MOTOR FUEL PRODUCTS BY 2030
FROM THE CURRENT LESS THAN 30%
MOTOR FUEL
GROUP REFINERIES YIELD PRODUCTS
2010 2015 2030 • KEEP CURRENT LEADING POSITION
• BUILD ON CURRENT RETAIL NETWORK
VALUABLE NON-MOTOR FUEL PRODUCTS
~60% ~70% • INCREASE PRODUCTION OF PETCHEM
FEEDSTOCK UP TO 3 MTPA
• TAKE ADVANTAGE OF GROWING PROFITABLE
PRODUCTS (JET, BASE OILS, LPG) MARKETS
• INCREASE OTHER CHEMICALS (E.G. AROMATICS)
~50%
50+%
OTHERS
• MINIMIZE THE PRODUCTION OF BLACK
PRODUCTS
38PETCHEM DEBOTTLENECKING TO INCREASE FLEXIBILITY
STEAM CRACKER INVESTMENTS TO INCREASE NAPHTHA INTAKE BY UP TO 800 KT/Y
CAPEX EARLIEST
PROJECT TARGET (USD mn) START-UP
• Energy efficiency and propylene yield
MPC Steam
improvement
Cracker Revamp - ~300 2020-2021
naphtha processing
NEXT FIVE YEARS
• 200kt additional naphtha off-take
400 kt/y additional
Phase 1.
• Additional 60 kt/y propylene and 70 kt/y C4 mix
PRIORITIES
MOL FCC • Increase propylene yield
80-100 2020-2021
Revamp • Additional 65 kt/y propylene
• Lifetime extension and debottlenecking to improve
Slovnaft Steam ethylene and propylene volume
~300 2021 -
Cracker Revamp • Targeted capacity is 280-300 kt/y ethylene
• 200kt additional naphtha off-take
additional naphtha
POTENTIAL
Up to 400 kt/y
processing
FUTURE
MPC Steam
• Intensification of MPC Steam Cracker-2 Too
Cracker
• Targets significant capacity extension and early to 2025
Revamp - Phase
400kt/y additional naphtha off-take define
2.
39PROPYLENE, BUTADIENE & AROMATICS ATTRACTIVE
FOR EUROPEAN NAPHTHA-BASED PRODUCERS
NORTH-AMERICA EUROPE CHINA
Shale gas developments – a Economic slowdown in Asia
Crackers will rely on more expensive naphtha
potential challenge to the turning PE exports towards
feedstock, have to focus on efficiency Europe, yet limited impact on
ethylene leg of the European
petchem industry
improvement and higher value derivatives polypropylene
ETHYLENE PROPYLENE BUTADIENE AROMATICS
Attractive due to supply High price volatility on Short in supply,
Oversupply of ethylene
constraints and do not supply-demand challenging refiners
and its derivatives
suffer from cost balance, profitable in to increase yield/
driven by cheap gas
disadvantage the long-term production
Primary focus Further possibilities being explored
REMAIN
DEFENSIVE
ATTRACTIVE DIRECTIONS TO BE EXPLOITED
40POLYOL – AN ATTRACTIVE PROPYLENE DERIVATIVE
MOL LACKS SUFFICIENT AMOUNT OF OWN FEEDSTOCK TO EXPAND IN PP
FORWARD INTEGRATION OPTIONS ALONG THE
SELECTION CRITERIA
PROPYLENE VALUE CHAIN
Other Propylene Further analysis is in progress
Derivatives Market size 1 WE/CE: 5/0.4 mt/y 2 to recognize other attractive
Others specialties
II. Polyol High degree of vertical
Semi-Commodity
Market size1 WE/CE: 1.2/0.2 mt/y integration
Polymer
Right size in terms of excess
Market growth rate3: ~1%/3%
propylene
High unit margins
I. Polypropylene
Commodity Market size1 WE/CE: 7.4/1.7 An attractive market, but
Polymer insufficient feedstock would
mt/y
not allow for economic
Market growth rate3: plant size
~1%/~2.5% Exposed to very high price
and margin volatility
(1) Market size as of 2014
(2) Propylene consumption other than I+II 41
(3) Market growth rate to 20302030: FIRST MILESTONE OF THE PETCHEM TRANSFORMATION
TEAMING UP WITH WORLD-CLASS PARTNERS FOR 200 KT/PA POLYOL PROJECT
WHAT HAS BEEN REACHED?
Key contracts signed for the purchase of technology licenses and process design packages for HPPO
technology
Fluor Corporation selected as project management consultant (PMC) for FEED, procurement and
construction phases of the project
STEAM CRACKERS POLYOL
AND REFINERY UNITS HPPO UNIT PLANT
WHAT’S NEXT?
Launch FEED (Front End Engineering and Design)
Select licensor for polyether polyol technology
Select location within Hungary
Select contractor for the engineering of utilities and facilities
Timeline (2017-21) and cost estimate (up to USD 1bn) unchanged
42ENTERING THE POLYURETHANES VALUE CHAIN
Petchem feedstock Basic chemicals Intermediates / pre-polymers Polymers
nitro-
benzene MDI/PMDI
benzene
propylene
naphtha propylene polyols polyurethanes
-oxide
nitro-
toluene TDI
toluene
PUR FORMULATORS
„SYSTEM HOUSES”
OLEFIN END-
REFINING PRODUCERS
CHEMICAL COMPANIES (R&D, technical
service, some USERS
production)
MOL GROUP DIVERSIFICATION
SPECIALISATION
current coverage organic development
43WIDESPREAD APPLICATION OF POLYOL
… AS AN ESSENTIAL POLYURETHANE COMPONENT
GLOBAL POLYURETHANE DEMAND BY
DRIVERS
INDUSTRY
% of global demand
Improving access to „essentials of life”,
increasing comfort needs
~30% Improving life expectancy and population
growth
FURNITURE &
INTERIOR
Improving energy efficiency in construction
PU have outstanding insulation
~25% characteristics, 50 – 70% less material is
required to reach same insulation value
CONSTRUCTION
Light-weight vehicles to reduce fuel
consumption
PP / PU represents 50%+ of total plastic used
~15% in car manufacturing
Average plastic content of a midrange car
AUTOMOTIVE grew fivefold since the 1970s (to up to
200kg), including ca. 20-25kg polyol today
44MOL TO BECOME THE SOLE INTEGRATED REGIONAL
POLYOL PRODUCER
POLYOL CONSUMPTION PER CAPITA
CE POLYOL SUPPPLY
(WESTERN EUROPE, 2016 = 100%)
Crude Steam
Polyol
processing cracking
W e s t e r n ‐Europe
110% E a s t e r n‐Europe
100% 90%
65%
Current CE PO
producers
2016 2025
Supply: Demand:
CE producers lack backward-integration… Central European demand is expected to
… and existing CE polyol capacity is grow ~3% vs ~1% in Western Europe…
chlorohydrin based – a declining technology … yet there may still be a substantial per
due to its high cash cost and environmental capita consumption gap by 2025
issues
No ongoing capacity addition project in
Europe
45ATTRACTIVE VALUE CHAIN EXTENSION
WITH 900-1,000 USD/T ADDITIONAL MARGIN CAPTURE OPPORTUNITY
PROPYLENE VS. POLYOL SPREADS1
CE POLYOL MARKET CHARACTERISTICS
(USD/T)
Relative deviation: PP – propylene: 47%
S u p p ly PO – propylene: 13%
Demand ~3% CAGR 1.200
1.000
~80kt
deficit 800
~150
currently
600
400
200
0
Current ~2025 2003 2004 2005 2006 2007 2008 2009 2010 2011 2012 2013 2014 2015 2016
source: MOL Group
Polyol (low) ‐Propylene Spread Polypropylene ‐ Propylene spread
Supply–demand balance: Margin exposure:
Central Europe in net import position and Average historical PO–PP spread is 800-1,000
drives European demand growth USD/t
MOL Group is expected to be a front-runner on Polyol is cyclical, but profit generation
the Central European cost curve (margin/spread) is significantly less volatile than
that of polypropylene
(1) Monthly nominal quotations
46~USD 1.9BN EARMARKED FOR PETCHEM UNTIL 2021
PROVIDING ~2 USD/BBL ADDITIONAL EBITDA CAPTURE IN DOWNSTREAM
EARMARKED CAPEX FOR PETROCHEMICAL GROWTH PROJECTS (2017-21, USD MN)
~1,800-2,000
Annual incremental
900-1,000 1,500-1,700 EBITDA1 of USD 250-300mn
from growth projects
• Growth CAPEX shall be
covered from operating
600-700 cash-flow
• Projects to be
committed if meeting
10-15% IRR target
Steam cracker Polyol Other growth Total
intergration & opportunities
others
Potential
CAPEX high
lower
variation
level:
(1) Annual EBITDA contribution calculated based on average historic margin levels 47
(2) EBITDA uplift per barrel calculated over 19 mT p.a. processed volume2030 STRATEGY AND 2030 CULTURE
VISION
VALUES STRATEGY
STANDARDS GOALS
CULTURE
2030 STRATEGY
ENTER
TOMORROW
COMPETENCY ACTIONS
BEHAVIOUR PROCESSES
RESULT
48This page was left blank intentionally
49DOWNSTREAM OVERVIEW
INTEGRATED DOWNSTREAM MODEL IN CEE

       12 COUNTRIES

       SALES OF 18 mtpa REFINED PRODUCTS
       AND   1.25 mtpa PETROCHEMICALS
       TO OUR WHOLESALE CUSTOMERS
       WORLDWIDE ANNUALY

        15,000
        SERVICE STATIONS

        1,900+
                            FUEL SOLD
                            ~5.2    bnliters

                                               51
DEEP DOWNSTREAM INTEGRATION
HIGH-QUALITY LAND-LOCKED ASSETS WITH OUTSTANDING MARGIN CAPTURE
MARKET SHARE (%)1 DOWNSTREAM INTEGRATION (FUELS)2
~24%
CRUDE INTAKE:
• Russian: ~40%
67%
• Seaborne:
25% ~85%
• Own
Refining ~80%
production: ~36%
8% captive
Retail ~45% market3
own
~15% market
PetchemOVER 12 USD/BBL MARGIN CAPTURE IN 2016
FURTHER ~3 USD/BBL UPLIFT POTENTIAL FROM PETCHEM & CONSUMERS
DOWNSTREAM (W/O INA) CAPTURED EBITDA MARGIN (USD/BBL)
~1
~2
12.3
2.0
Sales
margin
4.6
~5 USD/BBL delivered
through internal
efficiency
Bulk improvement (2012-16)
margin
5.7
R&M gross R&M OPEX R&M Petchem Retail1 2016 First wave Consumer Oil world Further 2022
margin EBITDA of petchem services decline efficiencies EBITDA
investments
(1) Part of Consumer Services 53NXDSP: USD 350MN ASSET&EFFICIENCY IMPROVEMENT
ADDITIONAL USD 150MN TARGETED FROM GROWTH PROJECTS
EFFICIENCY IMPROVEMENT GROWTH PROJECTS’ CONTRIBUTION 2
1
(CUMULATIVE, MN USD) (MN USD)
350 Production
USD ~270MN 1. Availability & USD ~70MN DELIVERED SO FAR
DELIVERED SO FAR maintenance (ONLY USD 10MN IN 2016),
2. Production flexibility BELOW OUR TARGETS
and yield
improvements
A
230 3. Energy management $150MN
Production
4. Hydrocarbon loss Butadiene: 130 ktpa capacity
management Butadiene Extraction Unit
LDPE: 220 ktpa capacity LDPE in
Supply & sales
Slovnaft
1. Develop market access ~55%
110 2. Develop market
B IES
presence
IES refinery conversion completed
3. Logistics
~25%
Retail
C Retail
1. Step change in non‐fuel
2. Solid fuel flow ~20% Over 250 service stations acquired in
3. Portfolio optimisation Czech Republic, Slovakia & Romania
2015 2016 2017
2017 vs
2014
NxDSP delivery figures exclude offsetting items 54OUTSTANDING „MID-CYCLE” FCF GENERATION
WITH CONTINUOUS FOCUS ON EFFICIENCY IMPROVEMENT
CLEAN CCS EBITDA (USD MN)
1,453 1,400-1,500
~150 ~160
~410 400-500
~170
~340 ~1000
874
24
500
350
2011 NDSP Macro* 2014 NxDSP Offsetting Macro 2,3 2016 Macro NxDSP 2017 Normalized Simplified
delivered items 1 CAPEX FCF
(1) Offsetting items were incurred in 2016 and were mostly related to availability issues (unplanned shutdowns) in both petchem and refining
(2) Including offsetting items and the reversal of previous offsetting items 55
(3) Based on normalised downstream margin assumptionsCONSTANTLY IMPROVE EFFICIENCY AND AVAILABILITY
~96,0% 96+%
EXTEND TURNAROUND CYCLES
94.7%
SYSTEMATIC IMPROVEMENT
OF MECHANICAL INTEGRITY
RELIABILITY AWARENESS
MIND-SET AMONG WORKERS
2014 2018 2020
REFINING OPERATIONAL ONE-QUARTILE IMPROVEMENT 50%+ OF NON MOTOR FUELS
AVAILABILITY TO ~96% IN COST EFFICIENCY2 IN REFINERY YIELD
2018 2018+ 2030
CRUDE FLEXIBILITY:
2ND QUARTILE IN ENERGY
INCREASE ASSETS FLEXIBILITY 33% SEA BORNE
INTENSITY INDEX1
50+ QUALITIES
50+ INITIATIVES ALREADY IMPLEMENTED
OPERATIONAL OPTIMIZATION
SELECTED INVESTMENTS
(1) In the Western Europe Group of the Solomon Study, (2) In the Central and Southern Europe Group of the Solomon Study
56~19% SEABORNE CRUDE TO DANUBE REFINERY IN 2016
FIRST SEABORNE CARGO PROCESSED IN BRATISLAVA IN 2016
ADRIATIC PIPELINE ACCESS ESTABLISHED CRUDE DIVERSIFICATION1
Increased
pipeline
capacity:
6Mtpa = SN
REB
97% 75%
Seaborne
Increased 3% 25% 33%
pipeline capacity:
14Mtpa = MOL+SN
2011 2016 2020
ENHANCING FEEDSTOCK FLEXIBILITY
Number of purchased cargos* through
Majority of the crude intake remains Ural, however, the number
Adria pipeline for landlocked refineries
of tested crudes in the complex refineries is on the rise
Targeting further increasing seaborne crude oil supply to 33%
with widening crude basket to reach 50 types by 2020
19-25 Following the successful rehabilitation and expansion of the
15 17 Friendship 1 pipeline, seaborne crude oil delivery to Slovnaft was
8 launched in 2016
3 Opportunistic approach based on continuous optimization -
2012 2013 2014 2015 2016 2017E capturing benefits of fluctuating crude spreads
57
* One cargo is equivalent of 80kt crude; (1) Group level, including INAPETROCHEMICALS IN MOL’S INTEGRATED
DOWNSTREAM VALUE CHAIN
RELEVANT POLYOLEFIN CAPACITY IN
MOL’S PETROCHEMICALS VALUE CHAIN
EUROPE (2015 KTPA)
Capacity
LyondellBasell
Borealis
420 kT HDPE SABIC Europe
INEOS
Total Petrochemicals
285 kT LDPE Repsol
MOL Group 1.200
ExxonMobil
Refining Petchem 535 kT PP Basell Orlen
Kazanorgsintez
Internal feedstock1: Versalis
~1.5 Mt in 2015 350 kT Aromatics2
Chemopetrol
Braskem
Dow
Sibur
130 kT Butadiene 40kT SSBR
LDPE, HDPE, PP capacity source: MOL Group
LDPE4: 220 ktpa unit replaced three old ones in Bratislava in 2016
Butadiene: 130 ktpa unit commissioned in 2016
SSBR: 60 ktpa unit is under construction (49% MOL stake)
(1) Considering steam cracker feedstock (naphtha & LPG) from Danube & Bratislava refineries only
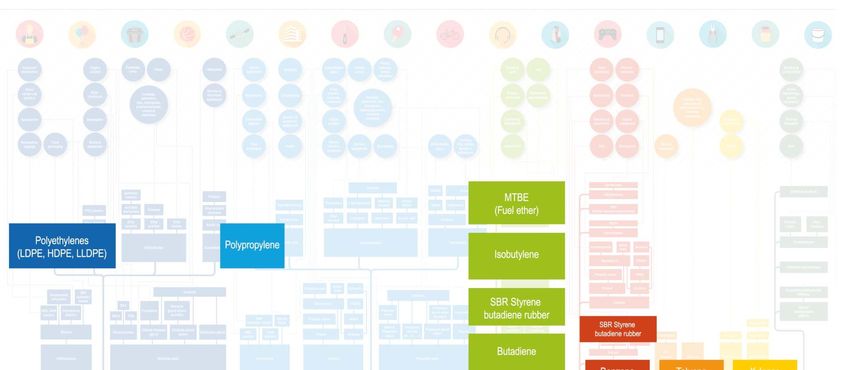
(2) Considering 2015 production 58SEVERAL OPTIONS TO EXPAND ALONG THE VALUE CHAIN Polyethylenes (LDPE, HDPE) source: www.petrochemistry.eu 59
CONSUMER
SERVICES
A LEADING REGIONAL NETWORK

   USD 307MN EBITDA IN 2016
                                                                                          CZECH R.

                       MARKET LEADING                                                 MARKET POSITION: 2
                                                                                      MARKET SHARE: 20%                 SLOVAKIA
                                                                                                                     MARKET POSITION: 1
                       IN 60% OF THE NETWORK                                                                         MARKET SHARE: 47%

                         TOP 3                                                                                                         HUNGARY
                                                                                                                                   MARKET POSITION: 1
                         IN 90% OF THE NETWORK                                                                                     MARKET SHARE: 44%

                                                                           SLOVENIA
                                                                       MARKET POSITION: 3
                            10    COUNTRIES1                           MARKET SHARE: 10%                                               ROMANIA
                                                                                                                                   MARKET POSITION: 3
                                                                                                                                   MARKET SHARE: 20%

                 7 WELL ESTABLISHED BRANDS
                                                               ITALY2
                                                         MARKET POSITION: N/A
                 1,900+                                   MARKET SHARE: 50%                MARKET POSITION: 1
                                                                                                                   MARKET SHARE: 14%

   ~1 MN               TRANSACTIONS / DAY
                                                                                       CORE 5 COUNTRIES                     REFINERY

(1) Montenegro (1 station) is not included in the map, (2) Italy is not considered anymore as core market                                           61
Market share sources: Hu, Ro, Sk, Cz – oil association share (incl. Eni), Slo – retail market share (incl. Eni), Cro, Srb, BiH – own estimation
A VALUE GENERATING NETWORK…
…AS EBITDA PER SITE ALMOST DOUBLES
EBITDA (REPORTED, USD MN) NORMALIZED FCF (USD MN1)
0
56
193 200
29
179
307 126
204 221
151
2013 2014 2015 External Internal FX 2016 2013 2014 2015 2016
EBITDA (CONSTANT, USD MN 2) EBITDA PER SITE (USD TH1) COMMENTS
164 Fuel is still the main EBITDA
307 growth contributor:
119 123
221 Fuel margins, strong fuel
87
170 consumption main drivers
120
Recent M&A contributes
Contribution of non-fuel
2013 2014 2015 2016 2013 2014 2015 2016 increasingly on the rise
(1) Based on Reported Figures 62
(2) Constant USD Figures at FX 2016FUEL SALES ON THE RISE
GROWTH MOSTLY DRIVEN BY RISING CEE FUEL CONSUMPTION; M&A CONTRIBUTES
M&A DRIVEN NETWORK EXPANSION FUEL SALES (MN LITERS)
CZECH R. HUNGARY
SLOVAKIA
ROMANIA
SLOVENIA 5,239
BOSNIA
MONTENEGRO
4,837
SLOVENIA CZECH R.
SLOVENIA CZECH R. 4,292 4,323
ITALY CROATIA
BOSNIA
CROATIA
AUSTRIA
1861 1967
1658 1558 1574 1690 1686 1664
999 1076
772
2006 2007 2008 2009 2010 2011 2012 2013 2014 2015 2016 2013 2014 2015 2016
CEE1 MOTOR FUEL DEMAND FUEL THROUGHPUT PER SITE
COMMENTS
(2008 = 100%) (MN L/SITE)
1.10
2.84 2.94 Rising fuel consumption and
2.76
1.05 2.52 constantly optimized network drive
rise in throughput
1.00
Future M&A an option likely outside
0.95
“domestic” markets (Slovakia,
0.90 Hungary and Croatia), but always
within the supply radius of refineries
0.85
2008 2009 2010 2011 2012 2013 2014 2015 2016 2017
2013 2014 2015 2016
YTD
63
(1) Hungary, Slovakia, Croatia, Slovenia, Czech Rep., Romania, Bosnia-H., SerbiaNON-FUEL INCREASINGLY A GROWTH DRIVER
CONCEPTUAL CHANGE, COCO/A OPERATING MODEL SUPPORT GROWTH
NEW CONCEPT AND A COMPLETE REVAMP NON-FUEL SHARE OF TOTAL MARGIN GROWTH (%)
Introducing a non-fuel concept: FRESH CORNER
37
24
4
SKUs heavily reduced and optimized 2
Focus on coffee, fresh food, everyday groceries
2013 2014 2015 2016
Positive customer response
TOTAL NUMBER OF FRESH CORNERS NON-FUEL AS % TOTAL MARGIN
331 24
303 22
248 19 21
167
91
6 22 23 42
Q2 15 Q3 15 Q4 15 Q1 16 Q2 16 Q3 16 Q4 16 Q1 17 Q2 2017 2013 2014 2015 2016
642021 STRATEGIC PRIORITIES
EXPLOIT POTENTIAL IN FUEL, ACCELERATE SHIFT TOWARDS NON-FUEL
RETAIL MARGIN DEVELOPMENT 2021 STRATEGY
ACCELERATE SHIFT TOWARDS NON-FUEL
5 DRIVEN AND OMNI-CHANNEL2 OFFERING
3 4
24% 2
1 EXPLOIT FUEL POTENTIAL: IMPROVE
FUEL QUALITY AND BRAND MESSAGING
76%
1 1 2 CONTINUOUSLY IMPROVE OPERATIONS:
CATEGORY MANAGEMENT, LOYALTY,
PURCHASE PRICE MANAGEMENT ETC.
2016 2021
Non‐fuel Fuel 3 OPTIMIZE/CUSTOMIZE STORE FORMAT,
AND IMPROVE OFFERING/SERVICES
EBITDA (CONSTANT, USD MN1)
450
4 ENTER COFFEE SHOPS AND
CONVENIENCE STORES BUSINESS
307
221
170 5 GO ONLINE AND COMPLETE DIGITAL
120 ... TRANSFORMATION
2013 2014 2015 2016 2021
(1) At constant avg. 2016 USD FX.
(2) A multichannel approach to sales that seeks to provide the customer with a seamless shopping experience
65
whether the customer is shopping online from a desktop or mobile device, by telephone or in a store.EXPLORATION AND PRODUCTION STRATEGY
E&P BUSINESS SUCCESSFULLY REBALANCED
CREATING VALUE AT ~50 USD/BBL OIL PRICE

              7 USD/boe free cash-flow delivered in
              2016 on the back of the successful New
              Upstream Program implementation
              Production to peak at ~115 mboepd in
              2018/19
              E&P business shall seek for inorganic
              expansion possibilities to replace
              reserves
              2016-21 post-tax free cash-flow:
                   shall cover reserve replacement
                   necessary to maintain today’s
                   production @ 50 USD/bbl
                   shall be sufficient for 100% reserve
                   replacement @ 60 USD/bbl
                                                          EXPLORATION   PRODUCTION

                                                                                67
TOP 15% IN SUSTAINABILITY
A COMMITMENT TO THE INTEGRATION OF ECONOMIC, ENVIRONMENTAL AND SOCIAL
FACTORS INTO EVERYDAY OPERATIONS
HEALTH & SAFETY WE OPERATE SAFELY OR WE DON’T OPERATE
IMPLEMENTING ACTIONS AIMING AT ZERO
INCIDENTS AND ZERO FATALITIES 1
ENVIRONMENT
REDUCE THE NUMBER OF SPILLS (OVER 1
CUBIC METER) BY 30%
CLIMATE CHANGE
DECREASE GHG EMISSIONS FROM FLARING
BY ~33% 2
HUMAN CAPITAL
INCREASE EMPLOYEE ENGAGEMENT LEVEL +
FURTHER DEVELOP AND UTILIZE
TECHNICAL CAREER LADDER IN UPSTREAM
(1) Lost-time injury frequency, own and on-
site contractors LEVEL B 68
(2) Tons in CO2 equivalentPRODUCTION IN 8 COUNTRIES
RUSSIA
Reserves: 50 MMboe
CEE TOTAL Production: 6.4 mboepd
Croatia, Hungary KAZAKHSTAN
Reserves: 262 MMboe Reserves: 60 MMboe
Production: 78.7 mboepd
PAKISTAN
o/w CEE offshore Reserves: 10 MMboe
Reserves: 10 MMboe Production: 8.3 mboepd
Production: 8.4 mboepd
OTHER
INTERNATIONAL
UK, NORTH SEA Egypt, Angola, Kurdistan
Reserves: 23 MMboe Region of Iraq, Syria
Production: 7.9 mboepd Reserves: 55 MMboe
Production: 6.3 mboepd
PRODUCTION BY COUNTRIES AND RESERVES BREAKDOWN BY COUNTRIES
PRODUCTS (MBOEPD; H1 2017) AND PRODUCTS (MMBOE; 2016 YEAR END)
16% 9% 14% 10%
23%
5%
7% 41% 42% 43%
6% 110 110 459 459
24%
50% 47%
34%
33%
Hungary WEU (North Sea) Oil Hungary WEU (North Sea) Oil Condensate
Croatia MEA & Africa Gas Croatia MEA & Africa Gas
CIS Condensate CIS 69
Note: Group production figures include consolidated assets, JVs (Baitex in Russia, 6.4mboepd) and associates (Pearl in the KRI, 2.4mboepd)7 USD/BOE FREE CASH-FLOW DELIVERED IN 2016
ON THE BACK OF SUCCESSFUL NEW UPSTREAM PROGRAM IMPLEMENTATION
2016 2016
TARGET FACT
Material CEE onshore growth
on Production Optimization
PRODUCTION1
105-110 112 (110) 1 Higher UK volumes, growth in
Mboepd low-cost Russia, Pakistan
YoY production growth fully
liquids-driven
Around USD 90mn opex (incl.
UNIT OPEX
6-7 6.6 (6.3)2 G&A) reduction delivered in 2016
USD/boe
Opex declined across the board
NEW
UPSTREAM
PROGRAM ORGANIC Exploration capex down by
CAPEX C. -15-30% -36% 70%+ in 2016
Achieved at the bottom of
FREE CASH the cycle (USD 44/bbl
FLOW POSITIVE USD 268mn Brent in 2016)
Actively seeking to secure new, attractive and low-cost exploration
acreages
Notes: consolidated figures, unless otherwise indicated; FCF/boe is calculated as (EBITDA-CAPEX)/ Consolidated production
(1) Reported Group production now includes „JVs and associates” including ~2.4 mboepd from Pearl Petroleum, while the
original 2016 target did not include production related to Pearl
(2) Reported Opex now includes only „Consolidated subsidiaries”, while the original target was set including Baitex, FED too 70
(now among „JVs and associates”)PRODUCTION TO STABILIZE AT ~110 MBOEPD UNTIL 2019
~10-15 MBOEPD NEEDED TO SUSTAIN PRODUCTION BEYOND 2020
MID-TERM PRODUCTION PROFILE KEY MESSAGES
(MBOEPD)
120
112 ~110-115 Stable contribution from CEE
~110 ~110 New
104 ~10-15 barrels Impact of successful production
required
100 optimization and EOR
Pursue transfer of undeveloped reserves
and EOR opportunities
80
Capturing value from international projects
60
Continue field development in TAL (PAK)
and Baitugan (RUS)
~95-105
Development and infill projects to
40 contribute to production growth in the UK
New barrels (~10-15 mboepd) will be required
20
to at least sustain today’s level of production
0
2015 2016 2017 2018 2019 2020-2021
Rest CEE Production guidance
71
Note: figures include consolidated assets, JVs and associatesE&P DELIVERS SUBSTANTIAL FCF IN 2016-21
WITH MATERIAL FLEXIBILITY ON THE CAPEX SIDE
EBITDA, CAPEX AND FCF EXPECTATIONS (2016-21, USD MN) KEY MESSAGES
Brent @ 60
USD/bbl Next 5Y post-tax free
+USD
Less than 20% of cash-flow shall cover
~750mn
the total Upstream reserve replacement
EBITDA
CAPEX pool is necessary to maintain
Brent @ 50 committed
between 2017-21
today’s production @ 50
USD/bbl
USD/bbl
Next 5Y post-tax free
2,000-2,200 cash-flow shall be
sufficient for 100% reserve
replacement @ 60
USD/bbl
3,500-3,900
1,500-1,700
~600
900-1,100 268
1,200- 1,400
EBITDA CAPEX Simplified Tax & FCF 2016 FCF Total FCF FCF to FCF to
FCF other
1 (post-tax) delivered 2016 - 21 maintainshareholders
production
2017-21 expected 2016 actual
72THE MINIMUM ASPIRATION TO SUSTAIN PRODUCTION
BUT IT HAS TO MAKE ECONOMIC SENSE
PRO-FORMA 2016-21 2P RESERVES EVOLUTION (MMBOE) KEY MESSAGES
514 514 Sustain at least current
100%
RRR level of production to
maintain the integrated
100‐105
business model of MOL
170‐175 Group
Maintain
production
65‐75 Organically this is not
feasible...
...although Norwegian
exploration portfolio
provides upside potential
in the mid-term
2015 YE 2P Production (2016‐ Reserves needed to Reserves needed Reserves after 100% RR
Booked Reserves 2021), divestment maintain ~110 to reach 100% RR
& organic bookings mboepd production
73EXPLORATION AND PRODUCTION OVERVIEW
BALANCING THE PORTFOLIO IN THE MID-TERM IS A
 CHALLENGE
Time to first oil           1-3 years                  4-5 years           5+ years

                                                                                                KEY MESSAGES

                    Pakistan

                                  Hungary                        Hungary    Norway
Exploration
                                  Croatia                                                  Limit ExpEx to nearfield
                                  FED                            Croatia
                                                                                           exploration in CEE and
                                                                                           Pakistan as well as to high-
                                                                                           impact Norway

                                                                                           Limited development
                                                                                           project pipeline
                                                  Croatia
                                                                                           New development projects
                                                                           FED
                                                                                           are required
                                             Baitex
                    Croatia        Baitex                      Pakistan
Development
                                            FED             Hungary          Hungary
                            Pakistan
                            Hungary                                          Croatia
                            UK

                      FED

          2P reserves additions (from exploration projects) &
          Developed reserves increase from current undeveloped 2P (development projects)
                                                                                                                    75
STRICT COST DISCIPLINE TO CONTINUE
CAPEX SPENDING IN THE NEXT 5 YEARS
DIRECT UNIT OPEX (USD/BOE)
(USD BN) 1, 2
2.0-2.2
Exploration ~20%
9
2013-14
average
@ 8.0
USD/bbl
8
Development ~55%
7
6
Other ~25%
Q1 Q2 Q3 Q4 Q1 Q2 Q3 Q4 Q1 Q2 Q3 Q4 Q1 Q2 Q3 Q4 Q1 Q2 Q3 Q4 Q1 Q2 Q3 Q4
2013 2014 2015 2016 2017 2018
(1) Incl. a total USD 800mn ABEX, sustain CAPEX and production intensification expenditures
(2) Exploration CAPEX excludes Norway
76
Note: consolidated figuresCEE: STRONG CASH FLOW, HIGHER ONSHORE PRODUCTION
ON THE BACK OF COMPREHENSIVE PRODUCTION OPTIMIZATION PROGRAM
HUNGARY AND CROATIA (105+156 MMBOE) Production
100
Employed a systematic approach to identify improvement
potential in both surface and subsurface 80
CAGR ex
Production optimization through increased number of well
mboepd
offshore
workovers and well interventions 60
Target maximum transfer of undeveloped reserves with 40 1%
scrutiny on breakeven prices
20
Pursue further EOR opportunities
Extension of exploration capacity in Hungary thanks to recently 0
acquired new licences 2014 2015 2016 2017F 2018F 2019F
Continue nearfield exploration looking for new play concepts Hungary CRO onshore CRO offshore
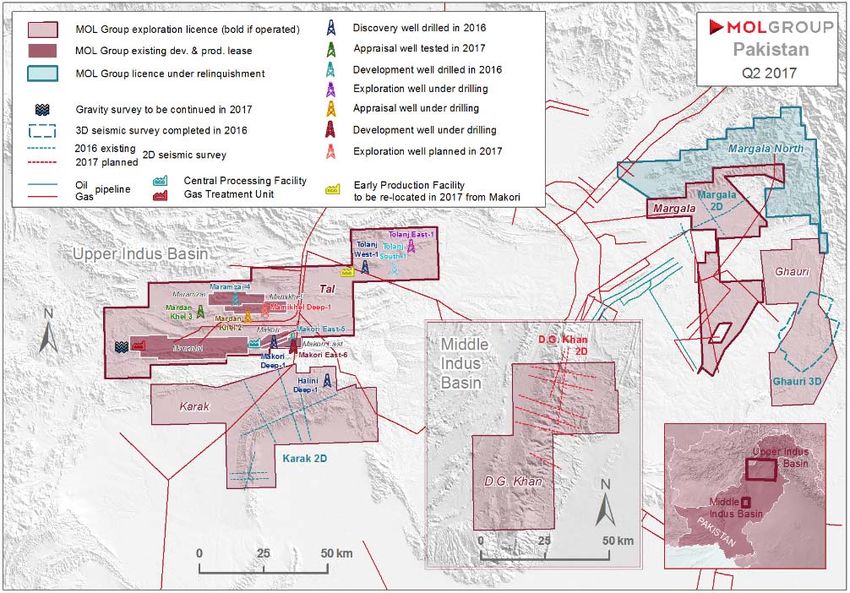
77PAKISTAN: 15+ YEARS OF SUCCESSFUL OPERATION
HIGHLY SUCCESSFUL TAL DEVELOPMENT WITH EXPLORATION IN NEARBY BLOCKS
HIGHLIGHTS AND KEY FOCUS AREAS
(10 MMBOE)
Operator of the TAL block around 80 km from the
border of Afghanistan, where production exceeded 80
mboepd on 100% basis in Q1 2017
13 discoveries (9 operated) since 2000, over 400 MMboe
discovered (@ 100%)
Nr. 1 LPG, Nr. 2 oil and condensate and Nr. 5 natural gas
producer in Pakistan (TAL @ 100%)
Present in 4 blocks (Karak, Ghauri, Margala, DG Khan)
near TAL block in the Upper and Middle Indus area
Production in a growing trend following series of tie-ins
from new discoveries
Stable cash generation
Pursue new licences
OTHER
BLOCK W.I. OPERATOR
PARTNERS
Production Tal 10.53% (expl.) MOL PPL, OGDCL,
8.42% (dev.) POL, GHPL
10
Karak 40% MPCL
8
mboepd
Margala 70% MOL POL (30%)
6
Ghauri 30% MPCL PPL (35%)
4
DG Khan 30% POL
2
0
2014 2015 2016 2017F 2018F 2019F 78CIS: FIELD DEVELOPMENT OF LOW-COST BAITUGAN
WITH STABLE CASH FLOW GENERATION EVEN AT CURRENT OIL PRICES
RUSSIA (50 MMBOE) - Baitugan
A shallow, compact field with developed infrastructure ensures low unit
costs thus stable cash-flow generation
Ongoing intensive development program to be pursued in the future on
Baitugan block to maintain production growth (~20% increase in 2016)
Investigating options to improve the ultimate recovery factor
Wide well-workover campaign and infrastructure development program
started in 2016
KAZAKHSTAN (60 MMBOE)
The drilling of the U-25 well was completed
Lower Tournasian layer was tested for gas and
condensate. Upper Tournasian was fracked and
tested gas and condensate.
Surface engineering works will be carried out at
Rozhkovsky gas condensate discovery in the frame
of Trial Production Project (TPP)
79NORTH SEA, UK: VISIBLE CONTRIBUTION IN 2016
WITH AN ONGOING COMPREHENSIVE VALUE OPTIMIZATION PLAN
NORTH SEA, UK (23 MMBOE)
First oil achieved on Scolty and Crathes in November
2016 ahead of schedule and significantly below budget
Scott: infill drilling which commenced in 2016 will
continue throughout 2017
Catcher:
The 2016 drilling programme was successfully
completed with good operational and subsurface
results for all 6 wells
The 2016 subsea programme was successfully
completed with all major subsea equipment now
installed
5 additional wells, the remaining subsea tie-in
scope and completion of construction activities for
the FPSO are planned for 2017
Production
15
10
mboepd
5
0
2014 2015 2016 2017F 2018F 2019F
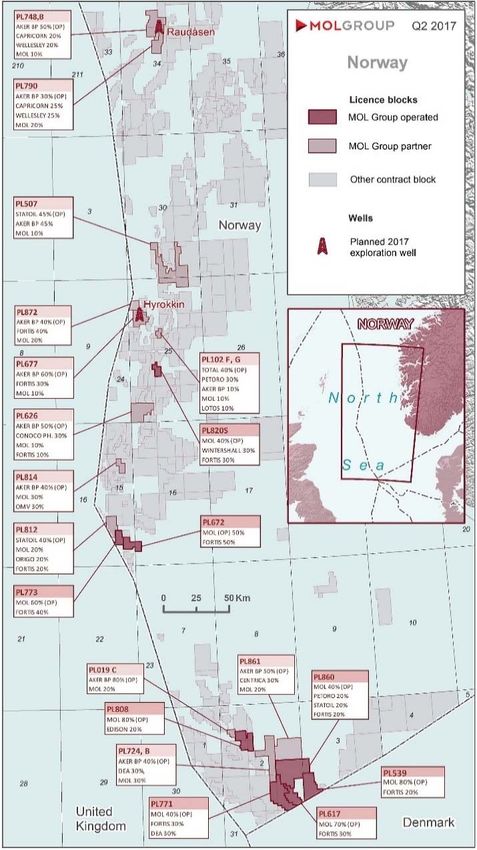
80NORWAY: A NEW EXPLORATION HUB
INCREASING FOOTHOLD IN THE NCS
Entered Norway in 2015, acquiring 100% ownership in
Ithaca Petroleum Norge – a pre-qualified operator
Successfully participated in the 2015 and 2016 APA
licensing rounds and acquired further eight licences
Currently has 20 exploration blocks (8 operated) on
the Norwegian Continental Shelf (NCS)
Key focus to mature prospectivity and high grade the
prospect inventory within core areas of the North Sea
Partnering strategy (sharing risk, financial exposure
and experience with best in class North Sea explorers)
Developing a new offshore exploration hub and centre
of excellence for the Group, building on the
experience of a strong exploration-focused team
3 Core areas are targeted in the North Sea (Central
Graben South, South Viking Graben, Northern North
Sea)
81FINANCIALS, GOVERNANCE, OTHERS
SOURCES AND APPLICATIONS OF CASH

                                 SOURCES AND APPLICATIONS OF CASH, 2012-17 (USD MN)

                                                                180
                                                  ‐549          284

           666                                                                          521
                                     407
                                                                579
                                                                                                                  459
                                                                                        196                                                 950
           205                       270
                                                                                        200
                                                                                                                  202
           456                       420                                                302
2 524                                                                                                             370
                                                                         2 477
                         2 308                                                                                                   2 300      350
           164                                    2 183                                            2 153          111

                                                                1 689

                                     1 211                                              1 258
           1 034                                                                                              1 011                         1 000

    2012                      2013                       2014                    2015                      2016                      2017E

           Clean CCS EBITDA       Organic CAPEX      Inorganic CAPEX    Interests & Taxes       Dividend           (De)leveraging & Other

  EBITDA/CAPEX gap should comfortably cover taxes, cost of funding, rising dividends and
  small-size M&A...
  ...and would also contribute to funding the upcoming transformational projects

                                                                                                                                                    83
STRONG BALANCE SHEET AND LIQUIDITY
DRAWN VERSUS UNDRAWN FACILITIES
AVAILABLE LIQUIDITY (30.06.2017)
(30.06.2017)
USD 3.5bn
3.5
0.3
3.0 0.1
2.5
2.0
1.5 3.0
1.0
0.5
0.0
Undrawn Marketable Cash Total available
facilities securities liquidity
NET DEBT TO EBITDA GEARING (%)
2.5 40
36
35 33
2.0 1.96 31
1.72 30 28
1.66
25 25 24
1.5 1.44 1.38 25
1.31 21 21
20
20
0.97 16
1.0 0.88 15
0.79 0.74 0.75
10
0.5
5
0
2008 2009 2010 2011 2012 2013 2014 2015 2016 Q1 H1 2008 2009 2010 2011 2012 2013 2014 2015 2016 Q1 H1
2017 2017 2017 2017
84AMPLE FINANCIAL HEADROOM
FROM DIVERSIFIED FUNDING SOURCES
AVERAGE MATURITY OF 3.46 YEARS
1,500 Reported cash & cash equivalents Medium term loan Undrawn facilities
Senior Unsecured Bonds Long term loan (multilaterals)
1,000
575
1,275
500 41
464 702 856
467 500
0 21 112 41 22 22 13
Reported 2017 2018 2019 2020 2021 2022 2023
cash&cash
equivalents
MID- AND LONG-TERM COMMITTED FIXED VS FLOATING INTEREST RATE
FUNDING PORTFOLIO PAYMENT OF TOTAL DEBT AS OF 30.06.2017
Other bilateral loans Floating Fixed
2% Syndicated / club loans drawn 100
Multilateral loans 1%
3% 80 41% 34% 41%
Senior unsecured bonds 60
29% 100%
40
59% 66% 59%
20
0
Syndicated / club loans undrawn HUF & Other EUR USD Total
65%
85DOUBLE INVESTMENT GRADE RATING ACHIEVED
TO MAINTAIN CURRENT IG RATINGS AND AIMING FOR AN UPGRADE AT S&P
HISTORICAL FOREIGN LONG TERM FFO ADJUSTED NET LEVERAGE
RATINGS (3Y AVG. 2014-2016)
MOL Fitch MOL S&P MOL Moody's (BBB‐)
1.7
BBB+ Baa1
(A‐) 2
Baa2
BBB
BBB‐ Baa3 (A‐) 2.2
BB+ Ba1
(BBB‐) 2.2
BB Ba2
3.5
(BBB)
0 0.5 1 1.5 2 2.5 3 3.5
Source: www.fitchratings.com, for ENI Spa avg. 2013-2015
Standard & Poor’s revised outlook to positive from stable on MOL’s credit rating (BB+ LT
corporate credit rating affirmed on 20 July)
New Moody’s Baa3 investment grade rating received on 31 March
BBB- (Stable outlook) by Fitch Ratings
MOL’s strong financials are visible even among better rated peers
Note: S&P has been rating MOL since 2005, Fitch since 2010 and Moody’s since March 2017 86You can also read