Strategy Update 2017 Investing in Sustainable Development - London, November 2017 - Norilsk Nickel
←
→
Page content transcription
If your browser does not render page correctly, please read the page content below
Strategy Update 2017
    Investing in Sustainable Development

1
           London, November 2017
Disclaimer
The information contained herein has been prepared using information available to PJSC MMC Norilsk
Nickel (“Norilsk Nickel” or “Nornickel” or “NN”) at the time of preparation of the presentation. External or
other factors may have impacted on the business of Norilsk Nickel and the content of this presentation,
since its preparation. In addition all relevant information about Norilsk Nickel may not be included in this
presentation. No representation or warranty, expressed or implied, is made as to the accuracy,
completeness or reliability of the information.
Any forward looking information herein has been prepared on the basis of a number of assumptions which
may prove to be incorrect. Forward looking statements, by the nature, involve risk and uncertainty and
Norilsk Nickel cautions that actual results may differ materially from those expressed or implied in such
statements. Reference should be made to the most recent Annual Report for a description of major risk
factors. There may be other factors, both known and unknown to Norilsk Nickel, which may have an
impact on its performance. This presentation should not be relied upon as a recommendation or forecast
by Norilsk Nickel, which does not undertake an obligation to release any revision to these statements.
Certain market share information and other statements in this presentation regarding the industry in which
Norilsk Nickel operates and the position of Norilsk Nickel relative to its competitors are based upon
information made publicly available by other metals and mining companies or obtained from trade and
business organizations and associations. Such information and statements have not been verified by any
independent sources, and measures of the financial or operating performance of Norilsk Nickel’s
competitors used in evaluating comparative positions may have been calculated in a different manner to
the corresponding measures employed by Norilsk Nickel.
This presentation does not constitute or form part of any advertisement of securities, any offer or invitation
to sell or issue or any solicitation of any offer to purchase or subscribe for, any shares in Norilsk Nickel, nor
shall it or any part of it nor the fact of its presentation or distribution form the basis of, or be relied on in
connection with, any contract or investment decision.

                                                                                                              2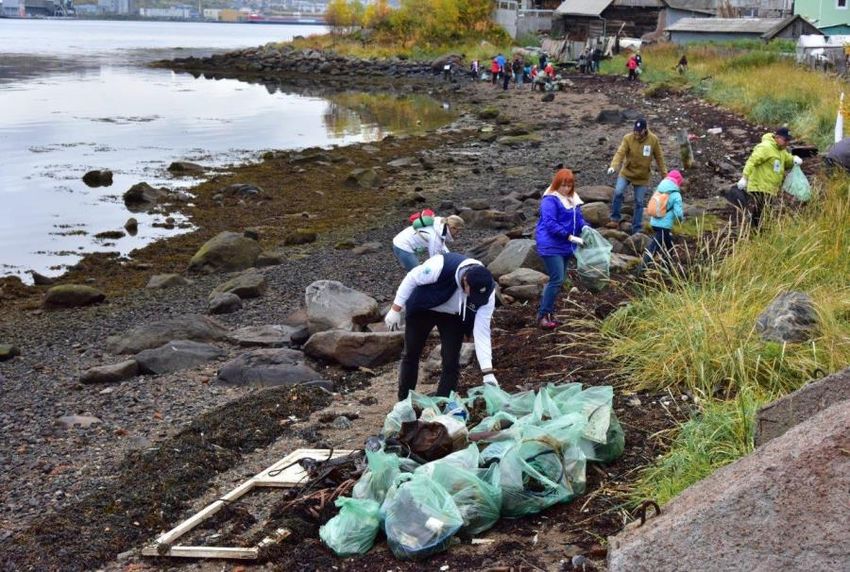
CEO Vision

             Vladimir Potanin
                       President
Chairman of the Management Board
CEO’s Strategic Goals
…Become greener and help others to get greener
In
…Enter into a new investment cycle to ensure
2018-2022
sustainable development and create a platform
Nornickel
for growth
will…
…Continue creating long-term value for the shareholders
4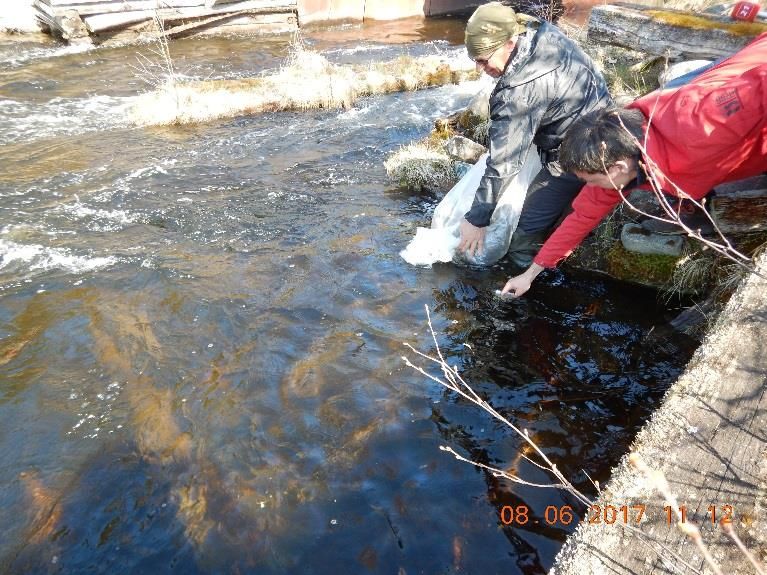
Aspiration for “Green” Nornickel
Improving environmental footprint in Russia… …while supporting enhanced environmental
conditions globally
Polar Division
Kola Division
Russia Ni, Сu,
Со
Emissions to be reduced
by up to 50% at the
border with Norway Providing critical
metals to the growing
electric vehicles (EV)
Comprehensive environmental programme
industry
for the Norilsk Industrial Area
Completed Downstream reconfiguration which enabled the
shutdown of outdated production facilities, thereby reducing SO2
emissions in the residential area by 30–35%
Comprehensive sulphur capturing programme at Nadezhda and Pt, Pd
Copper smelters to be implemented by 2023
Total SO2 emissions in Norilsk area
Supplying critical
-75%
metals to the auto
catalyst producers
2015 2023 target
Source: LMC Automotive
5
Launch of a New Investment Cycle to Ensure
Long-Term Sustainable Development
Capital investments, 2013–2020 New investment cycle priorities
USD bn per year
Unprecedented environmental
programme
Optional growth Implementation of SO2 capturing
projects
technologies and reconfiguration of
the copper production chain
2.0-2.5
Environmental
projects and launch Fixed asset modernization cycle
of a new asset 0.5-1.0
modernization cycle Comprehensive infrastructure
modernization
Full-scale implementation of
equipment replacement strategies
1.5 1.5
Opportunities for growth after 2022
Increase in operational efficiency
Focus on Talnakh deposit
Annual average Forecast for development
in 2013-2017 2018-2020 Preparation of potential growth
(excl. Chita opportunities
Copper Project)
6
Ensuring High Shareholder Returns
                             2013–2017E                                                                            …
                                                                                                             2018E–2022E
  In terms of shareholder returns, Nornickel                                                   Assuming dividends at the floor level
    leads the industry by a wide margin…                                                    (USD 1 bn) Nornickel’s dividend yield is still
                                                                                             expected to exceed the industry average1
                           TSR, 2013–2017 YTD, %                                             2018–2022, %
              60

                                          26

                                                                                                                                       5.6

                                                                     -32
                                                                                                                            3.3
…with a dividend yield four times higher than
           the industry average *
                                                                                                              3.5–4.0
             Average dividend yield, 2013–2017 YTD, %
                                                                                                     0.5
            10.6

                                                                                                 Industry   Nornickel’s   Industry   Industry
                                                                     х4
                                         5.0                                                     Minimum     dividend     average    maximum
                                                                     2.5                                       floor

                                    Industry's             Industry average
                                    next best

 Note: 1. Based on the sample of 16 diversified, copper and PGM companies; 2017-2022 Consensus forecast
                                                                                                                                                7
Operations
and Projects Update

    Sergey Dyachenko
        First Vice-President
     Chief Operating Officer
Health & Safety: Improved Safety Records
Assessment of occupational safety culture score
LTIFR reduced by almost 60% since 2013 improved almost 80% since 2013
1*10-6 Bradley Curve indicator, DuPont Assessment
-58% +79%
0.80
2.5
2.3
0.62 2.1
0.48
1.4
0.33 0.34
2013 2014 2015 2016 1H 2017 March ’14 March ’15 Dec ’15 Nov ’16
LTIFR remains below the global mining industry average Improvements in safety culture are driven by the
implementation of risk mitigation standards, a safety
Company committed to create a strong safety culture at
communication campaign and dedicated risk mitigation
all levels of the organization
programmes
Company continues to focus on personnel and process
safety across all operations
Strategic Objectives:
1 Zero-fatality on production sites
2 Continuous improvement of LTIFR
9
Comprehensive Environmental Program
                                 Polar Division                                                         Kola MMC

                 Total SO2 emissions in the Norilsk Industrial Area                           Total SO2 emissions in Nickel town
                                    -75%
                                                                                                        Up to -50%

                        2015                 2023 target                                        2015                2019 target

  Phase I: 2013–2016                        Phase II: 2017–2022                           2017–2019

Talnakh Concentrator, Stage 2              Nadezhda Smelter                             Smelting shop in Nickel town

                                                     1• Comprehensive sulphur
                                                        capturing solution
         Downstream reconfiguration                                                             Reduction of smelting operations at the
                                                     •2 Construction of new
         completed                                      converters (replacing                   Norwegian border
                                                        converting operations at
Nickel Smelter                                          Copper Smelter)

                                           Copper Smelter
         Nickel Smelter shut down
                                                    •3 Expansion / upgrade project at
                                                       the Sulphur production
                                                       facilities

         Emissions reduced
30-35 in the residential area of Norilsk
 %
                                             $        CAPEX:
                                                      up to USD 2.5 bn                    $       CAPEX:
                                                                                                  USD 60–70 mln

                                                                                                                                      10
Configuration of Polar Division's Environmental Program
at Phase II: Three Key Projects
Key emission reduction projects at Nadezhda and Copper Smelters Investment optimization
Nadezhda Copper 3 2018–2022, USD bn
Smelter Smelter
Smelting
-30%
1 New
Converting Expansion and
SO2 upgrade of the
existing
Sulphur
Comprehensive SO2 production ~3.5
capturing project facilities
up to
2.5
2 New
Electrolysis
Initial technical Approved
solution2 projects
Limestone Sulphuric acid Gypsum Cu cathodes
production1 neutralisation stockpiling
1 SO2 capturing project - production of sulphuric acid and neutralisation with limestone1 2023
2 Transfer of converting operations from Copper to Nadezhda Smelter 2023
3 Reconstruction and expansion of the elementary Sulphur production facilities 2023
Notes: 1. As part of the project, the Company plans to expand its limestone production capacities; 2. The 2010-2012 technical solution envisaged construction of a
sulphur capturing and elementary sulphur production facility at Nadezhda Metallurgical Plant (see the next slide), implementation of a similar project at Copper Smelter,
and plans to set up a continuous copper matte converting facility at Copper Plant. 11SO2 Utilization Project at Nadezhda Smelter:
Sulphuric Acid Production and Neutralisation
$
Technology Risks CAPEX Status Launch
Initial project:
elementary USD bn Project design
sulphur completed
production SO2 capturing Detailed
and production Unique engineering 2023
of elementary technology developed by
sulphur involves high SNC-
operational risks 2.1–2.2 Lavalin Inc.
SO2
Nadezhda -30–35% Feasibility
Smelter study
SO2 capturing,
completed
production of The
technology is 1.4–1.5 Investments 2023
sulphuric acid
Approved project: and its widely used into the
sulphuric acid neutralisation globally, design phase
production and with limestone including approved
neutralisation Russia
12Emissions Reduction in Nickel Town (Kola MMC):
Separation and Sales of Low-Grade Concentrate
Current and prospective designs of production flows at Kola MMC Environmental impact
Total SO2 emissions
in Nickel town, Mtpa
Concentration Smelting Sales
Up to 50%
Production of high-grade
Current Production of bulk matte
concentrate
Furnaces:
Production of saleable
Ore from
metals Metal Sales
Kola mines ~ 80
at Severonickel
up to
40
Production
Production of high-grade
High-grade matte
concentrate
Prospective
Reduced volumes for smelting Furnaces:
will result in lower emissions 2015 2019 target
in Nickel town
Sales
Low-grade of low-grade
concentrate concentrate
13Strategic Roadmap of Key Production Assets Development
Roadmap to advanced, highly efficient and
environmentally friendly production processes
Kola
MMC
2018
By 2022
Smelting Shop
Optimisation of the
Smelting shop's Polar Division Potential further Talnakh
Severonickel Concentrator Upgrade,
operations to reduce SO2
emissions Stage 3 (+8 Mtpa)
Completed
Reconfiguration program
2019 in Norilsk completed By 2022-2024
in 2017
Potential development of
Upgrade and expansion
the South Cluster (growth
of nickel refining capacity
2017–2022
option)
Intensive development of
Talnakh ore reserves
Chita
project Hot commissioning
2023
Implementation of
the comprehensive Construction
environmental completion
programme
14Status of Key Upstream Projects
Ore mining at the Talnakh cluster Highlights
Ore, Mt
Talnakh brownfields under construction
Skalisty mine ramp-up
Ore mining without additional investments
15.4 15.4 The investment programme ensures
14.5 stable ore output in the mid-term
1.8 1.8
Skalistaya 1.0
mine 2.3 The ramp-up of the Skalisty mine should
help to maintain metal grades in the ore
Total investment in the development of
Talnakh 13.5 13.7 Talnakh's upstream projects is
excluding 11.3 forecasted to be up to USD 1.5 bn
Skalistaya in 2018–2020
mine
2014 2017 2020
Ore mining at Zapolyarny mine (South cluster)
Ore, Mt
2.7
In the base case scenario, production at the
1.5 1.6 Zapolyarny mine will decrease to current
0.4 1.2
underground mining volumes
1.2 1.2 1.2
2014 2017 2020
Карьер Заполярный
Zapolyarny open pit Шахта Заполярная
Zapolyarnaya underground mine
15Skalisty Mine: Project Development on Track
Project Highlights
Project overview
Production capacity – 2.4 Mtpa
Ore reserves – 58 Mt
Project IRR (as of 01.2013) – 29%
CapEx 2013–2016: USD 881 mln
CapEx 2017–2020: ~ USD 1.0 bn
Project timeline
Commissioned mining capacity – 300 Ktpa in
2016-2017
Total mining capacity 1.75 Mtpa in 2017
Next launch – 400 Ktpa in 2018
Completion of ventilation shaft #10 in 2018
Completion of main shaft in 2019
Project update
Progress in 2016-2017:
1.328 m Shaft sinking Drifting
7.654 m
16Downstream Reconfiguration Program
Nickel Smelter shutdown Upgrade and expansion of Upgrade and expansion of
Nadezhda Smelter Talnakh Concentrator
Result: Result: Result:
Reduction of SO2 Increase in capacity, Mt Increase in capacity, Mt
emissions in the 10.2
7.5
Norilsk residential area +26%
Ni-Po conc upgrade,
Ni content (%)
2.4
30–35% 1.9
5.8 9.5
2015 2018 2015 2018
Completed Completed Completed
Upgrade of Nickel Refinery
at Kola MMC Impact of reconfiguration on EBITDA
Kola MMC and NN Polar Division
Harjavalta
2018: circa USD 100 mln as a result
of increased total recovery rates of base
Kola MMC
metals and a shorter production cycle
Positive EBITDA impact to be
enhanced through the Comprehensive
Finland
Efficiency Improvement Programme and
once final production footprint is
Implementation of a new chlorine NN Harjavalta
Russia achieved
leaching technology
Expansion of nickel refining The increased recovery rates are
capacity from 165 Ktpa to reflected in the production
190 Ktpa guidance1 for 2018–2020
In progress
Note: 1. Reconfiguration will contribute to maintaining stable base metals production levels to offset the reduction of secondary feedstock and
decreasing production at Zapolyarny mine
17Upgrade of Kola Nickel Refinery
Kola MMC
Project status Next steps
Pechenganickel
Construction works are underway Completion of infrastructure
at all facilities development
42 cells based on the new chlorine Phased capacity commissioning
leaching technology have been in 2018
installed Reaching design capacity and
Murmansk
Construction progress: ~40% parameters in 2019
completed
Projected impact
Nickel refining capacity at Kola MMC, Kt Increase in nickel recovery
Tankhouse 1 Tankhouse 2 from high-grade matte by
over 1.0%
+15.2%
Optimisation of the work-in-
190
165
45
progress inventory levels
45
CAPEX (full project)
Severonickel Plant, 120 145
Monchegorsk
circa USD 300–350 mln
2016 2020
18Bystrinsky (Chita Copper) Project
Project overview
Hot commissioning started
(completion planned for 1H 2018)
Ore reserves: 341 Mt, grades: Cu – circa 0.7%; Fe – circa 21%; Au – circa 0.9 g/t
Site infrastructure: open pit, concentrator (grinding and flotation), camp, etc.
External infrastructure:
234 km of 220 kV power lines 223 km railway to the site constructed
constructed (public–private partnership)
Project highlights
USD bn
Annual production volumes 2018 2021+
CAPEX ~1.7
Ore Mt 6-7 10
Cu (in concentrate) Kt 35-40 ~70-75 EBITDA’20+ 0.4–0.5
Au (in concentrate) Koz 180-200 ~250-260
Fe (magnetite concentrate) Kt 1 400-1 600 ~ 2 900 Cash cost 0.3-0.4
Key corporate development milestones
Sale of a 13.3% stake to a Sale of a 36.6% stake to Potential IPO
consortium of Chinese investors CIS NRF Holdings Limited considered
(closed) (closed)
19Pipeline of Perspective Growth Projects
Map of potential growth opportunities post 2022
Talnakh Baimskaya project
Capacity expansion projects Potential to become
Status: Tier-1 Copper asset
Comprehensive feasibility Status:
studies / strategic mine plans Pre-feasibility study
development in progress completed
South Cluster
Potentially, a Top-5 PGM
Norilsk producer in 6–7 years
Status:
Feasibility study in
progress
Maslovskoye Field Dialogue on potential
cooperation /
Potentially, the largest
coordination with other
greenfield PGM asset
license holders in the
Status: region
Pre-feasibility study
completed
Norilsk Nickel also continues broader screening of potential greenfield opportunities that fit its strategic criteria
The Company will leverage its experience with Bystrinskiy project in the pursuit of potential opportunities
Producing asset Greenfield asset
20Growth Opportunities:
South Cluster and Upgrade of Talnakh Concentrator, Phase 3
Geography Growth opportunities Status
Talnakh Concentrator, Phase 3
More efficient enrichment technologies Feasibility study underway
Talnakh for low-grade ores – yielding potentially (to be completed in 1H 2018)
Concentrator higher recoveries (compared with Norilsk
Concentrator)
Talnakh Ore Cluster
Implementation of these technologies at
Norilsk Concentrator is impossible
without total overhaul of existing
facilities
Lebyazhye tailing dam
Potential optimisation of transportation
costs
Copper Smelter’s slags
South Cluster
Potential to become a Top-5 PGM Geological data updated
Norilsk
producer globally based on a
significant reserve base Final investment decision to be
considered in 1H 2018
Norilsk Efficient capacity utilization of
Concentrator Norilsk Concentrator (after The licence has been transferred to
completion of Phase 3 at Talnakh a standalone legal entity within
Zapolyarny mine Concentrator) Nornickel’s perimeter to expand
potential funding opportunities
South Cluster
21Infrastructure Renewal Cycle: 2018–2022
Replacement programs for key production equipment:
Replacement of key equipment categories yielding positive
Gas transportation system impact on overall equipment efficiency
(705 km of pipelines to be replaced) Upgrade of mine support systems targeting further
Execution of modernization strategy that earlier improvement of HSE performance
allowed to optimize CAPEX in 2014–2017
(based on revised technological solutions)
Bolshoi Leontievsky Limestone
Island production
Power
plant 2
Power
Port
plant 3
Pelyatkinskoye field Dudinka
Norilsk
Severo-Soleninskoye field Gas pipeline
Fuel storages
Airport
Messoyakhskoye Logistics infrastructure: Power
field Reconstruction of critical facilities (ports, fuel
Yuzhno- plant 1
storages and supply infrastructure etc.)
Soleninskoye field
Power line
Power supply:
Utilities: Gradual replacement of retiring power units
Comprehensive programmes to replace / (550 MW)
modernize power lines (30 km), gas Ust-Khantayskaya hydro
distribution networks (111 km), clean water power plant
supply system in Dudinka, etc.
Kureyskaya hydro power Auxiliary production:
plant Supply of necessary materials
(e.g. the limestone pit)
Bolshaya Kheta River
22CAPEX Program 2013-2020
USD bn
Optional (growth) projects
Commercial projects (including Chita project)
Stay-in-business (including Environmental program)
2.3-2.5
1.9 2.0 2.0 0.6-0.8
up to 0.1
1.7 1.7
1.0 1.3 1.2 1.1-1.2
1.1 1.0
0.7
1.6-1.8
1.0
0.7 0.8 0.8-0.9
0.6 0.6
2013 2014 2015 2016 2017 2018 Average
(forecast) (forecast) 2019-2020
(forecast)
2017: Key construction 2018: Final payments for Bystrinsky; 2019+: launch of Sulphur project
phase of Bystrinskiy completion of major facilities construction, intensification of infrastructure
(Chita) project construction at Skalisty as well as modernization and equipment replacement
Komsomolsky and Taimyrskiy mines programs (renewal cycle)
232018 Investment Plan – USD 2 bn
USD mln
Preparation of optional
Design and engineering surveys
projects
Environmental Growth
(growth) projects
Up to 100 (Talnakh expansion projects,3rd Pre-payment for equipment with long lead time (subject to
stage of Talnach concentrator
upgrade, South Cluster) investment approval by the end of 2018)
1.8-2.0
program
Detailed engineering study, engineering surveys and site
100–150 Environmental program preparations for Sulphur projects
Contracting for Sulphur project at Copper Smelter
1.7-1.9 Chita project Construction completion / final payments
150-200
Reconfiguration Kola Refinery upgrade / expansion project
200-250
Base investment program
Upstream projects to maintain metals production level
Mining projects Completion of major facilities at Skalisty, Komsomolskiy and
400-500
Taimyrskiy mines
120-170 Efficiency Improvement
IT, automation, R&D, equipment efficiency improvement
programs and initiatives
250-290
Maintenance of Reconstruction / modernization of infrastructure (energy,
Infrastructure Assets logistics, social etc.)
Maintenance of existing production facilities (replacement
400-450 Maintenance of
of equipment, compliance with regulatory requirements,
Production Assets
etc.)
2018 Plan
242019-2020 Investment Plan –
USD 2.3-2.5 bn Including Environmental Program
USD mln pa
Potential execution of
growth projects (Talnakh Investment decisions are scheduled in 2018-2019
projects
Assessment
Growth
expansion projects, 3rd stage subject to IRR passing the threshold level
in progress
of Talnakh concentrator Potential investment cycle of 3 to 5 years
upgrade, South Cluster)
2.3 – 2.5
Environmental
Construction phase for all projects;
program
peak of investments is expected in 2020
550–800 Environmental program
Remaining 2021-2022 CAPEX is expected at the level of
USD 1.0-1.2 bn
1.6 – 1.8 Completion of current reconfiguration program
80-100 Reconfiguration
Start of a new reconfiguration program at Kola Division
400-500 Mining projects Upstream projects to maintain metals production level
Base investment program
Efficiency Improvement
IT, automation, R&D, equipment efficiency improvement
100–150 programs and initiatives
Investments in infrastructure – up 50-60% vs. 2018
Renewal / modernization Major renovation of infrastructure facilities: replacement of
400-450 of Infrastructure Assets power units, gas pipelines, electric networks, reconstruction
of fuel storages, etc.
Maintenance and
Investments growth of 30-40% vs. 2018 due to full-scale
550-600 upgrade of
replacement of key equipment categories
Production Assets
Average annual
CAPEX in 2019-2020
25Production Guidance1
Ni Pt+Pd
Kt tonnes
206–211 210–215 97 100–105 100–105
197
2016 2017 2018-2020 2016 2017 2018-2020
Excluding Bystrinsky project
Cu Stable Ni and PGM output
Kt 400–420
377–387 Increase of copper production due to
344 processing of secondary feedstock
(concentrate) and expected higher Cu grade
in ore
2016 2017 2018-2020
Note: 1. Metals produced from own feedstock
26Finance and IT strategy:
Focus on Efficiency
Sergey Malyshev
Senior Vice-President
Chief Financial OfficerManagement of Operating Cash Costs
Operating cash costs growth net of macroeconomic
1H2017 Cash cost breakdown factors: in line with domestic inflation
USD mln
YoY change %
1,564 +6%
100%
1,473
Other 16% 272 Other +10%
247
Services 5% 84 Services +1%
83
Materials and
19% Materials
supplies 329 +21%
273 and supplies
Metals and Metals and
19% 219 192 -12%
semi-products semi-products
Labour 41% 651 687 Labour +6%
1H 2017 1H 2016 1H 2017
adjusted by FX and adjusted by metal purchases
metal purchases
28Comprehensive OPEX Reduction Programme
Norilsk nickel comprehensive cost reduction ecosystem
Annual cost reduction by USD 200-300mln from 2020
Launch a unit cost optimization and productivity improvement
programme
Employ best international practices, including employment
of leading experts and personnel training
Program foundation
Reconfigure and shut down Implement industrial
Modernise production assets
outdated capacities automation systems
Develop and implement new Implement ERP systems / Implement new managerial
processes and standards automated control systems approaches
29Upgraded IT Infrastructure Provides a Platform for
Higher Operating Efficiency
1 2 3 Underground radio and positioning
SAP ERP roll-out New data centre platform system
Pilot project completed Server infrastructure and data 369km of optical cable
Roll-out for Chita and Polar storage facilities fully upgraded to
meet company demands 1 052 Wi-Fi access points
Division planned for 2017
and 2018 respectively Enterprise data network modernised Real-time control of mine personnel
and machinery
1
5 Talnakh
Monchegorsk
Norilsk
Norilsk 2
1 5 3
Moscow
4
Novy Urengoy
Saratov
5 4
MES layer High-speed fiber cable to Norilsk
Dispatching system pilot project in active phase in 956km of cable commissioned at 40
Norilsk Gbit/s
3D mine design and planning pilot project completed Extremely challenging tundra climate
for 1 mine, now rolled out onto other mines Enables the use of modern IT
Metall Accounting pilot project completed for solutions
Talnakh concentrator, now rolled out onto other Improved quality of life for residents
plants and mines of Norilsk
30Improvement of the Efficiency of Maintenance
Operations is One of the Key Elements
Examples of asset segmentation and strategies:
Segmentation of
assets and selection
‒ Highly critical - scheduled periodic maintenance
of appropriate ‒ Critical - scheduled maintenance with condition
monitoring
maintenance Target result
‒ Average critical - condition-based maintenance
strategy
‒ Non-critical - run-to-failure maintenance
Based on simulation, check equipment load
up to 15%
Balanced assets
levels against maintenance practices and
portfolio maintenance OPEX
optimize equipment utilization
reduction
Optimize Update and verify M&R standards, including labour
maintenance timing intensity and duration of maintenance operations
and budgets Draw up detailed unit-by-unit maintenance planning
maps
Integrate maintenance with short-term scheduling and 70%
Implementation of reporting Unscheduled
short-term
Allocate personnel to maintenance jobs outage reduction
scheduling and
mobile solutions Tracking equipment status and maintenance workers’
performance in real-time
Implement proactive Plan maintenance/ asset management based on the
approach based on monitoring system, data related to outages and their
IT solutions causes, utilization etc.
31Major Initiative Case Study:
Integration of Simulation Technology
Input data Real-time analysis of production volume increase options
1 2
3D ore mining Reduce haulage Reduce shift change
model using distance? break time?
MicroMine 3
Send LHD #5 for
maintenance?
Dynamic
Simulation
mine model based
Mine plan based on AnyLogic
on software 4
MineSched ? Bottleneck?
7
Adjust operating
mode?
6 5
Is the route Should the speed be
Detailed
optimal? increased?
information,
in particular on
equipment for
6 mines Control Cost reduction
Execution of detailed KPIs Due to optimized utilization of the
(speed, cycle time etc.) company’s resources
32Shared Services Centre to Drive Down G&A Costs
Support functions (Accounting,
Treasury, HR, IT) to be moved
from the Group companies to
Approach a the Shared Services Centre
(SSC)
Main SSC hub established in
the city of Saratov
SSC launched in 2015,
personnel of HQ and a number
Results of production sites transferred
in 2017
achieved
“Best SSC launch in Russia” 1ST
award received
Cost-cutting target: USD 40 mln per annum
50% cost saving for support functions
30% headcount reduction
33Efficiency Case Study: Property Insurance
Property insurance costs Comments
RUB mln
-46%
1,575 The company has achieved a twofold decrease in its
insurance premium in the last 2 years and a cost saving
of RUB 814mln (USD 14mln) per annum while
maintaining the same terms of coverage
-11%
858 Premiums fell on the back of improved placement
761 strategy and in-depth presentation of Nornickel risk
to insurance markets
2017 premium savings of 11% achieved despite shaky
insurance markets following hurricanes in the US
2015 2016 2017
Insurance coverage in line with standards for global diversified miners
Risks fully placed with global reinsurers rated A- or higher
34Cost of Financing Optimization
Secondary Eurobond yield curve Comments
Yield, %
7%
YE In 2017 the Company took advantage of the favourable
6% 2015 debt capital markets and successfully placed two
Eurobonds with a discount to its secondary yield curve
5%
Successful placements allowed Nornickel to revisit pricing
terms of the bank debt and trade finance instruments
4% YE
2017 in the Company’s portfolio
3%
2%
0 1 2 3 4 5 6 7 8
Maturity, years
Interest cost saving effect,
Action Details
per annum
Repricing of bilateral credit lines Decrease in interest rates and maturity extension of bilateral credit lines USD 41mln
Corporate financial guarantee for the amount of USD 800mln issued in favor of
Issue of guarantee USD 22mln
Sberbank to secure debt of GRK Bystrinskoye
Decrease the share of ruble-
Two Eurobonds proceeds partially used to prepay ruble debt (RUB 60bn) USD 60mln
denominated debt
Replacement of advance payments Repayment of advance payments from BASF and Societe Generale in the total
USD 12mln
with short-term debt amount of USD 650mln
Total annual interest cost savings USD 135mln
35Debt Portfolio Optimization
Average cost of debt Optimised debt repayment profile
% USD bn
-0.4ppt
5.3% YE 2016
5.1% 5.1% 1.9
5.0% YE 2017 1
4.7%
1.7 1.7
1.6 1.6
Average cost 1.5
of credit portfolio
1.2 1.2
1.0
+0.6ppt 0.8
1.6% 0.6
1.3% 1.4%
1.2%
1.0%
Libor 3m
0.2 0.2
4Q 1Q 2Q 3Q 4Q 2017 2018 2019 2020 2021 2022 2023
2016 2017 2017 2017 2017 1
As a result of various debt optimization activities the In 2017 the Company extended maturities of debt
Company lowered its average cost of debt by 0.53% portfolio and substantially decreased debt repayments
in 2017 despite the LIBOR increasing by 0.40% during in 2018-2019
the same period
Note: 1. Estimate
36Net Working Capital Outlook
USD mln
One-off factors
3,018 ~ USD 1,300mln
100 ~2,100
320
720
1,087
240 170 ~1,000
798
240 -56 -69
443
2013 2014-2015 YE 2016 Change Reclas- Decrease in Other YE 2017 Payment Optimization Palladium Temporary YE 2017 2018+
in metal -sification of materials normalized to Rostec of capital stockpile increase in
inventories metal semi- structure to ensure income tax
-products security receivables
of supply
The increase in working capital up to USD 2.1bn during 2017 is temporary and is caused by one-off
factors and revision of trade finance deals
The Company expects a return to the 2014-2015 average level of around USD 1.0bn
37Financial Model Going Forward
Net Debt / EBITDA
3.0x
Leverage increase will be capped by:
- Working capital release
- Lower dividend payout in accordance
2.5x with dividend target formula
- Capex management
Possible range = 1.5х-2.5х
2.0x
depending on metals prices Expected
range
1.5x
In case of improved market environment,
dividend payouts will stay at 60% EBITDA,
1.0x allowing the company to maintain efficient
capital structure
0.5x
0.0x
2013 2014 2015 2016 2017 2018 2019
38Norilsk Credit Ratings:
Credit Metrics at Investment Grade Level
S&P Global Moody's Fitch Ratings
9.50+ +
9.50 9.50+
BBB Baa BBB
9.00S 9.00S 9.00S
+ 1 +
8.50- 8.50- 8.50-
8.00+ +
8.00 8.00+
Baa
BBB7.50S 7.50S BBB7.50S
2
7.00- 7.00- 7.00-
6.50+ +
6.50 6.50+
BBB Baa BBB
6.00S 6.00S 6.00S
- 3 -
5.50- 5.50- 5.50-
5.00+ +
5.00 5.00+
BB+4.50S Ba14.50S BB+4.50S
4.00- 4.00- 4.00-
3.50+ NN: BBB- / outlook Stable +
3.50 NN: Bа1 / outlook Stable 3.50+ NN: BBB- / outlook Stable
BB 3.00S Russia: BB+ / outlook Positive Ba23.00S Russia: Bа1 / outlook Stable BB 3.00S Russia: BBB- / outlook Positive
2.50- 2.50- 2.50-
2007
2012
2007
2012
2004
2005
2006
2008
2009
2010
2011
2013
2014
2015
2016
2017
2004
2005
2006
2008
2009
2010
2011
2013
2014
2015
2016
2017
2007
2012
2004
2005
2006
2008
2009
2010
2011
2013
2014
2015
2016
2017
BBB- / outlook Stable Bа1 / outlook Stable BBB- / outlook Stable
On October 27, 2017 S&P Global Ratings On February 21, 2017 Moody’s revised its On October 18, 2017 Fitch Ratings affirmed
revised its outlook on the Company’s rating outlook to Stable from Negative and affirmed Nornickel credit rating at “BBB-” with Stable
to Stable from Negative and affirmed “BBB-” “Ba1” corporate credit rating of Nornickel, Outlook
corporate credit rating following the change in the outlook for
Fitch estimates the Company's stand-alone
Russia's government bond rating
Nornickel’s corporate credit rating is one credit rating at “BBB+” and applies a two-
notch above the sovereign rating reflecting Fundamentally, Moody’s are of the opinion notch discount to account for political,
S&P view that the Company’s profile is that stand-alone credit quality of the business and regulatory risks in Russia
supported by its leading positions in global Company exceeds the Ba1 rating criteria but
metal markets the rating remains constrained by Russia’s
sovereign rating
39Sensitivities to USD/RUB Exchange Rate
At the USD/RUB rate of 59.1, 1% change in exchange rate translates into:
EBITDA change of USD 36mln, FCF of USD 56mln
USD mln 80 exchange rate
65.4 as at 30.06.2017
59.5
60
56.0
50.3
46.7 Free Cash Flow
41.9
38.1 36.1
40 32.2 29.9 EBITDA
20
0
50.0 55.0 59.1 65.0 70.0 USD/RUB
Currency break up of OPEX Currency break up of CAPEX
Non-RUB 25% 15% 22%
Non-RUB 28%
RUB 75% 85% 78%
RUB 72%
1H 2016 1H 2017 1H 2016 1H 2017
40Markets Update
Anton Berlin
Head of Strategic MarketingMetals Markets Outlook
Metal Ni Pd Pt Cu
Kt -92 Moz Moz Kt +150
-2.51 +0.11
Non-exchange
Other elastic Other
Stocks, days of
Other Non-exchange
consumption 89
Exchange 77 non-elastic 112 124
ETF Exchange 9
ETF 84 55 112 124 8
Jan-16 Dec-17 Jan-16 Dec-17 Jan-16 Dec-17 Jan-16 Dec-17
Deficit Deficit(2) Balanced(2) Balanced
Kt Moz Moz Kt
Market 240
Balance (2)
(14) (0.1)
(0.4) (0.2)
Forecast
(1.2) (0.5) (90) (100)
(90) (1.8)
2016 2017E 2018E 2016 2017E 2018E 2016 2017E 2018E 2016 2017E 2018E
Medium-term
Fundamentals
Long-term
Fundamentals
Source: Company data
Note: 1. Change in ETFs in January’16 – October’17, 2. Including ETFs, investment demand and industry stocks movement
42Nickel Market Short-Term Outlook
Nickel Market: Deficit Expected to Reduce in 2018 Ni Supply: Increase Driven by Return of Indonesia
Due to Production Growth in Indonesia and the to Ore Export Markets and Philippines Recovery
Philippines
Kt Kt
+11%
14 6
34
-2 88
-14 kt
+1%
114 2,251
228
2,004 2,023
19
2016 2017E China NPI Indonesia Fe-Ni Refined Other 2018E
-90
NPI Ni
107
Deficit Deficit
Strong Growth of Ni Demand in Stainless Steel
152
Expected in 2018E in Indonesia and China
Kt +7%
22 8
+5% 84
39
2,265
2,112
Balance Demand Supply Balance Demand Supply Balance 2,005
2016 2017E 2018
2016 2017 China STS Other Asia Batteries Other 2018E
STS Asia
Source: Company data
43Rising Ore Supplies from the Philippines and Indonesia
Nickel Ore Supply to China Recovering NPI Supply from China & Indonesia
in 2017 Expected to Grow
Ore, Mln (wmt) Y-o-Y Ni units, Kt
-33% -26% -9% +8%
71 9%
260
42% 48 173
29 87
35 32 35
76% 508 489 500
386 366 391
100% 100% 85%
2013 2014 2015 2016 9M2017 2013 2014 2015 2016 2017E 2018E
Indonesia Philippines Other China Indonesia
Ni Ore Export from Indonesia Has Resumed: YTD 12 Licenses Have Been Granted
Ore, quota issued, Mln (wmt) Ni unites, quota issued, Kt
20 208
8 78
2017E Total quota
Source: Company data, Chinese customs trade statistics
44Nickel Cost Curve - Limited Price Sensitive Production
Little Supply Rationalization Shown …As Most of High-Cost Producers Not
in 2014-2017 Downturn… Price-Sensitive
USD/t Modified (1) C1 Cost Curve with Real NPI cost Part of diversified
16% miner
23,000
Price sensitive Ni
18,000
30% miner
13,000 54%
Spot average YTD 2017 Ni miner with a
government
8,000 support
… and NPI Cash Cost is in Vicious Circle:
3,000
Ni Ore is Re-priced in Line with Refined
Nickel on LME
-2,000
Norilsk
11% Ni ore
-7,000 3%
5% Coke
-12,000 8% 44% Transportation
0 10% 20% 30% 40% 50% 60% 70% 80% 90% 100%
Diversified miner Government support Coal
Price sensitive producer NPI integrated with STS 29% Electricity
NPI non-integrated
Other
Source: Company data, Wood Mackenzie
Note: 1. Including nickel ore by-product value for NPI and synergy from integration with stainless steel production
45Long-Term Global Nickel Supply:
Growth Driven by Laterite Ores
Laterite Ores Expected to be the Main Underinvestments Impacting Ni Production
Source of New Nickel Units Growth in from Sulphide Ores
Long-Term
Ni units, Kt USD bn Ni units, Kt
Change in Ni production by source of ore 10,000 2012-2017 change % 1000
-7%
587 8,000 800
550
6,000 600
4,000 400
3
2,000 200
46
0 0
2010
2011
2012
2013
2014
2015
2016
2017E
-50
2006-2015 2016-2025E
Laterite Sulphide Sulphides Capex Sulphides production
Source: Company data, Wood Mackenzie
46Production of Battery Grade Nickel
1 Status Quo Product Application
Precursor
HPAL Hydroxide Ni (1) Refinery 40Kt
HPAL Ni Sulphide
Integrated
Ni Refinery 25Kt Cathode Material
Producer
Scrap Ni Refinery 10Kt Ni Sulfate
Copper Stream 20Kt
Heap Leaching 20Kt
130Kt Battery 70Kt
2 Possible/Balancing Option
Li-ion
Briquettes Dissolving
15Kt Other 60Kt
applications:
Cathodes
Platting
Chemicals
Source: Company data 2017
Note: 1. MHP used in batteries production.
47Nickel Feed Status Quo:
Excess Nickel Class 1 Availability
Source of Ore 2016 Production/Consumption Flow
Ni units, Mt Ni units, Mt
Ni Feed Ni Products Ni Consumption
0.1 Batteries
Alloys/Special Steel/
0.5
Cathode/Briqs/ Plating
Suphide Ore 0.8
Special Forms
(Ni 99.9%)
0.9 Class 1 NiLong-Term Nickel Demand Outlook: Base Case Scenario
Suggests Enough Class 1 Feed Until 2022E
Ni units,Kt
500
400
300
200
100
0
-100
-200
-300
-400
Balance NPI/Fe-Ni STS Scrap HPAL Battery HG Ni STS Other Ni Market Current
2017 Scrap/ Supply demand Demand deficits Briqs
Ni from in 2018- Stocks:
Cu batteries 2021E Depletion
streams by 2022E
Source: Company estimates
49Capital Intensity: Higher Ni Prices are Required in the Long
Run to Incentivize Additional Supply After 2023E
Reduction of Capital Intensity and Incentive Indicative Full Cash Costs of NiSO4:
Price Driven by Class2 Projects (NPI) Prohibitive for All But Class 1 Products
Capex, ‘000 USD/t Incentive price, ‘000 USD/t USD/t
2008 2017
25,000
120 30
25K USD/t 20,000
100 25
50K -110K USD/t
80 20
15,000
Class 1
18K USD/t
60 15
10,000
40 10
5,000
20 5K-15K USD/t 5
0 0 0
PAL/HPAL NPI NPI Fe-Ni HPAL MHP Briquettes
conversion
Capex Incentive price Cost of production Cost of conversion
Source: Company data, Wood Mackenzie
50Copper Short-Term Outlook:
Growth of Supply in Line with Consumption
Global Refined Production Will Remain China Remains the Main Driver of Global
Almost Stable in Short-term Copper Consumption Growth in 2017-2018E
Mt Y-o-Y Mt Y-o-Y
28 +1.8
+2%
+1% +2% %
+2% 0.2
21
0.2
0.1
14
0.2 23.2
22.8
7
22.5
0
2014 2015 2016 2017E 2018E 2016 China Other 2017E China Other 2018E
Source: Company data, Bloomberg
51Copper Market Long-Term Outlook:
Risk of Overestimating Demand
Copper Supply: Bottom Up 3Mt to be Added Long-Term Copper Forecasts: Since 2012
by 2025E the Demand Outlook for 2025 Reduced by
6Mt, but Supply Forecast Raised by 3Mt
Mt Mt
New copper production 2017-2025E Change in forecasts of 2017 vs. 2012
3
1.8 -3.0
1.8
2.5
25.9
22.8
-6
2016 New Increase in Probable Production 2025E Demand Supply
projects current projects losss
production
Source: Company data, Wood Mackenzie
52PGM Supply and Demand Balances:
Divergent Fundamentals for Pt and Pd in the Medium-Term
Global Palladium Market: Major Structural Global Platinum Market: Structural Deficit
Deficit to Persist in 2017-2020E Has Evaporated on Weaker Demand
Moz Moz
0.1 0.1
-0.1 -0.1
-0.2 -0.2
-0.4 -0.4
-0.5 -0.5
-1.0
-1.2
-1.5
-1.8
-2.0
-2.3
2013 2014 2015 2016 2017E 2018E 2019E 2020E 2013 2014 2015 2016 2017E 2018E 2019E 2020E
Source: Company data
53Premium of Palladium to Platinum is Sustainable
in the Mid-Term
Palladium Discount to Platinum Has Been … as Platinum Has Been Loosing its Market
Eliminated on Fundamentals… Share in Autocatalysts to Palladium
USD/oz Moz
2,500 12 2010-2016 2017-2020E
+45% +18%
2,000
10 +20% +3%
1,500
8
1,000
6
500
0 4
Oct-07 Oct-09 Oct-11 Oct-13 Oct-15 Oct-17
2010
2011
2012
2013
2014
2015
2016
2018E
2017E
2019E
2020E
Pt Pd Pd automotive demand
Pt automotive and jewellery demand
Pd: Diesel substitution, hybridization, Pt: Substantial time lag >2Y for
China 6 introduction change in technology. Low jewellery
demand in China
Source: Company data
ХХ% Growth for the period 54Why 2017 is Not 2001 For Palladium
Current Palladium Premium to Platinum is
… As Much Has Changed Since 2001
Fundamentally Justified…
USD/oz 2001 2017
2,500
Short-term market Sustained long-term
squeeze, government market deficit
action
2,000 Long-term track
Concerns over Pd
supply from Russia record of reliable
supplies from Russia
1,500
Major Russian
Russian government
government stockpiles
stockpiles depleted
1,000 overhang
Substitution Substitution
500
Pt/Pd ratio 1:2 Pt/Pd ratio >1:1
Thrifting away from Pd- Meeting CO2 2021
intensive gasoline, roll targets: Pd-intensive
0
out of Pt-intensive diesels hybridization is
Nov-90 Nov-99 Nov-08 Nov-17
the only option
Pt Pd Extensive Pd loadings – Optimized loadings –
room for optimization little room for
optimization
Source: Company data
55PGM Global Supply: Limited Growth in the Medium Term
Little Growth Expected in Primary Supply: PGM Capex Rationalization in South Africa
1.3% and 2.0% p.a. of Global Pd and Pt is Not Supportive for Production Growth
Output, Respectively
Koz ZAR bn
Change in production SA producers capital expenditure (1)
2013-2016 2017-2020E
400 2.0%
25
-12 bn
1.3%
300
20
200
15
100
10
0
-100 Downside risk 5
prevails
-200 0
2008 2009 2010 2011 2012 2013 2014 2015 2016
-300
Pt Pd Pt Pd
Russia South Africa Other
ХХ% Annual global output growth 2017E-2020E
Source: Company data
Note: 1. Cumulative capex of Amplats, Impala, Lonmin and Northam
56Recycling Growth Will Not be Able to Balance the Market as
it Lags Behind Pd Demand
Growth of Recycled Palladium Supply to …as Vehicles With High Palladium Loadings
Moderate Considerably… Have Been Mostly Recycled by 2015
CAGR Koz g/vehicle
2,500 6
9%
5
2,000
4
1,500
5%
3
1,000
2
500
1
0 0
2005-2015 2015-2025E
2000
2002
2004
2006
2008
2010
2012
2014
2016
2018E
2020E
Pd Recycling Pd average loading in North America
It Takes 10-12 Years for Vehicles to Come for Recycling
Source: Company estimates;
57Key Auto Trends Impacting Metals Demand
Key Trends Demand Implications
1 Sustainable automotive production growth globally PGM
Pd Pt
2 Diesel substitution by gasoline vehicles in Europe
Pd
3 Growth of hybrid vehicle market share worldwide
4 Growth of SUV market share and increase in engine
PGM
size
PGM
5 Strengthening emissions legislation worldwide
6 Electric vehicles/batteries worldwide Ni PGM
58Legislative Stimulus of Transport Electrification
New Regulations, Especially in China, Push Policy Incentives for the Adoption of Electric
Automakers to Increase PGM Loadings Vehicles and Announced Restrictions on
ICEs (1)
Comparison of NMOG/NMHC+NOx emission requirements in China,
the European Union and the USA during 1990-2025E Country Policy Targets
1.0
Austria, Denmark, Ireland,
No ban on ICE,
Netherlands, Portugal, Spain,
but EV targets set
0.8 Japan, South Korea
NMHC/NMOG+Nox Limits (g/km)
Several states have announced
USA
0.6 transition to BEVs
Ban on ICE cars sales -
China
0.4 deadline to be determined
Ban on ICE car sales might
Germany
0.2 be considered
Ban on ICE cars sales by
Scotland/France/UK
0.0 2032/2040/2040
1990 1997 2004 2011 2018E 2025E
Zero-emission program by
Netherlands/Norway
US EU-gasoline 2025
EU-diesel China-gasoline
+ EU: penalty EUR95/gr for exceeding the limits of
China-diesel 95gr. СО2 /km from 2021 (Limit -30% by 2030)
Source: Company data, ICCT, LMC Automotive, Thomson Reuters, ACEA, Wards-Auto, CAAM
Note: 1. ICE – internal combustion engine;
59Growing Autos Production - Long Term Trend
Global Light Vehicles Production Growth Consensus is Bullish on Long-Term Outlook
Drivers: Hybrids, BEVs+PHEVs and Gasoline of Electric Vehicles Sales, but Estimates Vary
Greatly
Mln units Mln units
92 101 111
12
2 3%
3 10
2 2%
1% 2 10 9% 8m
7 8
6%
2 3%
19
18 19 6
5m
4m
4
2m 2m
72 76
71 2
0
2016 2020E 2025E 2016 2020E 2025E
Gasoline Diesel Hybrids BEV PHEV+HEV Total BEVs consensus forecast
ХХ% Global market share
Total Hybrids consensus forecast
Range of forecasts (BEV)
Source: Company data, LMC Automotive, Market Research
Note: 1. EV includes BEV, PHEV and other hybrids vehicles;
60Automakers Announced the Transition to All Types of
Electric Vehicles, but Not Just Battery Electric Vehicles
Most Automakers Announced the Move … and Many of Them to be Hybrids
to Electric Cars…
Mln units per year Model range
3% 1% 3% 2%
Announced date of full model range electrification
JLR 30
0.1 by 2019E
50
Volvo 1 by 2020E 13 12 10
12 8 8
BMW VW Group Renault Hyundai
Daimler 2 by 2022E
Motors&Kia
Motors
VW 10 by 2023E
Electric Hybrid
«…15-20% of sales as EV by 2025E», Daimler
company representative
Due to higher manufacturing cost of xEV mass
vehicle producers are in no rush to accelerate
«…70% of Ford brand to be conventional hybrids,
xEV production plug-in hybrids or full battery electric by 2025», Ford
company representative
Source: Company data, IHS, LMC Automotive
ХХ% % of хEVs of company’s LV sales in 2016 61BEVs and PHEVs: Growing Reliance on Ni
NCA&NCM are Main Cathode Material Higher Ni Intensity in NCM Cathodes
Driven by Higher Energy Density and Co
Substitution
Kt
Mainstream NCM Chemistry
24% Low energy density
30% NCM NCM NCM
1:1:1 6:2:2 8:1:1
Adopted by Tesla
14% and Panasonic
9%
2015 2020
Improve energy
25% density by
36%
increasing Ni from 20% 36% 48%
20% to 48%
Ni weight content in cathode material Li(NiCoMn)O2
36% Mainly used for
26% consumer electronic
components
2014 2025E
LiCo NiCoMn NiCoAl Other
Source: Company data
62Norilsk Nickel’s Metal Basket Content by Light Vehicle Type
Hybrid
Gasoline Diesel incl. PHEV BEV FCEV
CAGR1 +1% +1% +18% +25% +41%
Market
68% 17% 9% 3% 1%
Share2
Stainless Steel & Parts +Batteries
Ni 2–3 kg
3-4 kg 3-4 kg 5–15 kg 30–110 kg
Wires & Parts +Electric Motor, Generator Winding
Cu
20-25 kg 20-25 kg 45-50 kg 75-803 kg 70-75 kg
Catalysts Fuel Cell
PGM -
2-5 g 3-6 g 2-6 g 25-35 g
Pt:Pd ratio 1:4 8:1 1:4
Metal value per
$260-410 $270-410 $440-710 Up to $1,830 Up to $1,600
vehicle, USD (4)
Source: Company estimates, LMC Automotive, Bloomberg;
Note: 1. CAGR for 2015-2025E, 2. Expected market share in 2025 based on production; 3. Excluding additional infrastructure demand of
1-8 kg per charger; 4. Metal values calculated at spot prices as of November 16, 2017 63Autos Driven Metals Demand Outlook by 2025E
Metal
PGMs Ni Cu
Moz Kt Kt
143
5
0.1
35 205
0.3
90
1.0
534 1,272
3.1 446
316
1.7
390
Gasoline Hybrids PHEV Diesel Total BEV PHEV Hybrids Diesel Total Charging Hybrids BEV Diesel Total
Gasoline stations inc PHEV Gasoline
Ni in batteries Cu in electric engines
Consumption
and generators
Pd in catalytic converters Ni in stainless steel, alloys Cu in wires
and parts
Cu in charging stations
Source: Company data
Note: 1. Assuming additional 19 mln units of light vehicle sales
64Marketing Strategy
Markus Meurer
Global Head of SalesNickel Strategy with Focus on Sales Diversification
Ni sales strategy priorities Progress up-to-date Sales team focus
Sales to Non-STS users, Kt Alloys & Special Steels:
Balanced increased sales in China and
portfolio +32% Russia as a result of focused
between STS marketing efforts
and non-STS
sectors Plating: expanded commercial
104
79 capabilities and presence in
China; optimised product
offering and intensified
Efficient use of 2014 2017E customer education
built-in flexibility at
Harjavalta Refinery Batteries: active engagement
to produce different with leading players in the
Insight into technical needs of
forms: briquettes, sector(more details on the next
consumers in added-value uses
powders, sulfate slides)
gained through captive Technical
Analysis & Research Team
CAPEX-light initiatives to better
Support of EV address Non-STS customers’
revolution needs
Focused targeting of Non-STS
customers
66Preferred Product Mix for Battery Sector
Products Progress to date Existing products Growth options
Benchmark quality product
Production in 2017 close to maximum capacity
Sulfate
Immediate access to battery sector
Pro-active marketing of NN briquettes (historically
supplied to Stainless consumers) to battery / Flexible
Briquette
precursor producers product
offering
to
Debottlenecking packaging capacity and extending the address
Powder range of packaging options – response to strong evolving
demand increase from battery raw material sector market
Customized offering in terms of different size fractions needs
Solutions A ready-to-use chemical for downstream
NN Harjavalta represents a unique supply proposition for battery / precursor manufacturers due to flexibility
and optionality of the refining process
Capex-light development of customer-tailored product portfolio for battery raw material sector
67Strategic View on Battery Sector
Long-term
Mid-term
Potential expansion in line with demand The current
market
NN Ni supply to battery sentiment
sector up
20 to 20 Kt runs well
ahead of
actual
Long-term demand
Mid-term
from EVs
Leveraging Harjavalta product mix - sulphate, CAPEX to increase capacity of products
powder, briquettes (complimented by cobalt designated for battery sector as a Sales to
products) - to address consumer preferences function of demand dynamics follow the
actual pace
In-depth understanding of the future A strong and competitive stance as of battery
requirements by PCAM(1) producers both for supplier to batteries sector market
quality and volume of feed will allow to avoid evolution
unnecessary excessive CAPEX
Scaling up cooperation with leading
Strategic alliances with precursor precursor producers / developers
manufacturers, JVs considered
Note: 1. Precursor for cathode active material
68Strong Indication of Pd Market Tightening in 2017
Pd Market in Consistent Backwardation since April 2017 Limited Availability of Physical Pd in the Spot Market
% 1-month Pd Forward Rate % Short-Term Lease Rates
5 12
0
9
-5
-10 6
-15
3
-20
-25 0
Mar-16 Jun-16 Sep-16 Dec-16 Mar-17 Jun-17 Sep-17 Jan-14 Oct-14 Jul-15 Apr-16 Jan-17 Oct-17
Destocking from Visible Vaults Continuing … … Above-ground Stocks Lack Transparency
100%=01.01.2015 MOz
10
UK/CH ETFs NYMEX
0% 8
GPF makes non-
transparent stocks
6 available for industrial
users
4
-48% 2
-50%
0
Total ETF Coins & bars Metal Consumer Opaque Global Pd
-75% accounts stocks Fund
-100%
69Responsible Leadership In Palladium Market
Long-term
Mid-term
Industrial efforts / new
Marketing-focused efforts
projects
Stock support / physical availability management Strategic aspiration for PGM production growth
to support industrial demand by providing a supply
bridge over mid-term deficit Strong portfolio of “PGM-rich” growth
opportunities that could fill most of the potential
Prioritization of sales to industrial clients with deficit in the long run:
primary focus on auto industry to ensure
sustainability of supply – South Cluster (almost 70% of potential
production could be PGMs)
Global Palladium Fund as a channel to supply – Talnakh capacity expansion
industrial clients with formerly stockpiled metal
– Maslovskoye deposit (30+ MOz of Pd in
resources)
– Potential cooperation with license-holders of
PGM-rich deposits
70Palladium Fund Status And Priorities
Global Pd fund Fund as a tool of creating a “supply bridge” over
anticipated mid-term deficit in 2018-2020
Goals
Decision to create a physical stockpile of
To access previously Palladium to support mid-term demand from
unavailable stocks in order to anchor consumers in response to palladium
channel them to anchor physical market tightening
industrial consumers when
needed
To facilitate the metal flow to
Expected size: up to 0.6 MOz
industrial consumers rather
than speculators Product range: mixture of purchased 3rd party and NN material
in order to match industrial customers’ requirements for metal
Milestones form (ingot or sponge)
Delivery schedule: subject to production plans of anchor
2016 - Fund established
industrial clients
Mid-2017 – Fully operational:
team, accounts, trade lines Proper risk-management procedures to limit price exposure
and contracts in place
2H2017 - Stockpile
accumulation
71Sustainable Development
Andrei Bougrov
Deputy Chairman of the Board
Senior Vice-PresidentComprehensive Approach to Sustainable Development –
Board Leadership
Strong Corporate Governance: Progress in Implementation of Environmental
Independent Board Chairman Roadmap:
Strong Board Committees and stringent governance Phase 1 of environmental program completed in 2017
procedures 2016 SO2 emission reduction: 5% in Polar Division and
Dedicated Audit and Sustainable Development Board 23% in Kola Division
Committee Phase 2 launched: Sulphur project. Target SO2
reduction 75% by 2023
CORPORATE
ENVIRONMNET
GOVERNANCE
Improving Health & Safety – COMMUNITY
SAFETY
on Top of Management Sustainable Development
Priorities: of Territories:
Support of social initiatives in the regions of operations
Significantly improved LTIFR: reduced by 59% in 2013-
Housing and reallocation programs («Our home», «My
2016; Below global industry average
home») and other social programs (World of New
Independent verification of health & safety practices by
Opportunities)
DuPont Assessment: occupational safety culture score
Wider community engagement
improved from 1.4 in 2013 to 2.5 in 2016
Participation in federal social programs
Long-term target: zero-fatality on production sites
Long-term social agreement with the government of
Zabaikalsky Krai – a new region of operation
73Balanced Board of Directors
Board of Directors consists of 13 members (incl. 2 executive)
5
4 4
Independent
Directors(1) Directors RUSAL
Directors
Budget CG, Nomination and
Audit and Sustainable Strategy
Committee Remuneration
Development Committee
chaired by Committee
Committee chaired by chaired by Rusal
Interros chaired by
independent director representative
representative independent director
Gareth Peter Penny
Non-Executive Independent Chairman
▪ 22 years of mining experience with De Beers and Anglo American
▪ CEO of De Beers 2006-2010
▪ Non-executive Board member of Julius Baer Holdings Limited
Source: Norilsk Nickel
Note: 1. Including Chairman of the Board of Directors. In accordance with the criteria set out in the Russian Federal law “On Joint Stock Companies” No.
208-FZ dated 26 December 1995, as amended, and the Company’s own criteria, which differ in certain respects from the criteria for independent directors 74
that are set out in the U.K. Corporate Governance Code.Selected Environmental Initiatives:
Cleaning Up Legacy Issues (1/2)
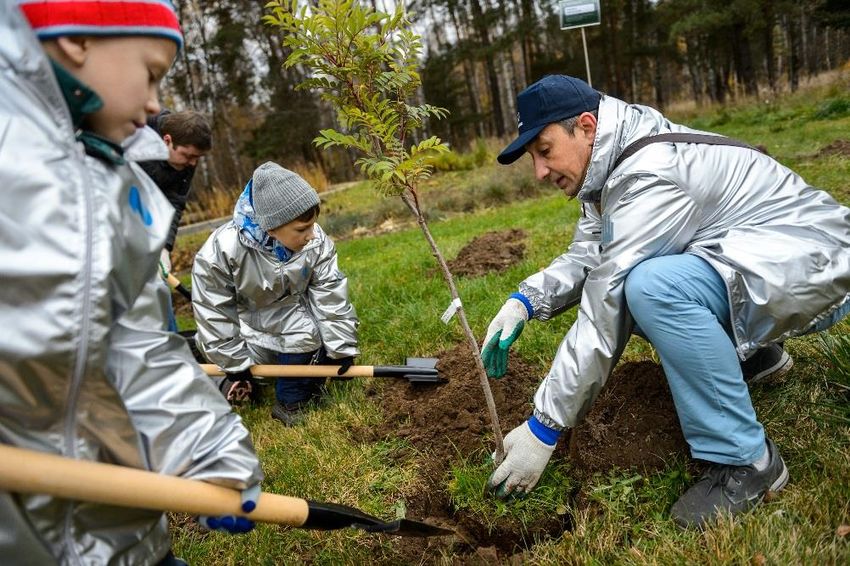
Annual Eco marathon supported by World Wildlife Fund (WWF) and UN Environment at Polar
and Kola divisions included 70 ecological campaigns in 2017
Over 1,000 trees and shrubs planted by company volunteers
Environmental Clean Up Campaign at Kola Tree Planting Program in Polar and Kola
Bay Divisions
Source: Company data
75Selected Environmental Initiatives:
Cleaning Up Legacy Issues (2/2)
Environmental Clean Up in Norilsk: Environmental Improving Biodiversity in Norilsk:
Monitoring in the Area of Daldykan River Releasing Juvenile Fish into the River
Source: Company data
76You can also read