TOWARD INFILL HOUSING DEVELOPMENT - Department of State Growth
←
→
Page content transcription
If your browser does not render page correctly, please read the page content below
AUGUST 2019

       TOWARD
INFILL HOUSING
 DEVELOPMENT

PREPARED FOR THE TASMANIAN DEPARTMENT OF STATE GROWTH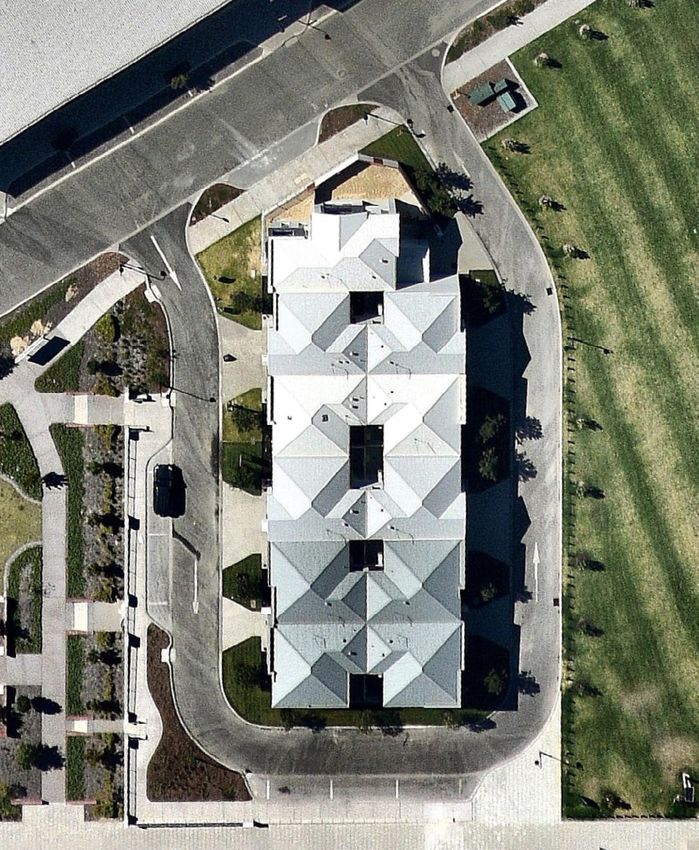
Launceston

              Hobart

TOWARD INFILL HOUSING DEVELOPMENT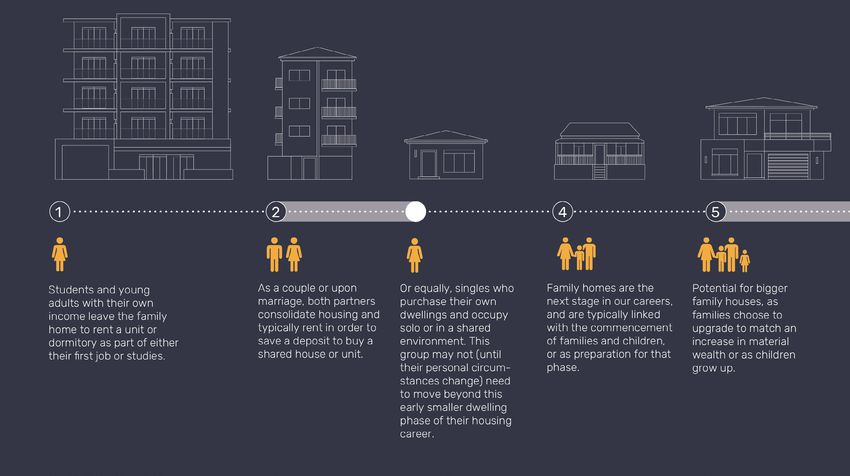
EXECUTIVE
                                    SUMMARY
                                    Tasmania’s major urban centres are        It covers a range of housing types,
                                    currently experiencing very high          including duplexes, townhouses,
                                    demand for housing, both to own and       ancillary dwellings, terrace housing,
                                    rent. This demand, largely driven by      and low to medium rise apartments.
                                    growth in interstate and overseas         These types of housing provide
                                    migration, tourism, and a growing         a compromise between larger,
                                    university population, has seen           detached dwellings and higher
                                    property prices in Hobart increase        density apartments.
                                    35% in the five years to May 2019 –
                                                                              Infill housing offers a number of
                                    the largest house price increase of
                                                                              advantages to households and
                                    any Australian capital city (Corelogic,
                                                                              cities. It contributes to a more
                                    2019) – and a rental market vacancy
                                                                              compact urban form, supporting the
                                    rate around 1.4% (REIT, 2019). It is
                                                                              use of existing infrastructure and
                                    now increasingly difficult for people
                                                                              services. It increases total housing
                                    to enter Tasmania’s housing market,
                                                                              stock in areas with good access to
                                    to secure long-term rentals or to
                                                                              employment, schools and public
                                    have a reasonable level of choice in
                                                                              transport. In providing a range of
                                    type and location of housing.
                                                                              housing types, it supports market
                                    Tasmania’s housing market is very         demand and demographic needs for
                                    traditional in its product makeup         different types of housing, including
                                    and buyer demands. Detached               smaller and more affordable options.
                                    houses located on greenfield sites
                                                                              The delivery of infill housing is
                                    continue to make up the majority of
                                                                              challenging, particularly when it
                                    the market, and comprise a higher
                                                                              does not form a significant part of
                                    proportion of residential development
                                                                              an existing housing market. Barriers
                                    compared to other major cities such
                                                                              include the higher cost of inner-city
                                    as Sydney, Melbourne and Canberra.
                                                                              land, fragmented site ownership,
                                    While this type of housing meets
                                                                              industry capacity to deliver a
                                    the needs of some households, it
                                                                              different type of product, planning
                                    limits choice and affordability for
                                                                              and heritage restrictions, and lack of
                                    many others, including low income
                                                                              community awareness of different
                                    households, first home buyers,
                                                                              housing products.
                                    individuals seeking to downsize and
                                    people wanting to live within or close    This report identifies a series of
                                    to major employment centres.              recommendations to improve
                                                                              the ease, opportunity for, and
                                    Until recently, in the absence of
                                                                              affordability of infill housing in
                                    high growth, there has been no
                                                                              Tasmania. It recognises that, while
                                    pressure to facilitate infill housing
                                                                              there are barriers to achieving a
                                    development or promote a wider
                                                                              higher proportion of infill housing
                                    range of housing typologies.
                                                                              in Tasmania, this type of housing
                                    However, as Tasmania’s population
                                                                              offers advantages that may improve
                                    grows and its demographics change,
                                                                              housing choice, accessibility and
                                    a more diverse range of housing
                                                                              affordability for home owners and
                                    typologies will be required.
                                                                              renters across Tasmania.
                                    Infill housing refers to the
                                    establishment of new dwellings
                                    within an existing urban area,
                                    focusing in particular on the inner to
                                    middle areas of a city.

TOWARD INFILL HOUSING DEVELOPMENT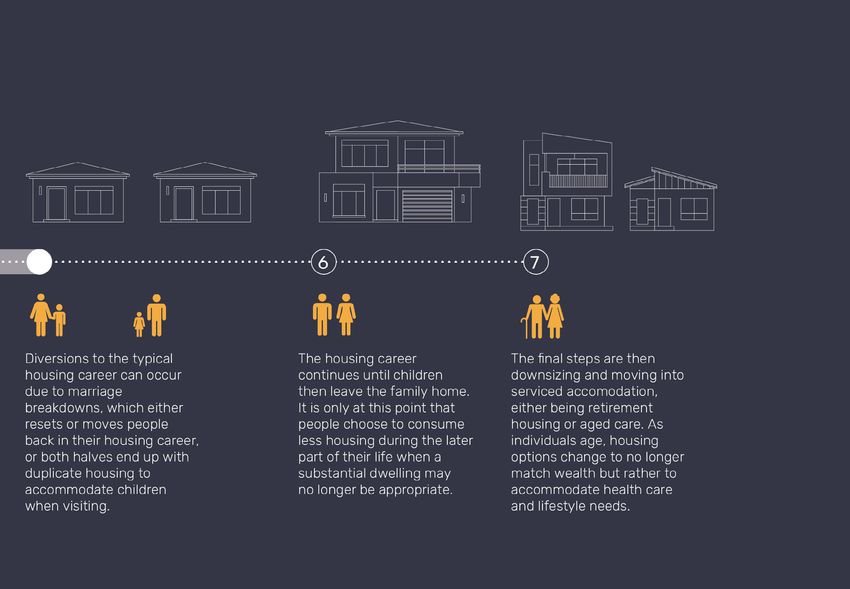
CONTENTS

    INTRODUCTION                     3

    HOUSING CAREERS                  5

    TYPES OF INFILL HOUSING          7

    TASMANIAN HOUSING MARKET         11

    WHO IS DRIVING HOUSING DEMAND?   16

    BARRIERS TO DELIVERY             21

    IMPROVING INFILL OUTCOMES        26

1                                         TOWARD INFILL HOUSING DEVELOPMENT
TOWARD INFILL HOUSING DEVELOPMENT 2

INTRODUCTION

PROJECT BACKGROUND                                 WHAT IS INFILL HOUSING?                  The missing middle considers both
                                                                                            the type of housing provided and
The Toward Infill Housing                          Infill housing refers to the             where this housing is located. Across
Development project was                            development of new dwellings within      Australia, dense missing middle
commissioned by the Department                     an existing urban area.                  housing projects are being delivered,
of State Growth (State Growth), as                                                          however these projects are often
                                                   Infill typologies range from
an initiative under the Tasmanian                                                           located in master-planned estates
                                                   detached houses including multiple
Government's Population Growth                                                              on the urban fringe rather than
                                                   dwellings, with generous front
Strategy, to inform the Tasmanian                                                           as part of urban renewal projects.
                                                   and rear setbacks, to duplexes,
Government’s response to increased                                                          The location of these projects on
                                                   triplexes, townhouses, row and
demand for well-located, affordable                                                         the urban fringe places people
                                                   terrace housing, low to medium rise
housing within the State’s urban                                                            further away from employment
                                                   apartments and ancillary dwellings.
centres.                                                                                    opportunities, services and public
                                                   Infill housing can be delivered as a
                                                                                            transport. Missing middle housing is
The project also informs objectives                single or small-scale development,
                                                                                            most needed closer to the centre of a
under the Launceston and Hobart                    or as part of a larger, integrated
                                                                                            city where it can leverage off existing
City Deals, including increased infill             development.
                                                                                            physical and social infrastructure and
development, urban renewal and the
                                                   While rates of infill housing have       services.
delivery of new dwellings.
                                                   increased in some cities, including
                                                                                            Both Hobart and Launceston are
While this report considers infill                 Sydney, Canberra and Brisbane,
                                                                                            experiencing some redevelopment
housing for the whole of Tasmania,                 infill housing continues to make up
                                                                                            of their city centres, and significant
and as a concept can be applied                    a comparatively small proportion of
                                                                                            development on their edges, however
to all urban areas and towns within                new housing stock. In Tasmania, the
                                                                                            there is insufficient development
the State, the focus is on the                     proportion is even smaller at around
                                                                                            happening in the spatial ‘middle’
larger urban centres of Hobart and                 15%. Given this lack of availability,
                                                                                            suburbs.
Launceston.                                        infill housing has been referred to as
                                                   ‘the missing middle’ or the ‘missing’
In this report, references to Hobart
                                                   housing typologies from within a
and Launceston relate directly to the
                                                   city’s housing typology spectrum,
significant urban areas of those two
                                                   (Figure 1).
cities. Where discussions are based
on statistical data, specific reference
is made to the relevant statistical
area, i.e. Hobart SA4 and Launceston
and North East SA4.

INFILL HOUSING TYPOLOGIES

Figure 1: The “Missing Middle” typology transect

3                                                                                                    TOWARD INFILL HOUSING DEVELOPMENT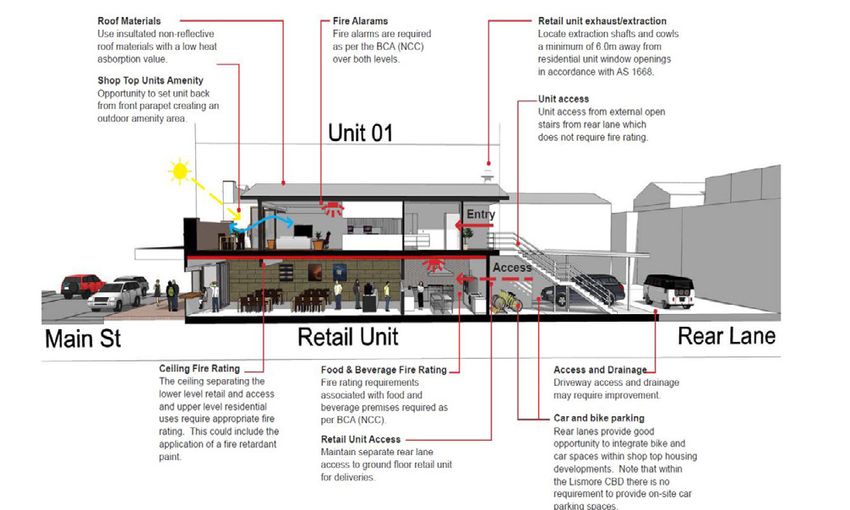
Gentle Density
                                                                                      "Gentle density is about trying to
                                                                                       find ways to make infill housing
                                                                                      compatible with its surroundings
                                                                                         to support both urban design
                                                                                        goals and the delivery of more
                                                                                                   housing"

WHY IS INFILL HOUSING
IMPORTANT?                                      SO WHAT FOR TASMANIA?

In concentrating new housing in          Infill housing is largely absent within   This could be achieved through a mix
existing urban areas, and providing      the Tasmanian housing market, with the    of 'gentle density' including ancillary
a compromise between larger,             majority of new housing development       dwellings, small subdivisions and small
detached homes and higher density        located on the urban fringe, mostly as    townhouse typologies, appropriately
                                         detached houses.                          positioned within existing suburbs,
apartments, infill housing supports
                                                                                   combined with more concentrated
broader policy outcomes, including       Low density housing on the urban
                                                                                   nodes of higher density low-rise and
improved accessibility; increased        fringe is often the most affordable
                                                                                   medium-rise residential developments,
housing diversity; and the more          type of housing for many households.
                                                                                   in proximity to high frequency
efficient and sustainable use of         It is also the most affordable type
                                                                                   passenger transport services.
existing infrastructure and services.    of housing for developers to deliver.
                                         However, this development pattern         Most jurisdictions within Australia
For households, infill housing can       comes at a cost. Fringe urban areas       have regional planning policies that
provide the following benefits -         are highly car dependant, with limited    clearly define infill and greenfield
                                         public transport services. Supporting     dwelling targets. For example, Sydney,
»» More affordable options for           educational, social, and recreational     Melbourne and South East Queensland
   homebuyers and potentially, faster    services are also limited.                are all seeking around 60% infill versus
   access to home ownership.                                                       40% greenfield.
                                         For infrastructure providers, low
»» Proximity to public transport nodes   density housing requires the extension    These policies have been specifically
   and amenities, facilitating access    and upgrade of economic and social        developed to limit less sustainable
   to employment opportunities and       infrastructure, often across many         growth at the edge of cities. While
   services.                             different suburbs. In Hobart and          Southern Tasmania has a 50%
                                         Launceston, the conversion of fringe      greenfield, 50% infill target, this target
»» Options to downsize and unlock
                                         land to housing has implications for      has not been enforced across the
   equity in a family home.              the loss of productive agricultural and   metropolitan region.
»» Greater housing choice, supporting    resource land, and greenspace.
   ageing in place.
                                         A greater focus on infill provides
»» More housing within suburbs of        opportunities for households to trade
   higher demand.                        off a longer commute with a smaller
To support equity and affordability,     backyard and better access to major
                                         employment centres, key services and
it is also important that cities have
                                         facilities.
a supply of subsidised affordable
housing (i.e. social housing) within
the inner and middle suburbs of key
urban centres.

TOWARD INFILL HOUSING DEVELOPMENT                                                                                               4
HOUSING
CAREERS
The idea of a ‘housing career’ was     Housing careers are important             Housing markets should supply a
first conceptualised within academic   because like our working careers,         range of housing types, at a variety
literature in the early 1970s and      they can be disrupted by technology,      of price points to enable households
1980s. A variety of academics noted    changing working trends, and              and individuals to access affordable
a strong correlation between stage     changing social circumstances. In         housing, and then move through
of life and the type of dwelling an    Australia, the cost of housing, to buy    their housing career within the
individual or household resides        or rent, is seeing children stay in the   same suburb, or in proximity to that
in. Those academics argued that        family home for longer. Increasingly,     suburb.
individuals progress through the       people are also challenging the
housing market in response to          traditional focus on ‘bigger and
changing demographic, economic         better housing’, and instead choosing
and social circumstances.              to invest in alternative housing,
Generational influence on the          which is more convenient and offers
property market is shown in Table 1,   access to more job opportunities and
with a typical housing career shown    amenities.
in Figure 2.

A TYPICAL HOUSING CAREER THAT FOLLOWS TRADITIONAL
STEREOTYPES OF THE COMMUNITY WOULD BE AS FOLLOWS:

Figure 2: A Typical Housing Career

5                                                                                         TOWARD INFILL HOUSING DEVELOPMENT
LEGEND
LEGEND
LEGEND
LEGEND LEGEND
GENERATION
GENERATION
GENERATION
Z 1995
GENERATION
Z 1995
- 2010
Z 1995
GENERATION
- 2010
Z- 1995
2010 - 2010
Z 1995 - 2010
GENERATION
GENERATION
GENERATION
Y 1980
GENERATION
Y 1980
- 1994
Y 1980
GENERATION
- 1994
Y- 1980
1994 - 1994
Y 1980 - 1994
GENERATION
GENERATION
GENERATION
X 1965
GENERATION
X 1965
- 1979
X 1965
GENERATION
- 1979
X- 1965
1979 - 1979
X 1965 - 1979
GENERATIONAL
NERATIONAL
RATIONAL
GENERATIONAL
GENERATIONAL
INFLUENCES
INFLUENCES
INFLUENCES
INFLUENCES
ON
INFLUENCES
ON
THE
ON
THE
THE
ON THE
ON THE BABYBABY
BOOMERS
BABY
BOOMERS
BOOMERS
BABY
19461946
BOOMERS
- 1964
BABY
1946
- 1964
-BOOMERS
1946
1964 - 1964
1946 - 1964
PROPERTY
OPERTY
ERTY
PROPERTY
MARKET
MARKET
PROPERTY
MARKET
MARKET
MARKET BUILDERS
BUILDERS
BUILDERS
19251925
BUILDERS
- 1945
1925
- 1945
-BUILDERS
1925
1945 - 1945
1925 - 1945
DWELLING
LLING
G TYPE/YEAR
DWELLING
TYPE/YEAR
TYPE/YEAR
DWELLING
TYPE/YEAR
TYPE/YEAR
201020102010 2010 2015
2010
20152015 2015 2020
2015
20202020 2020 2025
2020
20252025 2025 2025
SO WHAT FOR
HOUSING
DENT
STUDENT
HOUSING
STUDENT STUDENT
HOUSINGHOUSING
HOUSING TASMANIA?
Affordable housing is more than just
TAL
RENTAL
RENTAL RENTAL
about price. It is about what people
can afford relative to their income, and
T
RENT
AAS AAS
RENT
A AS RENT
A AS A where housing is located in relation
COUPLE/1ST
PLE/1ST
1ST HOUSE
COUPLE/1ST
HOUSE
HOUSE
COUPLE/1ST
HOUSE HOUSE to work, schools, family and services.
YOUNG
NG
AMILY
FAMILY
YOUNG
OWN
FAMILY
OWN
FAMILY
YOUNG
OWN OWN
FAMILY OWN In constructing new houses, there
needs to be a better understanding
URE
MATURE
FAMILY
FAMILY
MATURE
OWN
FAMILY
OWN
FAMILY
MATURE
OWN OWN
FAMILY OWN of ‘who’ will occupy and buy future
housing. Table 1 shows housing
trajectory by generation over time. For
BUY
2ND
HOUSE
2ND
HOUSE
BUYHOUSE
2NDBUY
HOUSE
2ND HOUSE most Australian capital cities, Gen-Y
and Gen-Z will soon be the primary
EMPTY
TY
ESTER
NESTER
EMPTY
NESTER
NESTER
EMPTY NESTER buyers of many forms of housing.
These groups have different
RETIREMENT
ENT
REMENT
HOME
RETIREMENT
HOMEHOME
RETIREMENT
HOME HOME aspirations and values when it
LEGEND
comes to urban life, and these values
GENERATION Z 1995 - 2010
need to be tested against the type
Table 1: Generational Influences on the property market of housing that is being delivered.
GENERATION Y 1980 - 1994 It is likely that these groups will
demand smaller and more affordable
LEGEND GENERATION X 1965 - 1979 housing, and may be interested
CES ON THE GENERATION Z 1995 - 2010 BABY BOOMERS 1946 - 1964
in different housing typologies
compared to past buyer groups (e.g.
GENERATION Y 1980 - 1994 BUILDERS 1925 - 1945 baby boomers and Generation X).
GENERATION X 1965 - 1979 This type of housing is also closely
aligned to two of Tasmania’s key
010 2015
BABY BOOMERS 1946 -2020
1964 2025
housing market cohorts – persons
aged 65+ and international
BUILDERS 1925 - 1945
students, both of which are likely
to be seeking smaller, lower-
maintenance, more affordable
2020 2025
housing options, close to services.
TOWARD INFILL HOUSING DEVELOPMENT 6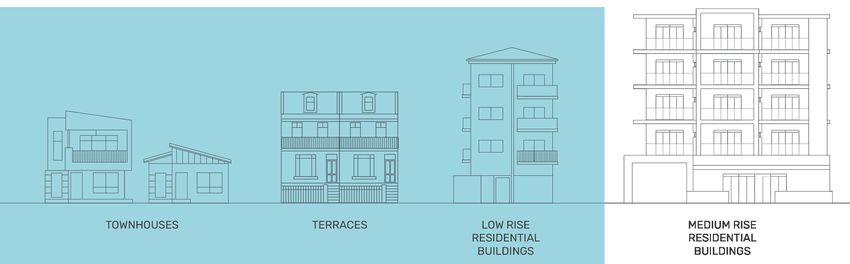
TYPES OF INFILL
HOUSING

Minimum, Micro & Small Infill Lots                             Duplex
Micro or small lots are parcels of land smaller than           A duplex is a residential building containing two houses that
the minimum lot size specified in the relevant zone            share a common central wall. The pair of homes are either
provisions. In Tasmania, the minimum lot size in the           strata titled or exist on separate titles and can be owned
General Residential Zone is currently 450m2, and 325m2         and sold separately by non-related households. The two
for multiple dwellings, and 200m2 in the Inner Residential     dwellings may be beside one another of above one another.
Zone.
                                                               Each house is a separate home with its own entrance,
The development of smaller lots for housing often              amenities and yard.
requires a flexible approach to setbacks, site cover and
carparking requirements. From a design perspective,
best practice suggests that the smaller the lot, the more
considered the house design needs to be, to ensure the
highest and best use of allocated space.

    Case Study - Micro lots
    A ‘micro lot’ housing project was launched in April 2018
    in Ellenbrook in Perth’s north-east. The housing plans
    included a two-bedroom, two-bathroom layout, or a
    two-by-one on 80m2 blocks of land.
    The pilot project is a joint venture between the WA
    Government, developer LWP Property Group and home
    builder Now Living.
    Reference: https://www.nowliving.com.au/80-
    ellenbrook/

7                                                                                             TOWARD INFILL HOUSING DEVELOPMENT
Ancillary Dwellings Low-Medium Rise Apartments
An ancillary dwelling refers to a second house less than 60m2 Low-rise typically accounts for residential apartment
on a lot containing an existing house where both dwellings buildings of up to 4 storeys, while mid-rise can include
form part of the same title. 5-7 storeys. These buildings contain dwelling units
that share common property and are strata titled. The
Ancillary dwellings can be delivered under existing planning
boundary of each unit is defined by floors, walls and
controls and without the need for regulatory change. They
ceilings.
can be separate, attached or within the main residence.
Ancillary dwellings are an affordable housing option and Access to each unit is usually through common property,
genuine form of incremental infill, providing an opportunity and units are typically located above ground level or
for property owners to unlock the equity they may have in semi-basement car parking. Units have private open
their property. space and access to communal facilities, dependent upon
the number of dwellings within the building.
Case Study - Granny Flat » » Maintain a 3m setback from the rear, 0.9m setback
Granny flats, or ancillary dwellings are seen as a positive from the side boundaries;
way to add value and flexibility to a home and increase »» Maintain a distance of 3m from any existing trees
the number of affordable dwellings available in the rental over 4m in height; and
market. »» Maximum 60m2 external area for the granny flat.
IIn 2009, the New South Wales Government released the
Affordable Housing State Environment Planning Policy
(SEPP), which allows all residential home owners with
a property larger than 450m2 (and with a minimum 12m
street frontage) to build a granny flat on their property.
The construction of granny flats on these types of lots
is a complying development and does not require a full
development application or approval.
Minimum Site Requirements:
»» Property must be a minimum of 450m2 in area;
»» Property must have residential zoning;
»» Property must have a minimum 12 metre width at the
building line of the existing dwelling. If the property
does not meet this requirement it there is an ability to
apply for an attached granny flat;
TOWARD INFILL HOUSING DEVELOPMENT 8CAFE HAIR
Terrace /Row Houses Shop Top Housing
Terrace and row houses are visually attached dwellings Shop-top housing refers to attached housing in varying
on a strata or separate (freehold) lots, located beside forms above ground floor retail or commercial uses. Shop
each other and appearing as a row of attached houses, top housing offers an alternative to more traditional
sometimes gaining access from a rear lane. This type housing types and contributes to the economic and
of housing is typically approved in combination with social vitality of village and city centres. Shop-top
a subdivision (reconfiguration of a lot), and may have housing is somewhat location sensitive. It generally works
shared common walls or separate built-to-boundary walls in areas with particular attributes, including linear retail
strips along feeder or arterial roads, sites close to major
Each dwelling has a ground level and its own entry from
infrastructure, such as a CBD or university; and areas
the street, and appear as separate houses to the street,
with good public transport connectivity.
with a height typically not exceeding three storeys.
Case Study - Terrace Houses Case Study - Shop Top Housing
Envi Micro Urban Village is an architect-led development Lismore City Council's ‘Lismore Housing Strategy’ identified
located in Southport, on the Gold Coast. The development CBD housing as a key component to improving housing
has seen the conversion of a single suburban lot into ten options, and in 2015 Council brought together a focus group
affordable terrace homes, comprising micro terraces (two to look at barriers related to shop-top housing. As a result of
bedrooms), ‘urban pods’ (two bedrooms), a ‘village home’ the feedback, Council worked closely with property owners
(three-storey, three-bedroom house), and ‘pico pod’ (one to help meet fire regulations, which can be complicated and
bedroom). costly. Council also released a community brochure outlining
how building owners can address the major issues that
The development features what are believed to be some of
have inhibited shop-top housing development in Lismore,
the smallest freehold residential lots available in Australia,
especially in the CBD. This guidance is aimed at encouraging
with the smallest lot being just 38m2. This lot houses a 67m2
more housing, particular smaller types of accommodation
residence. Seven of the ten lots were purchased by new home
within the city centre. Council also adopted a policy that
buyers, supporting an objective to provide affordable housing
waived carparking and Section 94 and 64 contributions
options.
and fees for shop-top housing to incentivise this type of
development.
9 TOWARD INFILL HOUSING DEVELOPMENTA PRECINCT APPROACH Housing within the project was The project has also seen significant
delivered by partner builders, who capacity building within the housing
In 2008, the Queensland Government essentially ‘bought’ land off the sector, which has had flow-on
identified the opportunity to develop ULDA. Given the small size of houses effects for other developments in the
new generation housing products for (e.g. houses that fit onto 6m wide region.
the Brisbane market, using surplus lots), significant innovation was
Government land. The final product, required to deliver a high quality
the master-planned ‘Fitzgibbon product.
Chase’ estate, located 13km from the
Housing on the estate was sold
Brisbane CBD was facilitated by a
on the open market with no pre-
state-owned development company,
eligibility criteria, and was essentially
the Urban Land Development
affordable by design, with smaller
Authority (ULDA – now renamed
housing and lot sizes. The project
Economic Development Queensland).
served as a useful display village for
The ULDA developed the policy and local government and developers.
design guideline, ‘Res30’ Code, It has proven an effective tool in
to facilitate new housing at 30 the South East Queensland context,
dwellings per hectare. This was demonstrating the ‘missing middle’
achieved through a mix of smaller housing options, with a number of
detached housing, terrace housing, Local Governments subsequently
and a limited amount of low-rise adopting Res30 principles into their
residential units. planning schemes.
Fitzgibbon Chase, QLD, ULDA
TOWARD INFILL HOUSING DEVELOPMENT 10THE TASMANIAN
HOUSING MARKET
Across Australia, households are
spending more of their income on
housing than in previous decades.
Home ownership rates are falling for all
age groups under 65, particularly for
10.2%
the young and those on lower incomes
(Grattan Institute 2018). For many
individuals and households, owning a
home or finding secure, long-term rental of Tasmanian renting
accommodation comes at a significant households spend over 30%
financial and personal cost. of their income on rent
In Tasmania, demand for housing has
increased significantly in recent years.
It is now increasingly difficult to enter
Tasmania’s housing market, to own or
43.0%
of suburbs within Hobart
rent, particularly in the inner and middle
urban areas of Hobart and Launceston. are spending over 25% of
their income on mortgage
The factors contributing to the current repayments
housing situation in Tasmania include:
»» Over the past decade house price
growth for renters and owner
occupiers has surpassed income
growth, creating a need for more
affordable housing options.
»» Interstate and overseas migration
and the number of international
students studying in Tasmania,
have both increased. This has
placed additional demand on the
housing market.
9.7%
Median rent increase in
»» Tourist visitation has increased, Southern Tasmania
with flow-on effects for how
existing houses are being used
(i.e. conversion of rental properties
to short-stay accommodation).
7.0%
Median rent increase in
»» An ageing population, with limited Northern Tasmania
alternative and affordable private Source: Tenants’ Union of Tasmania (TUT) 2019,
housing options to support Tasmanian Rents: March Quarter 2019.
downsizing.
»» The way people are living is
changing, resulting in demand for
housing that provides a range of
housing types to match housing
careers.
11 TOWARD INFILL HOUSING DEVELOPMENTTHE COST OF HOUSING Median Annual Household Income and Growth (2006-2016)
Tasmania’s major urban centres SA4 Region 2006 2011 2016 CAGR 2006 2018*
are currently experiencing very - 2016
(% p.a)
high demand for housing, both to
own and rent. Growth has been Greater $46,904 $55,224 $64,064 3.2% $68,186
Hobart
particularly high in Hobart, with the
city experiencing an increase in Launceston $39,468 $46,540 $52,780 2.9% $55,939
median sale price from $359,000 in Greater $60,996 $75,088 $90,792 4.1% $98,310
June 2012 to $483,750 in March 2018 Sydney
(refer to Figure 3).
Growth in household incomes has Greater $56,680 $69,212 $80,028 3.5% $85,744
not kept pace with growth in the cost Melbourne
of housing. Between 2006 and 201 6, Table 2: Median Income and Growth 2006-16
annual household income increased Source: ABS Census (2016)
3.2% in Greater Hobart to $64 000
and 2.9% in Launceston to $53,000 Median Annual Rental and Mortgage Repayments
(refer to Table 2). Over the same
SA4 Region Payment 2006 2011 2016 CAGR
period, median mortgage repayments
Type
and rent for both cities increased at
a higher rate. In Hobart, mortgage Hobart Median $11,700 $17,160 $16,824 3.7%
mortgage
repayments and rent increased repayment
3.7% and 5.7% respectively, while in
Median rent $7,800 $12,220 $13,520 5.7%
Launceston the increase was 3.8%
and 5%, respectively (refer to Table Launceston Median $10,404 $15,600 $15,120 3.8%
3). mortgage
repayment
Median rent $6,760 $9,880 $11,024 5.0%
Table 3: Median Annual Household Income and Growth (2006-2016).
500,000
Hobart
450,000
400,000
$ Sale price
350,000
300,000 Launceston
250.000 North West
Coast
200,000
June 12 June 13 June 14 June 15 June 16 June 17 June 18
Figure 3: Median sale price in Tasmania regions
Source: REIT Property Update, quarterly reports
TOWARD INFILL HOUSING DEVELOPMENT 12Market indicators continue to identify 7.0
Tasmania as having one of the
6.0
tightest rental markets in Australia.
Vacancy rates have dropped to
5.0
around 1.4% in Hobart since June
Rental vacancy rate
2012 (Figure 4). The average 4.0
(percent)
proportion of household income
spent on rent in Hobart is 28.1%, the 3.0 North West
second highest of any capital city Coast
(Table 4). Table 5 shows the high 2.0 Launceston
number of suburbs across Tasmania
spending more than 25% of their Hobart
1.0
income on rent.
0.0
Rising rents reflect a shortage of
June 12 June 13 June 14 June 15 June 16 June 17 June 18
private rental accommodation, with
increased competition for fewer
houses. Rental demand and costs are Figure 4: Vacancy rates in Tasmania regions (%)
Source: REIT Property Update, quarterly reports
higher in inner city areas, which are
more attractive in terms of access to
work, schools, public transport and
STATE MARCH QTR 2018 % AREAS
other services.
NSW 30.10% 30-35% Hobart, Elizabeth Town,
Escalation in median sale price and Greens Beach, Exton, Cuprona,
rental payments in Tasmania has TAS 28.10% Deep Bay, Kayena, Maydena,
proven positive for owner occupiers Kellevie, Meander, Bellingham,
VIC 23.80% Coles Bay
and investors but has impacted on
housing affordability. For households QLD 23.10% 25-30% Hellyer, Kindred, Falmouth,
on lower-incomes, finding a house Frankford, Huonville, Burnie,
NT 22.50% Leith, Bicheno, De-loraine,
with affordable rental is difficult.
Launceston, Calder, Judbury,
Anglicare’s Rental Affordability SA 22.40% Chigwell, Lebrina, Huntingfield,
Snapshot for 2019, found only Grove, Latrobe, Grindelwald,
22% of listed rental properties ACT 18.50% East Devonport, Clarence
Point, Beauty Point, Devonport,
were appropriate and affordable WA 16.30% Geeveston, Bridport, Golden
for persons on income support Valley, Adventure Bay, Lutana,
payments, while just under half Table 4: Proportion of Family Income Required to Deviot, Forcett, Bellerive,
Meet Rent Payments Lindisfarne, Berriedale,
were affordable for families on the Source: Real Estate Institute of Australia, Housing Cygnet, Kingston Beach, Eggs
minimum wage. Affordability Report, March Quarter 2018 And Bacon Bay, George Town,
Kempton, Cradoc, Campania,
The report also found a 60% Low Head, Austins Ferry, Kings
reduction in listed rental properties Meadows, Lanena, Howrah
since 2013. Table 5: Proportion of Family Income Required to
Meet Rent Payments - Tasmanian Local Govt Areas
Infill housing can play a key role in Source: Real Estate Institute of Australia, Housing
addressing problems of housing Affordability Report, March Quarter 2018
shortage and affordability, increasing
both total available housing stock,
and delivering smaller, more diverse
and more affordable housing options.
TIGHTEST
RENTAL
MARKET
1.4%
Vacancy rate in Hobart
1.9%
Vacancy rate in Launceston
in Australia (May 2019) (May 2019)
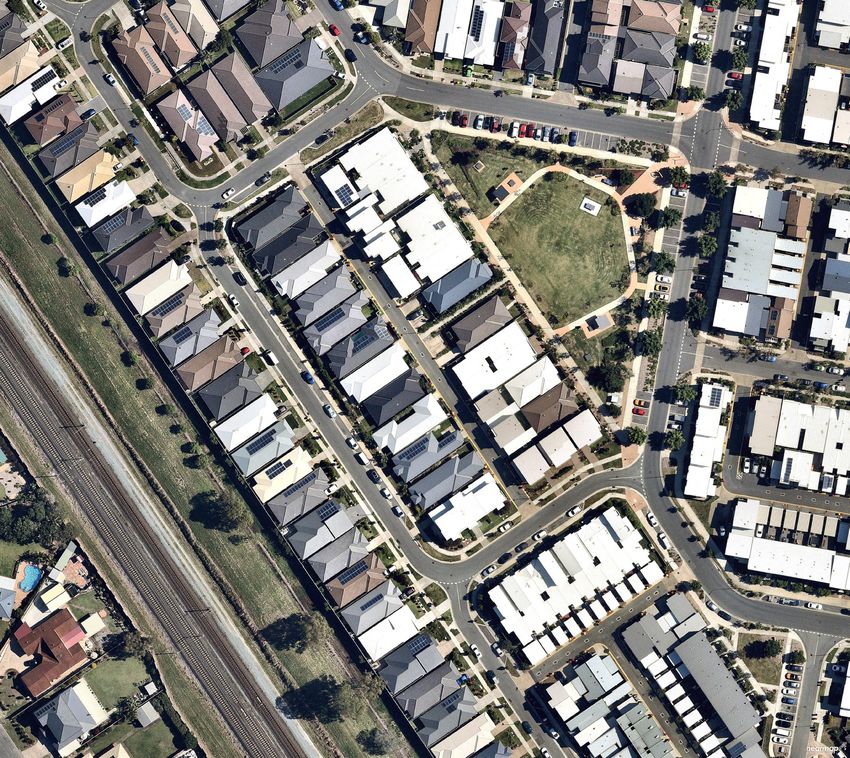
13 TOWARD INFILL HOUSING DEVELOPMENTBALANCING GREENFIELD In Tasmania, this land is often
productive agricultural land and/or
AND INFILL DEVELOPMENT has greenspace and environmental
Australia’s cities are characterised by values. Based on a density of ten
urban sprawl, which has dominated dwellings per hectare, every hundred
residential development patterns for houses delivered as infill would avoid
decades. Tasmania’s urban centres the conversion of ten hectares of
have followed this trend. Separate land.
houses account for 85% of total While housing development on
housing stock in Hobart, and 87% the urban fringe is more costly for
in Launceston, compared nationally governments and the community,
with 66%. it does deliver affordable housing
Figure 5 provides a comparison options and it does support a housing
of medium density housing stock product – single dwellings on a larger
between Hobart and other capital block – which many households still
cities. Smaller capitals, including prefer. From an industry perspective,
Canberra, Darwin and Adelaide all it is also an easier form of housing
have 27-36% of their dwellings as to deliver, with less complexity and
medium density or apartments, lower risks for developers compared
compared to Hobart at only 15%. to more constrained, inner-city sites.
Most interstate metropolitan cities The key for any housing market is
now have infill growth targets of to achieve an appropriate balance
between 60-70% of all new housing. between infill and greenfield housing.
The Southern Tasmania Regional Tasmania’s very high proportion of
Land Use Strategy adopts an infill/ greenfield development suggests a
greenfield ratio of 50/50. It is greater focus on infill opportunities
unclear how the Region is tracking and stronger enforcement of infill
towards this 50/50 target, however, ratios, would be appropriate.
anecdotally and based on the
location of growth across Greater
Hobart, it is reasonable to assume
that development has not moved far
from the original 85/15 ratio since
2010.
Figure 6 overleaf shows building
approvals in Greater Hobart for the
year to April 2019. Nearly all higher
growth areas are located on the
urban fringe, including Kingston,
Margate, Brighton and Sorell. Inner
Hobart recorded a high number of
new dwellings, however a significant
number of these were non-detached
buildings, including units, apartments
and townhouses.
Greenfield development requires
the conversion of large areas of
land, often for low-density housing,
together with the provision of new
and expanded infrastructure to
service new residential areas.
Figure 5: Housing stock in Australian capitals
Source: ABS Table Builder – Dwelling Structure by Greater Capital City Statistical Area (2016)
TOWARD INFILL HOUSING DEVELOPMENT 14Brighton
Sorell
Glenorchy
Hobart
Kingston
Huonville
Figure 6: Building Approvals in Greater Hobart for the year to April 2019. Total New Houses &
Other New Residential
Buildings (2018-19)
0 -10
11 - 30
31 - 50
51 - 70
71 - 158
15 TOWARD INFILL HOUSING DEVELOPMENTWHO IS DRIVING
HOUSING DEMAND
House prices and competition for TASMANIA'S POPULATION Historically, Tasmania’s population
rental properties have increased growth has been driven by natural
significantly in Tasmania’s urban The age and movement of people increase. But with an ageing
centres, particularly Hobart. While the into and out of Tasmania has direct demographic and a median age
factors driving higher demand and implications for housing demand. of 42 years (as at June 2016), the
higher housing costs are complex, predominant source of growth is now
Between 2006 and 2016, the
two market segments are having an interstate and overseas migration.
population of Tasmania increased
impact on total demand and how Interstate migration patterns in
by almost 30,000 residents (2,830
existing houses are being used. particular, tend to be closely aligned
per annum based on estimated
with economic conditions. Periods of
Between 2002 and 2018, the number residential population), at an average
strong economic growth in Tasmania
of international students attending annual growth rate of 0.62%. Growth
have coincided with higher rates of
university or TAFE institutions in was much more prominent over
migration, while weaker periods have
Tasmania increased five-fold. These the first five years (2006 -2011)
resulted in higher numbers of people
students require accommodation. expanding by 4,044 residents per
leaving the state.
Inner-city apartments and houses, annum, which slowed to a more
close to tertiary institutions, subdued rate of 1,614 additional However, migration is also influenced
transport and services, are likely to residents per annum between by a range of other factors,
be most attractive to this group. 2011 and 2016. Since the Census, including individual decision making
estimated residential population and relative conditions in other
In addition, the number of tourists
(ERP) data from June 2016 to June jurisdictions. Accordingly, migration
visiting Tasmania has continued to
2018 shows that trend reversing with patterns are somewhat volatile,
increase. Consistent with broader
significantly increased annual growth creating challenges for service and
market trends, many tourists are now
of over 5,000 persons in 2017 - and infrastructure planning.
seeking short-stay accommodation
6,000 in 2018 or 1.15%, which is the
in private houses. This has led to
fastest growth rate in a decade.
the conversion of some houses
and rental properties to short-stay This increase has not yet been
accommodation, further reducing reflected in significant changes to
housing supply. the typology of housing provision as
might be expected. However, growth
The flow on impact is a complex
is beginning to test the existing
mix of people being forced in and
dwelling mix and density across
out of rental housing, due to an
Tasmania.
inability to purchase, to meet rental
price increases or to find suitable
accommodation as supply reduces.
This ultimately changes the shape
and function of local communities.
TOWARD INFILL HOUSING DEVELOPMENT 16MARKET TRENDS AFFECTING INNER-CITY HOUSING
SUPPLY AND AVAILABILITY
THE IMPACTS OF The Tasmanian Government
recently introduced legislation to
TOURISTS AND VISITOR require people listing short stay
ACCOMMODATION accommodation to demonstrate that
they are complying with existing
In 2018, Tasmania recorded 1.32
1.32M
planning requirements.
million visits, up 4% from 2017. The
number of international visitors The Short Stay Accommodation
increased 11% to 308,800, and Act 2019 delivers a data sharing Tourist visitations in
interstate visitors by 5% to 1.11 partnership with booking platforms 2018
million. Visitor expenditure increased that offer short stay accommodation
by 5 % to $2.46 billion. in Tasmania. The Act applies to both
new and existing property listings in
There has been significant discussion
residential areas, and requires certain
of the role Airbnb and other short
information about the property,
stay accommodation platforms have
including permit numbers, to be
had on Tasmania’s private rental
4%
supplied to the website operator.
market. Currently, there is limited
data on the extent to which private The Act serves two important roles.
houses in Tasmania’s urban centres It ensures that everyone is ‘playing
have been converted from long-term by the rules’ in relation to the current INCREASE
rental to short-stay accommodation. permit requirements for short stay from 2017
The University of Tasmania’s Institute accommodation, and gives a clear
for the Study of Social Change picture of the extent that housing,
estimated that, between 2017 and including former long-term rental
2018, 6% of private rentals in the accommodation, is being used
Hobart LGA were converted to short for short stay accommodation in
stay accommodation. In the eighteen Tasmania.
months to January 2018, it also
estimated that the number of entire
homes in Hobart listed on Airbnb
5,245
increased from 250 to 876.
Despite a lack of data, it is clear
that the popularity of short-stay
accommodation has increased LISTINGS
significantly in Tasmania, reflecting on airbnb
national and global trends,
and that many more visitors to
Tasmania are now using short-stay
accommodation options.
17 TOWARD INFILL HOUSING DEVELOPMENTTASMANIAS STUDENT As of 2018, UTAS had 1,100 available
University supported rooms in
POPULATION Hobart. These rooms are available
In 2018, Tasmania had a total to all international, interstate
student population of just over and regional Tasmanian students
31,500
31,500 students in higher learning studying at the university
institutions and vocational education Over recent years, UTAS has
training. Of this total, 10,300 were purchased a number of inner-city Students in Tasmania
international students, comprising sites for conversion to student
33.7% of all students. This represents
1709
accommodation, including two
a 504% increase in international hotels. It also recently purchased
student enrolments from 2002. the 1.2 hectare K&D site, which
occupies a full city block in central International Students
Hobart currently accommodates
87% of Tasmania’s international Hobart. This site will be redeveloped in 2002
student population (Figure 7). This for accommodation and teaching
10,300
figure is likely to increase as the facilities.
University of Tasmania (UTAS) has Despite these purchases some
indicated it plans to almost double students will need to enter the International Students
its international student enrolments private rental market, which is
across its Hobart and Launceston
in 2018
currently experiencing very high
campuses to 10,000 students. demand. Infill housing provides an
Planned investment in both the opportunity to develop smaller-scale
Hobart and Launceston campuses, housing in the inner-city, which can
which includes relocation of the be adaptable to students and other
existing Launceston campus to an household types (for example, lone
inner-city site, may see even higher person households and younger
growth. workers).
International students have the
option of staying within University-
owned student accommodation, or
504%
entering the private rental market. INCREASE
Unlike local students, they do not
have the option of staying within the
family home.
VET: Vocational Education and Training.
ELICOS: English Language Intensive Courses for Overseas Students.
Non-Award: Refers to enrolement in subjects that do not count toward a degree program.
Figure 7: International student enrolment in Tasmania by institution and SA4
Source: Tasmanian Department of Education and Training – International Student Enrolments International student enrolments by Australian Statistical Geography Standard
(ASGS) SA4 region (2018)
TOWARD INFILL HOUSING DEVELOPMENT 18THE IMPACT OF AN AGEING If suitable housing is available, Although some private sector
downsizing can occur at the earlier providers have begun to develop
POPULATION end of the ageing spectrum, age friendly products specifically
Tasmania’s population is older than allowing the option for empty marketed at downsizers, these
the national average. Between 2006 nesters and those seeking alternate developments tend to be in desirable
and 2016, Tasmania recorded the accommodation to release capital locations and targeted at more
largest increase in median age from and equity by moving into a smaller affluent occupants with prices at the
38.9 to 42 years. dwelling. Economic arguments in upper end of the market. In contrast,
support of downsizing have been those in the lower to middle market
Population growth remains highest in made on the basis that there are (i.e. without high value assets) and
the 65+ age cohort, which increased quantifiable benefits to freeing up those living outside higher value
by 27,600 residents between 2006 family sized housing assets currently areas (such as inner city Hobart) may
and 2016 (Figure 8), followed closely owned or rented by seniors. face very limited choices when it
by the 50 to 64 age cohort (+15,279 comes to downsizing.
residents). In contrast, Tasmania is Downsizing means different things
experiencing population decline in depending on a household’s income,
the 0 to 19 and 35 to 49 age cohorts social background and existing
(i.e. young families). housing situation. Although the term SO WHAT FOR
downsize has an association with TASMANIA?
Much of Tasmania’s new and existing smaller homes, research suggests
housing stock has been designed for many prospective downsizers don’t In Tasmania, a lack of alternate, smaller,
younger families or first home buyers, necessarily envisage a reduction accessible, and low maintenance
that is, detached dwellings on larger housing options may mean older
in their overall living area, which is
lots. This has resulted in a shortage people are unable to transition to
seen as important to support visiting more suitable, independent housing in
of smaller, more accessible housing friends and family, and grandchildren, locations of their choice.
options for older people. but they may require fewer bedrooms
and smaller gardens. This type of The Tasmanian housing market
Ageing in place refers to housing needs to better support downsizing
typologies that support or allow older housing move is also sometimes
opportunities, including at the empty
people to remain in their established referred to as ‘right sizing’.
nester and retiree stages of life.
community, including by staying The Tasmanian housing market has Appropriate downsizer housing types
within their family home, down-sizing been slow to respond to the changing include ancillary dwellings, townhouses
to a smaller dwelling, or relocating to aspirations of downsizers and and houses on small infill or micro lots.
a seniors’ living community. Ageing previous research has highlighted a The provision of more downsizer
in place allows people to retain a particular shortage of general needs housing will free up existing housing
relatively high level of control over housing for downsizing (i.e. homes stock and support the redevelopment
their lives, as they can continue that are not purpose built or age of existing underutilised housing stock.
to live in their existing home or exclusive). Many of these typologies
suburb. Those who are accustomed tend to fall into the missing middle
to satisfying basic needs, such as identified earlier in this report.
shopping, personal care and doctors
in their own neighbourhoods, often
find comfort in being able to manage
these necessities independently.
CHANGE IN AGE COHORT TASMANIA 2006 - 2011 AND 2011 - 2016
-15,000 -10,000 -5,000 - 5,000 10,000 15,000 20,000 25,000 30,000
0-19 -5,276 -290
20-34 1,878 3,035
35-49 -5,541 -3,214
50-64 10,931 4,345
65+ 9,563 18,049
Figure 8: Population growth and decline by age cohort (2006-2011 vs 2011-2016)
2006-2011 Change 2011-2016 Change
Source: ABS Census (2006-2016).
19 TOWARD INFILL HOUSING DEVELOPMENTSOCIAL HOUSING ROLE AND OBSERVATIONS
A lack of affordable housing has the The challenge for Housing Tasmania
greatest impact on vulnerable groups has been to work within the State’s
within society, who are least able to land use planning framework
access the private housing market. to deliver a range of affordable
This includes people on low or fixed housing options, including through
incomes and long-term renters. innovative redevelopment projects.
These groups form a high proportion The introduction of the Housing
of households across Tasmania. Land Supply Act in September 2018
has been important in providing a
Social housing is a critical
more flexible approach to developing
component of any housing market,
affordable housing projects within
particularly during periods of rising
Tasmania. Ongoing planning reform
costs (to buy or rent) and declining
will improve the effectiveness of
supply of affordable housing options.
land release and promote affordable
Housing Tasmania provides housing through a greater array of
affordable and secure housing for housing options.
Tasmanians on low incomes or with
Government-led mandated
special needs who meet certain
spatial planning strategies that
criteria. The extent of Tasmania’s
promote housing affordability,
waiting list for social housing remains
including inclusionary zoning which
an issue. As of December 2018,
identifies percentage targets for
there were approximately 3,233
affordable housing within major
Tasmanians on Housing Tasmania’s
new developments, can be an
Housing Register.
efficient and equitable mechanism
Whether it be for social housing, for encouraging affordable housing
crisis accommodation, subsidised development.
rental or purchasing of new
properties for social housing, the
Tasmanian housing market’s ability to
deliver housing for vulnerable people
is facing significant challenges.
Many mainland states have sought to
provide an increased social housing
stock by delivering more diverse and
compact forms of housing. These
projects tend not to be limited by
standard planning code requirements
or regulatory approval processes.
In Tasmania, affordable housing
developments are required to
follow the same planning processes
applying to the private housing
market, unless it is a site identified
by a Housing Land Supply Order,
which provides a fast-track process
to rezone government owned land for
residential development.
In the absence of mandatory or opt-
in policy targets, affordable housing
will continue to be a low priority for
developers.
TOWARD INFILL HOUSING DEVELOPMENT 20BARRIERS TO
DELIVERY
THE COMPLEX NATURE OF From a developer’s perspective,
greenfield sites are the cheapest
DEVELOPMENT, MARKETS and easiest sites to develop, despite
AND PLANNING the requirement to construct or
extend new infrastructure and
The delivery of new housing carries
services. Land parcels in greenfield
significant risks for developers, who
areas tend to be larger, supporting
must anticipate consumer demand,
economies of scale in development;
secure land, negotiate financing,
land is cheaper and generally vacant;
navigate planning and building
subdivisions and houses can be more
approval requirements, manage the
easily designed to meet planning
construction process and eventually
and building requirements; and there
sell to the market at the price
is reduced likelihood of community
originally budgeted for.
opposition.
These risks are higher for infill
In contrast, most infill housing is
housing, which attracts additional
more costly and complex, reflecting
development constraints, including
the need to develop within existing,
higher land and construction costs,
often constrained urban sites.
and greater difficulty in meeting
Inner-city land prices are higher and
planning and building requirements.
it can be difficult to find suitable
If the risks are too high at any sites, including sites large enough
stage, for either the developer or to support economies of scale.
a third party, such as a bank, the Infill sites are often constrained in
development will not proceed. terms of size or adjacent buildings,
meaning some relaxation of planning
The housing market, particularly and building regulations, such as
for new products, is a supply and carparking spaces and boundary
demand model. Developers must setbacks, is often required. Good
determine, ahead of time, where housing design is more important to
people want to live, what type of ensure houses ‘fit’ the character of
housing they want, and how much an existing area.
they want or can afford to pay.
In 2012, the Australian Housing and
In some instances, demand occurs Urban Research Institute (AHURI)
ahead of supply and these are undertook a comprehensive study
the easiest markets to deliver in, to research and quantify the typical
because sales and location risks barriers to the delivery of infill
are significantly reduced. This type housing within Australia (see Table
of market has occurred in Sydney, 6). The research demonstrates the
Melbourne and Brisbane in recent substantial barriers facing infill
years. development, across all stages of
the development cycle, and these
barriers remain relevant today.
Key barriers as these relate to the
Tasmanian market, are discussed
below.
21 TOWARD INFILL HOUSING DEVELOPMENTMajor Barriers and Hurdles to Infill Housing COMMUNITY RESISTANCE TO
Site Identification »» Supply of suitable sites;
DENSITY
»» Land values;
»» Existing, prescriptive zoning system; and Infill housing provides benefits for
»» Public land availability. both cities – reduced urban sprawl,
better use of existing infrastructure
Site Assembly »» Fragmented ownership;
»» Difficulties in redeveloping strata developments; and services, new community
»» Owners refusing to sell; assets – and households – improved
»» Contamination; and access to employment, schools
»» Land speculation. and public transport, more diverse
Feasibility Appraisal » » Lack of demand for infill housing products; and affordable range of housing
» » High construction costs above three storeys; options. However for some local
» » Extent of revenue required to make development feasible given land communities, the nature and scale
values and construction costs;
» » Unrealistic land value expectations;
of proposed or delivered infill
» » Height and density restrictions; housing can generate opposition and
» » Developer contributions to infrastructure both cost and uncertainty; concern. These concerns include
and overcrowding, overshadowing, local
» » Cost and availability of finance.
traffic congestion and changes to the
Development » » Duration and uncertainty of approval process; ‘character’ of an area.
Approval » » Complexity of approval process;
» » Community opposition at strategic and development approval Often, these concerns reflect a lack
stages; of understanding regarding infill
» » Extent of environmental approvals; development, past poor experience
» » Infrastructure cost and capacity; and
» » Uncertainty when dealing with infrastructure providers.
with infill developments, and a
broader lack of awareness regarding
Development »» Required loan to value ratios; different housing products.
Finance »» Lack of funds available, particularly to smaller developers;
»» Banks’ risk mitigation strategies; Infill development needs to be
»» Securing necessary pre-‘sales’ to prove to banks there is a market consistent with the character of
for the product; and
» » Structure of joint venture agreements not providing an exit strategy a suburb, and add to the qualities
for banks. of a site and area. Poorly designed
infill development is a key issue
Construction » » Construction costs especially when building over three storeys;
» » Availability of labour—competition from other sectors; within the Tasmania market. In the
» » Flexibility of labour—lack of skills to deliver projects above two past, developers have attempted to
storeys; and fit oversized and poorly designed
» » Infrastructure contributions—charging structures. dwellings into backyards, sometimes
Sales »» State of the residential market—owner purchaser, investor and resulting in significant loss of
private rental market; amenity for neighbouring properties.
» » Strength of overseas demand—particularly for new apartments and
pre-‘sales’; and Demonstration projects are important
» » General economic conditions. in showing communities what good
Table 6: Major barriers and hurdles to infill housing
quality infill housing looks like and
Source: AHURI, 2012 how it can be effectively integrated
into a local area. Demonstration
projects have proven to be an
effective tool in the South East
Queensland context, highlighting
a range of missing middle housing
options. This approach is also
important in demonstrating that
change through infill housing can be
incremental, and achieved without
undermining the core fabric or
character of a suburb.
TOWARD INFILL HOUSING DEVELOPMENT 22Infill housing increases the would see new and upgraded detached houses and smaller scale
population of a local area and can services and facilities delivered in townhouse projects. Due to the
generate impacts if not appropriately advance of the 'impacts' of density. size of the state, there are fewer,
managed. Therefore, it is important This is critical to build community large-scale developers willing and
that infill housing strategies include support for infill development. financially able to fund and deliver
provision for new and upgraded Mechanisms to fund and facilitate the larger and arguably more risky infill
infrastructure and facilities to early delivery of new infrastructure projects in Tasmania.
support local communities, including such as parks and communal
The opportunity exists to enable
parks, local road improvements and facilities should be explored, as well
smaller developers and builders
streetscaping. as any opportunities to leverage
to move into the delivery of
charging to incentivise infill over
A master plan or specific area plan smaller-scale infill housing. This
greenfield development.
provides the opportunity to integrate will complement larger developers
new infill housing with supporting who are focused on larger unit style
infrastructure and facilities.
DEVELOPMENT CAPABILITY projects, and ensure those projects
Tasmania’s housing market is very are not the only form of infill being
MORE EFFICIENT traditional in its product makeup delivered.
INFRASTRUCTURE and buyer demands. Detached Increasing the number of builders
PLANNING AND DELIVERY houses located on greenfield sites in this space, as seen in larger,
continue to make up the majority interstate markets, promotes
Tasmania’s current approach to of the market. Until recently, in the competition and tends to result in
settlement planning is largely absence of high growth, there has greater innovation and pioneering
reactive. Regional Land Use been no pressure to facilitate infill products, as businesses compete for
Strategies, which provide frameworks housing development or promote a market share and differentiation.
to guide development in Tasmania’s wider range of housing typologies.
three regions, have had only a limited However, as Tasmania’s population A pilot housing demonstration
impact in effectively managing a grows and its demographics change, precinct or display village will help to
sustainable settlement pattern. a more diverse range of housing build capacity in the housing sector
Significant areas of land on Hobart typologies will be required. and de-risk some of the market
and Launceston’s urban fringe, in aspects of delivering more infill
The housing market is a supply and housing.
competing locations, continue to be
demand model and developers need
re-zoned for residential development. An industry study tour of smaller,
to determine ahead of time, where
The release of land in comparatively best practice and affordable infill
and what type of housing people
better located areas within Hobart, development interstate would
want. Developers are rarely rewarded
Glenorchy and Launceston has not promote innovative housing
for taking risks. For example, building
occurred. typologies and enhance interest
a product in a location that the
Currently, Tasmania has an overly market has yet to demonstrate a in delivering smaller infill housing
simplified model for the collection of desire for, often results in slow sales solutions in Tasmania. It is hoped
contributions towards the delivery or lower sale prices. While greenfield that lower tier developers and
of infrastructure. Response times for development is meeting a current constructors will then actively look
the approval and delivery of works need, it is unlikely to provide for at incremental infill as a viable
by utility providers, and a lack of future, more diverse market needs. development option, having seen
coordination of funding and charging An ageing population will demand tangible evidence of its success.
for infrastructure, are issues for more, likely smaller houses, in
developers. established urban areas near services FUNDING AND FINANCE
and transport. Younger generations
Tasmania needs to better integrate The big four Australian banks and
about to enter the home ownership
its settlement and infrastructure their subsidiaries have dominated
phase are demonstrating a desire for
planning, ensuring infrastructure the development finance market
a more urban experience.
networks are planned and designed in Australia's post global financial
to meet forecast growth, and that Consultation with the development crisis (GFC) climate. Similar to many
the distribution of this growth sector as part of this project other regional Australian markets,
is coordinated at a metropolitan confirmed that there is community the willingness of banks and lenders
level. Regional Land Use Strategies demand for a broader diversity of to fund or take on any development
provide the appropriate framework product, as evidenced in strong sales risk in the Tasmanian market, is very
to achieve this. Future reviews when medium density infill products limited.
of the Strategies should seek to do come to market.
Banks have been forced to reassess
strengthen the underlying data, and
The Tasmanian housing and their view on loan risk, which has
analysis informing planning, and
development sector largely resulted in a preference to fund
better integrate infrastructure and
comprises small to medium scale completed products over new builds
settlement planning, particularly
enterprises owned and based in or ‘off the plan’ developments, due to
within urban centres.
Tasmania. This sector delivers the the reduced risks associated with an
For infill housing, this approach balance of development, usually existing product.
23 TOWARD INFILL HOUSING DEVELOPMENTYou can also read