Affordable housing strategy - city of lacey - november 15, 2018
←
→
Page content transcription
If your browser does not render page correctly, please read the page content below
city of lacey
 affordable housing strategy

november 15, 2018
acknowledgments

acknowledgments
City Council
 Andy Ryder, Mayor
 Cynthia Pratt, Deputy Mayor
 Councilmember Jason Hearn
 Councilmember Lenny Greenstein
 Councilmember Michael Steadman
 Councilmember Rachel Young
 Councilmember Carolyn Cox

Planning Commission
 Paul Enns, Chair
 Sharon Kophs, Vice-Chair
 Eddie Bishop
 Peg Evans-Brown
 Michael Goff
 David Lousteau
 Mark Mininger
 Catherine Murcia
 David Wasson

City of Lacey Staff
 Scott Spence, City Manager
 Jacob Ewing, Assistant to the City Manager
 Rick Walk, Community & Economic Development Director
 Ryan Andrews, Planning Manager
 Jessica Brandt, Associate Long-Range Planner, Project Coordinator
 George Smith, Economic Development Coordinator
 Donna Feliciano, Communications Specialist

                                                      city of lacey affordable housing strategy
table of contents

                      table of Contents
    introduction										1
    Lacey housing market							5
    Market-Rate Homes										6
    Lacey’s Housing Inventory										7
    Housing Development Trends: Permits Issued 							8
    Number of Lots in Development Pipeline							9
    income & lacey employment market			               10
    Incomes												10
    Real People Examples										11
    Single-Parent Household with Child(ren)							17
    Renting versus Home Ownership									17
    residents without permanent housing			            18
    Homeless Census											20
    Homeless Students											21
    Lacey’s Homeless Support Services								22
    looking ahead									24
    2016 Comprehensive Plan Economic Forecasts							24
    Household Size in Lacey										25
    programs supporting affordable housing            26
    Current Programs											26
    what more can lacey do?						30
    Policies 												31
    Potential Actions											33

city of lacey affordable housing strategy
table of contents

                                         list of tables
Table 1. Low-Income Categories											2
Table 2. In-Migration to Thurston County from More-Expensive Areas 2015-2016					                       3
Table 3. Connection Fee Comparison										4
Table 4. Thurston County Fair Market Rates 									                                                    5
Table 5. City of Lacey Average Rental Prices (actual) 2017-2018							                                  5
Table 6. Projected Number of Dwelling Units for Lacey and UGA							                                    7
Table 7. Housing Affordability for Retail Clerks in Thurston County							                              11
Table 8. Housing Affordability for Office Clerks in Thurston County							                              12
Table 9. Housing Affordability for Laborer, Freight, Stock & Materials Mover in Thurston County			      13
Table 10. Housing Affordability for Teachers in Thurston County							                                  14
Table 11. Housing Affordability for Registered Nurses in Thurston County						                          15
Table 12. Housing Affordability for Military - Corporal E-4 in Thurston County					                     16
Table 13. Housing Affordability for Military - Captain in Thurston County						                         16
Table 14. Housing Prices to Income Comparison, Thurston County 2000-2016					                           17
Table 15. 2017 Community Development Block Grant Allocations							                                     22
Table 16. Existing Programs Summary: Assistance to Residents							                                     27
Table 17. Existing Programs Summary: Direct/Indirect Support to Public & Private Developers				         28
Table 18. Existing Programs Summary: Regulations/Incentives Encouraging Affordable Housing Development  29
Table 19. Action 1: Cut/Reduce Fees for Nonprofits Building Affordable/Low-Income Housing				           33
Table 20. Action 2: Expand Multi-Family Tax Exemptions to More Parts of the City					                   34
Table 21. Action 3: Provide City-Owned Land to Nonprofits to Build Units						                          35
Table 22. Action 4: Use County Recording Fees to Support Homeless Services						                        35
Table 23. Action 5: Set Aside a Higher % of City’s General Fund for Community Investment Partnerships		 36
Table 24. Action 6: Reduce Fees for Private-Sector Development of Affordable Homes & Units				          37
Table 25. Action 7: Reduce Min. Lot Size Requirements & Increase Zoning-Density Mins.				               37
Table 26. Action 8: Update Codes to Support Temporary Housing							                                    38
Table 27. Action 9: Require New Low-Income Rentals to Remain Low Income in Perpetuity				               38
Table 28. Action 10: Further Streamline Accessory Dwelling Unit (ADU) Permitting					                   39
Table 29. Action 11: Require Inclusionary Zoning in Designated Areas						                              40
Table 30. Action 12: Support a Regional Approach to a Housing Levy						                                41
Table 31. Action 13: Infrastructure Investment for Infill Areas Needing Upgrades					                   42

                                        list of figures
Figure 1. Housing Demand Types											2
Figure 2. Lacey Rent Index											5
Figure 3. Lacey Market Overview											6
Figure 4. Multi-Family Housing Units - City of Lacey								                        8
Figure 5. Single-Family Homes - City of Lacey 									                             8
Figure 6. Percent of Jobs in Thurston County Within Different Salary Ranges 						  17
Figure 7. Thurston County Point In Time (PIT) Homeless Counts 2006-2018						       18
Figure 8. Thurston County Students Homeless & Free Lunch by District 2016-2017					 21

                                                        city of lacey affordable housing strategy

introduction

introduction
Lacey is in the midst of an affordable housing crisis, and the City is not alone.
According to data provided by the Washington State Department of
Commerce, there are an estimated 14,000 households in Thurston County
that are currently cost burdened in their rental unit and an additional 19,000
households that are cost burdened as owners. That means nearly 1 in 3
Thurston County households spend more than 30 percent of its income on
housing. Typically portrayed in the media as a Seattle or King County issue,
housing affordability has been pushed to the
forefront as housing costs in more-expensive
markets have pushed buyers farther afield,
                                                          Nearly 1 in 3 Thurston
including to the local Thurston County market.          County households spend
However, that is not the whole story. Many                   more than 30% of its
factors influence housing affordability such as
employment, wages, unintended social issues,                  income on housing.
and internal/external market factors.
This strategy
document will expand
on the factors listed
above that influence
the housing dilemma
and identify strategies
the City can take to
reduce the effects
of the housing
affordability issue.

To help solve the
housing crisis, the
City and our partners
need to create more
housing options for
our residents.

                                                   city of lacey affordable housing strategy • 1
introduction

 30-percent Rule               What is Affordable
 Explained
 The conventional public
                               Housing?
 policy indicator of hous-
 ing affordability in the      Affordability is relative. A middle manager at an investment firm can afford
 United States is the per-     a $1,500/month one-bedroom unit. However, to a Starbucks barista, this is
 cent of income spent on       completely out of reach. Generally, the rule of thumb is:
 housing. The 30 percent
 rule of thumb evolved
                               Housing costs should account for no more than              Rule of Thumb:
                               30 percent of your income. However, the mortgage
 from the United States                                                                   Housing costs should
                               industry applies the 28/36 rule. (See sidebar for
 National Housing Act of                                                                  account for no more
 1937. This act created        details.) The region provides a limited supply of
 the public housing pro-       workforce market rate and subsidized housing to            than 30 percent of
 gram. The program was         help its residents stay within that 30-percent limit.
 designed to serve fami-
                                                                                            your income.
 lies in the lowest income
                               Access to this subsidized housing is also tied to the
 group. The program es-        amount of money you or your family earns relative to
 tablished income limits,      what is known as the Area Median Income (AMI).
 rather than maximum           In 2016, Lacey’s household AMI was $63,286. According to the Federal
 rents, to determine if a
 family qualified to live in
                               Department of Housing and Urban Development (HUD), household earning
 public housing.                                                                    less than 30 percent AMI are
                                TABLE 1. Low-Income Categories                      considered Extremely Low
 Although this rule of
 thumb was created for                 LOW-INCOME CATEGORIES                        Income; 30-50 percent AMI are
 public housing, today                                                              Very Low Income; and 50 to 80
                                  Earnings %             Income          Income     percent are regular Low Income
 it remains the most                of AMI*               Range         Category
 commonly accepted                                                                  (Table 1). Anyone who falls
 standard of affordability          50-80%          $31,643 - $50,629      Low      into one of these three low-
 for all types of housing.          30-50%          $18,986 - $31,643    Very Low   income categories qualifies
                                                                                    for public housing through the
                                 less than 30% less than $18,986      Extremely Low
                                                                                    Housing Authority, or for other
 28/36 Rule                     *AMI = Area Median Income
                                Lacey’s 2016 Household AMI = $63,286
                                                                                    non-profit housing programs.
 Explained
 Mortgage lenders use
 a stricter standard. The      Affordable housing demands range from
 28-36 rule states that a      a small number of people who need
 household should spend        subsidized social housing to a much
 no more than 28 percent       larger number of households that need
 of its gross monthly          lower-priced workforce housing to rent
 income on total housing       or purchase (Figure 1, page 3). Virtually
 expenses and no more
 than 36 percent on all
                               all of these households can also benefit
 debt including                from living in an accessible location with
 housing-related               relatively low transportation costs.
 expenses and other
 recurring debt service.

2 • city of lacey affordable housing strategy
introduction

FIGURE 1. Housing Demand Types*

                            Social Housing
                      Emergency Shelters: Short-term housing for
                                                                                                                   The demand for all
                     homeless people.                                                                            of these housing types
                 Transitional Housing: Medium-term housing for                                                       is outstripping the
                previously homeless or addicted people.
                                                                                                                      supply, especially
              Subsidized Housing: For people with special needs.
                                                                                                                    workforce housing.
               Workforce Housing
        Affordable Rental Housing: For low- and medium-
      income households.
   Affordable Home Ownership: For purchase by low-
  and medium-income households.

* Evaluating Affordable Housing Development Strategies, Todd Litman, 03/26/16, www.planetizen.com)

what is contributing to housing
unaffordability?
The short answer is that the need for housing is outstripping the amount available. While our job growth
and economy look great on paper, it created a demand for new housing faster than what is being built,
and the high-demand/low-supply is displacing many cost-burdened and very-low-income residents. More
specifically, in the past few years the number of jobs in our region grew 20 percent and housing only grew
14 percent.
People are moving here from higher-priced markets due to:
 • A healthy economy and quality of life.
 • Relative affordability compared to the much more expensive areas in the Central Puget Sound Region.
 • Ease and willingness to commute.
Of the 7,468 households that migrated into Thurston County in 2015-2016, 62% moved from areas where
real estate costs were higher than Thurston County (Table 2). This trend is consistent with Thurston County’s
outbound commute patterns, however cannot be directly connected.

 TABLE 2. In-Migration to Thurston County from More-Expensive Areas 2015-2016
                        Total Households               Members of               Central Puget   Beyond Central      Other Areas
                          In-Migration                 Households                  Sound         Puget Sound
     Totals                    7,468                      14,711                    3,200           1,425              2,023

  Percentage                   100%                        100%                     43%              19%                38%
Source: https://www.irs.gov.statistics/soi-tax-stats-migration-data-2015-2016

                                                                          city of lacey affordable housing strategy • 3
introduction

New housing isn’t being built as fast as it is needed. Why?
These development costs also play a role in rising home prices. Increasing:
 •   Land-acquisition costs; especially as large developable greenfield
     parcels have been acquired for development.
 •   Construction costs such as cost and availability of labor, and
     increasing costs of building materials.
These factors also impact development costs but, may not be as
commonly considered by people outside the development community.
 •   Impact fees for schools, streets, and parks.
 •   Connection fees for water, and especially sewer.
 •   Interest rates.

Impact Fees
Cities impose impact fees on property developers for new infrastructure that must be built or increased,
due to new property development. These fees off-set the impact of additional development and residents,
on the city’s infrastructure and services which include the city’s water and sewer network, police and fire
protection services, schools, and libraries.
At times, developers view impact fees as a disincentive because the fees can significantly raise the cost of a
large construction project.

Connection Fees
Developers must pay utility connection fees prior to beginning construction (Table 3). They do not
recover these fees until a home is sold or apartments are rented. Since the construction time for a
single-family home is much shorter than a 100-unit building, the developer will recover these costs much
quicker. The higher development cost and much longer construction time for the larger building mean that
the builder’s invested equity and interest-accruing borrowed funds are tied up for a longer period of time.
This is an example where time truly is money. When considering the economic feasibility of a project,
especially an apartment building where substantial amounts of capital are tied up for long periods of time,
the longer time-frame represents greater risk. If the risk is too high, developers may choose other
investment opportunities, with similar or even
lower risks.                                            TABLE 3. Connection Fee Comparison
                                                         Type of       Number of Approximate       Relative Fee-
If the project expenses, including connection                                    Connection Fee   Recovery Time
                                                       Housing Unit      Units
fees, are too high, too early in the process, or
both, it can make the development financially          Single-Family
                                                                           1         $16,700          Short
                                                          Home
unfeasible. In a rising interest rate environment,
this makes those costs, even more burdensome.            Multi-Unit
                                                                          100        $757,000         Long
                                                         Building

Interest Rates
Over the last 17 years, borrowers have benefitted from low interest rates. However, the recent upward trend
in interest rates affects borrowers at every step in the housing-development process (developers, builders,
contractors, sub-contractors, homebuyers, and landlords). This means it will be more expensive to build
housing of all types, therefore, more expensive to buy or rent. Ultimately, low-income homebuyers and
renters will have fewer housing options.
4 • city of lacey affordable housing strategy
1. Lacey Housing Market
Chapter 1.
Lacey housing market
Market-Rate Rentals
Rental prices have TABLE 4. 2018 Thurston County Fair Market Rates (FMR) as defined by HUD
increased steadily over Efficiency One- Two- Three- Four-
the past few years. From Year FMR
(Studio) Bedroom Bedroom Bedroom Bedroom
2017 to 2018, prices for all
2018 $852 $904 $1,120 $1,629 $1,973
types of units increased
by 5-10% and have 2017 $784 $866 $1,071 $1,559 $1,887
surpassed what Housing % Increase 8.67% 4.39% 4.58% 4.49% 4.56%
and Urban Development
(HUD) guidelines define as Source: www.huduser.gov
“Fair Market Rate” (Tables
4 and 5). TABLE 5. City of Lacey Average Rental prices (actual) 2017-2018
Although HUD considers Income
Type of Unit Rental Price
Needed
inflation in their annual fair
market rate calculations, One-Bedroom $1,000 $40,000 - single renter
rents have increase faster $29,000 - shared by 2 people
than they calculated. HUD Two-Bedroom $1,475
$58,000 - single renter
calculates the fair market
*The income figure is based on 30% of gross monthly income used to cover housing cost.
rate at the 40th percentile
of gross rents for typical,
non-substandard rental units occupied by recent movers in a local housing market. (For details on how HUD
calculates fair market rates, visit: https://www.huduser.gov/periodicals/USHMC/winter98/summary-2.html.)
FIGURE 2. Lacey Rent Index Zillow
city of lacey affordable housing strategy • 51. Lacey Housing Market
Cost-Burdened Market-Rate Homes
Renters Home buyers, especially first time buyers, Thurston County has only
According to the struggle to enter the market because of how
Washington State quickly prices have increased. A healthy 1.3 months of inventory
Department of
Commerce’s 2015
market has about six months worth of for homes priced under
Washington State
housing inventory. However, according to $450,000.
Housing Needs Don Manzer of Virgil Adams Real Estate, Inc.,
Assessment prepared Thurston County has only 1.3 months of
for Thurston County, inventory for homes priced under $450,000.
more than 14,000
households are cost-
According to the The Olympian article “Brace yourself: Thurston County homes
burdened or severely are selling faster than last year,” many homes are taking an average of 9 days to
cost burdened sell, compared to 15 days in 2017. During the last market peak in 2006, houses
(spending between were on the market for an average of 43 days.
30% and 50% of their
monthly income on Boone, Rolf. “Brace
rent). Thurston County yourself: Thurston
has about 19,270 low- County homes are selling
faster than last year.” The
income renter house-
Olympian,
holds and about 3,838 May 3, 2018. Retrieved
subsidized housing from http://www.the
units in 70 sites. A olympian.com/
majority of these units article210623004.html
are located in Olympia.
(http://www.commerce.
wa.gov/wp-content/up-
loads/2016/10/AHAB-needs-
urban-Oly-Lacey.pdf)
FIGURE 3. Lacey Market Overview Zillow
6 • city of lacey affordable housing strategy1. Lacey Housing Market
Lacey’s Housing Inventory Thurston County
Housing:
It is important to have a clear picture of Lacey’s available housing stock to
understand current and future housing needs. According to data from
The Problem
Thurston Regional Planning Council (TRPC), in 2017, Lacey had an estimated • Recent population
21,030 housing units, with an additional 13,880 units within the unincorporated growth equates to the
Urban Growth Area (UGA), for a total of 34,910 units within the entire Lacey need for over 2,000 new
UGA. The vast majority of housing units in the City and UGA, a total of 67 housing units per year.
percent, are single-family detached homes. Another 9,160 units, or 26 percent • Over the last six years,
of the total, are multi-family units, and the remaining 2,290 are manufactured we’ve been short by an
homes, accounting for 6.5 percent of housing units. average of 600 units per
year countywide.
Based on population estimates for Thurston County and the Buildable Lands
• Household size is
Report, TRPC developed a forecast for housing for the UGA. This study forecasts
getting smaller,
housing development and allocation over five-year increments. Table 6 requiring more units
shows the forecasted number of dwelling units needed to accommodate the than before.
projected population for the City and UGA to the year 2035. With 33,060
• This shortage has led
residential units located within Lacey’s UGA in 2015, it is anticipated that an to vacancy rates
additional 12,220 new units will be needed during the upcoming twenty-year below 3% for several
planning period. It is projected that over 60 percent of the dwelling units years (many vacant
constructed over the planning period will be located in the unincorporated units aren’t rent ready,
portions of the UGA. further shrinking
supply).
TABLE 6. Projected Number of Dwelling Units for Lacey and UGA (Thurston Thrives, Housing
(2016 Lacey Comprehensive Plan) Action Team, Incentivized
2020 2025 2030 2035 Housing - Regional Housing
Summit II)
Lacey 21,480 22,290 23,000 23,470
UGA 15,540 17,660 19,910 22,090
Total 37,020 39,950 42,910 45,560
city of lacey affordable housing strategy • 71. Lacey Housing Market
Housing Development Trends: Permits Issued
Until recently, the majority of new housing permits issued were for single family homes. In 2016 the City saw
an uptick in multi-family housing and that trend is continuing. Multi-family housing helps provide one and
two-bedroom rental units that are in high-demand. (Figures 4 & 5).
FIGURE 4. Multi-Family Housing Units City of Lacey
700 681
600
500 as of
10/31/18
400 381
300 269
225
200
100
85
58
16 2 20 6 11 5 2
0 0 0 0
0
2002 2003 2004 2005 2006 2007 2008 2009 2010 2011 2012 2013 2014 2015 2016 2017 2018
FIGURE 5. Single-Family Homes City of Lacey
1400
1200
1200
1000
836 807
800
600
as of
400 338 314 307 333 10/31/18
298 267 287
256
222 219 213
180 172 *
200 101
0
2002 2003 2004 2005 2006 2007 2008 2009 2010 2011 2012 2013 2014 2015 2016 2017 2018
*2018 Numbers do not include permits issued by Thurston County in recently annexed new development
8 • city of lacey affordable housing strategy1. Lacey Housing Market
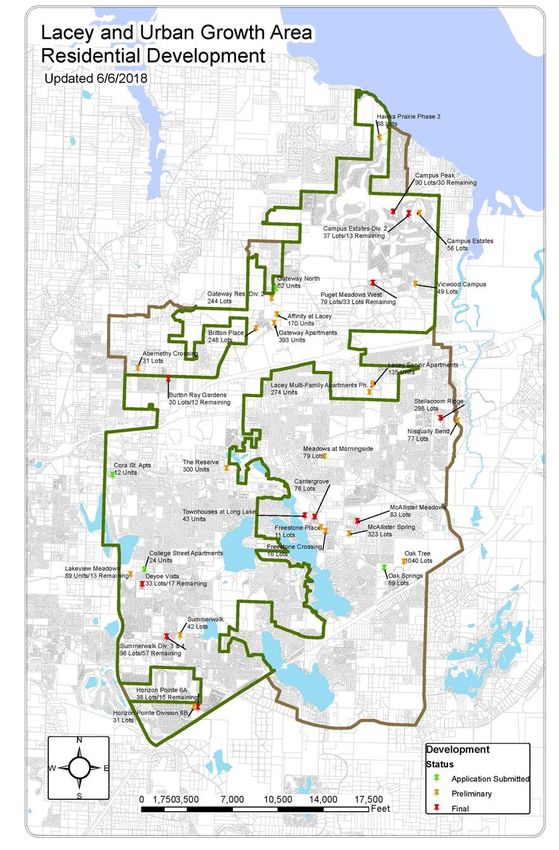
Number of Lots in Development Pipeline Development
Pipeline
More multi-family
housing has been
developed in Lacey the
last year and more will
be available in Lacey in
the next few years.
Applications Submitted:
190
Preliminary Plat
Approved:
3,570
Final Plat Approved:
677
Total in Pipeline:
4,437
About 20% are Rental
Units, not Single-Family
Home Lots.
Despite Lacey’s new
housing growth,
demand is still
outpacing supply.
city of lacey affordable housing strategy • 92. income & Lacey employment Market
Income Equation Chapter 2.
The income equation
is on the other side
income & lacey
of the housing
affordability issue. employment market
Housing is neither
affordable nor
unaffordable without
Incomes
the context of wages
available to rent Although low income people are working hard, they still don’t earn enough to
or buy them. rent even a modest one bedroom apartment. The average full-time, 40-hour-
a-week worker making minimum wage would need to earn more than $20 an
hour to afford a modest one-bedroom apartment by today’s standards. This
chapter looks at real life jobs in Thurston County, how much they earn, and how
much apartment or house they can afford at that income.
The following wage information is based on best available data with
professional judgment applied at the local level. There is no data available
from the U.S. Government’s Bureau of Labor Statistics at the city level, only
the county level. There is a timing difference between the most recent available
data for local housing costs (summer of 2017, with adjustment to recognize
local appreciation since then) and local wage rates (2015-2016). An estimate
could be made based on the average increases in wage rates in the
intervening years; however, those averages would be based on national
data rather than changes in Thurston County.
Therefore, because the
numbers presented here
may understate current
income, the numbers
for housing affordability
may be somewhat
pessimistic. Another
assumption that is
difficult to quantify is
how many 2-person
households earn the
same amount of money.
The assumption is that
they earn about the
same for the following
calculations of
affordability of 2-person
households.
10 • city of lacey affordable housing strategy2. income & Lacey employment Market
Real People Example: Retail Clerk Thurston County
Retail Clerks
The job title “retail clerk” is the single most prevalent job title in Thurston
County, with 3,640 out of 92,790 jobs (3.3%). Retail clerk positions share similar Average Annual Income:
job duties and pay with a number of other comparable job titles. The average $24,620
retail clerk in Thurston County earns $24,620 per year. A retail clerk is one of
the 42 out of 314 job titles (13%), and one of 20,280 jobs out of 92,790 (22%) Percent of Thurston
County Job Market:
that cannot afford housing on their own. The 3.3%
average retail clerk earns 83 percent of the The average retail clerk
necessary income to afford to share the average earns 83% of the necessary
two-bedroom apartment with another person
in the same job title earning the same income. income to afford to share
Though certainly vulnerable to rent increases, the average two-bedroom
they may be able to find a rental to share for less apartment with another
than average rent.
person in the same job title
It should be noted that, since the time these
wage rates were gathered, Wal-Mart Stores has
earning the same income.
announced that they are
raising their wage rates. With
two supercenters, and one
neighborhood grocery store,
Wal-Mart is a major employer
of these sorts of positions in
Thurston County, so this may
take some of the financial
pressure off people in this job
classification.
TABLE 7. Housing Affordability for Retail Clerks in Thurston County
(based on average annual income of $24,620; $11.84/hr)
Two-
1st Time One-
Existing Bedroom
Home Bedroom
Home Buyer Rent
Buyer Rent
(shared)
Alone - percent of housing cost
34% 34% 62% N/A
they can afford
Alone - maximum housing
$80,000 $68,000 $615/mo. N/A
amount they can afford
2 Earners - percent of housing
62% 62% 123% 83%
cost they can afford
2 Earners - maximum housing
$175,500 $148,000 $1,231/mo. $1,231/mo.
amount they can afford
city of lacey affordable housing strategy • 112. income & Lacey employment Market
Thurston County Real People Example: Office Clerk
Office Clerks There are 2,950
Average Annual Income: positions with the title
$33,170 office clerk in Thurston
County, representing
Percent of Thurston 2.7 percent of the 92,790
County Job Market: jobs listed by title. Office
2.7%
clerk is at the lower end
of the pay scale of a
whole family of office
jobs. It is included in this
study due to the large
number of employees in
this family of jobs, which
with increasing skill
levels and experience, offers a career path. An office clerk earning the average
wage for the position in Thurston County earns 112 percent of the necessary
income to share a two-bedroom apartment with another person in the same
job category and wage rate. With
another earner in the household An office clerk earning the average wage
may be able to purchase a home.
for the position in Thurston County earns
112% of the necessary income to share a
two-bedroom apartment with someone in
the same job category and wage rate.
TABLE 8. Housing Affordability for Office Clerks in Thurston County
(based on average annual income of $33,170; $15.95/hr)
Two-
1st Time One-
Existing Bedroom
Home Bedroom
Home Buyer Rent
Buyer Rent
(shared)
Alone - percent of housing cost
43% 43% 83% N/A
they can afford
Alone - maximum housing
$120,500 $105,000 $829/mo. N/A
amount they can afford
2 Earners - percent of housing
85% 91% 166% 112%
cost they can afford
2 Earners - maximum housing
$245,000 $225,000 $1,659/mo. $1,659/mo.
amount they can afford
12 • city of lacey affordable housing strategy2. income & Lacey employment Market
Real People Example: Laborer, Freight, Stock, Thurston County
Laborer, Freight,
& Materials Mover (Hand) Stock, &
Lacey, and all of Thurston County, Materials Movers
is home to a large number of (Hand)
warehouse and distribution
facilities. This continues to grow, Average Annual Income:
$31,940
particularly in northeast Lacey,
with more than 2.5 million square Percent of Thurston
feet either just coming on board, County Job Market:
or in development. As with retail 1.43%
and office clerks, there are an array
of positions in this field. The most
prevalent single job title is
laborer, freight, stock, and materials mover (hand). This is also at the bottom
tier of these positions with a career path. While a person earning the average
income in this job title would not be able to
afford to purchase the average home, or rent Two new employers in this
the average apartment on his/her own,
the worker would have 108 percent of the
field have begun moving into
necessary income to share a two-bedroom Lacey. Both pay above the
rental with another person in the same job current market for these
with the same income.
positions: approaching
Following the gathering of these numbers, $50,000 per year.
two new employers in this field began moving
into Lacey. Both pay above the current market
for these positions: approaching $50,000 per year. A worker earning this wage
could easily afford a shared rent (170% of needed income), or an individual rent
(125% of needed income.) With another earner, a home purchase is possible.
TABLE 9. Housing Affordability for Laborer, Freight, Stock, & Material Movers in Thurston County
(based on average annual income of $31,940; $15.36/hr)
Existing Home 1st Time One-Bedroom Two-Bedroom
Buyer Home Buyer Rent Rent (shared)
Alone - percent of housing cost they can afford 38% 41% 80% N/A
Alone - maximum housing amount they can afford $110,000 $100,000 $799/mo. N/A
2 Earners - percent of housing cost they can afford 83% 89% 160% 108%
2 Earners - maximum housing amount they can afford $240,000 $222,000 $1,597/mo. $1,597/mo.
city of lacey affordable housing strategy • 132. income & Lacey employment Market
Thurston County Real People Example: Teacher
Teachers As with the other positions, the job title of teacher falls into several categories.
Average Annual Income: For these numbers, we are using the average of both middle-school teachers,
$65,700 and elementary-school teachers. There are a variety of specialized, special-
education teachers as well as specialties, such as math and science, that earn
Percent of Thurston more.
County Job Market:
2.7% Combined, middle- and elementary-school teachers account for 1,140 of the
92,790 jobs listed individually in Thurston County (2.7%). Teachers earning an
average of $65,700 may have sufficient earnings to purchase a lower-priced
home on their own, or rent on their own (164% of needed income), or rent with
another person with similar earnings (223% of needed income). With another
earner of similar income, they have sufficient income to afford to purchase a
home costing well above the median price.
TABLE 10. Housing Affordability for Teachers in Thurston County
(based on average annual income of $65,700; $31.59/hr)
Two-
1st Time One-
Existing Bedroom
Home Bedroom
Home Buyer Rent
Buyer Rent
(shared)
Alone - percent of housing cost
83% 91% 164% N/A
they can afford
Alone - maximum housing
$255,000 $225,000 $1,643/mo. N/A
amount they can afford
2 Earners - percent of housing
173% 173% 329% 223%
cost they can afford
2 Earners - maximum housing
>$500,000 >$425,000 $3,286/mo. $3,286/mo.
amount they can afford
Teachers earning an
average of $65,700 may
have sufficient earnings to
purchase a lower-priced
home on their own, or rent
on their own, or rent with
another person with similar
earnings.
14 • city of lacey affordable housing strategy2. income & Lacey employment Market
Real People Example: Registered Nurse Thurston County
As with the other positions, the job title of nurse falls into several categories.
Nurse
For these numbers, we are using the average of registered nurses. There are a Average Annual Income:
variety of specialized nurses and those who earn more with certifications, night $70,820
shifts, and years of experience.
Percent of Thurston
Nurses account for 1,740 of the 92,790 jobs listed Registered Nurses earning County Job Market:
individually in Thurston County (1.9%). Registered 1.9%
Nurses earning an average of $70,820 per
an average of $70,820 per
year may have sufficient earnings to purchase year may have sufficient
a lower-priced home on their own, and earnings to purchase a
certainly rent on their own (177% of needed
income). With another earner of similar income,
lower-priced home on
they have sufficient income to afford to purchase their own.
a home costing well above the median price.
TABLE 11. Housing Affordability for Registered Nurses in Thurston County
(based on average annual income of $70,820; $34.05/hr)
Existing Home 1st Time One-Bedroom Two-Bedroom
Buyer Home Buyer Rent Rent (shared)
Alone - percent of housing cost they can afford 97% 98% 177% N/A
Alone - maximum housing amount they can afford $280,000 $241,000 $1,770/mo. N/A
2 Earners - percent of housing cost they can afford 197% 199% 354% 240%
2 Earners - maximum housing amount they can afford $570,000 $490,000 $3,541/mo. $3,541/mo.
city of lacey affordable housing strategy • 152. income & Lacey employment Market
Real People Example: Military - Corporal & Captain
Located just minutes from Joint Base Lewis-McChord (JBLM),
the largest military installation in the western U.S., Lacey has long
recognized the value JBLM brings to the region. Many soldiers and
military families call Lacey their home. Being the second-largest
employer in the State of Washington, JBLM provides economic
benefits to the South Puget Sound region. In return, Lacey and
other surrounding communities enhance the quality of life for
military personnel and families by building quality neighborhoods,
infrastructure, schools, recreation opportunities, and services.
The Basic Allowance for Housing (BAH), based on geographic duty location, pay grade, and dependency
status, is intended to provide uniformed service members housing compensation based on local market
housing costs. The 2018 Lacey-area BAH ranged from $1,374 to $2,410 a month, which would allow a service
member to choose from most of the available housing in the area.
TABLE 12. Housing Affordability for Military - Corporal E-4 in Thurston County
(based on average annual income of $54,366; which includes $1,734 housing allowance per month)
Existing Home 1st Time One-Bedroom Two-Bedroom
Buyer Home Buyer Rent Rent(shared)
Alone - percent of housing cost they can afford 114% 115% 177% N/A
Alone - maximum housing amount they can afford $349,000 $315,000 $1,774 /mo. N/A
2 Earners - percent of housing cost they can afford >175% >175% 355% 241%
2 Earners - maximum housing amount they can afford >$500,000 >$425,000 $3,548/mo. $3,548/mo.
TABLE 13. Housing Affordability for Military - Captain in Thurston County
(based on average annual income of $97,260; which includes $2,112 housing allowance per month)
Existing Home 1st Time One-Bedroom Two-Bedroom
Buyer Home Buyer Rent Rent (shared)
Alone - percent of housing cost they can afford 138% 140% 211% N/A
Alone - maximum housing amount they can afford $400,000 $350,000 $2,112/mo. N/A
2 Earners - percent of housing cost they can afford >200% >200% 422% 286%
2 Earners - maximum housing amount they can afford >$600,000 >$500,000 $4,224/mo. $4,224 /mo.
16 • city of lacey affordable housing strategy2. income & Lacey employment Market
Single-Parent Household with Child(ren)
While the information presented in the income section indicates that teachers, military personnel, and
nurses, have sufficient income on their own to afford housing, the other positions profiled, and a number of
other lower-paying positions, do not provide enough income to afford
housing that would accommodate a single-parent household with Approximately half of single
no other income earner. Currently, Lacey has approximately 2,207 household earners cannot
single-parent households with a child or children: approximately
17.4 percent of households. There is no data available that correlate afford a one-bedroom
how many of these single-parent households are employed in the apartment. About two-thirds
approximately 65,000 positions that pay less than the $59,000 needed cannot afford a
to afford at least a two-bedroom apartment with only one income.
There is no data available to address the cost of child care versus two-bedroom alone.
any child support, or transfer payments that might help
offset these additional housing costs. FIGURE 6. Percent of Jobs in Thurston County
Approximately half of single household earners cannot within Different Salary Ranges
afford a one-bedroom apartment. About two-thirds
cannot afford a two-bedroom alone. 24%
33%
Less than
$58K + $30K
Renting versus Home Ownership
$30-$40K
Many people choose to rent rather than buy. For some,
$41-$57K
they prefer the flexibility to move without the need to sell 25%
a home, a preference for lack of financial responsibilities 18%
for maintenance and repairs, or a lack of certainty about
where they want to live. For many, they choose to rent out
of financial necessity. The cost, or perceived cost, of home ownership is a barrier.
Down payment assistance programs are available for people who wish to own a home, but are unable to
save the traditional 10 to 20 percent down payment. There are also government guaranteed programs, such
as FHA, that can help first-time buyers get in with as little as five percent or less down. The Veterans Admin-
istration offers up to 100 percent financing for qualified veterans. Buyers may be saddled with debt, perhaps
student debt, or have credit issues. There are programs to help potential home buyers work through these
issues as well. Prices for housing has out-paced income for a number of years now (Table 14).
TABLE 14. Housing Prices to Income Comparison,
Thurston County 2000-2016
2000 2016 % Increase
Housing Price $160,606 $283,272 76%
Income $48,457 $63,286 31%
% House/Income 331% 448% 35%
city of lacey affordable housing strategy • 173. Residents without permanent housing
Chapter 3.
residents without permanent
housing
Knowing exactly how many residents are without housing is difficult, and understanding the reasons why is
even more complicated. Thurston County contracts with the City of Olympia to conduct an annual Thurston
County Point in Time (PIT) Homeless Census. The census, conducted since 2006, informs the community
about who is homeless and why.
From the most recent PIT Report: The 2018 homeless census total of 835 represents an 89 percent increase,
or 394 more people than identified in the 2006 census of 441 people. However, this year’s results indicate a
significant, 15 percent, drop in homelessness from the 2010 all-time high of 976. In spite of this increases, there
have been significant accomplishments in strengthening the network of housing, shelter, and homeless services.
The 835 homeless individuals found in 2018, represents a 56 percent increase or 301 more people since 2017
(Figure 4). This also shows a 89 percent increase from the 2006 baseline of 441 homeless people. The numbers
follow the broad economic trends of the past decade: an increase during the recession, a drop during the recovery
and most recently, a rise that appears to correlate with sharp rent increases in Thurston County, mirroring West
Coast trends (2017 Thurston County Assessment of Fair Housing Report).
FIGURE 7. Thurston County Point in Time Homeless Counts 2006-2018
18 • city of lacey affordable housing strategy3. Residents without permanent housing
The Village Story* The connection between Causes of
homelessness & affordable housing. Homelessness
Affordable housing and
Once upon a time, there was a small village on the edge of a river. Life in the
homelessness go hand
village was busy. There were people growing food and people teaching the in hand. When people
children to make blankets and people making meals. outnumber housing,
One day a villager took a break from harvesting food and noticed a baby prices go up and those
with the fewest
floating down the river toward the village. She couldn’t believe her eyes! She
resources tend to be
heard crying int he distance and looked downstream to see that two babies the ones displaced.
had already floated by the village. She looked around at the villagers working According to the U.S.
nearby. “Does anyone else see the baby?” she asked. Conference of Mayors,
the top causes of home-
One villager heard the woman, but continued working. “Yes!” yelled a man lessness among families
who had been making soup. were, in order:
“Oh, this is terrible!” A woman who had been building a campfire shouted, 1) lack of affordable
housing
“Look, there are even more upstream!” Indeed, there were three more babies
2) unemployment
coming around the bend. 3) poverty
“How long have these babies been floating by?” asked another villager. No one 4) low wages
knew for sure, but some people thought they might have seen something in the The same report found
the top five causes of
river earlier. They were busy at the time and did not have time to investigate.
homelessness among
They quickly organized themselves to rescue the babies. Resources were used to single individuals were:
build watchtowers on both sides of the shore and swimmers were coordinated 1) lack of affordable
to maintain shifts of rescue teams that maintained 24-hour surveillance of the housing
2) unemployment
river. Ziplines with baskets attached were stretched across the river to get even
3) poverty
more babies to safety quickly. 4) mental illness and
The number of babies floating down the river only seemed to increase. The lack of needed services
villagers built orphanages and they taught even more children to make 5) substance abuse and
lack of needed services.
blankets and they increased the amount of food they grew to keep the babies
For women in
housed, warm, and fed. Life in the village carried on. particular, the number
Then, one day at a meeting of the Village Council, a villager asked, “But where one cause of home-
are all these babies coming from?” lessness is domestic
violence.
“No one knows,” said another villager. “But, I say we organize a team to go
upstream and find how these babies are ending up in the river.” (U.S. States Conference
of Mayors, Hunger and
Not everyone was in agreement. “But, we need people to help us pull the babies Homelessness Survey
out of the river,” said one villager. “That’s right!” said another. “And who will be Dec. 2014)
here to cook for them and look after them if a bunch of people go upstream?”
The Council chose to let the village decide. If the City is to help
solve the homelessness
If you were a villager, what would your vote be? crisis we can work to
create more, affordable
Do you send a team upstream? housing options and
facilitate access to
support services.
*From the Community Investment Partnership meeting, November 2016.
city of lacey affordable housing strategy • 193. Residents without permanent housing
Key organizations* Homeless Census
serving Thurston From the 2018 PIT Report: New this year, City of Olympia conducted two
County, providing additional efforts to better understand homelessness in the urban hub. Together,
emergency shelter, these two counts found 763 unsheltered people in the urban hub, far more than the
transitional 320 unsheltered people found in the formal PIT Homeless Count. Please note:
In an effort to broaden the count to include people who typically refuse to give their
housing, and names (Please see “Methodology Chapter 9 in PIT Report), the Olympia Counts did
low-income not collect names or any additional information. Because of this difference in
permanent housing methodology, these numbers could not be certified as part of the formal PIT Count
which is based on the State’s PIT Census survey in which names must be collected.
• Catholic Community
Without names, it is not possible to prevent double counting.
Services
• Community Youth Pre-Dawn Doorway Count The first Urban Hub Count was the Downtown Pre-
Services Dawn Doorway Count, conducted four times over a six-month period. At 5 am,
Census Workers conducted a rapid visual scan of an area roughly nine (9) by eight
• Family Support
Center (8) blocks in the urban hub. On the morning of January 25, 2018, this revealed 135
people camping in the alcoves.
• Habitat for
Humanity Camp Census with Homeless Guides The second methodology involved sending
• Homes First
out teams with homeless guides to go into homeless camps throughout the urban
hub of Olympia and the nearby parts of Lacey and Tumwater. These teams found a
• Housing Authority total 628 people living in camps.
of Thurston County
• Interfaith Works
• Olympia Union Our region is fortunate to have numerous social service organizations that
Gospel Mission provide emergency shelter, transitional housing, and low-income permanent
housing (see side bar). These organizations already do so much for the region
• Panza
to provide services, yet the demand for their services consistently outstrips the
• SafePlace resources they have.
• Salvation Army
The following
organizations provide
rental subsidies and/or
support services:
• Senior Services for
South Sound
• Sidewalk
*Not an exhaustive list.
20 • city of lacey affordable housing strategy3. Residents without permanent housing
Homeless Students
From the 2018 PIT Report: Homeless student data from OSPI does not directly correlate with PIT Census data, yet
still provides a composite view of homelessness. Together, they mirror a general trend of homelessness in Thurston
County rising to an all-time high in 2010 and since then drop until 2014, when the numbers shot up 41 percent.
This year, the number is the second highest since beginning this methodology.
Homeless School Children and the McKinney Act
All Washington state publicly funded schools are required to count homeless students, kindergarten through 12th
grade. The federal McKinney-Vento Act declares that homeless school children are also entitled to the protections
listed under the section entitled, “Education for Homeless Children and Youths.” The Act defines homeless children
as “individuals who lack a fixed, regular, and adequate nighttime residence.” The act goes on to give examples of
children who would fall under this definition:
• Shared Housing families sharing housing due to economic hardship or loss of housing;
• Motels, hotels, trailer parks, or camp grounds due to lack of alternative accommodations;
• Emergency or transitional shelters;
• Awaiting foster care placement;
• Not an intended sleeping area, for example: Cars, parks, public spaces, abandoned buildings, substandard
housing, bus or train stations . . .”
Thurston County school districts range in size from the small rural Griffin school district with 647 students to the
large North Thurston School District with 14,833 students. However, raw numbers sometimes have less impact on
the percentage that certain demographics have on the entire district. While the Rochester School District is one
of the smaller districts with only 2,267 or 5.4% of the County’s students, nearly 50% of their student body is on free
and reduced lunch. Following is some comparative data on the eight different school districts, comparing the
total number of students with the number of students who are on free and reduced lunch and those whose
families are homeless.
FIGURE 8. Thurston County Students Homeless & Free Lunch by District 2016-2017
15000 14,833
Percent of Homeless
Students by District:
10,042
10000
North Thurston 6.25%
Tenino 4.91%
6,636
Rochester 4.89% 6,189
5,760
Rainier 2.87%
5000
Tumwater 2.83%
Olympia 2.62% 2,832
2,267 2,408
1,935
Griffin 1.85% 1,132 1,079
928 802
647 591
Yelm 1.54% 12 116
264 23
390
111 53 188 89
0
Griffin North Thurston Olympia Rainier Rochester Tenino Tumwater Yelm
# of homeless students # of students on free & reduced lunch total enrollment
city of lacey affordable housing strategy • 213. Residents without permanent housing
Lacey’s Homeless Support Services
Lacey’s homeless support services focus on families, students, and Veterans.
Lacey Veterans Services Hub
Thurston County is home to nearly 32,000 Veterans
including about 6,000 in Lacey. Many of these former
military members face difficulties such as poverty, service-
related disabilities, and mental health challenges. In
response to these challenges, the City of Lacey developed
the Lacey Veterans Services Hub, which provides Veterans
access to over 50 service providers. In 2018 alone, the Hub
provided over 3,400 client appointments including 637 for
affordable housing and homeless aid, over 770 for mental
health, and 156 for employment assistance. The City has
provided $315,000 to support the program.
Community Development Block Grants
Since the 1990s, the City of Lacey has distributed over $6.6 million to a variety of local organizations that
provide services to low-income and homeless individuals and families. These projects include purchasing
affordable housing, repairing low-income housing, providing staffing for local service providers, and more.
Table 15 outlines the 2017 grant allocations. The City of Lacey receives an allocation on a rotating basis with
the City of Tumwater and Thurston County. The City will receive additional funds in 2020 for distribution and
will be able to issue a request for proposals to determine how funds will be distributed.
TABLE 15. 2017 Community Development Block Grant Allocations
Organization Project Grant Amount
South Sound Clinic Expansion -
Evergreen Treatment Services Clinic offers treatment for opioid use and mental $250,000
health support
Affordable Housing on Golf Club Road and
Housing Authority of Thurston County $75,000
14th Avenue
Community Youth Services Transitional housing rehabilitation $70,500
New facilities for Monarch Children’s Justice
Community Action Council $187,514
& Advocacy Center
Thurston County Food Bank Lacey Food Bank $200,000
Sidewalk Veteran Housing Coordinator $50,000
Boys and Girls Club Homeless Youth Assistance $33,986
22 • city of lacey affordable housing strategy3. Residents without permanent housing
Lacey’s Homeless Support Services - cont’d
The most recent
Lacey Food Bank numbers show that
Families’ access to food is limited if they are paying too much for housing costs. over 11,000 Lacey
The Thurston County Food Bank (TCFB) has experienced a steady increase in
client growth over the last several years. The most recent numbers show that and Lacey-area
over 11,000 Lacey and Lacey-area residents use TCFB services. Lacey has six residents use
satellite food banks operating through collaborative partnerships. However, Thurston County
due to the demand, Lacey needs a permanent, full-service food bank. The
TCFB’s new location on Martin Way will serve 1,200 children from low-income Food Bank services.
families who live within three miles of the new site. The final build will include ... Lacey needs a
a therapy garden for Veterans facilitated by GRUB, a farm stand providing permanent, full-
access to fresh produce, and a 10,000 square foot food bank. The City of Lacey
provided $200,000 in Community Development Block Grants and assisted in service food bank.
securing an additional $750,000 in State funding for the new Lacey site. The food bank’s new
location on
Habitat for Humanity
Martin Way will
In 2005, the City of Lacey passed an ordinance creating a policy to waive
serve 1,200 children
building, plumbing, electrical, and mechanical permit fees, and, water meter,
water construction, traffic mitigation, and plan check fees for the Habitat for from low-income
Humanity. This waiver allowed Habitat to begin construction of the Deyoe families who live
Vista neighborhood – a 33-home, affordable-housing development. This lowers
within three miles of
the cash barriers to home purchasing. The project is well underway and the
neighborhood is expected to be complete in 2020. the new site.
Playground Pals
Since 1994, the City has partnered
with North Thurston Public Schools
to provide a free, summer-lunch
program for low-income children,
ages 2 to 12 years old. Lacey Parks &
Recreation staff provide playground
supervision, structured play, and
organized activities including arts &
crafts, games, fitness, water activities,
and even a summer reading program.
In 2017, the program provided 12,595
lunches in 39 days.
Local Faith Leaders
The City of Lacey convened a Faith Leaders Forum to bring together Lacey-area
faith leaders to discuss opportunities to work together to better the Lacey
community. A smaller steering committee began holding meetings in June
2018 to discuss strategies to address homelessness.
city of lacey affordable housing strategy • 234. Looking ahead
Community Vision Chapter 4.
Lacey includes a broad
choice of housing types
looking ahead
2016 Comprehensive Plan Economic Forecasts
at a range of prices,
including affordable
homes in diverse, safe
settings that maintain a
Lacey’s 2016 Comprehensive Plan describes forecasted job growth and
high quality of life.
anticipated housing needs:
Economic forecasts for the Comprehensive Plan
planning period (2016-2035)indicate an increase Economic forecasts for the ...
of 60,000 jobs in Thurston County with 13,700 jobs (2016-2035)
in Lacey alone. Job growth will add to the need of planning period indicate
accommodating 27,490 additional people within
our Urban Growth Area (UGA). The increased an increase of 60,000 jobs in
number of jobs will add workers who need Thurston County with
housing for their families. It is projected that a 13,700 jobs in Lacey alone.
total of 12,220 new homes will be needed in
the UGA during the next twenty years. With the
continued cost of housing increasing in the Central Puget Sound region, the
number of people relocating to our area and commuting to jobs is also expected
to increase housing needs.
Looking ahead, by 2035 it is estimated that the
It is projected that a Lacey community will have a population of
total of 12,220 new homes 107,720. Of that, 53,090 will be within the city
limits, with the remainder - more than half - in the
will be needed in the UGA UGA. Demographically, Lacey, along with the rest
during the next twenty years. of the nation, will grow a little older, and more
ethnically diverse. Education attainment will likely
remain as a strength. Education achievement may actually improve as legisla-
tive actions in response to court cases, and voter initiatives to better fund public
schools and reduce class sizes, are implemented. Given Lacey’s significant growth
in both land area and population over the last twenty years, the continuing growth
that the City will experience
over the next twenty years
will begin to be characterized
by more redevelopment of
existing, underutilized sites,
and less new development of
greenfield sites.
24 • city of lacey affordable housing strategy4. looking ahead
2016 Comprehensive Plan Economic Forecasts - cont’d
Nearly 40% of the new jobs forecast to be created in Lacey in the next twenty years
are concentrated in three sectors that are often lower paying, and that offer few
fringe benefits to employees. These include
Personal and Repair Services, Food Service ... a focus of the Economic
and Accommodations, and Retail Trade.
Manufacturing jobs, which typically have
Development Element
the highest economic impact, are forecast to (of the Comprehensive Plan)
grow by only 90 positions by 2035. As a result, is on job recruitment for
a focus of the Economic Development
Element is on job recruitment for employers
employers that provide living
that provide living wages so Lacey residents wages so Lacey residents can
can work in the community where work in the community
they live.
where they live.
Household Size in Lacey
Most households in Lacey consist of 1-2 people which influences current
and future housing needs. Thurston Regional Planning Council reports the
following statistics about Lacey households:
• 63% - 1 or 2 people
• 20% - Married couple with children
• 17% - Single parent with children
city of lacey affordable housing strategy • 255. Programs supporting affordable housing
Chapter 5.
programs supporting
affordable housing
Current Programs
The City supports a variety of programs that help residents find and maintain
an affordable place to live.
Although the City of Lacey does not directly develop housing, it endeavors to
create an environment where development of new housing is enticing to the
development community and protects residents’ interests.
The City has the programs listed in Tables 16, 17, and 18 that encourage and
promote affordable housing.
26 • city of lacey affordable housing strategy5. programs supporting affordable housing
Current Programs - cont’d
TABLE 16. Existing Programs Summary: Assistance to Residents
Units Provided/
Income Level Served
Households Served
In 2018, the City
Utility Discount – the City offers a 50%
provided 283 utility
discount on water, sewer, and storm-
customers with a
water utility services for customers Low Income
discount, which make
who qualify as low income and
up a little over 1% of
disabled or low income and over 62.
total utility customers.
1-2 ADUs have been
No utility connection fee for Accessory
All Incomes permitted
Dwelling Units (ADU)
per year on average.
city of lacey affordable housing strategy • 275. Programs supporting affordable housing
Current Programs - cont’d
TABLE 17. Existing Programs Summary: Direct and Indirect Support to Public and Private Developers
Income Level Served Units Provided/Households Served
Reserve at Lacey – reuse of former Albertson’s to include
Moderate Income - 241 Units
apartments and retail in transportation-efficient location.
Seniors (Construction begins 2019)
Financed through HUD.
HUB Apartments - infill site, new construction in Woodland Market-Rate
345 Units in 3 Buildings
District to provide units to students at St. Martins. Using Apartments targeted
(First building 2019)
Form Based Code and multi-family housing tax exemption. for Students
Community Development Block Grant (CBDG) supported:
- Housing Authority of Thurston County with funds to Housing Authority - 6 Units
demolish two housing sites in preparation for
construction of two new triplexes.
Low Income CYS - 3 Properties
- Community Youth Services to help them rehabilitate
transitional housing properties for youth.
- Sidewalk public service program providing Veterans
housing coordinator services
Community Investment Partnership (CIP) supported:
- Housing Authority of Thurston County in construction of
two triplexes
- Foundation for the Challenged to acquire and rehab a Very Low and
3-Bedroom House
single-family home serving developmentally disabled Low Income
adults
- Homes First to acquire, rehab, and rent single family
houses
Multi-Family Housing Property Tax Exemption for
Woodland District - Provide limited, eight- or twelve-year
exemptions from ad valorem property taxation for Market Rate and
qualified new multi-family housing located in designated Incentives for None. Implemented in 2014.
residential targeted areas. Participation in program is Low-Income
voluntary. Requires 20% set aside for affordable units for
duration of exemption.
Fee waivers for Habitat for Humanity and Boys and Girls
Club Projects. The City Manager is authorized to waive
fees for: water meters, construction water, building permit, Low Income Implemented in 2009
mechanical permit, plumbing permit, electrical permit, plan
checks, and transportation mitigation.
28 • city of lacey affordable housing strategyYou can also read