Walnut Ranch Park Expansion Project Study December 2017 - City of Walnut
←
→
Page content transcription
If your browser does not render page correctly, please read the page content below
Walnut Ranch Park Expansion Project Study December 2017
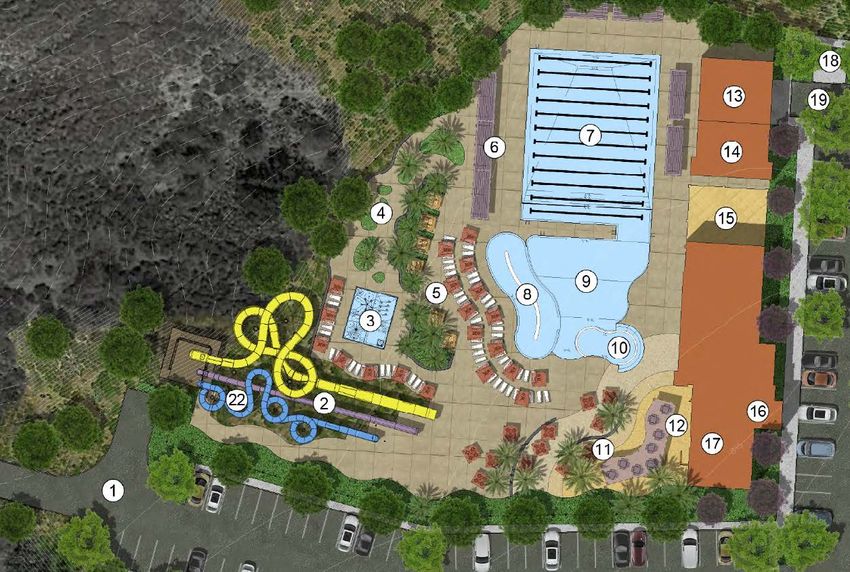
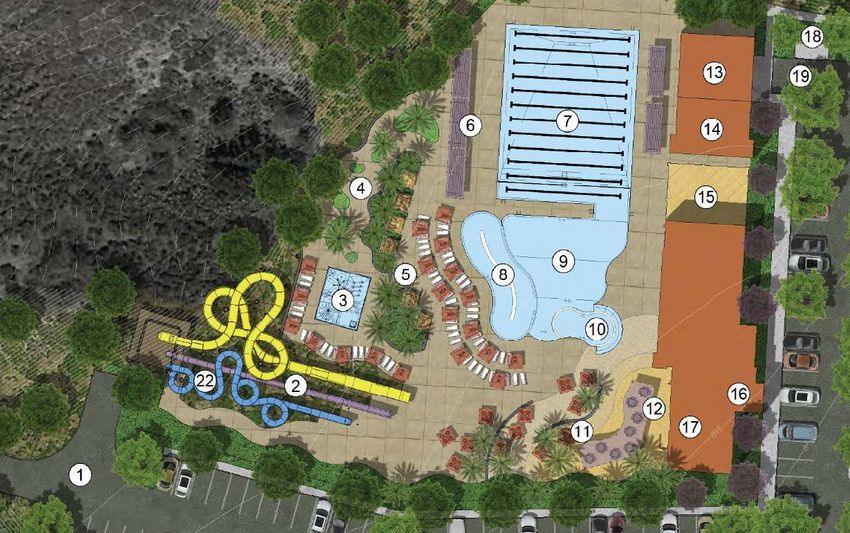
Table of Contents
Executive Summary ................................................................................................................................. 1
      Purpose of this Plan .......................................................................................................................... 1
      Methodology of this Planning Process ............................................................................................. 2
      Potential Facility and Program Elements ......................................................................................... 2
      Financial Analysis, Construction and Operational Budget Estimates ............................................... 6
      Recommendations............................................................................................................................ 9
I. The Planning Context ......................................................................................................................... 11
      Purpose of this Plan ........................................................................................................................ 11
      Methodology of this Planning Process ........................................................................................... 11
      City of Walnut Community Services Overview ............................................................................... 13
II. The City of Walnut’s Unique Characteristics..................................................................................... 15
      Demographic Profile ....................................................................................................................... 15
III. Park and Recreation Influencing Trends .......................................................................................... 21
      National Recreation Trends of Relevance to the City of Walnut ................................................... 21
IV. Public Input ...................................................................................................................................... 27
      Focus Group and Public Forum Input Summary............................................................................. 27
V. Staff SWOT Analysis .......................................................................................................................... 33
      Staff Strengths, Weaknesses, Opportunities, and Threats (SWOT) Analysis ................................. 33
VI. Market Assessment, Activity Profile/Competitive Facilities ............................................................ 35
      Market Analysis .............................................................................................................................. 35
VII. Walnut Ranch Park Program Elements and Site Analysis ............................................................... 37
VIII. Staffing Organization ..................................................................................................................... 49
IX. Recommended Fees and Charges Schedule .................................................................................... 53
X. Operational Budget Estimates and Preliminary Construction Costs ................................................ 55
      Operating Budget Purpose ............................................................................................................. 55
      Overall Operations and Maintenance Budget ................................................................................ 55
XI. Recommendations ........................................................................................................................... 63

 Walnut Ranch Park Expansion Study                                                                                                                  i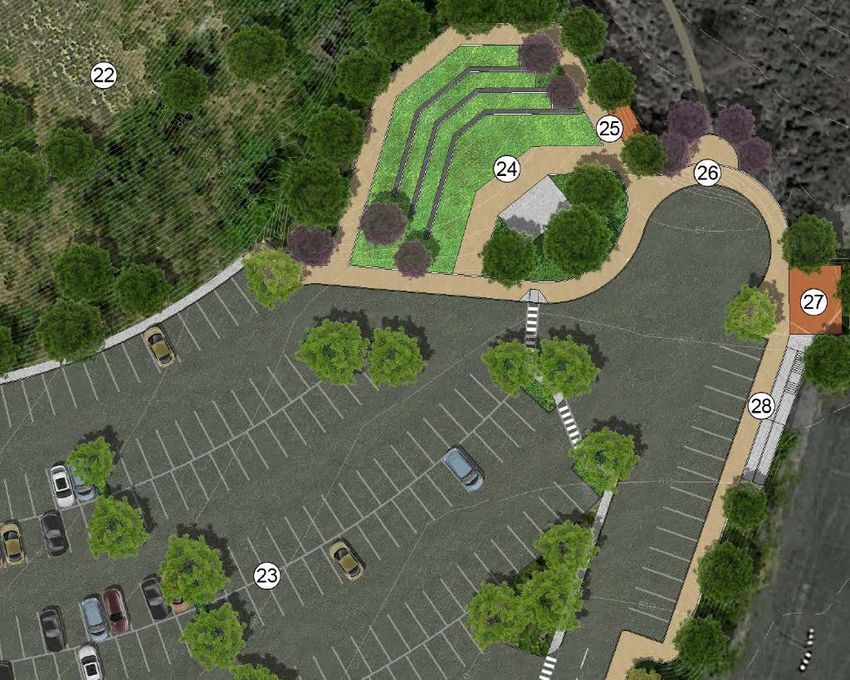
List of Tables
Table 1: Projected Summary of Construction Costs ..................................................................................... 7
Table 2: Projected O&M Budget Costs and Cost Recovery........................................................................... 8
Table 3: 2016 City of Walnut General Demographic Profile ....................................................................... 15
Table 4: City of Walnut Housing Inventory ................................................................................................. 18
Table 5: Cycling and Trail Recreation Participation by Activity (Ages 6+)................................................... 25
Table 6: Projected O&M Budget Projections .............................................................................................. 58
Table 7: Projected Summary of Construction Costs ................................................................................... 59

List of Figures
Figure 1: City of Walnut Population Growth Trend .................................................................................... 16
Figure 2: Population Age Distribution in City of Walnut, 2010 to 2021 ..................................................... 16
Figure 3: City of Walnut Racial and Ethnic Character 2010, 2016, and 2021 ............................................. 17
Figure 4: City and State Population Racial and Ethnic Character Comparison 2016 .................................. 18
Figure 5: 2016 Median Household Income Comparison ............................................................................ 19
Figure 6: Distribution of Median Household Income in the City of Walnut (2016) .................................... 19
Figure 7: Example of Aquatics Management Coverage .............................................................................. 51
Figure 8: Weekly Aquatics Management Hours ......................................................................................... 51
Figure 9: Pay Rates ...................................................................................................................................... 52
Figure 10: Potential Construction Cost Estimate ........................................................................................ 60

        ii                                                                                                           Walnut, California
ACKNOWLEDGEMENTS

                                           Consultant Team
                                               Gr ee nP lay , LLC
                                           A qu at ics De si g n Gr ou p
                                                      KTU A

                        For more information about this document, contact GreenPlay, LLC
          At: 1021 E. South Boulder Road, Suite N, Louisville, Colorado 80027, Telephone: 303-439-8369
                 Toll Free: 866-849-9959 Email: info@greenplayllc.com www.greenplayllc.com

Walnut Ranch Park Expansion Study                                                                        iii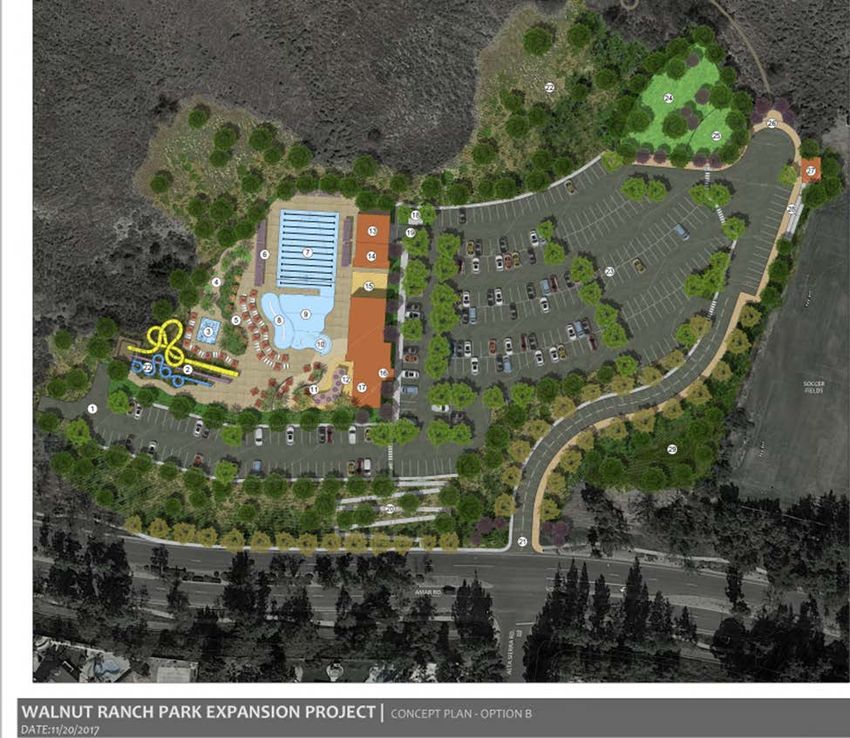
THIS PAGE INTENTIONALLY LEFT BLANK
Executive Summary
Purpose of this Plan
This plan provides recommendations which help the City of Walnut evaluate the options for the
amenities that could be added to Walnut Ranch Park along with an outdoor aquatics center. Previous
scenarios for both an aquatics center and a community stage have been developed by City Council,
Commissioners, and City Staff. This project involved gathering input from the community to determine if
there are gaps in services that could be fulfilled by the proposed amenities. Community input assisted in
determining what additional amenities could be added to the concept plans. Potential construction
costs and operational and maintenance costs associated with adding an aquatics center, an outdoor
community stage, and/or a dog park to Walnut Ranch Park were developed.

Critical Success Factors
     • Determine a reliable aquatics center operation cost. Estimate to include personnel, operations,
         and maintenance.
     • Provide the amount of personnel needed throughout the year based on the amenities included
         (lifeguards, support staff, etc.).
     • Provide operations cost comparison comparable with other City/public aquatics facilities within
         the Southern California region.
     • Determine and prepare a recommended schedule of rates for usage of the various aquatics
         programs and amenities.
     • Provide a cost recovery estimate.
     • Develop a list of recommended programs/services that may be offered to enhance community
         participation and generate additional revenue for the City.

To complete this project, GreenPlay, along with Aquatic Design Group and KTUA Landscape
Architecture, engaged the community to determine gaps in programming and service needs, created a
market analysis of the center’s service area, and determined potential conceptual capital and operating
costs associated with the proposed center. Two conceptual plans were developed; an aquatics center
with a dog park and an aquatics center with an outdoor community stage. The team also evaluated
potential sites, potential funding opportunities (including partnerships and other alternatives), and
potential avenues for recovering costs.

 Walnut Ranch Park Expansion Study                                                              1
Methodology of this Planning Process
The project consisted of the following tasks:
• Strategic Kick-Off Meeting • Community Program Identification
• Review of Information Gathered • Identification of Aquatics Facility
• Facilities Tour Amenities
• Stakeholder Meetings and Focus • Site Analysis and Conceptual Plans
Groups • Staffing Organizational Structure
• SWOT Analysis • Financial Assessment/Operations and
• Public Forum Maintenance Projections
• Tour of Potential Sites for a New • Projected Cost Recovery
Aquatics Center • Findings and Visioning Presentation
• Market Assessment • Final Report and Presentation Including
• Demographics Projections Recommendation
• Trends Analysis
Potential Facility and Program Elements
An analysis of input received in focus groups, stakeholder meetings, staff interviews, facility and site
tours, market analysis, as well as demographic and trends research confirm that the City of Walnut
community would benefit from the expansion of the Walnut Ranch Park. The residents and staff have
expressed an interest in, and a desire for, an outdoor aquatics facility and additional amenities. The
GreenPlay team, including Aquatic Design Group and KTUA, recommends that the City moves forward
with plans to expand Walnut Ranch Park with the addition of an outdoor aquatics center and that City
Leaders make a decision on which additional amenity, an outdoor community stage, a dog park, or
another amenity would be in the best interest for the City of Walnut to add to Walnut Ranch Park. Two
scenarios are discussed in this report, Scenario 1 an outdoor aquatics center and a community stage,
and Scenario 2 outdoor aquatics center and a dog park.
Potential Walnut Ranch Park Components:
• Outdoor Aquatics Center consisting of
Recreational Components
Zero depth beach type entry
River current channel
Area for aquatics instruction and fitness programming
Spray park with interactive play equipment
Waterslides with individual run-out flumes
Shade areas
Benches/tables/picnic areas
Concessions/snack bar
Inflatables
Resort style amenities
Competitive Components
Twelve 25-yard swimming lanes
Floating and fixed cage 25-yard water polo
Spectator seating area
Community Gathering Space
Rentals
2 Walnut, California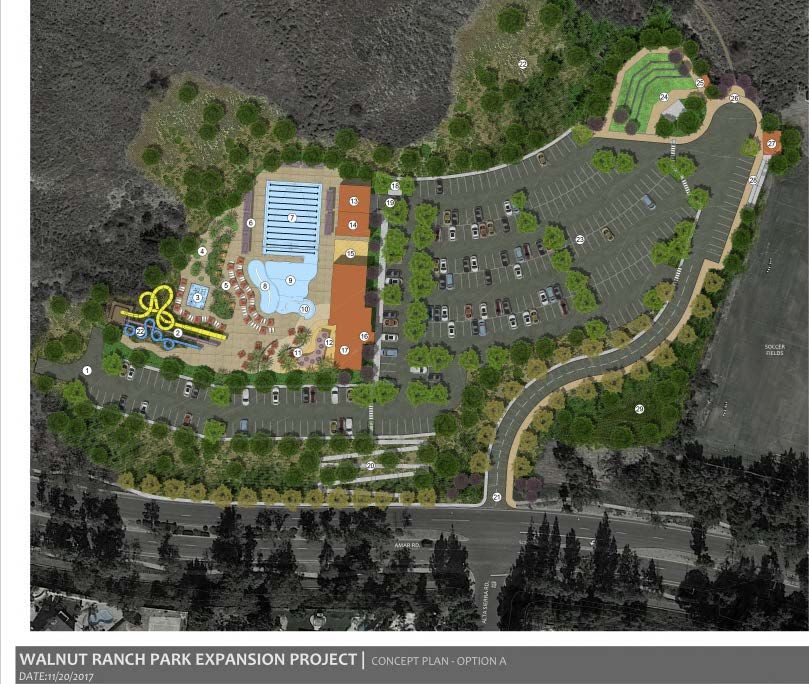
Appropriate Support Spaces
Locker rooms/restrooms
Concessions
Offices
Point of entry
• Suggested additional park amenities
Community stage
Dog park (with small and large dog areas)
Trail connectivity/Trailhead
Parking
Multipurpose classroom
Outdoor playground
Common area
Walnut Ranch Park Expansion Study 3
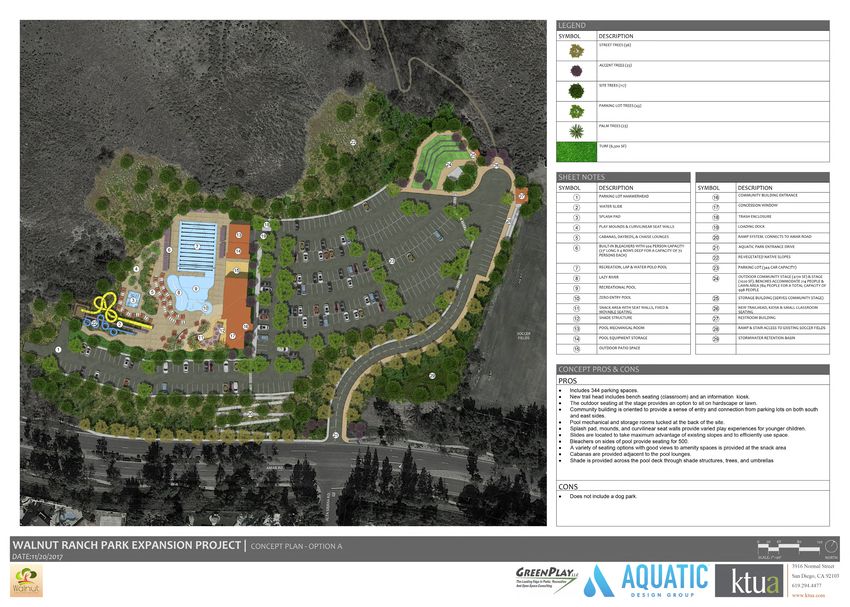
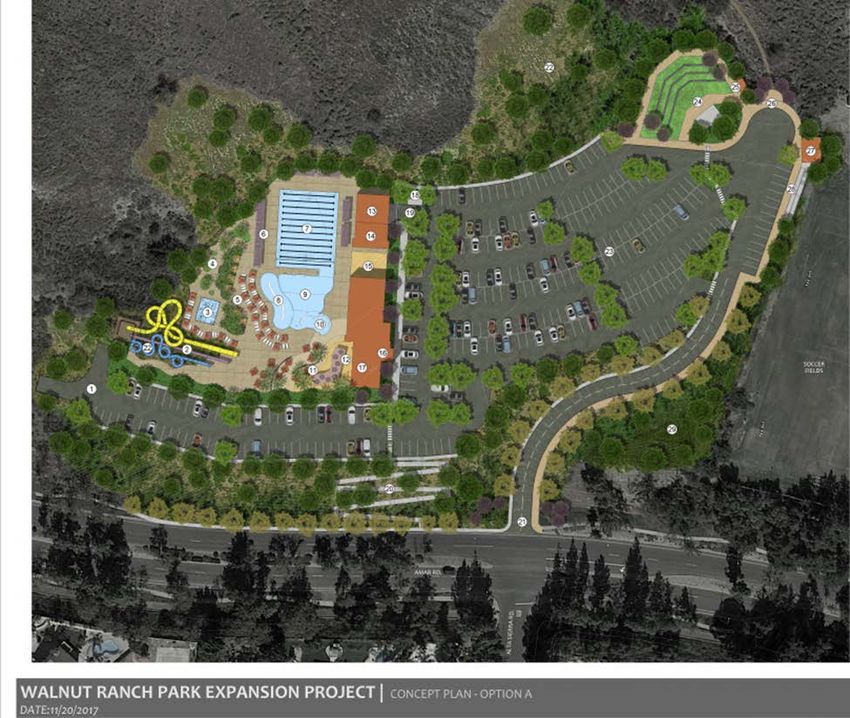
Scenario 1 Outdoor Aquatics Center and a Community Stage

Overview of Walnut Ranch Park Expansion Site

     4                                                     Walnut, California
Scenario 2 Outdoor Aquatics Center and a Dog Park Overview of Walnut Ranch Park Expansion Site Walnut Ranch Park Expansion Study 5
The two scenarios are discussed in greater detail including pros and cons of each scenario in the Walnut
Ranch Park Program Elements and Site Analysis section of this report.

Staffing Organization
The consultant team recommends a combination of full time and permanent part time staff to provide
appropriate management of the Walnut Ranch Park expansion. The following positions are
recommended to be used to ensure successful operations of the aquatics center and other amenities at
Walnut Ranch Park:
    • Walnut Ranch Park (WRP) Supervisor
    • Facilities Coordinator
    • Pool/Park Maintenance Contract
    • Pool Manager
    • Assistant Pool Manager (3) – rotating schedules
    • Head Life Guards (approximately 8)
    • Lifeguards/Swim Instructors
    • Office Clerk
    • Senior Recreation Leaders – works weekends

Detailed position descriptions, staffing patterns, and pay scales are provided in the Staffing Organization
section of this report.

Financial Analysis, Construction and Operational Budget
Estimates
Preliminary Construction Costs and Operational Budget Estimates
The GreenPlay team conducted a financial analysis and developed preliminary construction costs for the
development of the Aquatics Center and a Community Stage or Dog Park. Construction costs as well as
operational and maintenance budget estimates are summarized in Table 1 and Table 2. Construction
costs include site costs, utilities costs, building, and swimming pool costs plus community stage or dog
park costs. Operating expenses include staffing, contractual services, and commodities. Revenue
includes daily user fees, rental fees, program fees, and concessions. Cost recovery calculations are based
on direct costs of the facility.

Projected Construction Costs
Based on the community and staff input, conceptual plans were developed for the two scenarios.
Scenario 1 includes an outdoor aquatics center and a community stage, and Scenario 2 includes an
outdoor aquatics center and dog park. The estimated construction costs are as follows:
    • Scenario 1 approximately $23,560,096
    • Scenario 2 approximately $23,073,872

     6                                                                          Walnut, California
Table 1 below provides a summary of the projected construction costs for the expansion of Walnut
Ranch Park. Both scenarios are included.
Table 1: Projected Summary of Construction Costs
SUMMARY OF COSTS: Scenario 1 Scenario 2
1.0 SITE WORK $4,878,440 $4,878,440
2.0 SITE UTILITIES $835,500 $835,500
3.0 BUILDINGS $5,778,600 $5,778,600
4.0 SWIMMING POOLS $3,655,400 $3,655,400
5.0 COMMUNITY STAGE $600,000
5.1 DOG PARK $275,000
TOTAL HARD COSTS $15,747,940 $15,422,940
PLUS CONSTRUCTION CONTINGENCY AT 10% $1,574,794 $1,542,294
PLUS GENERAL CONTRACTOR O/H & PROFIT AT 13% $2,251,955 $2,205,480
PLUS BONDS & INSURANCE AT 2% $391,494 $383,414
PLUS SOFT COSTS AT 18% $3,593,913 $3,519,743
GRAND TOTAL $23,560,096 $23,073,872
Overall Operations and Maintenance Budget Projections
Aquatics Center Projection
During the development of the potential operational and maintenance budget for the aquatics center,
the consultant determined that a 72% cost recovery was most realistic.
Total Revenue $1,051,472
Total Expense $1,450,915
Net ($399,443)
Cost Recovery 72%
Table 2 below provides a summary of the projected operations and maintenance costs, and revenue
along with a cost recovery projection for the operation of the Walnut Ranch Park Aquatics Center.
Walnut Ranch Park Expansion Study 7Table 2: Projected O&M Budget Costs and Cost Recovery for Aquatics Center
Walnut Ranch Park Aquatics Center
Preliminary Draft Operational Budget with Coverage Provided by a Combination of Full Time Staff and Permanent Part
Time Staff
Preliminary Draft Operational Budget Projections – No guarantee is being implied by GreenPlay that these entrance totals
will be obtained.
Estimated Cost
Recovery 72%
STAFFING PROJECTIONS $969,458 66.82%
OPERATING EXPENSES
Contractual Services $314,100 21.65%
Commodities $167,357 11.53%
TOTAL EXPENSES $1,450,915
REVENUE
Passes $262,000
Daily Admissions Number $222,100
Goal 111,340 visits annually
Peak Capacity 1,000
Rentals $48,500
Recreation Programs $271,000
Concessions and Merchandise $247,872
TOTAL REVENUE $1,051,472
TOTAL NET -$399,443
COST RECOVERY 72%
Community Stage Projection
During the development of the potential operational and maintenance budget for the community stage,
the consultant determined that a 100% cost recovery could be potentially achieved, exclusive of
maintenance, if the rental fees for large events included the operating costs (staffing and equipment)
associated with each event.
Total Revenue TBD
Total Expense $30,000 maintenance + TBD (staffing and equipment)
Net ($30,000)
Dog Park Projection
During the development of the potential operational and maintenance budget for the dog park, the
consultant determined that a 100% of the cost of the maintenance and operations would need to be
subsidized.
Total Revenue $0
Total Expense $30,000
Net ($30,000)
A complete summary of the Projected Operations and Maintenance Budgets were provided as a Staff
Resource document.
8 Walnut, CaliforniaRecommendations
1. City Leaders make a decision on which additional amenity, an outdoor community stage, a dog
park, or another amenity would be in the best interest for the City of Walnut to add to Walnut
Ranch Park along with an outdoor aquatics center.
2. The City moves forward with plans to expand Walnut Ranch Park with the addition of an
outdoor aquatics center and an outdoor community stage or a dog park.
3. Include the following components in the Walnut Ranch Park Expansion Project:
• Outdoor aquatics center consisting of
Recreational components
Zero depth beach type entry
River current channel
Area for aquatics instruction and fitness programming
Spray park with interactive play equipment
Waterslides with individual run-out flumes
Shade areas
Benches/tables/picnic areas
Concessions/snack bar
Inflatables
Resort style amenities
Competitive components
Twelve 25-yard swimming lanes
Water polo cages
Spectator seating area
Community gathering space
Rentals
Appropriate support spaces
Locker rooms/restrooms
Concessions
Offices
Point of entry
4. Suggested additional park amenities
• Community stage
• Dog park (with small and large dog areas)
• Trail connectivity/Trailhead
• Parking
• Multipurpose classroom
• Outdoor playground
• Common area
Walnut Ranch Park Expansion Study 95. Recommend a combination of full time and permanent part time staff to provide appropriate
management of the Walnut Ranch Park Expansion.
a. The following positions are recommended to be used to ensure successful operations of
the aquatics center and other amenities at Walnut Ranch Park:
Walnut Ranch Park (WRP) Supervisor
Facilities Coordinator
Pool/Park Maintenance Contract
Pool Manager
Assistant Pool Managers (3) – rotating schedules
Head Life Guards (approx. 8)
Lifeguards/Swim Instructors
Office Clerk
Senior Recreation Leader – works weekends
6. Recommend implementing the following fees and charges structure:
Walnut Ranch Park Aquatics Sample Fees
Preliminary Draft Fees
Passes
Project usage 3x a week for 12 weeks (36 visits Summer 3 Month Pass Price
per pass) 20% discount Adult 18+ $150.00
Senior 55+ $125.00
Family (4 – 10 people all living at the same address) $600.00
Youth 3-17 $100.00
Child under 3 Free
Projected usage 3x a week per month (12 visits Monthly Passes (total sold per year)
per pass) Adult 18+ $60.00
Senior 55+ $50.00
Family (4 – 10 people all living at the same address) $240.00
Youth 3-17 $40.00
Child under 3 Free
Punch Passes Price
Projected usage 10 visits per pass 10 Punch Passes
Adult 18+ $80.00
Senior 55+ $48.00
Youth 3-17 $40.00
Child under 3 Free
Daily Admissions Price
Adult $10.00
Senior 55+ $6.00
Average family size (4) Family (4-10 people all living at the same address) $25.00
Youth 3-17 $5.00
Children under 3 Free
Average group size (10) Group (6 more, $4 per person, all arrive and leave together $40.00
Goal 11,340 visits annually Total Daily Admissions
Peak Capacity 1,000
Rentals
Birthday Parties ($100/hr. 2 hr. min)
Private Waterslide Party ($200/hr. 2 hr. min)
After Hour Aquatic Center Rental (Friday/Saturday 8 pm – 11
pm) $1,000 (max 300 people)
Community Room Rental (3 hr./$500)
10 Walnut, CaliforniaI. The Planning Context
Purpose of this Plan
This plan provides recommendations which help the City of Walnut evaluate the options for the
amenities that could be added to Walnut Ranch Park along with an outdoor aquatics center. Previous
scenarios for both an aquatics center and a community stage have been developed by City Council,
Commissioners, and City staff. Working with the City of Walnut staff, GreenPlay, LLC, along with
Aquatics Design Group and KTUA, engaged the community to determine gaps in programming and
service needs, create a market analysis of the aquatics center’s service area, and determine potential
conceptual capital and operating costs associated with the proposed aquatics center’s operations.
Community input assisted in determining what additional amenities should be added to the concept
plans. Two conceptual plans were developed, an aquatics center with a dog park and an aquatics center
with an outdoor community stage. Potential sites, potential construction costs, and operational and
maintenance costs associated with adding an aquatics center, an outdoor community stage, or a dog
park to Walnut Ranch Park were developed.
Critical Success Factors
• Determine a reliable aquatics center operation cost. Estimate to include personnel, operations,
and maintenance.
• Provide the appropriate level of personnel (park management, aquatics management,
lifeguards, support staff, etc.) needed throughout the year based on the amenities included.
• Provide operations cost comparison comparable with other city/public aquatics facilities within
the Southern California region.
• Determine and prepare a recommended schedule of fees and charges for usage of the various
aquatics programs and amenities.
• Provide a cost recovery estimate.
• Determine the size of the program elements recommended for the facility that can adequately
accommodate the programming needs as well as the supporting facilities functions (parking,
etc.).
Methodology of this Planning Process
This project has been guided by the GreenPlay team, including Aquatic Design Group and KTUA
Landscape Architecture. Mary Rooney, Director of Community Services, Alicia Jensen, Deputy
Community Services Director, Carol Partridge, Community Services Superintendent, Melissa Barcelo,
Management Analyst for the City of Walnut and other City staff as well as the City of Walnut residents
provided input to the consulting team throughout the planning process. The project consisted of the
following tasks.
Walnut Ranch Park Expansion Study 11Strategic Kick-Off Meeting
• An initial site visits and facilities tour
• Series of calls between the GreenPlay Project Manager and the City of Walnut Project Manager,
culminating in a conference call with GreenPlay team and City staff to discuss the scope of the
project, critical success factors, and expected outcomes
Review of Information Gathered
GreenPlay reviewed all information supplied by the City of Walnut staff to help determine the largest
recreational needs in the community that could inform the conceptual design of a new aquatics center.
Some of the information reviewed is listed below.
• City of Walnut recreation brochures for the past several years
• City of Walnut aquatics class participation stats for the past several years
• City of Walnut salary schedules
• Budgets for previous years
• 2014 Walnut Ranch Expansion Master Plan
Information Gathering Visit and Facility Tour
• Meeting with City of Walnut Staff
Facility tours
SWOT analysis
Tour of potential sites for new aquatics center
• Stakeholder Focus Group
Conducted six focus groups
Conducted several stakeholder interviews
Conducted staff interviews
Public Forum
• Community meeting to discuss the support, needs, and desires for an aquatics center and
additional amenities
Market Assessment
• Analysis of information to determine potential programs
• Analysis of other service provider facilities and usage
Demographics Projections
• Analysis of City of Walnut population projections, age disbursement, and household information
Trends Analysis
• National, regional, and local recreation programming, and facilities trends focusing on aquatics
Community Program Identification and Identification of Aquatics Facility Amenities
• Identification and prioritization of desired programs
• Identification of aquatics elements and other amenities
Recommendations for an Aquatics Center and Additional Amenities
• Site Analysis and Conceptual Plans
• Recommendation of preferred amenities
12 Walnut, CaliforniaFindings Presentation and Visioning Workshop
• Presentation of initial findings
• Development of the vision for the outcome of the project
Staffing Recommendations
• Staffing organizational structure
• Recommended position descriptions
• Recommended staffing patterns
Operational Analysis
• Financial Assessment/Operations and Maintenance Projections
• Projected Cost Recovery
Draft Report and Presentation
• A Draft Report for review, edits, and comments to be included in the Final Report
Final Report
• Final Report providing the City of Walnut with recommendations for the Expansion of Walnut
Ranch Park
City of Walnut Community Services Overview
The City’s award-winning Community Services Department oversees recreation and maintenance for the
City of Walnut. The City maintains over 30 miles of trails, 11 City parks, beautiful park land, and several
outstanding recreation facilities. The City offers the community sports classes, leagues, recreation
classes, summer camps, seasonal aquatics programs, special community events, and excursions for all
ages.
The City of Walnut is home to approximately 29,944 people and covers approximately 8.9 square miles.
It is primarily a residential community with over 600 businesses. The City has a small town feel and is
well maintained.
The City of Walnut is a general law city incorporated on January 4, 1959. It is governed by the city
council/city manager form of government. A five-member City Council is elected by the residents, and a
Mayor is elected annually by the council to serve a twelve-month term. A City Manager is appointed by
the Council to oversee the daily activities of the City. Under the direction of the City Manager, the
Administrative Services Department is responsible for overseeing the day-to-day administrative
activities of the City. Specifically, the City Clerk, human resources, risk management, public information,
economic development, and public safety functions all fall under the Administrative Services
Department.
Also under the direction of the City Manager is the Community Development Department, which
encompasses building and planning, the Community Services Department, which oversees parks and
recreation as well as public works and engineering, and the Finance Department, which manages the
City’s budget and purchasing. The City of Walnut is a contract City which utilizes contracts with the
County and private businesses to provide essential services to their residents.
Walnut Ranch Park Expansion Study 13The Community Services Department is dedicated to serving the residents of the City and is efficient in
its operations. The City’s mission statement tells the story of its commitment to its residents.
City of Walnut Mission
Our mission is to exceed expectations of the people of Walnut. We collaborate with the
community to enhance our civic pride.
Walnut is a place where small town values are respected and blended with contemporary ideals. It
is a community that considers the lessons of the past, understands current and future realities, and
shares a sense of cultural belonging. These are the core values celebrated on the eve of the City’s
50th anniversary with our mission statement.
We will exceed expectations by:
• Delivering an excellent level of service
• Striving to be educated and well informed
• Rewarding innovation
• Seeking new cost efficiencies
• Preparing Walnut for the future
We will collaborate by:
• Encouraging open discussion
• Responding to residents with courtesy
• Embracing cultural diversity
• Providing clear directions for people using our services
• Building teamwork among employees
We will enhance civic pride by:
• Ensuring that the City is well maintained
• Promoting public safety
• Offering superior facilities and programs
• Creating opportunities for Walnut families
• Honoring the City’s history
• Supporting a prosperous business environment
• Recognizing achievements
14 Walnut, CaliforniaII. The City of Walnut’s Unique
Characteristics
Demographic Profile
Gaining a clear understanding of the existing and projected demographic character of the City of
Walnut, California, is an important component of the planning process. By analyzing population data,
trends emerge that can inform decision making and resource allocation strategies for the provision of
aquatics facilities and recreation amenities. The following key areas were analyzed to identify current
demographic statistics and trends to assist the planning and provision of aquatics facilities, programs,
and recreation services for the City of Walnut:
• Existing and projected total population
• Age and gender distribution
• Ethnic/racial diversity
• Household and housing information
• Educational attainment
This demographic profile was completed using the most updated information available (as of June 2017)
from Esri Business Analyst, the U.S. Census Bureau, and Census Bureau’s American Community Survey. A
summary of demographic highlights is noted in Table 3 below, followed by a more detailed analysis.
Table 3: 2016 City of Walnut General Demographic Profile
Population 29,944
Median Age 44.7
Households 8,675
Median Household Income $103,955
Source: Esri Business Analyst
Key general demographic comparisons – Local, State, and National:
• The median age of City of Walnut residents was 44.7 years, higher than the median age for the
state of California (36) and just higher than the median age for the United States (38).
• The median household income of City of Walnut households in 2016 was estimated to be
$103,955. This was significantly higher than the statewide ($62,554) and national ($54,149)
median household incomes.
• City of Walnut’s 2016 population was roughly evenly split between male (49%) and female (51%)
residents. The populations of California and the United States were also approximately evenly
divided between the sexes.
City of Walnut Population Projections
Although future population growth cannot be predicted with certainty, it is helpful to make growth
projections for planning purposes. Figure 1 contains actual population figures based on the 2000 and
2010 U.S. Census for the City of Walnut and Esri population estimates for 2016 and projections for 2021
which show a growth of 770 residents.
Walnut Ranch Park Expansion Study 15Figure 1: City of Walnut Population Growth Trend
31,000 30,714
30,500 29,977 29,944
Population
30,000
29,500 29,172
29,000
28,500
28,000
2000 2010 2016 2021
Year
Source: U.S. Census Bureau and Esri Business Analyst
Population Age Distribution
The existing and projected population of different age groups, or cohorts, within the City of Walnut is
illustrated in the following series of figures. Figure 2 illustrates the 2010 Census recorded population,
2016 estimated population and 2021 projected populations, and an estimated breakdown of the 2016
population by age cohort.
Several key age characteristics of the existing and projected City of Walnut population include:
• The population of residents between the ages of 10-14, 15-24, and 45-54 decreased between
2010 and 2016, and is projected to continue to decline through 2021.
• The populations of the residents in the 65-74 and 75-84-year cohorts increased between 2010
and 2016 and are projected to continue to increase through 2021.
Figure 2: Population Age Distribution in City of Walnut, 2010 to 2021
20.0
18.0
16.0
Percent Population
14.0
12.0
10.0
8.0
6.0
4.0
2.0
0.0
0 - 4 5 - 9 10 - 15 - 25 - 35 - 45 - 55 - 65 - 75 - 85 +
14 24 34 44 54 64 74 84
Age Cohorts
2010 2016 2021
Source: U.S. Census Bureau and Esri Business Analyst
16 Walnut, CaliforniaRace/Ethnicity
Prior to reviewing demographic data pertaining to a population’s racial and ethnic character, it is
important to note how the U.S. Census classifies and counts individuals who identify as of Hispanic. The
Census notes that Hispanic origin can be viewed as the heritage, nationality, lineage, or country of birth
of the person or the person’s parents or ancestors before arrival in the United States. In the U.S. Census,
people who identify as Hispanic, Latino, or Spanish may be any race and are included in all of the race
categories. All race categories add up to 100 percent of the population; the indication of Hispanic origin
is a different view of the population and is not considered a race.
Figure 3 reflects the approximate racial/ethnic population distribution for the City of Walnut based on
the 2010 U.S. Census, Esri estimate for 2016, and Esri population projection for 2021. The population
has been predominantly Asian, and is expected to increase by 3.3 percent from 2010 to 2021. The
number of Caucasian residents is expected to decrease by 2.8 percent from 2010 to 2021.
Figure 3: City of Walnut Racial and Ethnic Character 2010, 2016, and 2021
80
70
Percentage Population
60
50
40
30
20
10
0
African Native Two or More Some Other Hispanic
Caucasian Asian
American American Races Race Origin
2010 23.7 2.8 0.2 63.6 3.5 6 19.1
2016 21.9 2.6 0.2 65.6 3.6 6.1 19.2
2021 20.9 2.4 0.2 66.9 3.5 6 19.3
Source: U.S. Census Bureau and Esri Business Analyst
Figure 4 compares the 2016 racial and ethnic composition of the City of Walnut and the State of
California. The composition of City of Walnut’s population is substantially different from that of the
State of California. The Asian population is 51.4 percent higher in City of Walnut when compared to the
State of California. The Caucasian population of the City of Walnut is 33.6 percent less than that of the
State of California. Similarly, those of Hispanic Origin in City of Walnut are 20.2 percent less than that of
the State of California.
Walnut Ranch Park Expansion Study 17Figure 4: City and State Population Racial and Ethnic Character Comparison 2016
Source: U.S. Census Bureau and Esri Business Analyst
Household Information
As reflected in Table 4, the total number of housing units in the city has been increasing, and is
projected to continue to increase through 2021. This growth coincides with growth in the number of
households. In 2016, approximately 84 percent of housing units were owner occupied, 12 percent were
renter occupied, and only 3.6 percent were vacant.
Table 4: City of Walnut Housing Inventory
2010 2016 2021
Total Housing Units 8,753 8,997 9,204
Number of Households 8,533 8,675 8,853
Owner Occupied Housing Units 7,536 7,593 7,741
Renter Occupied Housing Units 998 1,080 1,114
Vacant Housing Units 219 324 350
Source: U.S. Census Bureau and Esri Business Analyst
Household Income
The most current data from Esri Business Analyst for 2016, illustrated in Figure 5, indicates that the
median household income in the City of Walnut was significantly higher than that of the average
household in California and almost doubles that of the United States’ median household income. The
median household income in the city was $103,955. This was 40 percent higher than the median
household income in California, and 48 percent greater than the national median household income.
18 Walnut, CaliforniaFigure 5: 2016 Median Household Income Comparison
Source: Esri Business Analyst
Figure 6 illustrates the distribution of household median earnings in the City of Walnut in 2016. It should
be noted that 52.7 percent of household median income was over $100,000, while 64.5 percent of
households earned a median income of at least $75,000.
Figure 6: Distribution of Median Household Income in the City of Walnut (2016)
$200,000+ 16.1
$150,000 - $199,999 14.3
$100,000 - $149,999 22.3
$75,000 - $99,999 11.8
$50,000 - $74,999 14.2
$35,000 - $49,999 9.2
$25,000 - $34,999 3.7
$15,000 - $24,999 3THIS PAGE INTENTIONALLY LEFT BLANK
III. Park and Recreation Influencing
Trends
The provision of public parks and recreation services can be influenced by a wide variety of trends,
including the desires of different age groups, community values, and popularity of a variety of
recreational activities and amenities. Within this section of this study, a number of local and national
trends are reviewed that should be considered by the City when determining where to allocate
resources toward the provision of aquatics and recreational facilities, and aquatics and recreational
programming for its residents and visitors.

National Recreation Trends of Relevance to the City of
Walnut
    Four major age groups, the Baby Boomers, Generation X, Millennials, and Generation Z, are
    having significant impacts in the planning and provision of parks and recreation services
    nationwide. The approximate ages of people within these generational groups include:
        • Baby Boomers: 52-70 years
        • Generation X: 37-52 years
        • Millennials: 18-36 years
        • Generation Z: 17 years and under

    In 2016 the majority (84.4%) of the City of Walnut’s population belonged to one of these
    age groupings. However, Millennials were the largest single generational group (26.6
    percent of the 2016 population) with Generation X just behind (25.5% of the 2016
    population). The population’s median age is 44.7 years.

The “2017 Participation Report” 1 from the Physical Activity Council characterized generational
participation in recreation, sports, fitness, and other physical activities as:

1Physical Activity Council, 2017 Participation Report, http://www.physicalactivitycouncil.com/PDFs/current.pdf; accessed June
2017

    Walnut Ranch Park Expansion Study                                                                              21
Adult – Baby Boomers
Baby Boomers are defined as individuals born between 1946 and 1964, as stated in “Leisure
Programming for Baby Boomers.” 2 They are a generation that consists of nearly 76 million Americans,
and comprised 18.9 percent of the City of Walnut’s population in 2017.
Adult – Generation X
This generational group is comprised of individuals in the 37 to 52-year-old age range. In 2017, the
median age of the City of Walnut’s residents was 44.7 years, and 13.4 percent of the City’s population
was a member of Generation X. Many members of this generation are in the peak of their careers,
raising families, and growing their connections within the community.
As suggested by the 2017 “Participation Report” from the Physical Activity Council, members of
Generation X were “all or nothing” in terms of their levels of physical activity, with 37 percent reported
as highly active, and 27 percent reported as completely inactive. As further noted in the report, over 50
percent of Generation X was likely to have participated in fitness and outdoor sports activities. An
additional 37 percent participated in individual sports.
Adult – The Millennial Generation
The Millennial Generation is generally considered those born between about 1980 and 1999, and in
April 2016, the Pew Research Center reported that this generation had surpassed the Baby Boomers as
the nation’s most populous age group. 3 Millennials comprised 26.6 percent of the City of Walnut’s 2017
total population. Millennials are the largest age cohort in the City. Having an understanding of some of
their general characteristics can help guide decision making for the provision of aquatics and recreation
facilities, programs, and services to this significant segment of the local population.
Youth – Generation Z
In the July 2012 issue of Parks and Recreation magazine, Emilyn Sheffield contributed an article titled
“Five Trends Shaping Tomorrow Today.” In it, she identified that the proportion of youth is smaller than
in the past, but still essential to our future. As of the 2010 Census, the age group under age 18 forms
about a quarter of the U.S. population. In the City of Walnut, 25.5 percent of the population was under
the age of 17 in 2017.
2 LindaCochran, Anne Roshschadl, and Jodi Rudick, “Leisure Programming For Baby Boomers,” Human Kinetics, 2009.
3Richard Fry, “Millennials overtake Baby Boomers as America’s Largest Generation,” Pew Research Center Fact Tank, April 25,2
016, http://www.pewresearch.org/fact-tank/2016/04/25/millennials-overtake-baby-boomers/, accessed May 2015
22 Walnut, CaliforniaWith regard to physical activity, a 2013 article published by academics at Georgia Southern University
noted that the prevalence of obesity in Generation Z (which they describe as individuals born since the
year 2000) is triple that of Generation X (born between 1965 and 1979). It suggests that due to
increased use of technology, Generation Z spends more time indoors, is less physically active, and more
obese compared to previous generations. The researchers noted that Generation Z seeks social support
from peers more so than any previous generation. This is the most competent generation from a
technological standpoint, but Generation Z also tends to fear, and often struggles with, some basic
physical activities and sports.
In a 2011 study of the Millennial Generation, 4 Barkley Advertising Agency made the following
observations about Millennials and health/fitness:
• Sixty percent (60%) of Millennials say they try to work out on a regular basis. Twenty-six percent
(26%) consider themselves health fanatics.
• Millennials are also fans of relaxation and rejuvenation, as 54 percent regularly treat themselves
to spa services.
Multiculturalism
The United States is becoming increasingly racially and ethnically diverse. In May 2012, the U.S. Census
Bureau announced that non-white babies now account for the majority of births in the United States.
“This is an important tipping point,” noted William H. Frey, 5 senior demographer at the Brookings
Institution, describing the shift as a “transformation from a mostly white Baby Boomer culture to the
more globalized multi-ethnic country that we are becoming.” Cultural and ethnic diversity adds unique
character to communities expressed through distinct neighborhoods, multicultural learning
environments, and restaurants, places of worship, museums, and nightlife. 6
As the recreation agencies continue to provide services within a more diverse society, race and ethnicity
in the City will become increasingly important factors in determining programming needs and means of
service delivery. More than ever, recreation professionals will be expected to work with and have
significant knowledge and understanding of individuals from many cultural, racial, and ethnic
backgrounds.
The City of Walnut’s 2016 estimated population was predominantly Asian (65.6%). An
additional 21.9 percent of the population was Caucasian with 19.2 percent identifying as being
of Hispanic Origin. The remaining population identified as Some Other Race (6.1%) of two or
more races (3.6%), African American (2.6%), and Native American (less than one percent).
4 American Millennials: Deciphering the Enigma Generation, https://www.barkleyus.com/AmericanMillennials.pdf, accessed
May 2015
5Adam Serwer, “The End of White America,” Mother Jones, http://www.motherjones.com/kevin-drum/2012/05/end-white-
america, May 17, 2012.
6 Baldwin Ellis, “The Effects of Culture & Diversity on America”, http://www.ehow.com/facts_5512569_effects-culture-
diversity-america.html, accessed on Sept. 20, 2012.
Walnut Ranch Park Expansion Study 23Aquatics/Water Recreation Trends
According to the National Sporting Goods Association (NSGA), swimming ranked third nationwide
among recreational activities in terms of participation in 2014. 7 Nationally, there is an increasing trend
toward indoor leisure and therapeutic pools. Swimming for fitness is the top aspirational activity for
inactive individuals in all age groups, according to the Sports & Fitness Industry Association (SFIA) 2016
“Sports, Fitness, and Leisure Activities Topline Participation Report,” representing a significant
opportunity to engage inactive populations.
Aquatics amenities such as splash pads, shallow spray pools, and interactive fountains are becoming
increasingly popular attractions in the summer months. These features can also be designed to be ADA-
compliant, and are often cheaper alternatives to build and maintain than community swimming pools.
Trends in the architectural design for splash parks can be found in Recreation Management magazine
articles in 2014 and 2015. 8
Older Adults and Senior Programming
Many older adults and seniors are choosing to maintain active lifestyles and recognize the health
benefits of regular physical activities. With the large number of adults in these age cohorts, many
communities have found a need to offer more programming, activities, and facilities that support the
active lifestyle this generation desires. Public parks and recreation agencies are increasingly expected to
be significant providers of such services and facilities. The American Academy of Sports Medicine issues
a yearly survey of the top 20 fitness trends. 9 It ranks senior fitness programs eighth among most popular
fitness trends for 2015. Programs including Silver Sneakers, a freestyle low-impact cardio class, and
water aerobics, are becoming increasingly popular as more Americans are realizing the many benefits of
staying active throughout life. According to the National Sporting Goods Association, popular senior
programming trends include hiking, birding, and swimming.
Festivals and Special Events
Festivals and other special events are often popular activities in communities that not only entertain,
generate economic activity, and serve to celebrate community identity, they are also fantastic means of
introducing people the community’s public parks and recreation system. Public parks and recreation
agencies play a major role in planning, managing, and hosting festivals and other community programs
that often serve to draw new users into their facilities. Attendants to events hosted in parks, or
recreation centers, who enjoy their experience may want to return for another event or program, or
simply to enjoy the park or recreation facility. Participants in these special programs can become
interested in visiting other parks, recreation facilities or participating in programs.
7 National Sporting Goods Association, “2014 Participation – Ranked by Total,”
8 Dawn Klingensmith “Make a splash: Spraygrounds Get (Even More) Creative,” Recreation Management, April 2014 (and April
2015 updates), http://recmanagement.com/feature_print.php?fid=201404fe01
9 American College of Sports Medicine, “Survey Predicts Top 20 Fitness Trends for 2015,” http://www.acsm.org/about-
acsm/media-room/news-releases/2014/10/24/survey-predicts-top-20-fitness-trends-for-2015, accessed January 2015.
24 Walnut, CaliforniaHealthy Lifestyle Trends and Active Living
Trails and Health
Trails can provide a wide variety of opportunities for being physically active, such as
walking/running/hiking, rollerblading, wheelchair recreation, bicycling, and horseback riding. Trails and
community pathways are a significant recreational and alternative transportation infrastructure, but are
most effective in increasing public health when they are part of a system. In fact, the Centers for Disease
Control and Prevention’s Trails for Health Initiative 10 concluded that a connected system of trails
increases the level of physical activity in a community. Several groups, including American Trails, have
created resources explaining the many benefits of trails,
http://www.americantrails.org/resources/benefits.
The health benefits are equally as high for trails in urban neighborhoods as for those in state or national
parks. A trail in the neighborhood, creating a “linear park,” makes it easier for people to incorporate
exercise into their daily routines, whether for recreation or non-motorized transportation. Urban trails
need to connect people to places they want to go, such as schools, transit centers, businesses, and
neighborhoods. 11
Trees would help provide protection, as tree leaves absorb about 95 percent of ultraviolet radiation, but
they take a decade or more to grow large enough to make a difference. So many communities are
building shade structures instead. The non-profit Shade Foundation of American is a good resource for
information about shade and shade structures, www.shadefoundation.org.
Trail Recreation and Cycling Trends
For trail-related recreation activities such as hiking, bicycling, and running, the 2016 “Outdoor
Recreation Topline Report” indicates a positive three-year trend for trail running, running/jogging,
hiking, mountain biking, and BMX biking, as shown on Table 5. Additionally, participation in trail running
and BMX biking is up significantly over the recent three-year period.
Table 5: Cycling and Trail Recreation Participation by Activity (Ages 6+)
3 Year
2010 2011 2012 2013 2014 2015 Average
Change
BMX Bicycling 2,369 1,547 2,175 2,168 2,350 2,690 7.5%
Bicycling (Mountain/Non-Paved
7,161 6,816 7,714 8,542 8,044 8,316 2.8%
Surface)
Bicycling (Road/Paved Surface) 39,320 40,349 39,232 40,888 39,725 38,280 -0.8%
Hiking (Day) 32,496 34,491 34,545 34,378 36,222 37,232 2.6%
Running/Jogging 50,713 52,187 54,188 51,127 49,408 48,496 -2.3%
Trail Running 5,136 5,610 6,003 6,792 7,531 8,139 10.7%
Source: 2016 Outdoor Recreation Participation Topline Report
10 Centers for Disease Control and Prevention, “Guide to Community Preventive Services,”
http://www.thecommunityguide.org/index.html
11 National Trails Training Partnership, “Health Community: What you should know about trail building,”,
http://www.americantrails.org/resources/health/healthcombuild.html, accessed May 2016
Walnut Ranch Park Expansion Study 25Trends in Marketing by Parks and Recreation Providers
Active Network offers expertise in activity and participation management. Its mission is to make the
world a more active place. In its blog, the organization offered the following marketing mix ideas which
came out of a meeting with park and recreational professionals in the Chicago area. 12
• Updated booths and community event presence – Utilization of a tablet or laptop to show
programs you offer and provide event participants the opportunity to register on the spot.
• Facebook redirect app – This application redirects people automatically to the link you provide.
Add it to your Facebook page.
• Instagram challenge – Think about how you can use mobile and social tools at your next event. It
could be an Instagram contest during an event set up as a scavenger hunt with participants
taking pictures of clues and posting them on Instagram.
• Social media coupons – Research indicates that the top reason people follow an organization on
a social network is to receive discounts or coupons. Consider posting an event discount on your
social networks redeemable by accessing on phone or printing out.
Mobile marketing is a growing trend. Social websites and apps are among the most used features on
mobile phones. Popular social media marketing tools include Facebook, Twitter, YouTube, Snapchat,
Instagram, and LinkedIn. Private messaging apps such as Snapchat and WhatsApp are being used more
often for live media coverage. 13
Ninety-one percent (91%) of Americans own a cell phone, and most use the devices for much more than
phone calls. Young adults engage in mobile data applications at much higher rates than adults ages 30
and older. Usage rates trends indicate that Millennials tend to get information most frequently using
mobile devices such as smartphones. For example, 97 percent of cell phone owners ages 18–29 send
and receive text messages, compared to 94 percent of ages 30–49, 75 percent of ages 50–64, and 35
percent of those 65 and older. In 2016, the vast majority of the population in the United States has
access to a smartphone, computer, or another device, and is nearly always “connected.”
12Active Network, http://www.activenetwork.com, accessed May 2014
13Jacqueline Woerner, “The 7 Social Media Trends Dominating 2015,” Emarsys Blog,
http://www.emarsys.com/en/resources/blog/the-7-social-media-trends-dominating-2015/, accessed February 26, 2015.
26 Walnut, CaliforniaIV. Public Input
Focus Group and Public Forum Input Summary
GreenPlay facilitated six focus groups, one public forum open to residents, and a presentation to the
City Council which was open to the public. The information gathered is very important to identify the
aquatics facilities, programs, and amenities that could be included in the Walnut Ranch Park Expansion
project to meet the identified needs of the community. The following is a summary of the focus groups
and public forum input which was used to develop the recommendations for the development of the
Walnut Ranch Park expansion.
The participants were asked what to identify the current strengths of the City of Walnut related to
aquatics that should be kept during the Walnut Ranch Park expansion planning. Participants gave these
responses (in order of how many times each was mentioned):
• Good aquatics program – very popular • Youth aquatics programs
• Swim lessons • Instructors are patient and
• Standard of training for coaching staff knowledgeable
• Availability of swim lessons, adaptive
and private
The participants were asked to identify the major weaknesses/areas of improvement that need to be
addressed during the Walnut Ranch Park expansion planning. Participants gave these responses (in
order of how many times each was mentioned):
• Cannot teach young kids to swim due to • Lack proper number of lanes
facility restraints • No public pool in Walnut
• No recreational swim programs • New aquatics center needs to have
• Cannot offer many programs because more than one way in and one way out
they do not have a facility • Lack of adult and senior aquatics
• Limited season programs including lessons
• No facility dedicated to City programs • Classes not offered in our area
• Parking relative to the location of the • Days and times of day for pool use is
pool and recreation area allotted by WVUSD
• Ingress/egress to park site appears to • Closures/technical problems take days
be limited before pool is functional costing the
• Emergency Access for emergency City money and inconvenience the
vehicles public
• Potential traffic congestion on Amar Rd. • Registration is cumbersome
• Insufficient space for competitive • Classes are stacked too close together
swimming for regional meets (twice a • Due to time constraints use of pool
year) – 15 – 20 teams, no data entry limits number of classes and the type of
space, spectator/team spaces for classes offered
canopies, vendor services, restrooms, • Additional instructors needed
drinking fountains, vendor services,
parking for catering trucks
Walnut Ranch Park Expansion Study 27The participants were asked what aquatics activities should be enhanced by the City of Walnut through
the Walnut Ranch Park expansion planning. Participants gave these responses (in order of how many
times each was mentioned):
• Swim lessons year-round/scholarship • Aquatics programs for youth and
program seniors
• Children’s aquatics programs and sports • Parent and me aquatics programs
• Aquatics fitness/exercise classes • Movie night/dive in movies
• Group classes • Adult and senior swim programs
• Need a year-round program including lessons
• Life safety classes • Junior lifeguard program
• Competitive swimming • Medical rehab programs in pool
• Leisure swimming
The participants were asked what additional aquatics activities should be offered by the City of Walnut.
Participants gave these responses (in order of how many times each was mentioned):
• Aquatics therapy/orthopedic swimming • Lap swim program
• Kids aquatics programs • Swimming for all ages
• Special events • Multigenerational swim programs
• Diving • Scuba diving
• Water polo • Water polo
• Water fitness classes/Zumba/aerobics • Water aerobics
• Leisure recreation swimming • Adult swim instruction
The participants were asked what aquatics programs they would participate in if the City offered
aquatics programs year-round. Participants gave these responses (in order of how many times each was
mentioned):
• Lap swimming • Youth swim lessons
• Recreational swimming • CPR class
The participants were asked what new services/programs they would like to see the City of Walnut
provide in an aquatics center. Participants gave these responses (in order of how many times it was
mentioned):
• Open swim time • Senior programs
• Year-round swim lessons • Teen programs
• Water polo • Food vendors
• Kids programs • Community service building for
• Youth nights banquets and classes for all ages
28 Walnut, CaliforniaYou can also read