Digital Platform/Mobile App to Boost Cycling for the Promotion of Sustainable Mobility in Mid-Sized Starter Cycling Cities - MDPI
←
→
Page content transcription
If your browser does not render page correctly, please read the page content below
sustainability

Article
Digital Platform/Mobile App to Boost Cycling for the
Promotion of Sustainable Mobility in Mid-Sized
Starter Cycling Cities
Mário Meireles 1, *        and Paulo J. G. Ribeiro 2, *
 1    Centre of Environment, Territory and Construction—CTAC, School of Engineering, University of Minho,
      4710-057 Braga, Portugal
 2    Department of Civil Engineering, School of Engineering, University of Minho, 4710-057 Braga, Portugal
 *    Correspondence: id6920@alunos.uminho.pt (M.M.); pauloribeiro@civil.uminho.pt (P.J.G.R.)

 Received: 3 February 2020; Accepted: 26 February 2020; Published: 7 March 2020

 Abstract: According to the United Nations, cities will represent two-thirds of the world’s population
 in 2050, which presents some challenges, especially to the transportation sector. To improve the
 population’s quality of life and the sustainability of cities, mobility must be sustainable, and cycling
 will play an important role in achieving this. Literature shows that we can promote cycling with
 better infrastructures, through multimodality, and through behavioral changes. Promoting the use of
 bicycles through behavior can involve a number of aspects, but in this work, we explore what a digital
 platform should have in order to promote and increase bicycle usage, as well as to improve cycling
 conditions in a city. To evaluate what is needed, we conducted an analysis on different types of digital
 platforms that are available on the market in order to assess the main characteristics and outputs that
 they provide to cyclists, as well as the type of information that can and should be added to promote
 the use of bicycles in cities. Moreover, we also carried out a survey in a Portuguese mid-sized “starter
 cycling city”, which showed, among other data, the relevance and type of information that a digital
 platform dedicated to cyclists should have in such types of cities.

 Keywords: Cycling; Mid-sized Cities; Starter Cycling Cities; Digital Platform; Sustainable mobility

1. Introduction
     In 2050, it is estimated that two-thirds of the world’s population will live in cities and by 2030,
this will already be around 60% [1]. This will represent challenges not only to the city, but also to
transportation planners, especially in terms of reducing and mitigating potential problems and impacts
related with this growth, such as accessibility/mobility, the use of public space, pollution, and many
other issues.
     Regarding urbanization and migration [2] as important city megatrends, it is relevant to point out
that cities are rapidly growing in space and time, pressuring the urban transportation sector (mainly
with environmental, social, and economic issues), as it was responsible for about 20% of all greenhouse
gas emissions in the world and 27.55% in Europe alone in 2014 [3]. In addition, it is the main contributor
to a decrease in safety in urban areas and inherent costs for societies. For example, road accidents in
Portugal represent a cost of 2 billion euros yearly [4].
     The current model of many European cities where the car remains the center of city planning
and urbanism will not be feasible in the near future [5]. We need to have “true” smart cities and thus,
we need smart mobility to achieve a sustainable city. The urban transportation system should be
sustainable and efficient. To enhance that, it should not be necessary to own or use a car within a city
and especially for commuting purposes. Travel within cities will have to be done on foot and by bicycle

Sustainability 2020, 12, 2064; doi:10.3390/su12052064                      www.mdpi.com/journal/sustainability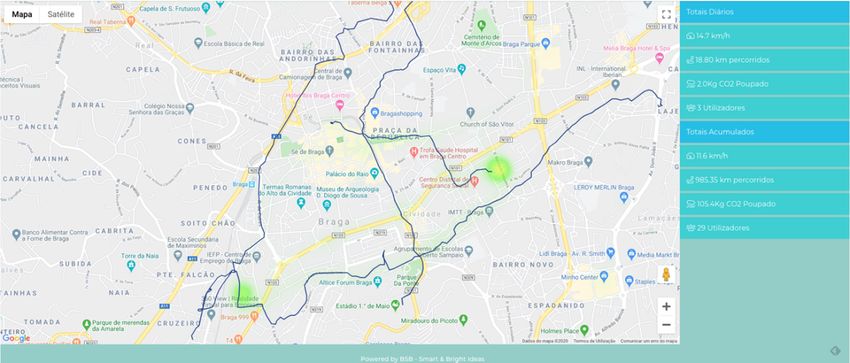
Sustainability 2020, 12, 2064                                                                        2 of 27

or in conjunction with public transportation [6], using the most sustainable means of transport. Here,
the bicycle plays an important role because in urban travels up to a maximum of 5–8 km, the bicycle is
the fastest means of transport [7], does not pollute, improves the user’s health [8], and occupies very
little public space for circulation and parking. For the city, this represents a benefit of 0.18€ per km
cycled (and if the person had traded their car for a bicycle, the benefit would be even higher because
each kilometer driven by car incurs an external cost of 0.11€) in comparison to the usage of cars [9] and
it can also increase by 10 times the range of a bus stop [10]. Thus, bicycles will be necessary to ensure
that populations move in a sustainable, smart, efficient, and effective way within city areas.
      “Smart velomobilities”, policies, and potential innovation (to define cycling as an active,
sustainable, inclusive, and networking mode of transport) are important to promote smart cities
in the context of being an asset using the Internet of Things [11], mainly regarding mobility issues.
      There are several ways to promote the use of a bicycle in a city. Several authors have concluded that
good infrastructural conditions enhance the use of the bicycle as a regular mode of transport [12–15],
showing that cycling infrastructure is an imperative condition to promote it. However, it is not always
sufficient and there are other integrative measures to promote cycling that have to be adopted, are
influential, and can speed up the process of adopting bicycles as a regular means of transport [16,17].
      In some areas of knowledge, there is an expectation that people will start using bicycles to
commute with little or even no infrastructure and few facilities. However, it is known that in the US,
only 4% of people are considered “strong and fearless” for cycling, i.e., they will use the bicycle without
any infrastructure. In the EU, the “strong and fearless” represent only 1%. The reasons for someone to
use a bicycle can be different, since bicycle users may be categorized in different ways, e.g., as pioneers
or followers [18–20]. On the other hand, the risk and its perception are directly related to the use of
bicycles as a regular means of transport [21]. Implementing aspects that might influence people to
use a bicycle more often as a regular means of transport takes time and needs political measures that
support it.
      Different cities present different levels of use, infrastructures, and political and cultural support
for the use of bicycles as a regular means of transport. Therefore, they must be studied, analyzed, and
planned to promote cycling in a customized way, i.e., more locally-oriented towards the respective
specificities of a territory and its people.
      Thus, cities with low cycling development or maturity are considered “starter cycling cities” [22].
These are cities with low cycling modal share (less than 10%) and that lack cycling infrastructures
and/or support facilities. In these cases, the aim should be to implement a basic cycling network before
any other measures that could stimulate cycling. In this regard, the city needs to communicate all the
benefits of cycling and the advantages of implementing a cycling network.
      However, there is insufficient data available on cycling in most cities to correctly assess how
many people are using their bicycle as a regular means of transport, how many kilometers are cycled
by each user, the profile of the cyclist, etc. Thus, in this context, research is even more necessary
to collect the necessary and relevant information that will allow one to diagnose issues and define
other solutions besides adequate infrastructure to promote cycling [23]. Transportation and urban
planners usually have to use studies from other contexts, i.e., other cities that are in different stages of
cycling evolution with more usage and infrastructures, to better target and develop the promotion
materials to encourage new users for cycling, to determine new locations of bike-sharing stations, to
help bike-sharing operators improve their systems [24], and even to help determine infrastructural
problems and ascertain potential location risks [25]. In other words, the data gathered were mainly
used to acknowledge where people are cycling so that the planners could prioritize interventions on
those streets, making cycling easier, safer, and more comfortable [26,27]. As such, it is necessary to
define a more suitable strategy and methodology to better promote cycling and, therefore, achieve a
more sustainable mobility in starter cycling cities.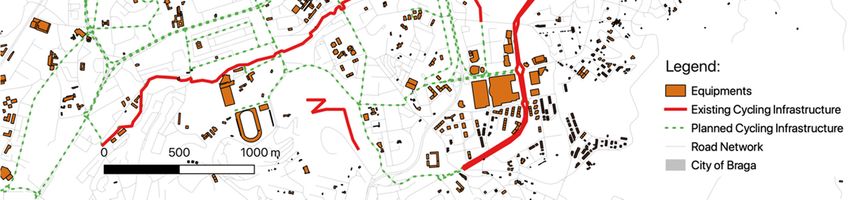
Sustainability 2020, 12, 2064                                                                        3 of 27

     The strategy adopted to promote cycling [28] must be based on three fundamental guidelines:
adequate infrastructure, complementarity with other public means of transport, and the support of
digital tools.
     The research of this study focused on the development of a digital tool that would support and
increase the use of cycling in a starter cycling city since, according to the literature, the other two
fields (infrastructure and multimodality) have been further studied and discussed already. In addition,
digital technology is still growing strong and rapidly and could be a very important asset to promote
cycling as a solution to establish mobility as a service (MaaS) in the future.
     With this in mind, we conducted research on the Portuguese city of Braga since the local
government assumed the need to improve both cycling and walking infrastructures in order to achieve
sustainable mobility. For this purpose, 22 km of cycling routes were created and complemented with
parking facilities in the city to promote multimodality. However, the local government has not yet
shown interest nor concern on the development of digital platforms that promote sustainable mobility
solutions, namely regarding cycling.
     It was then possible to arrive at the conclusion that neither the city of Braga nor other medium-sized
Portuguese cities have any type of digital support to promote cycling, which is a gap that this work
intends to address by developing a methodology that can be replicated in any other of the 332
Portuguese municipalities with small and medium-sized cities or in other parts of the world.
     Betting on the development of digital solutions to promote cycling is even more relevant in the
Portuguese context since the current Portuguese Government adopted a National Strategy for Active
Mobility—Cycling at the end of 2019, which defined the strategy to increase cycling in cities and to
make starter cycling cities increase their bicycle modal share to 10%. The goal for the country is to
achieve a 7.5% bicycle modal share, supported by a cycling network of 10,000 km until 2030 and other
support measures [29].
     Thus, this work aims to create proper digital cycling platforms and mobile applications that can
influence non-regular cyclists to adopt bicycles as their daily main means of transport, especially for
mid-sized starter cycling cities. We hope that this can be an example to replicate all around the world.
     The study will focus on the city’s existing cycling infrastructures, both digital and physical, and
on an evaluation of the potential influence that the information of a mobile app for cycling can achieve
based on a survey of the city’s current cyclists.
     It is important to restate that the survey was distributed to cyclists from the city of Braga in order
to assess the local characteristics, as well as the relevance of using a mobile application to improve and
boost cycling. The survey focused on cyclists who are familiar with the process of cycling in a context
of low modal representation, especially with motorized traffic. This work did not include non-cyclists
since they would not have the same perception about the reality of cycling in a starter cycling city,
even if they could make relevant contributions to understand what the main issues are and obstacles
for them to not use a bicycle. Beyond that, it is very unlikely that a non-cyclist will know the existing
cycling apps and platforms and will be able to evaluate their suitability regarding that activity.
     As such, the logic behind the choice of the survey’s sample was to encourage occasional cyclists
(the ones that cycle for sport or leisure) to use bicycles regularly, i.e., for commuting purposes, instead
of focusing on non-cyclists.
     The occasional cyclist group can represent up to almost 50% of the cyclists in starter cycling cities
and them starting to use the bicycle regularly can also have a strong influence on others, especially the
non-cyclist, therefore leading by example.
     The results of this study will allow and guide mid-sized starter cycling cities to integrate and
develop digital web/mobile platforms in the future, especially for promoting smart and sustainable
mobility. The more people use bicycles on their daily trips, the more cities become sustainable. So, we
will use the best features of every application and platform and conjugate them in one platform/app
with wider capabilities that are not only focused on the cyclist, but also on the city user.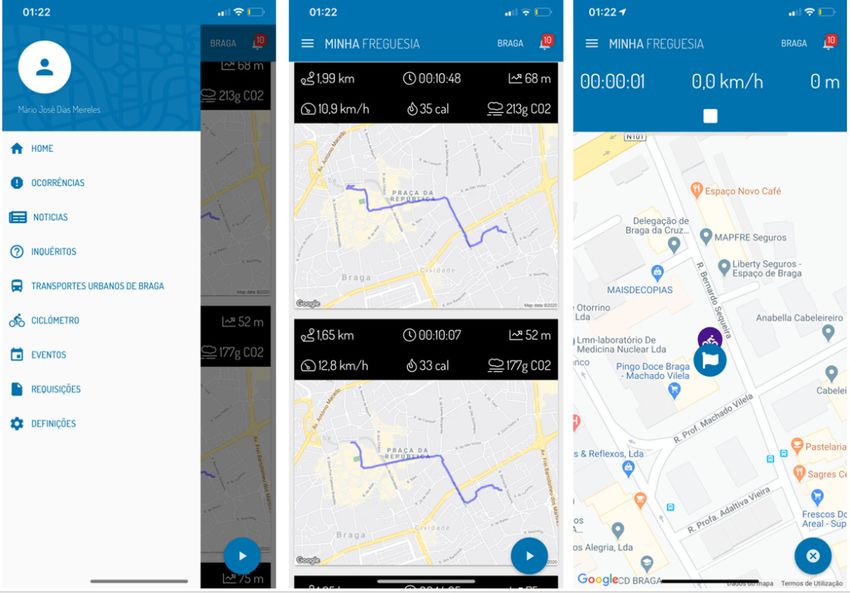
Sustainability 2020, 12, 2064                                                                           4 of 27

     The remainder of this article is as follows: Section 2 is state of the art, concerning cycling apps
and platforms; Section 3 describes the methodology that was used in this research; Section 4 is a results
analysis, which is discussed in Section 4; finally, in Section 5, the main conclusions of the investigation
are presented.

2. Theoretical Framework

2.1. Planning Cycling for a Sustainable Mobility
      Some authors argue that the main factor to promote cycling is the existence of an adequate, safe,
comfortable, and connected infrastructure [14,30–32] in order to guarantee that a city transforms itself
and creates the necessary conditions to offer the possibility of making a modal shift from the car to other
sustainable means of transport on people’s daily trips, especially to the bicycle. Thus, it is necessary to
create a cycling network that really allows people to move around the city without the need for polluting
vehicles. In order to achieve this through the improvement of cycling infrastructures, the city must
ensure five functional criteria, such as cohesion, directness, safety, comfort, and attractiveness [33,34].
Besides that, some effects need to be considered such as traffic evaporation [35], implementation of
traffic calming measures [36,37], cycling streets increasing the number of users [38], defining a hierarchy
decision regarding the type of cycling infrastructure that is most adequate to each street [37,39], and
guaranteeing some other support facilities, like adequate bicycle parking for every need [40,41]. It is
also important to mention that there is a need to define some guidelines regarding bicycle routes, such
as unidirectional lanes and banning cycling on the sidewalk [33,34,39,42].
      Literature shows that the lack of suitable infrastructure is not only an impediment to cycling,
but it is also one of the biggest barriers identified, especially by non-cyclists [43]. All the studies that
compared the barriers and constraints of cycling between cyclists and non-cyclists found significant
differences amid them, while among cyclists, they found more similar results [20,43–45] since this
group is usually treated as homogeneous. However, this can be considered an unsuitable approach
since the literature also recognizes the existence of different types of cyclist according to several criteria,
especially when it comes to the cycling experience. As such, different types of cyclists should have
different perceptions of the pros and cons of cycling.
      After the implementation of a cycling network, not only are there more people riding bicycles, but
non-cyclists also started cycling after this change. Although the numbers vary from one city to another,
it always shows an increase in cycling [46,47]. In addition, as was previously stated, the design of the
infrastructure may encourage more people to ride a bicycle [48].
      Why do we not have more commuters among bicycle users? Both cyclists and non-cyclists
share the idea that more road safety would encourage bicycle commuting [49]. One of the biggest
problems that non-cyclists point out for not using the bicycle is the danger that the city environment
imposes—sharing the road with a car is automatically seen as a dangerous thing. This barrier does not
exist when we talk about non-regular cyclists because they already have the experience of sharing
the road, so the obstacle to become a commuter decreases [20,43–45,50]. Among cyclists, there is a
multidimensional typology (dedicated cyclists, path-using cyclists, fair-weather utilitarian, leisure
cyclists), with each reacting differently to how a city promotes the regular use of bicycles [51]. People
who use a bicycle for sports or leisure should be more predisposed to commute by bicycle.
      From the analysis of the existing literature on the subject, we were able to conclude that
infrastructure is a necessary condition, although it is sometimes not sufficient to promote cycling. It is
also necessary to educate the public and provide more support facilities, e.g., make cycling campaigns,
add bike-sharing systems, give some financial incentives, and also implement some digital mobile
applications that can influence people to use their bicycles more often [13,19,22,28,52].
      Bike-sharing systems are turning the bicycle into a public transportation service as they are able
to increase the bicycle mode share by 1% to 1.5% in a city that has just implemented their cycling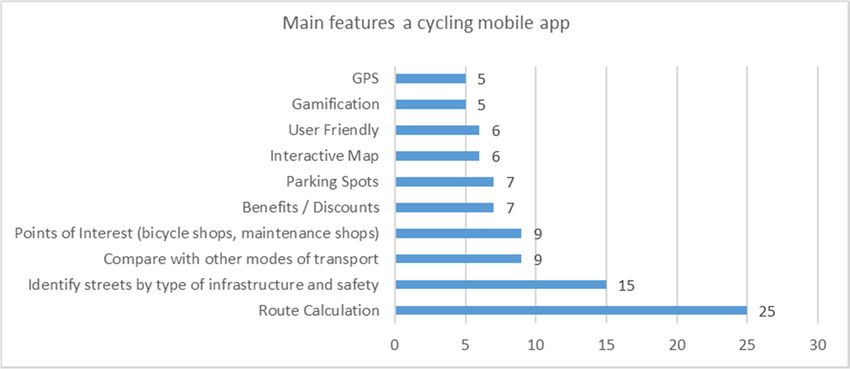
Sustainability 2020, 12, 2064                                                                        5 of 27

network [53]. However, the city must have a structured and continuous cycling network and the entire
system (e.g., the location of the stations) needs to be well designed and correctly implemented [53,54].
      On the other hand, multimodality between the bicycle and public transport, with the introduction
of bicycle parking and bike-sharing stations near bus stops, can increase the influence of a bus station
by 10 times [10].
      The literature also shows that there must be an effort to change people’s behavior, mainly through
marketing and educative campaigns promoting the use of sustainable means of transport in the
city [55]. There are campaigns to promote cycling to school and to work, like Bike to School Day or
Bike2Work [56,57], public campaigns to raise car drivers’ awareness to the presence of cyclists that
teach them some techniques, like opening the door with the right hand when exiting a car, and also to
raise awareness to the benefits of cycling in a city [27,58]; iii) debates, meetings, congresses, and forums
about cycling and mobility are important to put the bicycle on the Agenda of cities [59]; iv) laws, street
laws, and regulations must be revised in order to better protect the unarmed and more vulnerable road
users and to make the people who are using vehicles with a higher probability of causing injury and
death more accountable [60–63].
      All of these planning strategies and measures should be a part of a Sustainable Mobility Plan, with
actions, deadlines, budgets, and objectives promoting an efficient and sustainable city mobility [28,64].

2.2. Promoting Cycling with Digital Solutions for Sustainability
     As was stated in the introduction, this work will explore the growth of the bicycle as a main means
of transport through a behavioral change, through digital platforms, and smartphone applications.
Furthermore, this paper is going to present a methodology to help understand what kind of information
a digital app for cycling should have in order to simultaneously fill the gap of existing apps and fit the
local cyclists’ needs and expectations in order to change non-regular cyclists into regular ones and also
help non-cyclists to overcome some barriers related to the lack of information on cycling. Thus, in this
subsection, we will present brief state of the art information on the existing mobile apps that can be
used by cyclists, even if they have been developed with different means of transport in mind.
     Usually, when asking cyclists what triggers them, digital platforms or smartphone applications
are rarely mentioned, and when asking non-cyclists the same thing, digital platforms or smartphone
applications are never mentioned as something that could lead people to cycle more often, making
them irrelevant [21,44,46]. However, Portuguese studies show that when cyclists are questioned about
the potential that digital apps have to promote an increased frequency of cycling, these are scarcely
mentioned, still having a low impact [20,65].
     Navarro et al. [52] show that all the answers given to the survey regarding smartphones applications
or web-based platforms indicate that they are potential tools to promote as they engage and encourage
the residents of Sydney to cycle regularly.
     Schwanen [66] states that a mobile application can be a contributor to a transition towards
sustainable mobility, including urban cycling, but is not very clear on how smartphone applications
impact these innovations and trends. So, this is a question that needs to be explored in starter
cycling cities.
     A mobile cycling app can influence route choice and motivate cyclists to cycle more frequently
and with greater intensity, especially when the application has a gamification mode [67,68]. These
cycling applications are tools that are useful to understand how changes in infrastructure can improve
the use of the bicycle [69] and also support transportation planning and Smart Mobility [70,71].
     When talking about intelligent platforms or smartphone apps that motivate more people to cycle,
we are talking about “smart mobility”, which is an upgrade of the “Intelligent Transport”, which
focuses on geospatial technologies. Smart Mobility is concerned about the same technologies but in a
more critical perspective about the use, experience, and the politics that result from them [11,72,73].
     Furthermore, cycling and cycling apps are important in the context of Smart Cities [74]. Cities can
take advantage of the bicycle user to scan the city, i.e., being mobile sensors with their smartphones or by
Sustainability 2020, 12, 2064 6 of 27
turning bicycles into beacons in order to provide a lot of data and relevant mobility information [11,75].
This is part of the IoT (Internet of Things) and with all this information, cycling would be a mass
contributor to the Smart Mobility and consequently, to the Smart City [11].
More than Smart Cities, we need Sefficiency cities to face the future [76]. However, we can also use
it to classify cities that are efficient and incorporate the three dimensions of sustainability: environment,
economics, and society. It is necessary to discuss in detail the essential features that are needed for
achieving sustainability [77]. For that reason, we should have some tools that are able to measure the
performance of a city through the development of different potential techniques in the planning and
development of sustainable cities, but also some suggestions on how to reach a green economy and to
make some urban changes that lead to sustainable cities, especially in the mobility and transportation
system, so that politics and planners may adjust their policies.
The data produced by cycling mobile applications are being used to perform mobility analyses
in cities. Analyzing the most commonly used routes as well as the origins and destinations will
allow policymakers to map out mobility strategies and make decisions based on real data [78,79].
However, self-monitoring bike riding activities are related to a specific context or intent, such as sports
and health monitoring [80], which lack some accuracy in data acquisition. Using data from different
monitoring systems on cycling, like those that are used in Big Data systems, can be analyzed with
multiple purposes. It is important to discuss the use of mobile apps in order to highlight the health
benefits of cycling for users [81], as well as for Smart Cities [74].
There are some cycling tools that can be found in the CIVITAS initiative, which is a program
that is co-financed by the European Union, like “Bike Citizens App”, “BIKLIO”, “ByCycling”,
“TRACE—Walking and Cycling Tracking Services”, and “Bicycle Citizens”, which track cyclists’ routes
and gather information about stores and parking locations. The tracking made by these applications
represents a lot of data that can be used to help decision-making about cycling and allow city planners
to do so, taking into account cycling from a user’s perspective [78,82].
Some cities use data to better target promotion materials so that new users can be encouraged to
use bicycles, to suggest the location of bike-sharing stations, or even to help the bike-sharing operators
to improve [24]. Cities also use these data to help determine problems in the infrastructure and to
calculate the risk of cycling [25]. The data gathered were used to determine where people are cycling.
That way, the planners were able to define a hierarchy on the streets that need interventions to make
cycling comfortable or, in some cases, possible [26,27].
There are a lot of applications that provide information to end-users, but the information is
not always available or is expensive to planners. Bike Citizens is a digital platform that allows the
end-user to access its information and also planners to obtain data that can help them make informed
and data-sustained decisions. However, there are no cycling applications that allow users to report
problems [83].
CEiiA has developed a game-changing platform that rewards the user when he or she makes
choices that reduce CO2 emissions. The reward is AYR credits that can later be exchanged for services
provided by other applications. For example, you can change AYR credits for time in CIRC, an e-scooter
sharing app [84].
We have at our disposal different applications that sometimes do almost the same thing. We also
have several different applications that could work better if absorbed into only one app. For example,
we have some applications, like BSB’s “Minha Freguesia”, that allow us to report problems, check the
public transport lines and schedules, deal with local and municipal bureaucracy, register our pets, and
read local news. That kind of application could be upgraded to an integrated application that helps the
city to become a smart city, so we could also get some bicycle tracking and some data related to those
who use bicycles in cities.
However, cycling-related mobile apps cannot be seen by the city and transport management
authorities as the only data providers, but must instead be taken into account as efficient tools to
improve cycling in cities, especially from a user perspective. In this context, there are numerous cyclingSustainability 2020, 12, 2064 7 of 27
mobile applications available at Google and Apple online stores, such as Strava, Endomondo, BIKLIO,
among others. Most of the applications are designed to treat cycling as a sport, allowing users to map
and enrich the route with information about slopes, accumulated altitude, speeds, calories burned,
and distance travelled. For that reason, the majority of the existing platforms and applications do not
attend to the needs of common bicycle users due to not providing information about several issues
such as (i) tips on how to use a bike; (ii) the location of bike stores or bike-friendly stores; (iii) potential
benefits in said stores; information about lighting rules; (iv) how to ride on the road in the rain or in the
sun. In other words, existing digital platforms and apps are not providing a lot of useful information
for the non-cyclist who might even consider being a user or to those who use the bicycle as a regular
means of transport.
Regarding bicycle-related applications/platforms, it is important to highlight Strava and
Endomondo apps as the two most widely used cycling apps found in Apple and Google online
stores. Furthermore, Strava claims that it is “the #1 app for runners and cyclists” [85,86]. These
applications make it possible to map a particular route that a user takes and track the live and average
pace achieved. It is also possible to analyze users’ physical activity, namely, calories burned, average
and maximum speed, distance covered, and heart rate by using wearables like smartwatches [87]. On
the other hand, the application Garmin Connect needs a specific Garmin device to analyze and record
any kind of data collected during the trip [88].
Map My Ride is a cycling tracking app, from the same company as Endomondo, but with fewer
functionalities and less accuracy [89].
Komoot is an application that allows cyclists to plan routes or create new ones. These routes could
work as tour maps. When planning routes, users are given information about the best one according to
the type of bicycle they have, altitude, and estimated travel time. The experience is considered very
similar to Google Maps [90].
Relive is an app that can import data from other applications, such as Endomondo, Strava, Map
My Ride, Garmin, and more. At the same time, it also allows users to track their routes and to make
the corresponding video [91].
Biklio is an application that recognizes that bicycle users are making the city a better place, so
it rewards them with benefits offered by local establishments. It is an application that is already
available in 11 European cities, 4 of which are Portuguese. The application is available only in some
cities because they have to really embrace the concept so that the “spots” can promote their offers and
discounts that are available to cyclists using the app [92].
The MoveX app tracks users’ daily routine as long as they have their phone with them. This
app acknowledges the routes travelled, the time spent on each activity, steps taken, and the distance
travelled on foot, jogging, cycling, or being transported by other means [93].
Concerning all applications that can be used for cycling purposes, Table 1 summarizes the main
features that each offers its users as well as its level of use.
Table 1. Comparison of the characteristics of the analyzed cycling mobile applications (Source:
Own Work).
Comparison with
Nb. of Login Other Modes of
Apple
Users on Travelled Time of Calories with Elevation Average Instantaneous Transport
App Name Store Map
Google Distance Activity Burned Social Gain Speed Velocity (Tracking of the
Rank
Store Network Use of the Car,
Walking, Cycling)
Endomondo 87 * 661,765 o o o o o o o o
Strava 23 * 461,877 o o o o o o o o
Garmin Connect 72 * 392,049 o o o o o o
Map My Ride N.P. 121,589 o o o o
Komoot N.P. 92,533 o o o o o o
Relive 176 * 58,588 o o o o o
Biklio N.P. 36 o
Moves (Move X) N.P. - o o o o o
N.P.—No Position; * Health and FitnessSustainability 2020, 12, 2064 8 of 27
One of the problems associated with these applications is battery drain on smartphones, along
with a lack of GPS accuracy. One solution is to introduce beacons on bikes and even in some parts of the
city to communicate with the smartphone app using Bluetooth Low Energy (BLE) technology. However,
this requires that beacons are installed on people’s vehicles, which is not always possible [78,82].
All analyzed apps are designed to consider cycling as a sport. Nevertheless, it is possible to
identify some design problems and inconsistencies [94]. There is no app that is suitable to the use of
the bicycle as a commuter that considers other relevant information and the particulars of a city. Thus,
it becomes necessary to use multiple apps to interact, experience, and to learn how to behave in a city,
rendering the existing apps somewhat inefficient.
The use of digital platforms that track cyclists, such as Strava, is not only useful to gain background
information on existing bicycle usage, but also to influence more people to trade other means of
transportation for the bicycle. However, the data collected by Strava is expensive, i.e., cyclists need
to pay in order to access their own data collected by the app and it is not available to everyone [83],
which can be considered the main constraint to the use and dissemination of these tools to promote
cycling in a city.
3. Materials and Methods
3.1. Case study of Braga, PT. Characterization of Physical and Digital Cycling Infrastructures of the City
Braga is located in the North of Portugal and it is the country’s oldest city. In the past 50 years, it
has rapidly grown and sprawled to the surrounding areas on car-oriented urban planning. Nowadays,
only the historical city center can be considered a pedestrian and cycling-friendly area. With 181,484
residents, Braga is the 7th biggest city of the country population-wise and in a broader context, e.g.
European cities, it can be considered a medium-sized city [95]. It is located in a valley and 55% of its
population live in a relatively flat area.
Concerning weather, Braga is a South European city with a moderate average temperature (annual
maximum average is 17 ◦ C and the annual minimum average is 10 ◦ C) and during the year, it rains
about 45% of the time (average per year is 1822 mm), so it is rain-free about 195 days a year [16].
In the 2011 censuses, Braga presented a very low cycling mode share of 0.1%. In 2013, a mobility
study showed that the use of a bicycle in Braga increased to 0.4%. After that, there was no further
survey of the modal split in this territory and there is currently no reliable information about the real
number of people who use bikes on a regular basis. According to these values of cycling mode share,
Braga can be classified as a medium-sized starter cycling city.
According to the goals of the Portuguese National Strategy for Active Cycling Mobility, cities like
Braga have to reach 10% in bicycle mode share by 2030 [29]. In this context, Braga mobility goals are
aligned with the National Cycling Strategy since the city wants to have 10% of the population riding a
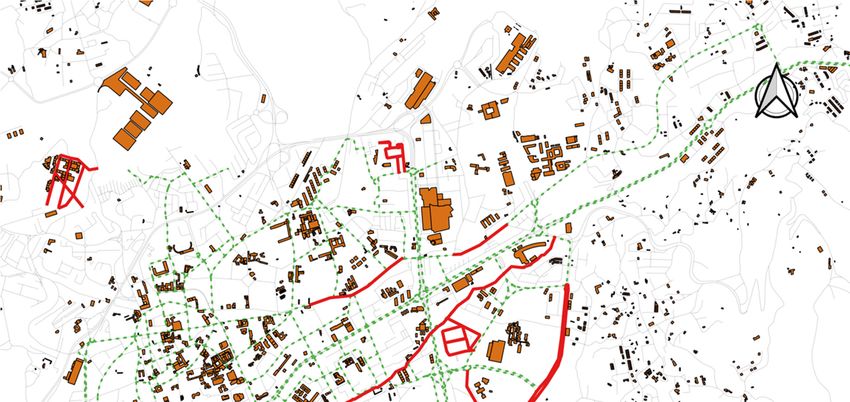
bicycle by 2025 [96]. Furthermore, the municipality of Braga has the intention to build a 76 km cycling
network during the next few years, starting with a 22 km network that includes the city of Braga [96],
as can be seen in Figure 1.
In general, the streets of Braga are car-oriented and not cycling-friendly. In fact, they are deterrents
for cycling and other active means of transportation, especially the primary and secondary distributors.
Braga has a large road network, with more than 1000 km of roadways. However, there are only
7.5 km of bicycle lanes (3800 m segregated, 700 m BUS + Bicycle, and 3030 m in coexistence with
pedestrians) [96], which do not form a complete cycling network. When observing the map of Figure 1,
one may see that there are several cycling infrastructures that are not interconnected and continuous
and also do not cover the center of the city, nor the majority of the most important facilities and
equipment of Braga. These factors represent the main barrier to what is intended, which is using
bicycles as a regular means of transport. Besides that, the city lacks bicycle support facilities like
parking places and maintenance spots.Sustainability 2020, 12, 2064 9 of 27
Sustainability 2020, 12, x FOR PEER REVIEW 9 of 27
Figure1.1.Map
Figure MapofofExisting
Existing and
and planned cyclingnetworks
planned cycling networksininthe
thecity
cityofofBraga
Braga (Source:
(Source: Own
Own Work).
Work).
InInterms
terms of of
digital cycling
digital infrastructures,
cycling infrastructures,it isit possible to verify
is possible to verifythatthat
Braga doesdoes
Braga not present digital
not present
solutions to support
digital solutions tocycling
supportmobility.
cycling In fact, notIneven
mobility. fact,Google
not even Maps allows
Google obtaining
Maps allowsitineraries
obtaining for
itineraries
bicycle trips,for bicycle trips, demonstrating
demonstrating that in
that there is a gap there
thisismatter
a gap inand thisthat
matter and
there that there
is room is room for
for improvement,
improvement,
both in quantityboth and in
in quantity and in quality.
quality. However, However, it
it is important to ishighlight
important thetorole
highlight the role ofthat
of associations
associations that promote the use of bicycles, like the Cycling Braga Association
promote the use of bicycles, like the Cycling Braga Association (Braga Ciclável), which developed (Braga Ciclável),and
which
made developed
available and
on its made aavailable
website map that onshows
its website a map that
the available shows
bicycle the as
lanes, available
well asbicycle lanes,routes
the desired as
well as the desired routes and parking spots
and parking spots for the city’s bicycle users [97]. for the city’s bicycle users [97].
3.2.
3.2. ModeltotoPromote
Model PromoteCycling
CyclingMobility
Mobility in
in Mid-Sized
Mid-Sized Starter
StarterCycling
CyclingCities
Cities
AsAs
thethe diagram
diagram in in Figure
Figure 2 shows,
2 shows, wewe have
have two
two ways
ways to start
to start promoting
promoting cycling
cycling mobility
mobility in
in cities.
A cities. A Bottom-Up
Bottom-Up StrategyStrategy can beby
can be forced forced by making
society, society, politicians
making politicians and adjust
and leaders leaderstheir
adjust their to
politics
politics to match people’s interests. Conversely, a Top-Down Strategy can be imposed or started by
match people’s interests. Conversely, a Top-Down Strategy can be imposed or started by leaders and
leaders and politics by their own initiative. Both ways should lead politics and leaders to create a
politics by their own initiative. Both ways should lead politics and leaders to create a Strategic Council
Strategic Council for Mobility, with territorial authorities, operating capacity, and a dedicated
for Mobility, with territorial authorities, operating capacity, and a dedicated budget. After that, there is
budget. After that, there is a need to create a Sustainable Urban Mobility Plan with the necessary
a need to create a Sustainable Urban Mobility Plan with the necessary policies and measures to ensure
policies and measures to ensure cycling in the city. These would be based on three main areas: i)
cycling in the city. These would be based on three main areas: (i) infrastructure, (ii) multimodality, and
infrastructure, ii) multimodality, and iii) behavior, including the development of digital support
(iii) behavior, including the development of digital support solutions.
solutions.Sustainability 2020, 12, 2064 10 of 27
Sustainability 2020, 12, x FOR PEER REVIEW 10 of 27
Figure2.2.Model
Figure Modelto
topromote
promote Cycling
Cycling mobility
mobilityin
inCities
Cities[adapted
[adaptedfrom
from15].
15].
When
When thethe implementation
implementation phase
phase of plan
of the the plan reaches
reaches a deadline,
a deadline, the Strategic
the Strategic CouncilCouncil for
for Mobility
Mobility can adjust the plan by tracking and monitoring it or, if it reached the last
can adjust the plan by tracking and monitoring it or, if it reached the last deadline, they should create a deadline, they
newshould create
plan and a new plan
implement and strategy
it. This implement thenit. continues
This strategy
withthen continues
the logic of PDCAwith(Plan,
the logic of PDCA
Do, Check, Act).
(Plan, Do, Check,
As stated in theAct).
introduction, the objective of this work focuses on triggering a change of behavior,
which canAs bestated in thethrough
achieved introduction, the objective
education, marketing, of and
this also
workthrough
focusesthe on usage
triggering a change
of digital of
platforms
behavior, which can be
and applications, among others. achieved through education, marketing, and also through the usage of digital
platforms and applications, among others.
It is known that digital platforms can help people to adopt the bicycle as a main means of transport
It is known that digital platforms can help people to adopt the bicycle as a main means of
in their multiple daily trips and could also increase its sporadic use, especially in cities where the level
transport in their multiple daily trips and could also increase its sporadic use, especially in cities
of usage and dedicated infrastructures are low, as it happens in starter cycling cities. Digital solutions
where the level of usage and dedicated infrastructures are low, as it happens in starter cycling cities.
can prepare the city’s population to better know the specificities of cycling and give them the support
Digital solutions can prepare the city’s population to better know the specificities of cycling and give
needed
them so thethat the expected
support needed so growth ofexpected
that the the city’sgrowth
cyclingofnetwork
the city’siscycling
achieved. Such is
network is achieved.
the case ofSuch
Braga
where over the next 5 to 10 years, 22 km of cycling lanes will be built.
is the case of Braga where over the next 5 to 10 years, 22 km of cycling lanes will be built.
3.2.1. Methodology for the Development of a Digital Solution (App) for a Starter Cycling City
3.2.1. Methodology for the Development of a Digital Solution (App) for a Starter Cycling City
ToToinspire non-regular
inspire non-regularcyclists
cycliststo
toride
ride aa bicycle as commuters
bicycle as commutersor
ortotoimprove
improvethe
theconditions
conditions
forfor
allall
bicycle
bicycle using citizens, it is useful to have a platform/mobile application that will help them byby
using citizens, it is useful to have a platform/mobile application that will help them
providing relevant information about cycling and app features that this type of user really needs andfor other types of users and thus, do not meet the real needs of cyclists from a starter cycling city.
For a starter cycling city, we argue that the first level of intervention (policy goal) should be
focused on non-regular cyclists, i.e., those who do not use bicycles daily or frequently, inspiring them
to become regular users—cycling commuters—since this group is already aware of the majority of
pros and2020,
Sustainability cons12,of cycling in this type of city. A comparison between the two groups of cyclists 11
2064 will
of 27
allow one to identify if there is a barrier and if so, whether it can be minimized through a digital
solution.
wants. Thus, Figure non-cyclists
In the future, 3 presents awill
diagram
also beofstudied
a methodology to develop
to try to come up withaa mobile
solutionapp
thatbased on two
encourages
information sources: (1) existing apps and digital platforms, and (2) a survey on existing
them to join the cycling community or to revise and improve the ones we arrived at during this stageusers of a
starter cycling
of the city.
project. Sustainable Transportation
with Digital Solutions
2.2. Promoting Active
Analyze different Platforms/Mobile Applications
Compare contents and features from Platforms/Mobile Applications
For the users, which contents and features can be
improved?
3. Materials and Methods
What is missing in these
Survey platforms/mobile applications
Statistical Analysis or what can be improved?
Sample Size
Descriptive Analysis
Conceptualization and Development of a Mobile Application and Platform
That Allows:
4. Results
- To have Non-Regular Cyclists riding a bicycle as commuters.
- To improve the conditions to use the bicycle
Figure
Figure 3.3.Methodology
MethodologyDiagram
Diagram (Source: Own
OwnWork).
Work).
In fact, the survey could also consider non-cyclists. However, in a city where the bicycle does not
have much use, the rationale was that the existing apps and digital solutions are being developed for
other types of users and thus, do not meet the real needs of cyclists from a starter cycling city.
For a starter cycling city, we argue that the first level of intervention (policy goal) should be
focused on non-regular cyclists, i.e., those who do not use bicycles daily or frequently, inspiring them
to become regular users—cycling commuters—since this group is already aware of the majority of pros
and cons of cycling in this type of city. A comparison between the two groups of cyclists will allow one
to identify if there is a barrier and if so, whether it can be minimized through a digital solution.
In the future, non-cyclists will also be studied to try to come up with a solution that encourages
them to join the cycling community or to revise and improve the ones we arrived at during this stage
of the project.Sustainability 2020, 12, 2064 12 of 27
3.2.2. Survey Framework
As such, we applied a survey to bicycle users of a starter cycling city in order to help us understand
their real needs and either realize the type of information they lack or improve the existing one, so
later we could develop an appropriate mobile application, considering the already existing digital
solutions and the characteristics of this type of city. With this in mind, we concluded that the survey
had to be based on a questionnaire with four different parts:
i. Profile of the cyclist (regular or non-regular users);
ii. Characterization of cycling in Braga;
iii. Evaluation of the main features we should use in promoting cycling, based on the three domains
presented in the model: (i) infrastructure, (ii) multimodality, (iii) behavior.
iv. Cycling digital platforms and applications (understanding the contents, features, and
information existing in apps that are available on the market).
The questionnaire was designed to learn and raise the profile of people who are using the bicycle
in Braga to understand to what ends these people use bicycles, if they are commuting by bike in
an intermodal way, to know the time and distance of their journeys, how they are experiencing the
infrastructure (or the lack of it), how they see and classify the factors that can influence them to use
bicycles, some open questions regarding said usage, and what they think about the weight that a
digital platform can have in influencing more people to cycle.
In this work, we focused on part iv) of the questionnaire, starting by analyzing and comparing
the existing cycling digital platforms and mobile applications in order to understand what features
each one of them offers and which ones are missing. Thus, at the same time of the survey, we also
acknowledged the features that are missing from the existing software that could be added to a new
platform designed to improve cycling in a mid-sized starter cycling city.
Applying this methodology to the case study of Braga will provide relevant information to guide
other mid-sized starter cycling cities to develop web platforms and apps in the future, especially to
make them realize that cycling is a way to achieve smart and sustainable levels of urban mobility.
3.3. Sample
While there is a lot of data and research about the use of the bicycle as a means of transport in
some European countries like the Netherlands [98], Germany [99], Denmark [100], France [101], or
Great Britain [102], this is not the case in Portugal, and especially in the city of Braga. Knowing the
approximate number of people using bicycles in Braga i.e., to define the population of this case study
analysis, was hard and required a lot of effort.
It would be easier if the analysis focused only on non-cyclists since we could consider them to be
almost the entire population of the city of Braga, considering that the mode share for cycling is around
0.4%. Beyond that, to get 400 or 1000 non-cyclists to answer the questionnaire would be much easier
since the number of cyclists is very small, with Braga being a starter cycling city.
Furthermore, the major barriers and other information identified in the other studies mentioned
in the theoretical framework [20,21,44,46] regarding non-cyclists would probably be similar to the
non-cyclists of Braga. After analyzing the literature, we were able to conclude that building a safe
and well-designed infrastructure is the main way to get more people cycling, ideally also converting
non-cyclists into cyclists. However, in the case of cyclists, we have different types of users and reasons
for cycling, or not, on a regular basis. Thus, knowing the profile, needs, and expectations of the
different types of cyclists in Braga will allow one to develop a digital solution that can be designed to
increase cycling frequency and somehow influence people in becoming commuters.
Additionally, developing a digital solution based only on non-cyclists’ contributions would
probably lead to a digital solution that is already present in the market since this group would be much
more focused on infrastructure, safety, and multimodality issues that would not be directly solved
with an app. Beyond that, the probable unfamiliarity with this type of cycling app would not allowSustainability 2020, 12, 2064 13 of 27
them to draw reliable conclusions in accordance to the specific needs of cyclists, even in the case of a
starter cycling city.
In this context, the target audience for this questionnaire was the bicycle users, i.e., cyclists who
travel by bicycle in Braga, for different purposes like sport, leisure, and commuting, among others. To
define the current number of cyclists in Braga, we analyzed several sources of information and data.
Thus, in 2011, the Portuguese Census indicated that in Braga, 196 people used bicycles as their
main means of transport (the preferred) for commuting [103]. However, this question could limit the
accounting of people who cycle in the city since an affirmative answer from those who use bicycles as
a means of transport but not as their preferred mode were automatically excluded. More recently, a
mobility study for the Region of Braga named “Quadrilateral Integrated Mobility Study (Estudo de
mobilidade integrada do Quadrilátero)” indicated that 725 people used bicycles (0.4% of the population),
regardless of whether they used it for commuting (as a main means of transport), exercising, or leisure
purposes [104]. This originated a discrepancy in the numbers because censuses counting was limited
to cyclists that travel by bicycle as their main means of transport for daily commuting.
As such, with the collective effort of Cycling Braga Association (Braga Ciclável), Minho Bicycle
Tourism Association (Associação de Cicloturismo do Minho), and Cycling Club of Braga (Clube de Ciclismo
de Braga), it was also possible to identify 722 people who used bicycles in 2019, regardless of the purpose.
That number was then accepted as valid and was presented in the “integrated mobility study for four
main municipalities of Minho Region” and was considered the population for statistical analyses.
Once the statistical population was set on 725 cyclists, the questionnaire was applied to a random
sample for significant convenience for a confidence interval of 95% and an error margin of 5%, resulting
in a sample size of at least 252 respondents.
Since the structure or the stratification of data was not available for the cycling population, the
statistical analysis had to be based on nonparametric assumptions and tests.
For this article, we analyzed the different questionnaire parts concerning the characterization of
cycling and also the platforms and mobile applications for cyclists.
3.4. Survey
According to the proposed methodology, we prepared a questionnaire with 30 questions using
the online platform SurveyMonkey. This was available on the platform from 19 December 2018 to 29
March 2019 in order to reach more bicycle users and also to allow people to manage the time they had
available to answer.
The questionnaire was firstly applied, in a pre-test, to 30 cyclists through an online survey and
was later disseminated by web and e-mail and also near bicycles parked through the city. We collected
338 responses, but only 275 were considered complete and valid answers.
The pre-test allowed us to adjust some issues related to the features and user interaction with the
questionnaire, which required answering follow-up questions that should only present themselves if
there was a previous specific answer, e.g., “Did the respondent use the bike in a complementary way
to another means of transport?” and then another question would arise, prompting them to indicate
which complementary means of transport, even if the answer was “No”.
Once the questionnaire was adjusted, it was then disseminated on social networks, either through
personal messaging or by sharing in groups related to bicycle mobility in the city of Braga. It was also
sent via email to members of local cycling associations, such as Braga Cyclable Association (Braga
Ciclável), Minho Bicycle Tourism Association (Associação de Cicloturismo do Minho), Braga Cycling Club
(Clube de Ciclismo de Braga), all the students from the University of Minho, Braga’s school groups, and
to Go By Bike and Bike Zone’s customers. At the same time, small flyers were distributed with a
small text and a QRcode, making the questionnaire accessible to more bicycle users from Braga. These
pamphlets were left on the handlebars of the bicycles found in the city.Sustainability 2020, 12, 2064 14 of 27
3.5. Statistical Data Analysis
To properly analyze the data collected, we used SPS—Statistical Package for the Social Science,
executing a descriptive analysis of the results and using the Mann-Whitney U test in order to compare
the results about the main cycling issues for regular and non-regular cyclists in Braga.
In short, the Mann-Whitney test (Non-parametric test) compares the outputs between two
independent groups (Cyclists—Regular and Non-Regular). The null hypothesis for the nonparametric
test is H0: The two populations are equal. An underlying assumption for appropriate use of the U test
was that the continuous outcome was approximately normally distributed or that the samples were
sufficiently large to justify their use, based on the Central Limit Theorem (with more than 50 elements),
which was verified.
The test statistic for the Mann Whitney U Test is U, and which is the smaller of U1 and U2 is
defined by the following equations:
n1 (n1 + 1)
U1 = n1 n2 + − R1 (1)
2
n2 (n2 + 1)
U1 = n1 n2 + − R2 (2)
2
R1 is the sum of the ranks for group 1
R2 is the sum of the ranks for group 2.
The U test is a nonparametric test of the null hypothesis, which is designed to test differences
between groups using ordinal data. A hypothesis is rejected when the p-value (significance) is lower
than 0.05, indicating that there was a significant difference in the evaluation made (Soria-Lara et al.,
2017). Thus, the U test can be used for rejecting or not rejecting options according to the statistical
significance of the answers obtained.
4. Results
4.1. Main Results about Cycling in the City of Braga
The implementation of the questionnaire resulted in 275 responses, which was sufficient to yield
results with statistical significance considering the population of 725 cyclists, with a confidence interval
of 95% and an error margin of 5%.
These survey results allowed us to build the main profile of the people who use bicycles in Braga.
Of all the respondents, 73.1% were men and 26.9% were women. More than half (52%) were married
or in a civil union, 39.6% were single, and 8.4% divorced.
In terms of literacy, 0.7% were illiterate, 6.2% had a basic education, 21.5% had secondary education,
and 70.8% had a superior degree (30.5% had graduated, 35.6% had a masters degree, and 4.7% had
a PhD).
Regarding their professional activity, 68.7% were employed, 13.8% were self-employed, 8.4% were
students, 6.2% were unemployed, and 2.9% were retired.
In Braga, about half of the cyclists use bicycles on a regular basis, i.e., for commuting purposes, and
the other half use them more sporadically (non-regular), i.e., for leisure and sport purposes (Table 2).
Table 2. Types of Cyclists in Braga (Source: Own work)
Type of Cyclist Frequency Percentage (%)
Regular (Commuter) 143 51.7
Non-Regular (Sport Cyclist/Leisure) 132 48.3Sustainability 2020, 12, 2064 15 of 27
Most of the people who answered use a bicycle combined with another means of transport, i.e., in
a multimodal way, and it was said that the car (diesel) was the other vehicle. Furthermore, only 29.8%
of the cyclists combined the bicycle with public transportation (mainly the bus and the train).
Table 3 shows the relevance that the two groups of cyclists (regular and non-regular) give to
the main cycling issues in the city of Braga, concerning network criteria, physical characteristics
(infrastructures), support facilities, safety measures, and environmental and health features.
Table 3. Level of importance of the main cycling issues for cyclists in Braga (Source: Own Work)
Group Issues Type 1 2 3 4 5 Mean Median
R. 39.2% 30.8% 18.9% 9.1% 2.1% 2.04 2.00
Cohesion
N.R. 39.4% 27.3% 24.2% 7.6% 1.5% 2.05 2.00
R. 11.2% 26.6% 29.4% 22.4% 10.5% 2.94 3.00
Directness
N.R. 12.1% 26.5% 40.2% 12.9% 8.3% 2.79 3.00
Network
Criteria R. 30.8% 27.3% 23.8% 14.0% 4.2% 2.34 2.00
Safety
N.R. 29.5% 34.8% 26.5% 6.8% 2.3% 2.17 2.00
R. 19.6% 29.4% 34.3% 14.7% 2.1% 2.50 3.00
Comfort
N.R. 18.2% 33.3% 37.9% 7.6% 3.0% 2.44 2.00
R. 10.5% 30.1% 28.7% 21.0% 9.8% 2.90 3.00
Attractiveness
N.R. 17.4% 28.8% 31.8% 17.4% 4.5% 2.63 3.00
R. 0.7% 2.1% 10.5% 25.9% 60.8% 4.44 5.00
Segregated Cycling Network
N.R. 2.3% 1.5% 18.9% 29.5% 47.7% 4.19 4.00
R. 2.8% 4.9% 19.6% 44.8% 28.0% 3.90 4.00
Physical Direct Way (Shortest way)
N.R. 0% 10.6% 26.5% 31.1% 31.8% 3.84 4.00
Characteristics
Cycle path where the pavement is R. 2.8% 2.1% 13.3% 26.6% 55.2% 4.29 5.00
not cobblestone or damaged N.R. 0.8% 4.5% 22.0% 31.8% 40.9% 4.08 4.00
R. 7.7% 11.2% 24.5% 31.5% 25.2% 3.55 4.00
Street Slope
N.R. 9.1% 12.9% 25.8% 25.9% 27.3% 3.48 4.00
R. 1.4% 4.2% 14.7% 25.2% 54.5% 4.27 5.00
Bicycle parking
N.R. 3.8% 8.3% 15.2% 28.8% 43.9% 4.01 4.00
Support Maintenance and washing points R. 14.7% 22.4% 28.0% 20.3% 14.7% 2.98 3.00
Facilities for bicycle N.R. 7.6% 18.2% 37.1% 18.9% 18.2% 3.22 3.00
R. 9.8% 20.3% 25.2% 23.1% 21.7% 3.27 3.00
Bike-sharing system
N.R. 7.6% 17.4% 26.5% 25.8% 22.7% 3.39 3.00
R. 2.8% 5.6% 13.3% 24.5% 53.8% 4.21 5.00
Reduced Speed of cars
Safety N.R. 3.8% 3.8% 16.7% 28.8% 47.0% 4.11 4.00
Measures R. 2.8% 1.4% 14.0% 25.2% 56.6% 4.31 5.00
Pedestrian zones transformed into
coexistence zones N.R. 3.8% 3.0% 18.2% 38.6% 36.4% 4.01 4.00
R. 11.9% 18.9% 28.0% 24.5% 16.8% 3.15 3.00
Heat
N.R. 6.1% 18.2% 36.4% 25.0% 14.4% 3.23 3.00
Environmental R. 8.4% 10.5% 15.4% 29.4% 36.4% 3.75 4.00
Rain
and Health N.R. 3.0% 7.6% 28.8% 25.8% 34.8% 3.82 4.00
Features R. 0.7% 2.1% 11.2% 19.6% 66.4% 4.49 5.00
Benefits for Health
N.R. 0% 0% 9.1% 18.2% 72.7% 4.64 5.00
R. 0% 4.9% 8.4% 18.2% 68.5% 4.50 5.00
Reduction of Pollution
N.R. 2.3% 0.8% 5.3% 18.2% 73.5% 4.60 5.00
Scale of the level of Importance 1—Low importance, 2—Slightly important, 3—Neutral, 4—Moderately important,
5—Very important. R—Regular; N.R.—Non-Regular.
Regarding network criteria, it was possible to conclude that attractiveness, comfort, and directness
of cycling infrastructure are the three most important factors for both groups of cyclists. This means
that these are, from the respondents’ point of view, the three most important functional requirements
that must be ensured in cycling network planning.
At the same time, cyclists said that the existence of segregated cycling infrastructures, the existence
of safe cycling parking places, and smooth pavements not made of cobblestone and without damage
are the three most important aspects concerning the physical characteristics of cycling infrastructures.You can also read