Biomass with CO2 Capture and Storage (Bio-CCS) - The way forward for Europe
←
→
Page content transcription
If your browser does not render page correctly, please read the page content below
Biomass with CO2 Capture
   and Storage (Bio-CCS)

         The way forward for Europe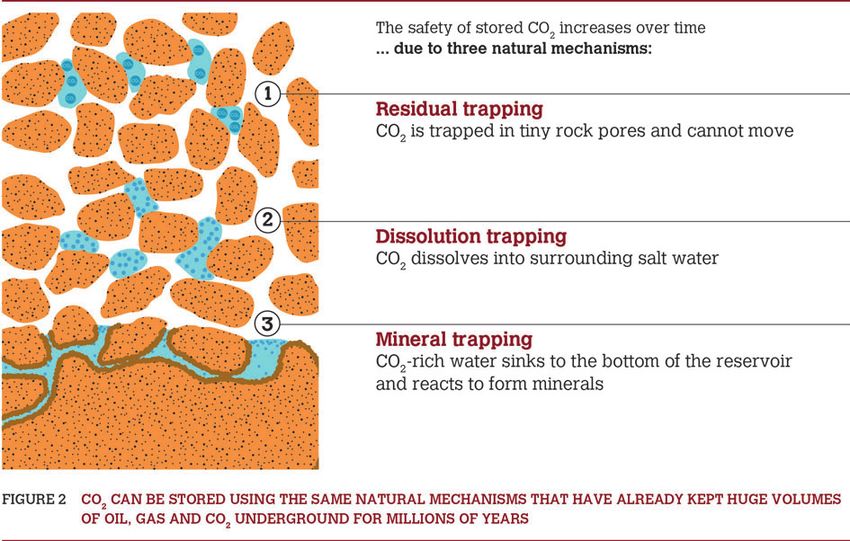
This document has been prepared on behalf of the Advisory Council of the European Technology Platform for Zero
Emission Fossil Fuel Power Plants (ZEP) and the Steering Committee of the European Biofuels Technology Platform (EBTP).
The information and views contained in this document are the collective view of the ZEP Advisory Council and EBTP
Steering Committee and not of individual members, or of the European Commission. Neither the ZEP Advisory Council,
the EBTP Steering Committee, the European Commission, nor any person acting on their behalf, is responsible for the use
that might be made of the information contained in this publication.

European Technology Platform for Zero Emission Fossil Fuel Power Plants
Contents

KEY CONCLUSIONS........................................................... ....................................................................... 4

1     WHY EUROPE NEEDS TO GO CARBON-NEGATIVE ....................................................................... 5
      1.1 More powerful technologies are now needed to keep global warming below 2°C........................ 5!
      1.2 Bio-CCS: the only large-scale technology that can remove CO2 from the atmosphere.... ........... 5!
      1.3 The EBTP/ZEP Joint Taskforce Bio-CCS: uniting high-level European stakeholders ................. 6!

2!    CO2 CAPTURE AND STORAGE .......................................................................................................... 7!
      2.1! CCS could provide almost 20% of global emission cuts required by 2050 .................................. 7!
      2.2! The safety of CO2 storage actually increases over time............................................................... 7!
      2.3 CCS technologies are already proven on a small scale... ............................................................ 9!

3     BIOMASS FEEDSTOCKS........ ......................................................................................................... 10!
      3.1 Biomass use for energy is steadily increasing in the EU and beyond........................................ 10!
      3.2 A wide range of biomass feedstocks is available ....................................................................... 10
      3.3 The benefits of advanced and algal biofuels.. ............................................................................ 11!
      3.4 The importance of using sustainably produced biomass... ........................................................ 12!

4     BIO-CCS TECHNOLOGY ROUTES.................................................................................................. 13
      4.1 Bio-chemical production of biofuels............................................................................................ 13!
      4.2! Thermo-chemical production of biofuels and biochemicals........................................................ 15!
      4.3! Biomass combustion for electricity and/or heat production ........................................................ 16!
      4.4! Bio-CCS in industrial applications .............................................................................................. 17!

5     BIO-CCS POTENTIALS IN 2030 AND 2050 ..................................................................................... 18
      5.1 Negative emissions are additional to any abatement from replacing fossil fuels with biomass.. 18!
      5.2 Globally, Bio-CCS could remove 10 Gt of CO2 from the atmosphere every year by 2050......... 18!
      5.3 In Europe, Bio-CCS could remove 800 Mt of CO2 from the atmosphere every year by 2050.... 19!
      5.4 800 Mt of CO2 is equivalent to over 50% of current emissions from the EU power sector......... 20!

6     ECONOMIC FACTORS ...................................................................................................................... 21
      6.1 Biofuels production with CCS is a key “low-hanging fruit” for CCS deployment ........................ 21!
      6.2 Biomass co-firing at moderate percentages can be flexibly applied .......................................... 21!
      6.3! Biomass prices will increase unless novel feedstocks are sufficiently up-scaled....................... 22!

7! !!ACCELERATING DEPLOYMENT ...................................................................................................... 23!
     7.1 Take urgent action at EU/Member State level to support CCS demonstration projects............. 23
     7.2 Identify the most effective Bio-CCS options for the short to medium term ................................. 24
     7.3 Accelerate RD&D for sustainable advanced biofuels................................................................. 26
     7.4 Establish Bio-CCS value chains in Europe................................................................................. 27
         7.4.1 Reward negative emssions in the EU ETS....................................................................... 27
         7.4.2 Deploy advanced biofuels production with CCS............................................................... 28
         7.4.3 Maximise the potential for biomass (co-)firing with CCS ................................................. 28
     7.5 Address issues specific to Bio-CCS deployment........................................................................ 29
     7.6 Build on public support for Bio-CCS ........................................................................................... 29!

ANNEX: Members of the EBTP/ZEP Joint Taskforce Bio-CCS ............................................................ 30!

                                                                                                                                                 3
Key conclusions

•    Recent research indicates that more powerful technologies are now needed to keep global
                         1
     warming below 2°C – and avoid irreversible climate change. This is echoed by warnings from both
     the United Nations Framework Convention on Climate Change (UNFCCC) and the International
     Energy Agency (IEA).

•    There is therefore an urgent need for carbon-negative solutions such as Bio-CCS – the only large-
     scale technology that can remove CO2 from the atmosphere. Bio-CCS combines sustainable
     biomass conversion with CO2 Capture and Storage (CCS) – e.g. in biofuels and bioenergy
                                                                               2
     production – and is already being deployed at industrial scale in the U.S. .

•    Use of biofuels and bioenergy is steadily increasing in the European Union (EU) due to targets for
     renewable energy sources and certain biofuels production routes could provide “low-hanging
     fruits” for early, low-cost CCS deployment.

•    A recent study indicated that, globally, Bio-CCS could remove 10 billion tonnes of CO2 from the
                                      3
     atmosphere every year by 2050 using available sustainable biomass – equivalent to a third of all
     current global energy-related emissions. In Europe, Bio-CCS could remove 800 million tonnes of
                                                      3
     CO2 from the atmosphere every year by 2050 using available sustainable biomass – equivalent
     to over 50% of current emissions from the EU power sector. This is in addition to any emissions
     reductions achieved by replacing fossil fuels with that biomass.

•    Bio-CCS could ultimately result in industry sectors whose overall emissions are below zero,
     which could then offset emissions in other sectors where reductions are more difficult to attain.

The following actions are therefore urgently required at EU level:

•    As for other low-carbon technologies, establish economic incentives to enable the large-scale
     deployment of Bio-CCS – in particular, reward negative emissions via the capture and storage
     of biogenic CO2 under the EU Emissions Trading Scheme, in the same way as for fossil CCS.

•    Identify and incentivise the clustering of small-scale biogenic emission sources with other
     emission sources in order to achieve economies of scale for CO2 transport and storage.

•    Undertake R&D to determine the costs of the various Bio-CCS routes, including additional
     costs induced by corrosion and other technology challenges when co-firing with high biomass
     percentages in existing boilers.

•    Establish dedicated funding for R&D and pilot projects to further develop and prove advanced
     technologies.

•    Address issues specific to Bio-CCS deployment (e.g. accelerate deployment of advanced
     biomass conversion processes) and establish an EU roadmap towards 2050.

•    In addition, establish additional non-ETS measures to enable EU CCS demonstration projects
     to take Final Investment Decision (FID) and provide security for long-term investment.

1
  Above 1990 levels, as advised by the Intergovernmental Panel on Climate Change (IPCC)
2
  The ADM bioethanol-CCS project – see page 21
3
  IEA Greenhouse Gas (GHG) Programme. Comprehensive life-cycle analyses (LCAs) for the carbon balance of biomass supply
  and conversion routes should be performed to verify these numbers.
                                                                                                                          4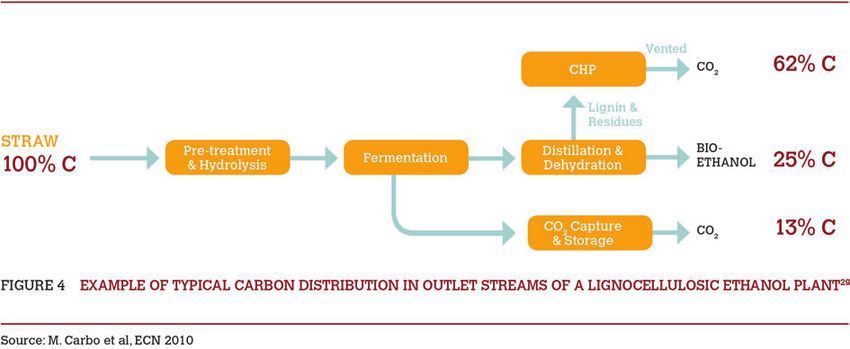
1       Why Europe needs to go carbon-negative

1.1     More powerful technologies are now needed to keep global warming below 2°C
In its Fourth Assessment Report, the IPCC stated that in order to keep global warming below 2°C and
avoid the most dangerous consequences of climate change, GHG emissions must be reduced by 50-
                                          4
85% by 2050 – and peak no later than 2015 .
                                                                                                        5
More recent research, however, indicates that even these findings were too optimistic and the UNFCCC
now warns that “we are putting ourselves in a scenario where we will have to develop more powerful
                                                         6
technologies to capture emissions out of the atmosphere" . This was echoed by the IEA in its World
                                                 7
Energy Outlook 2011: “The door to 2°C is closing” .

1.2     Bio-CCS: the only large-scale technology that can remove CO2 from the atmosphere
In short, there is now an urgent need for carbon-negative solutions, i.e. systems that remove CO2 from
the atmosphere. Indeed, Bio-CCS – the combination of CO2 Capture and Storage (CCS) with sustainable
biomass conversion – is the only large-scale technology that can achieve net negative emissions (in
addition to any emissions reductions achieved by replacing fossil fuels with that biomass).

This has already been recognised at an international level, e.g. in the IPCC’s Special Report on
                                                             8
Renewable Energy Sources and Climate Change Mitigation and in the Technology Roadmap Carbon
Capture and Storage in Industrial Applications jointly published by the IEA and the United Nations
                                              9
Industrial Development Organization (UNIDO) .

                                                 Bio-CCS: a definition
    Bio-CCS may be defined as processes in which CO2 originating from biomass is captured and
    stored. These can be energy production processes or any other industrial processes with CO2-rich
    process streams originating from biomass feedstocks. The CO2 is separated from these processes
    with technologies generally associated with CCS for fossil fuels.

    Biomass binds carbon from the atmosphere as it grows; but with the conversion of the biomass, this
    carbon is again released as CO2. If, instead, it is captured, transported to a storage site and
    permanently stored deep underground, this would result in a net removal of CO2 from the
    atmosphere.

                                                                                                             10
Bio-CCS has already entered the European policy debate: the EU Energy Roadmap 2050 not only
confirms that “For all fossil fuels, Carbon Capture and Storage will have to be applied from around 2030
                                                                       11
onwards in the power sector in order to reach decarbonisation targets , it also recognises that CCS
“combined with biomass could deliver “carbon negative” values”.

4 www.ipcc.ch/ipccreports/ar4-syr.htm, 2007
5 James E. Hansen, “Scientific reticence and sea level rise”: http://pubs.giss.nasa.gov/abstracts/2007/Hansen.html; W.T.
  Pfeffer et al, “Kinematic Constraints on Glacier Contributions to 21st-Century Sea-Level Rise”:
  www.nature.com/climate/2008/0810/full/climate.2008.93.html
6 http://m.guardian.co.uk/environment/2011/jun/05/global-warming-suck-greenhouse-gases?cat=environment&type=article,
  2011
7 www.iea.org/Textbase/npsum/weo2011sum.pdf
8 www.srren.org, May 2011
9 www.unido.org/fileadmin/user_media/News/2011/CCS_Industry_Roadmap_WEB.pdf, September 2011
10 http://ec.europa.eu/energy/energy2020/roadmap/doc/com_2011_8852_en.pdf, December 2011
11 80-95% decarbonisation overall by 2050
                                                                                                                           5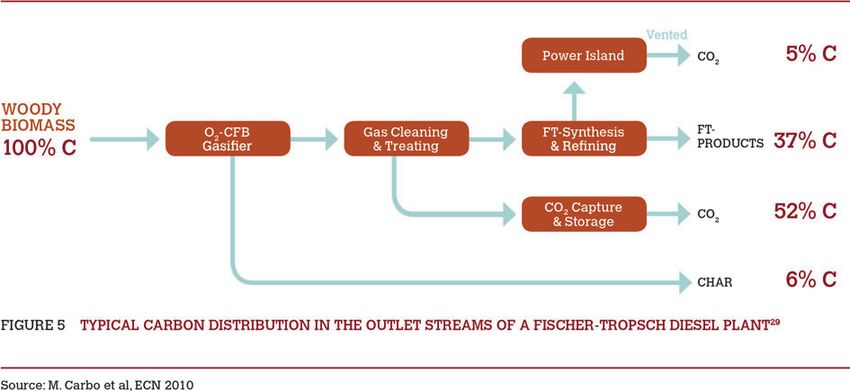
1.3       The EBTP/ZEP Joint Taskforce Bio-CCS: uniting high-level European stakeholders
Yet Bio-CCS is, to a large extent, an unexplored avenue of action, with a number of complex questions
to be analysed and answered. In 2011, the European Biofuels Technology Platform (EBTP) and the
European Technology Platform for Zero Emission Fossil Fuel Power Plants – known as the Zero
                                                                               12
Emissions Platform (ZEP) – therefore set up a Joint Taskforce (JTF) Bio-CCS in order to guide and
accelerate this vital work and ensure its place within EU policy and R&D priorities; Bellona Europa – a
member of both ZEP and EBTP – runs the JTF Bio-CCS Secretariat.

The JTF Bio-CCS works in a similar way to its mother platforms in bringing together high-level
stakeholders and experts from relevant industries, research and civil society in order to identify the most
effective and appropriate means of developing and deploying Bio-CCS technologies.

                                          The Zero Emissions Platform (ZEP)
 Founded in 2005, ZEP represents a unique coalition of stakeholders united in their support for CCS
 as a critical solution for combating climate change. Indeed, CCS is the single biggest lever for
 reducing CO2 emissions – providing almost 20% of the global cuts required by 2050, according to
 the IEA. Members include European utilities, oil and gas companies, equipment suppliers, national
2geological surveys, academic institutions and environmental NGOs. The goal: to make CCS
 commercially available by 2020 and accelerate wide-scale deployment.
                                              www.zeroemissionsplatform.eu

                               The European Biofuels Technology Platform (EBTP)
     Founded in 2006, the European Biofuels Technology Platform (EBTP) aims to contribute to the
     development of cost-competitive, world-class biofuels value chains, the creation of a healthy
     biofuels industry and the acceleration of the sustainable deployment of biofuels in the EU via a
     process of guidance, prioritisation and the promotion of research, technology development and
     demonstration. The EBTP brings together the knowledge and expertise of stakeholders from
     industry, biomass resources providers, research and technology development organisations and
     non-governmental organisations (NGOs) in a public-private partnership.
                                                      www.biofuelstp.eu

12
     See Annex I for a list of members of the Joint Taskforce Bio-CCS
                                                                                                              6
2 CO2 Capture and Storage
2.1 CCS could provide almost 20% of global emission cuts required by 2050
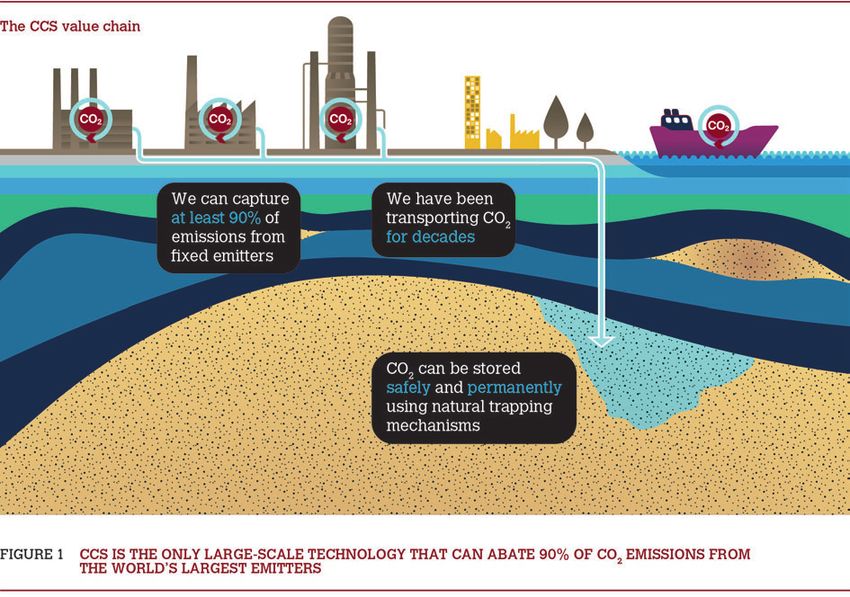
CO2 Capture and Storage (CCS) describes a technological process by which at least 90% of CO2
emissions is captured from large stationary sources (e.g. fossil fuel-fired power plants, heavy industry),
transported to a suitable storage site, then stored in geological formations – safely and permanently –
deep underground (at least 700m and up 5,000m).
The IEA confirms that “The scale of potential future deployment of CCS is enormous, spanning
manufacturing, power generation and hydrocarbon extraction worldwide”. Indeed, it is the single biggest
lever for reducing CO2 emissions – providing almost 20% of the global cuts required by 2050. The critical
role of CCS in meeting EU climate targets is therefore indisputable – as confirmed by the EU Energy
Roadmap 2050 – while the IEA estimates that the costs of achieving global climate objectives without
CCS would be over 70% higher.
The result: Europe will not only enjoy a climate-friendly economy, but new industrial growth – creating
jobs and boosting competitiveness – fuelled by a diverse and reliable energy supply.
2.2 The safety of CO2 storage actually increases over time
Each of the stages in the CCS value chain – capture, transport and storage – can be accomplished in
various ways:
7CO2 capture options in power generation
• Post-combustion: CO2 is removed from the exhaust gas through absorption by selective
solvents.
• Pre-combustion: The fuel is pre-treated and converted into a mix of CO2 and hydrogen, from
which the CO2 is separated. The hydrogen is then used as fuel, or burnt to produce electricity.
• Oxy-fuel combustion: The fuel is burned with oxygen instead of air, producing a flue stream of
CO2 and water vapour without nitrogen; the CO2 is relatively easily removed from this stream.
In certain industrial processes, such as some biofuels production routes, the separation of high-purity
CO2 is already a required part of the process (see Chapter 4). Capture for storage then usually only
requires some dehydration before the gas can be compressed and transported to a storage site. Capture
technology options in other industries such as steel and cement are outside the scope of this report, but
may be covered by future updates.
CO2 transport options
• Pipelines are the main option for large-scale CO2 transportation, but shipping and road transport
are also possibilities.
CO2 storage options
• Deep saline aquifers (saltwater-bearing rocks unsuitable for human consumption)
• Depleted oil and gas fields (with the potential for Enhanced Oil/Gas Recovery)
• Deep unmineable coal beds (with the potential to extract methane)
82.3 CCS technologies are already proven on a small scale
Although there are currently no fully integrated, commercial-scale CCS power projects in operation,
many of the technologies that make up CCS have been around for decades:
• CO2 capture is already practised on a small scale, based on technology that has been used in
the chemical and refining industries for decades.
• Transportation is also well understood: CO2 has been shipped regionally for over 20 years, while
a 5,000 km pipeline network has been operating in the USA for over 30 years for Enhanced Oil
Recovery (EOR).
• CO2 storage projects have been operating successfully for over a decade, e.g. at Sleipner
(Norway), Weyburn (Canada) and In Salah (Algeria). The industry can also build on knowledge
obtained through the geological storage of natural gas, which has also been practised for
decades.
While individual components of the CCS value chain are already proven – ready for scale-up and
integration – further R&D into next-generation technologies must also be initiated immediately to enable
13
rapid and wide deployment post-2020. To this end, ZEP has published a long-term R&D plan
identifying key areas for improvement, together with the main strands for R&D to 2030 and beyond. To
ensure maximum effectiveness, this should be coordinated at a national and EU level and include key
learnings from the EU demonstration programme.
13
www.zeroemissionsplatform.eu/library/publication/95-zep-report-on-long-term-ccs-rad.html
93 Biomass feedstocks
3.1 Biomass use for energy is steadily increasing in the EU and beyond
Biofuels offset CO2 emissions from fossil transportation fuels in the same way biomass can offset
emissions from fossil fuels in other applications, such as energy and heat production. Most biofuels are
suitable for use in existing infrastructures and prime movers, such as biomethane, bioSNG and biomass-
based synthetic diesel (Biomass to Liquid or BtL).
A wide range of biomass feedstock is available worldwide for biofuel and bioenergy production, such as
energy crops (e.g. miscanthus, jatropha, short-rotation copice); wastes (e.g. waste oils, food processing
wastes); agricultural residues (e.g. straw, corn stover); forestry residues; and novel feedstocks (e.g.
algae).
In 2008, global bioenergy use was composed primarily of solid biomass (46.9 EJ); municipal solid waste
14
(MSW) used for heat and CHP (0.58 EJ); and biogas (secondary energy) for electricity and CHP (0.41
EJ), and heating (0.33 EJ). The contribution of ethanol, biodiesel and other biofuels (e.g. ethers) used in
the transport sector amounted to 1.9 EJ in secondary energy terms15. In absolute terms, usage has
16
grown steadily over the last 40 years and by 2009 biomass accounted for ~10% (50 EJ) of the annual
17
global TPES . The IEA projects that the primary bioenergy share of the global TPES will increase to
~160 EJ by 2050, providing ~24% of TPES compared to 10% today. Around 60 EJ of this would be
needed for transport fuels production, with another 100 EJ (i.e. 5 billion to 7 billion dry tonnes of
16
biomass) required to provide electricity and heat for the residential sector, industry and other sectors .
The bioenergy share of EU TPES is relatively small but growing, mainly driven by EU incentives for
renewable energy sources (RES). The 2020 target of 10% RES for the transport sector set down in the
18
EU Renewable Energy Directive (RED) is expected to be composed almost entirely of biofuels. In
2020, biomass is assumed to contribute to ~11% of total EU final energy consumption and ~56% of total
final renewable energy consumption, as well as ~53% of the additional effort required to reach 20% RES
in the EU in 2020, based on the National Renewable Energy Action Plans (NREAPs) of the 27 EU
19
Member States .
3.2 A wide range of biomass feedstocks is available
A wide range of biomass feedstocks is potentially available to serve as vectors to release energy, either
through combustion (bioenergy), conversion to other vectors (e.g. biogas, biochemicals or liquid
20
biofuels), or use in biorefinery concepts to produce the so-called 4F – food, feed, fibre and fuels) :
• Agricultural residues: derived from field activities after harvesting the main product, e.g. straw,
prunings, corn stover etc., as well as animal manure
• Forest biomass: residues from harvest operations that are left in the forest following stem wood
removal, e.g. branches, foliage, roots etc. and complementary fellings, i.e. the difference
between the maximum sustainable harvest level and the actual harvest needed to satisfy round
wood demand
• Energy crops: annual or perennial crops specifically bred and cultivated to produce biomass with
specific traits:
o Biowaste streams
14
Combined heat and power
15
http://srren.ipcc-wg3.de/report/IPCC_SRREN_Ch02.pdf, 2011
16
www.iea.org/publications/freepublications/publication/bioenergy.pdf, 2012
17
Total Primary Energy Supply
18
http://eur-lex.europa.eu/LexUriServ/LexUriServ.do?uri=Oj:L:2009:140:0016:0062:en:PDF
19
www.aebiom.org/?p=3336#more-3336
20
www.biofuelstp.eu/fuelproduction.html#first
10o MSW of biological origin: mainly kitchen and garden waste, paper and cardboard, but
including a proportion of other waste fractions which are of biological origin
o Construction/demolition wood: wood offcuts from building construction and wood recovered
during demolition
o Packaging, waste wood, e.g. palettes, crates etc.
o Household waste wood, e.g. old furniture, fencing
o Market waste, e.g. green tops and unsold vegetables from markets
o Sewage sludge
o Food processing wastes: wastes from the dairy and sugar industry, wine and beer production;
waste streams with lower volumes involved (e.g. orange zests from orange juice production)
can also be of interest
o Gardening wastes: grass cuttings, leaves and small branches.
• Algae/aquaculture: algae are usually separated into microalgae (microorganisms) and
macroalgae, such as seaweed. Intense research is underway in many parts of the world to find
ways to unleash the promising energy potential of these marine types of biomass. However, due
to the high uncertainties and limited available data, marine biomass has not been included in the
Bio-CCS potentials in Chapter 5.
3.3 The benefits of advanced and algal biofuels
Production of several types of biofuel could be combined with CCS to achieve low or even negative
carbon footprint. Biofuel production is often divided into conventional or advanced, which is to some
extent (though not only) connected to the feedstock; the conversion method is also relevant:
• Conventional biofuels’ feedstock consists of energy crops (see above) and usually competes
with other utilisation, e.g. food. In general, conventional biofuels are produced from cereal crops
(e.g. wheat, maize), oil crops (e.g. rape, palm oil) and sugar crops (e.g. sugar beet, sugar cane).
This category includes biodiesel (RME), bioethanol, ethyl tertiary butyl ether (ETBE), biogas/
landfill gas, straight vegetable oils (SVO). Conventional biofuels are produced via well-known
processes (e.g. cold pressing/extraction, transesterification, hydrolysis and fermentation, and
chemical synthesis) and are well-established in the market.
• Advanced biofuels can be produced out of plant residues (i.e. they do not compete with food
production) – mainly lignocellulosis-rich material, which means that the lignocellulosis has to be
21
pre-treated . The pre-treatment is followed by advanced processes (e.g. advanced hydrolysis
and fermentation or gasification followed by fuel synthesis). Advanced biofuels include:
o Biomass to Liquid (BtL), e.g. FT diesel and FT kerosene for aviation
o Cellulosic ethanol
o BioDME/Methanol
o BioSynthetic Natural Gas (BioSNG)
o Bio-oil/Bio-crude
o Hydrocarbons via the catalysis of plant sugars or synthetic biology
o Biohydrogen
o Bioelectricity/CHP
o Biobuthanol
• Algal biofuels production is expected to be ready for large-scale commercialisation further into
the future than most of the biofuels listed as advanced. Nevertheless, their fast growth, high oil
and biomass yields, widespread availability, absent (or very reduced) competition with
agricultural land, high quality, together with the versatility of by-products – not to mention
efficiency in utilising CO2 – make algae and aquatic biomass a promising resource. In principle,
21
The pre-treatment is hydrolysis of cellulose (enzymatic process producing sugars and pyrolysis (heating) of lignin). Many
physicochemical structural and compositional factors hinder the hydrolysis of cellulose present in biomass to sugars and
other organic compounds that can later be converted to fuels. The goal of pre-treatment is to make the cellulose accessible
to hydrolysis for conversion to fuels: http://ucce.ucdavis.edu/files/datastore/234-1388.pdf
11bio-technological pathways are similar to those for conventional biodiesel production (via trans-
esterification), although gasification and subsequent BtL-processes (i.e. advanced conversion)
may also prove viable.
3.4 The importance of using sustainably produced biomass
In the face of global warming and a growing population, there is increasing local and global competition
for land, feedstocks and water for food production, non-food crops and bioenergy, and there is significant
debate as to whether the massive amounts of biomass required for large-scale utilisation can be
harvested in a sustainable way. As biofuels gain market share and international trading of biomass, raw
materials and biofuels expand, the need to ensure environmental and socio-economic sustainability
along the entire supply chain becomes more pressing. This includes aspects such as land use,
agricultural practices, competition with food, energy efficiency and GHG emissions, and lifecycle analysis
22
etc. .
Preventing the possible negative effects of growing biomass supply will, in the longer term, require a
process-oriented development of refined criteria and indicators involving relevant stakeholders.
International work is already taking place to ensure that communities, biodiversity and land are protected
and a number of certification schemes and sustainability initiatives are already in place, e.g. for biofuels.
These include initiatives by trade and standards organisations, civil society (e.g. NGOs) and government
bodies.
An issue often mentioned in connection with biomass sustainability is indirect land-use change (ILUC).
ILUC impacts of biofuels, especially conventional, relate to the unintended consequence of releasing
CO2 emissions due to land-use changes induced by the expansion of croplands in response to increased
global biomass demand. Some studies have suggested that for certain biomass feedstocks, such
emissions may indeed exceed reductions attained by replacing fossil-derived fuels with that biomass.
As it is difficult to trace such effects, this is a widely discussed subject. The European Commission has
23
organised consultations on how to address this issue within existing sustainability criteria for biofuels
24
on the EU market and it is already being addressed by the EBTP and several ongoing research
25
projects, such as Biomass Futures . The Scientific Committee of the European Environment Agency
26
has also presented a view . Please refer to work by these and other organisations for additional
information on ILUC and biomass availability.
While the EU debate has mainly focused on biofuels, similar kinds of ILUC and other environmental and
socio-economic impacts may be assumed to be connected with an increase in the use of solid or
gaseous biomass. The European Commission has gone some way in acknowledging this, launching two
27
consultations on whether similar sustainability criteria for biofuels should be applied to solid and
gaseous biomass. The follow-up on these consultations is as yet uncertain.
This document does not aim to provide the answers to these questions, but focuses on how
sustainably produced biomass, when and where available, can be combined with CCS to attain
negative emissions on a large scale.
22
www.biofuelstp.eu/sustainability.html#enviro
23
http://ec.europa.eu/energy/renewables/consultations/2010_10_31_iluc_and_biofuels_en.htm
24
www.biofuelstp.eu/sustainability.html#indirect
25
www.biomassfutures.eu
26
www.eea.europa.eu/about-us/governance/scientific-committee/sc-opinions/opinions-on-scientific-issues/sc-opinion-on-
greenhouse-gas/view
27
http://ec.europa.eu/energy/renewables/consultations/20110329_biomass_en.htm
http://ec.europa.eu/energy/renewables/consultations/20120207_renewable_energy_strategy_en.htm
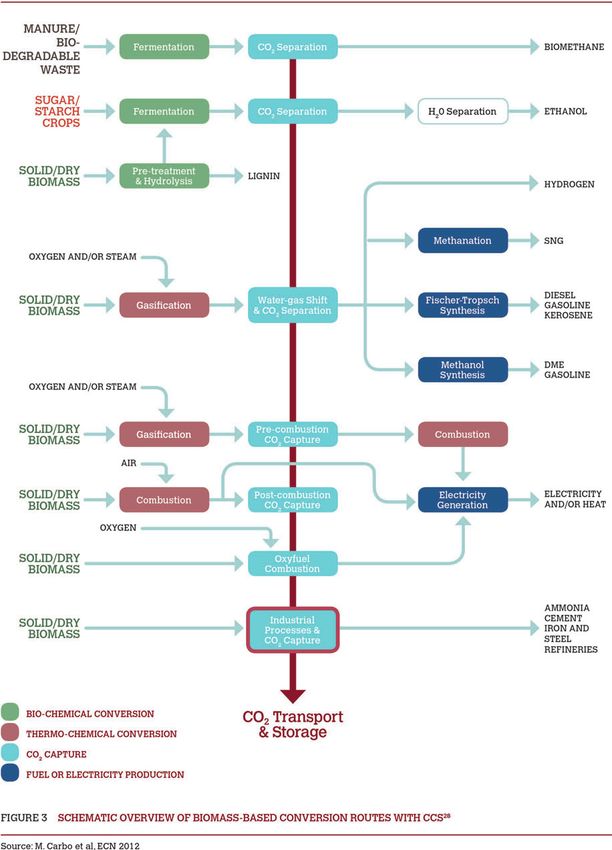
124 Bio-CCS technology routes
Several routes are suitable for the conversion of biomass into final energy products or chemicals in
combination with CCS, as shown in Figure 3 below. These can be divided into bio-chemical biofuels
production, thermo-chemical production of biofuels and biochemicals, and biomass combustion for the
production of electricity and/or heat.
A significant amount of the carbon present in the feedstock typically ends up in biofuels or biochemicals,
resulting in smaller CO2 streams compared to electricity generation. However, the impact of CO2 capture
on overall process yields is usually much smaller in the case of biofuels or biochemicals production. The
CO2 can either be easily separated, or in some cases, the fuel production process itself requires
separation to ensure that downstream synthesis processes work properly.
Conventional biofuels from sugar/starch crops currently represent the largest capacity of all biofuel/
biochemicals production routes, while scale-up efforts are ongoing for thermo-chemical production
routes.
4.1 Bio-chemical production of biofuels
Biomethane
Fermentation or anaerobic digestion is a process whereby organic material is broken down in several
steps by different micro-organisms. Most organic raw materials can be used as feedstock as long as they
are biologically degradable – including animal, human, food and organic waste streams and green crops
(but not woody feedstock). Process products include biogas (containing 45-70% CH4 and 25-45% CO2
with trace amounts of sulphurous components) and a solid fraction called digestate.
Biogas can be upgraded to biomethane by separating CO2 and removing sulphurous components and
results in properties comparable to natural gas and facilitates grid injection. CO 2 separation is a
commercially proven technology for the production of biomethane, but faces certain challenges for
purposes of CCS, such as seasonal feedstock variability and a relatively small CO2 stream. The
economic feasibility of biomethane production with CCS is governed by relatively small output capacities
up to 15 MW.
Bioethanol
During ethanol fermentation, sugars from conventional biofuel feedstocks (e.g. sugar cane/beet, the
starch part of corn) are fermented into ethanol and CO2. Two-thirds of the carbon contained in the sugars
ends up in the ethanol; the remaining third forms near-pure CO2. The CO2 stream can then be separated
via a gas liquid separation, while the ethanol/water mixture is typically separated via distillation. A typical
ethanol plant in the U.S. produces ~200 million litres per year, which corresponds to a pure CO2 stream
of 140,000 tonnes per year.
Lignocellulosic feedstocks can also be used for ethanol production, although these require a pre-
treatment step to isolate the cellulose from the lignin. Subsequent chemical or enzymatic hydrolysis
converts complex cellulose chains into simple sugars that can be fermented into ethanol. Figure 4
illustrates the fate of carbon in a typical lignocellulosic ethanol plant. Around 62% of the carbon present
in the feedstock ends up in the lignin stream, 25% in the ethanol product and half of that in the pure CO2
stream. Lignin can be used for under-firing during the ethanol/water distillation or as fuel for a CHP unit,
although post-combustion CO2 capture should be added to these processes to increase significantly the
CO2 capture potential.
1328
28
www.ecn.nl
1429
4.2 Thermo-chemical production of biofuels and biochemicals
During thermo-chemical conversion, lignocellulosic/non-edible feedstocks are dried and ground, and
subsequently gasified with oxygen and/or steam. The product gas from gasification is then cleaned and
processed to form a so-called synthesis gas, which can be used in commercially available synthesis
processes to form fuels and chemicals:
• Hydrogen (and further synthesised into ammonia and urea)
• Substitute Natural Gas (SNG) via methanation
• Diesel, gasoline and kerosene (jet fuel) via fuel synthesis (e.g. Fischer-Tropsch) and refining
(often described as Biomass-to-Liquid or BtL)
• Methanol synthesis and upgrading to DME (dimethyl ether, a fuel additive) and gasoline; but also
plastics, formaldehyde and acetic acid.
The required hydrogen-to-carbon monoxide ratio varies for different synthesis routes. Methanol or
Fischer-Tropsch synthesis requires two hydrogen molecules per carbon monoxide molecule, while
methane synthesis requires three hydrogen molecules per carbon monoxide molecule. This can be
adjusted by the water-gas shift reaction and CO2 separation, resulting in a relatively pure CO2 stream.
The capture technology is similar to pre-combustion CO2 capture in Integrated Gasification Combined
Cycle (IGCC) power plants and is usually based on the use of physical absorption in solvents.
Figure 5 below shows an example of the fate of carbon in a typical FT diesel plant, based on oxygen-
blown Circulating Fluidized Bed (CFB) gasification. Slightly over 50% of the carbon in the feedstock is
released as relatively pure CO2, while 37% ends up in the diesel stream. The CO2 vented from the power
island, and carbon in the char from the gasifier, make up the balance.
29
M.C. Carbo et al., “Bio Energy with CO2 Capture and Storage (BECCS): conversion routes for negative CO2 emissions”,
Proceedings of the 4th International Freiberg Conference on IGCC & XtL, Germany, 2010
1529
4.3 Biomass combustion for electricity and/or heat production
Biomass co-firing
There are several technical routes for biomass co-firing which may be divided into indirect and direct.
Indirect co-firing relies on the dedicated conversion of biomass in a fluidized bed gasifier. This produces
a combustible gas with a Low Calorific Value (LCV) that can be injected into an existing boiler. During
direct co-firing, biomass is blended with coal, milled and transported to the burners in the boiler. Biomass
can also be ground in a dedicated biomass mill or modified coal mill. The ground biomass can be
blended with pulverised coal and fed to the burners, or fed via a dedicated biomass burner, or simply
injected into the boiler.
Biomass co-firing ratios strongly depend on the characteristics of the biomass used and the layout of the
power plant. Achieving elevated co-firing ratios has proved difficult as untreated biomass is typically
fibrous and inhomogeneous in nature. It has a lower energy density and different inorganic composition
to hard coal; it is also vulnerable to biodegradation and hydrophilic in nature. Significant plant
modifications are therefore usually required, entailing additional, high investment costs.
An alternative is to use thermal pre-treatment technologies that increase the homogeneity, brittleness
and/or energy density of biomass. These take place at temperatures between ~250°C and 550°C with
30 31
torrefaction at the lower end of the range, pyrolysis at the upper end. The biomass co-firing share can
be significantly increased with such pre-treatment technologies without major plant modifications. As
most methods do not affect the inorganic content of biomass, boiler fouling, corrosion and emissions
could still pose technical bottlenecks. However, high-temperature entrained flow gasification, as used in
IGCC power plants, could reduce limitations since part of the inorganic content of the pre-treated
biomass is removed through slag.
30
Torrefaction technologies aim to produce a stable, more homogeneous and energy-dense fuel from biomass, which allows
the use of existing infrastructure during logistics, grinding and feeding to existing coal-fired power plants. The fibrous nature
of the biomass is weakened by these processes; this facilitates grinding and densification (pelletising).
31
Pyrolysis technologies aim to produce solid charcoal and pyrolysis oil. Pyrolysis oil is a complex liquid that contains a
significant amount of oxygen, which could be fed through a liquid burner in an existing coal-fired power plant
16100% biomass combustion in CHP plants and CFB boilers
100% biomass combustion occurs in certain, smaller modified pulverised coal boilers and could also be
facilitated in existing, medium-sized CHP plants fired with coal or lignite. The latter are theoretically
suited to fire up to 100% biomass and are generally based on CFB technology. CFB boilers are usually
smaller than large utility boilers – ranging from 50 to 500 MWth – more flexible regarding fuels and
typically located in close proximity to urban areas or industrial facilities in order to supply heat. The
above-mentioned technologies could also be converted to allow 100% biomass oxy-fuel firing.
Biomethane/bio-SNG for power/heat production
Biomethane obtained from fermentation and upgraded by CO2 separation or gasification-based bio-SNG
could be used as fuel in gas-fired combined cycle power plants (NGCCs) or CHP plants. For gas-fired
applications, there are in principle no co-firing ratio limitations and biomethane/bioSNG can be co-fired at
any rate between 0 and 100%. There are also no fundamental restrictions to applying “conventional”
post-combustion CO2 capture technologies in these power plants (apart from economies of scale for
CHP).
BIGCC
Gasification of biomass allows the utilisation of a variety of biomass feedstocks and, in theory, the use of
pre-combustion CO2 capture technologies that are also proposed for IGCC power plants. Technical
improvements to future biomass-based IGCC (BIGCC) plants can therefore build on the experience and
further development of gasification technology in the (petro)chemical sectors which produce base
chemicals and transport fuels (e.g. FT diesel).
4.4 Bio-CCS in industrial applications
Fuel substitution
Large industrial operations could present potential Bio-CCS opportunities where a local heat or power
requirement exists – particularly in industrial clusters where CCS infrastructure can be shared, ensuring
continuity and efficiency of operation. Further synergies may be possible where systems are combined
or shared, such as the application of low-grade heat to pre-dry biomass, reducing the moisture content
and improving the energy density of the feedstock.
The use of biomass in industry to replace fossil fuels includes a variety of potential applications: small-
and medium-scale heat and power for industrial and domestic use (< 50 MW); as a fuel substitute in
cement kilns; in the refining and chemicals industries as synthesis gas from gasification or pyrolysis oil;
and via injection in blast furnace steel and iron-making.
Pulp and paper
In the pulp and paper industry, the majority of emissions originate from biogenic sources, since most of
the on-site processes utilise biomass as a raw material. Although total site emissions are significant, they
are scattered among different stacks – with the recovery boiler usually the largest source by far. Other
sources are the lime kiln, bark boiler and possibly other on-site heat/power production.
As for other industries, the potential for process integration could reduce the energy penalty from CCS,
and associated capture costs, substantially. However, the size of single sources, as well as heavily
integrated processes on modern pulp and paper mills, pose challenges in applying CCS to existing
installations. Layout restrictions and impurities in the flue gas also pose a challenge. Nevertheless, as
aging recovery boilers are replaced in the future, a window of opportunity could open for the gasification
32
of black liquor which entails more feasible capture options.
32
Black liquor is a liquid process stream in chemical pulping processes which contains cooking chemicals and dissolved
lignin. In a recovery boiler, cooking chemicals are recovered to be re-used in the process and lignin is burned to produce
power and heat for the site.
175 Bio-CCS potentials in 2030 and 2050
5.1 Negative emissions are additional to any abatement from replacing fossil fuels with
biomass
33
In a recent report by the IEA GHG , various potentials were assessed, including a first assessment of
34
the global and European “technical potential” for Bio-CCS in the power and (bio)fuel production sectors
(Table 1 below). This includes technologies for co-firing and co-gasification of biomass and coal, as well
as those fed solely with biomass feedstock.
The technical potential of Bio-CCS: a definition
The technical potential describes the maximum amount of resources (i.e. biomass) that can be used
or converted, depending on the technical performance of conversion technologies. This performance
varies over time due to technological progress. For Bio-CCS technologies, the technical potential is
constrained by the availability of sustainable biomass, CO2 storage capacity and the (future)
technological performance of biomass conversion and CO2 capture technologies. The net energy
conversion efficiency (including the energy penalty) and the carbon removal efficiency of the Bio-
CCS technology then determine the technical potential for Bio-CCS in terms of primary energy
converted, final energy and net (negative) GHG emissions.
35
It should be noted that 1 Mt of negative emissions (carbon-negative) is not the same as 1 Mt of
emission reductions – emission reductions always depend on a reference scenario. For example, a large
coal-fired power plant emits 5 Mt of CO2 per year. If it is replaced by a low-carbon technology that still
emits 1 Mt per year, then an emission reduction of (5-1 =) 4 Mt is achieved. Bio-CCS technologies may
replace fossil-fuel power plants and deliver negative emissions by storing CO2 originating from biomass.
If, in this example, the coal-fired power plant is replaced by a Bio-CCS power plant that delivers 4 Mt of
negative emissions, then the total emission reduction achieved is (5+4 =) 9 Mt.
In other words, carbon-negative = carbon abatement only if Bio-CCS replaces zero-emission
technologies. If it replaces carbon-emitting technologies, the abatement of their emissions is then added
for the total carbon abatement.
36
5.2 Globally, Bio-CCS could remove 10 Gt of CO2 from the atmosphere every year by 2050
The results of the IEA GHG study indicate a large global technical potential for Bio-CCS: a removal of
~10 billion tonnes of CO2 from the atmosphere every year by 2050 – equivalent to around a third of all
current energy-related CO2 emissions worldwide.
As in the EU, this technical potential is, in most regions, mainly limited by the supply of sustainable
37
biomass as there is likely to be sufficient CO2 storage capacity . In the biofuel routes, a relatively small
fraction of CO2 is captured, therefore a relatively small storage capacity is required. In the 100%
biomass-fired routes for power generation, less storage capacity is required compared to co-firing routes
in order to realise the full carbon-negative potential.
33
www.ecofys.com/en/project/biomass-combined-with-ccs-bio-ccs/
34
OECD Europe: Austria, Belgium, Czech Republic, Denmark, Estonia, Finland, France, Germany, Greece, Hungary,
Iceland, Ireland, Italy, Luxembourg, Netherlands, Norway, Poland, Portugal, the Slovak Republic, Slovenia, Spain,
Sweden, Switzerland, Turkey and the United Kingdom. N.B. This region does not completely match the EU27.
35
Mt = megatonne = million tonnes
36
Gt = gigatonne = billion tonnes
37
For details of storage capacity in Europe, see the EU GeoCapacity project: www.geology.cz/geocapacity
18Technical potential
in net negative GHG
emissions
Bio-CCS technology
(Gt CO2-equivalent)
1
Global OECD
2
Europe
Electricity generation with CCS 2030 2050 2030 2050
Co-firing in coal-fired power plant (post-, pre-, oxy-fuel combustion) -4.3 -9.9 -0.3 -0.7
Dedicated combustion and gasification of biomass -5.7 -10.4 -0.5 -0.8
(post-, pre-, oxy-fuel)
Biofuels production with CCS
Bio-ethanol (lignocellulosic biomass) -0.5 -1.1 -0.04 -0.1
Synthetic biofuels via thermochemical processes -3.3 -5.8 -0.3 -0.4
1
The global supply of biomass feedstock is assumed to be equal for all selected Bio-CCS technologies: 73 and 126 EJ/yr in
2030 and 2050, respectively.
2
The potential supply of biomass feedstock from OECD Europe is assumed to be equal for all selected Bio-CCS technologies:
5.8 and 9.6 EJ/yr in 2030 and 2050, respectively.
N.B. The technical potentials shown in Table 1 are calculated under the assumption that all available
biomass is allocated to one specific Bio-CCS route at a time. The results for the various Bio-CCS
technologies thus cannot be totalled. The results presented here reflect a limited set of Bio-CCS
technologies and are not exhaustive. Work is currently being carried out by the IEA GHG to estimate the
potential for Bio-CCS technologies where biogas is combined with CCS.
5.3 In Europe, Bio-CCS could remove 800 Mt of CO2 from the atmosphere every year by 2050
While the market for biomass is assumed to be global, this report focuses on Bio-CCS potentials based
on projected available biomass in (OECD) Europe. According to the IEA GHG study, Bio-CCS could
remove 800 million tonnes of CO2 from the atmosphere every year by 2050 – equivalent to more than
half of all current EU energy-related emissions.
For the IEA GHG study, estimates of ~6 and 10 EJ were used for the years 2030 and 2050 respectively,
including dedicated energy crops, agricultural residues and forestry residues. Longer term (2020 and
beyond) estimates for biomass potential in the EU show a wide range in literature, for example:
38
• Panoutsou et al 2009 estimate a biomass potential in the EU27 of 7.8 EJ for 2020, including
agricultural biomass, forest biomass, industrial biomass and waste biomass.
39
• The EU RESHAPING project estimates between 0.6 to 10.3 EJ for 2020 for dedicated energy
crops alone.
• GREEn-X and REFUEL estimates for dedicated energy crops are 1.8-6.8 EJ and 2.3-9.0 EJ for
40
2020 and 2030 respectively .
38
www.sciencedirect.com/science/article/pii/S0301421509006193
39
http://igitur-archive.library.uu.nl/chem/2012-0320-200511/Long-term%20potentials%20and%20cost%20of%20RES%20-
%20part%20I%20(Re-Shaping%20report,%202011).pdf
40
http://igitur-archive.library.uu.nl/chem/2012-0320-200511/Long-term%20potentials%20and%20cost%20of%20RES%20-
%20part%20I%20(Re-Shaping%20report,%202011).pdf
1941
For reference, current biomass use in the EU27 is ~4 EJ, of which 2 EJ is used to generate electricity .
As uncertainties are high regarding future biomass supply, the IEA GHG 2030 and 2050 estimates have
been derived from the medium to lower range of available projections published over the last decade.
5.4 800 Mt of CO2 is equivalent to over 50% of current emissions from the EU power sector
A potential of 800 Mt of negative emissions is highly significant in relation to the EU Low-Carbon
42
Economy Roadmap for delivering an overall decarbonisation target of 80-95% by 2050 – as called for
by EU leaders in the European Council.
This target translates into emissions reductions required in various sectors of the economy, e.g. 93-99%
in the power sector, 54-67% in the transport sector. In absolute numbers, this equals up to 1.4 Gt in the
power sector and ~1 Gt in the transport sector. 800 Mt of negative emissions is therefore equivalent to
over 50% of current emissions from the EU power sector.
In the long-term, when deployed within a portfolio of other low-carbon technologies, Bio-CCS could
actually result in carbon-negative sectors, i.e. overall sectorial emissions below zero. This would then
provide the EU with the possibility of offsetting emissions in other industry sectors where substantial
reductions are more difficult to attain.
Even taking uncertainties into account, research therefore indicates that the technical potential for Bio-
CCS to combat climate change is highly significant. However, before this can be realised, economic
conditions for application, location (matching infrastructures), regulatory framework and social aspects
must also be taken into account, as described below.
41
http://ec.europa.eu/research/energy/eu/research/bioenergy/background/index_en.htm
42
”A Roadmap for moving to a competitive low carbon economy in 2050”, 2011:
http://eur-lex.europa.eu/LexUriServ/LexUriServ.do?uri=COM:2011:0112:FIN:EN:PDF
206 Economic factors
Costs for the large-scale deployment of Bio-CCS technologies have not yet been comprehensively
assessed, either for Europe or globally. Given the substantial differences between the various
technology routes, a generalised description would not be appropriate and more detailed work is needed.
Nevertheless, a number of observations can be made.
6.1 Biofuels production with CCS is a key “low-hanging fruit” for CCS deployment
Several biofuels production routes, notably bioethanol and FT synfuels production, have a near-pure CO2
stream (CO2 separation is already part of the production processes, with very low impact on thermal
efficiency), providing CCS deployment options with very low additional costs once units reach a certain
scale, or can be clustered in terms of infrastructure. Indeed, the IEA Technology Roadmap for CCS in
43
Industrial Applications highlights biofuels production with CCS as one of the key “low-hanging fruits” for
CCS deployment.
While no comprehensive cost calculations are available for biofuels production with CCS, data from
44
ADM in the U.S. – an early mover in industrial-scale bioethanol production with CCS – indicates that
the cost per tonne of CO2 captured, transported and stored is lower than for early movers in electricity
45
production with CCS . The U.S. does not currently have a CO2 pricing system, but the ADM project
46
receives subsidies from the Department of Energy (DoE) to inject 2.5 Mt of CO2 over three years .
Without more in-depth cost analyses, it is premature to identify biofuels with CCS as the low-hanging fruit
for Bio-CCS, based on the costs of a single project with a limited time-span. Yet the ADM project
indicates that for certain biofuels production routes, CCS deployment could be commercialised in the EU
at a significantly lower Emissions Unit Allowance (EUA) price than for electricity production, assuming
that the EU ETS – or other future incentivising mechanisms – reward emissions below the baseline (see
Chapter 7).
6.2 Biomass co-firing at moderate percentages can be flexibly applied
47 48
ZEP has recently undertaken a ground-breaking study on the costs of CO2 capture , transport and
49 50
storage , with resulting integrated CCS value chains presented in a summary report . This showed that
51
following a successful demonstration, the current suite of CCS technologies will be cost-competitive
with the full range of low-carbon power options. The study focused on fossil fuel power plants and did not
cover CCS applications where biomass is used as a feedstock. While this will be covered in future
updates, it is possible to make some general comments.
Looking at the levelised cost of electricity (LCOE), Bio-CCS is generally more expensive than fossil CCS
due to the relatively higher cost of biomass (see below). However, co-firing biomass with coal or lignite at
moderate percentages (at least up to 10%) is not expected to require additional investment in CCS
equipment compared to CCS for coal or lignite only. Generally speaking, it is therefore the cost of the
biomass fuel which causes variations in the costs of deploying CCS.
For higher co-firing rates and dedicated biomass combustion, the relatively lower energy content per
volume of biomass feedstock compared to coal potentially leads to efficiency penalties and higher costs.
43
www.iea.org/roadmaps/ccs_industrial_applications.asp
44
http://sequestration.org
45
www.nytimes.com/cwire/2011/09/12/12climatewire-ethanol-carbon-sequestration-plant-holds-les-18588. html?pagewanted=2
46
http://origin.adm.com/en-US/news/_layouts/PressReleaseDetail.aspx?ID=247
47
www.zeroemissionsplatform.eu/library/publication/166-zep-cost-report-capture.html
48
www.zeroemissionsplatform.eu/library/publication/167-zep-cost-report-transport.html
49
www.zeroemissionsplatform.eu/library/publication/168-zep-cost-report-storage.html
50
www.zeroemissionsplatform.eu/library/publication/165-zep-cost-report-summary.html
51
!70-90/MWh for CCS with coal, !70-120/MWh with gas, operating in baseload (7,500 hours equivalent full load each year)
21While the composition of biomass fuels is variable, their generally higher alkaline content compared to
coal can also lead to ash deposition and corrosion when co-firing in existing boilers, which will drive up
costs. More data and research is needed on these issues, as well as other potential technological
challenges.
The (co-)firing of biomethane or bioSNG in NGCCs to replace natural gas is not expected to result in any
additional costs when NGCCs are equipped with CCS.
6.3 Biomass prices will increase unless novel feedstocks are sufficiently up-scaled
As mentioned above, the LCOE from firing with biomass is generally higher than for fossil fuels due to
the difference in fuel cost. Generally, this also holds for the transport sector. The deployment of biofuels
and bioenergy in the EU is therefore driven mainly by RES targets (see page 10), which in many
countries translates into dedicated incentives such as feed-in tariffs or mandatory, blend-in values for
biofuels.
It is difficult to predict the price of biomass far into the future, as there are a large number of unknowns:
• Supply
o Sustainable agricultural yield, sustainable wood supply
o Availability, suitability and scalability of novel feedstocks, e.g. micro- and macroalgae etc.
• Demand
o Global demand for biofuels and bioenergy
o Population growth and demand for meat
o Availability and cost of petroleum and other energy sources
o Demand for other bio-products and chemicals
o Demand in other biomass-based sectors, e.g. pulp/paper, wooden materials etc.
Nevertheless, biomass prices in the EU can be expected to rise as demand grows – driven by RES
targets – unless novel feedstock sources are sufficiently up-scaled. With the potential introduction of
sustainability criteria for solid and gaseous biomass, this effect is likely to increase further.
227 Accelerating deployment
This chapter provides some initial recommendations for how the EU could accelerate the development
and deployment of Bio-CCS technologies in order to realise their significant carbon-negative potential.
A key prerequisite is the maturation and commercialisation of CCS and advanced, sustainable
52
biofuels production. Bio-CCS is already being carried out on an industrial scale – but not in
Europe, mainly because negative emissions are not rewarded in the EU ETS. Dedicated funding
for pilot projects to prove advanced technologies and close any knowledge gaps is also urgently
required.
7.1 Take urgent action at EU/Member State level to support CCS demonstration projects
In recognition of CCS as a critical low-carbon energy technology, the EU has moved rapidly from
development to demonstration on the road to wide deployment: billions of euros have been invested or
pledged by industry, funding has been achieved for a CCS demonstration programme and an EU-wide
53 54
legal framework for CO2 storage has been established. As importantly, the ZEP cost reports now
provide confidence that following a successful demonstration, the current suite of CCS technologies will
55
be cost-competitive with the full range of low-carbon power options.
In short, there is no doubt that CCS can deliver, as confirmed by international developments where FID
has already been taken on large-scale demonstration projects in Australia, Canada and the U.S.
However, while confidence in the technology remains high, the fall in the EUA price – from ~!30 per
tonne in 2008 to ~!8 today – could have a severe impact on both CCS demonstration and deployment:
56
not only is significantly less funding available for the “NER 300” , but the long-term business case for
CCS has been seriously undermined.
It means CCS has now reached a “tipping point” in Europe and urgent action is needed at EU and
Member State level to counteract these developments. As the IEA has declared, “Deploying CCS
requires policy action; it is not something the market will do on its own.” The following actions are
therefore urgently required:
• Strengthen the EUA price as it not only underpins the long-term business case for CCS, but also
partly the short-term, as even demonstration projects will need to recover their investment over
the medium to long term.
• As this will take some years to deliver, establish additional economic measures at Member
State/EU level to enable demonstration projects to take FID. National governments are already
moving in this direction, underlining the urgency of the situation. ZEP’s report, “CO2 capture and
57
Storage (CCS) – Creating a secure environment for investment in Europe” provides concrete
recommendations for additional, non-ETS measures needed – plus any complementary
adjustments to the ETS required.
• Industry has already demonstrated its willingness to take on a major portion of the costs and
risks of investing in CCS. However, as the NER 300 may now deliver as little as !2.5 billion for
CCS and innovative renewable energy technologies, additional financial support from Member
58
States is also vital .
52
E.g. the ADM bioethanol-CCS project – see page 21
53
http://eur-lex.europa.eu/LexUriServ/LexUriServ.do?uri=OJ:L:2009:140:0114:0135:EN:PDF
54
Zero Emissions Platform, July 2011: www.zeroemissionsplatform.eu/library/publication/165-zep-cost-report-summary.html
55
!70-90/MWh for CCS with coal, !70-120/MWh with gas, operating in baseload (7,500 hours equivalent full load each year)
56
In 2008, the EU agreed to set aside 300 million Emission Unit Allowances from the New Entrant Reserve under the EU
ETS Directive to demonstrate CCS and innovative renewable energy technologies
57
To be published shortly and viewable in the ZEP website library: www.zeroemissionsplatform.eu/library.html
58
Even if Member States replicate the contribution of NER 300 funding, a gap of hundreds of millions of euros in incremental
costs could remain per project (except under specific conditions such as the use of CO2 for EOR)
23You can also read