Measurement report: Biogenic volatile organic compound emission profiles of rapeseed leaf litter and its secondary organic aerosol formation potential
←
→
Page content transcription
If your browser does not render page correctly, please read the page content below
Atmos. Chem. Phys., 21, 12613–12629, 2021
https://doi.org/10.5194/acp-21-12613-2021
© Author(s) 2021. This work is distributed under
the Creative Commons Attribution 4.0 License.

Measurement report: Biogenic volatile organic compound emission
profiles of rapeseed leaf litter and its secondary organic aerosol
formation potential
Letizia Abis1,a , Carmen Kalalian1 , Bastien Lunardelli1 , Tao Wang2 , Liwu Zhang2 , Jianmin Chen2 , Sébastien Perrier1 ,
Benjamin Loubet3 , Raluca Ciuraru3 , and Christian George1
1 Univ Lyon, Université Claude Bernard Lyon 1, CNRS, IRCELYON, 69626, Villeurbanne, France
2 Shanghai  Key Laboratory of Atmospheric Particle Pollution and Prevention, Department of Environmental Science &
Engineering, Fudan University, Shanghai, 200433, PR China
3 INRAE, UMR ECOSYS, AgroParisTech, Université Paris-Saclay, 78850, Thiverval-Grignon, France
a now at: Technische Universität Berlin, Umweltchemie und Luftrinhaltunz, Straße des 17. Juni 135, 10623 Berlin, Germany

Correspondence: Christian George (christian.george@ircelyon.univ-lyon1.fr)

Received: 16 February 2021 – Discussion started: 8 March 2021
Revised: 28 July 2021 – Accepted: 30 July 2021 – Published: 24 August 2021

Abstract. We analysed the biogenic volatile organic com-            1   Introduction
pound (BVOC) emissions from rapeseed leaf litter and their
potential to create secondary organic aerosols (SOAs) under         Nowadays, the crucial role played by volatile organic com-
three different conditions, i.e., (i) in the presence of UV light   pounds (VOCs) as precursors of ozone and particles within
irradiation, (ii) in the presence of ozone, and (iii) with both     the troposphere has been established (Hatfield and Huff
ozone and UV light. These experiments were performed in             Hartz, 2011). Sources of VOCs are either anthropogenic, i.e.,
a controlled atmospheric simulation chamber containing leaf         related to human activities, or biogenic. Biogenic volatile
litter samples, where BVOC and aerosol number concentra-            organic compounds (BVOCs) are released from living and
tions were measured for 6 d. Our results show that BVOC             senescent vegetation, soils and microorganisms, or oceans
emission profiles were affected by UV light irradiation which       (Kesselmeier and Staudt, 1999; Murphy et al., 2010). Such
increased the summed BVOC emissions compared to the ex-             biogenic VOCs (BVOCs) have been estimated to contribute
periment with solely O3 . Furthermore, the diversity of emit-       up to 90 % of the total VOC emissions (Guenther, 1995). Fur-
ted VOCs from the rapeseed litter also increased in the pres-       thermore, the currently most accredited emission model for
ence of UV light irradiation. SOA formation was observed            BVOC (MEGAN v2.1) estimates that 760 Tg C yr−1 is emit-
when leaf litter was exposed to both UV light and O3 , indi-        ted into the troposphere (Sindelarova et al., 2014). Modelling
cating a potential contribution to particle formation or growth     studies have highlighted the impact of BVOCs on carbon
at local scales. To our knowledge, this study investigates, for     monoxide (CO), hydroxyl radical (OH), and low-level ozone
the first time, the effect of UV irradiation and O3 exposure        and thus the oxidative capacity of the troposphere (Granier
on both VOC emissions and SOA formation for leaf litter             et al., 2000; Pfister et al., 2008; Poisson et al., 2000). It was
samples. A detailed discussion about the processes behind           found that products resulting from the BVOC oxidation are
the biological production of the most important VOC is pro-         significant precursors of secondary organic aerosols (SOAs)
posed.                                                              that affect the earth’s radiative balance (Ziemann and Atkin-
                                                                    son, 2012) and thus the climate and human health (De Gouw
                                                                    and Jimenez, 2009). In addition, between 11 % and 70 % of
                                                                    emitted BVOCs are converted into SOA, leading to a yearly
                                                                    production of 140–190 Tg C yr−1 of particles (Hallquist et
                                                                    al., 2009).

Published by Copernicus Publications on behalf of the European Geosciences Union.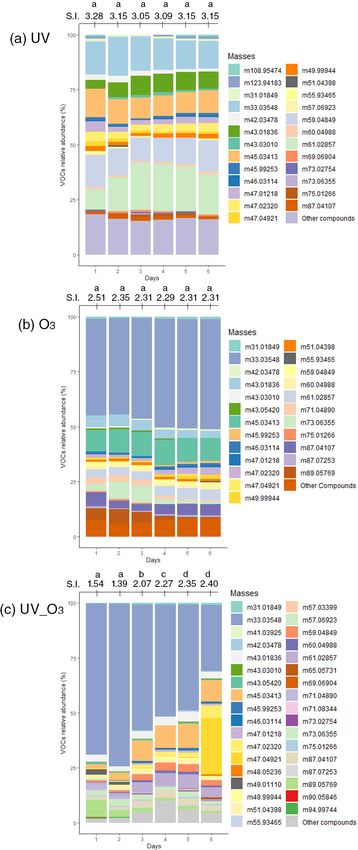
12614                                                                             L. Abis et al.: Biogenic VOC emission profiles

   Due to the growing awareness about climate change and                 The volume of straw produced varies between 0.6 and 2.4 t
atmospheric pollution, the number of studies focusing on             of dry matter per hectare. This estimate takes into account
BVOCs has grown exponentially over the past 20 years, with           the important losses of material that occur during mowing
a strong focus on forests and plants since they are the most         operations, and it corresponds to the volume of harvestable
important sources of BVOCs. However, little attention has            straw per hectare. Only half of the total volume produced
been drawn to leaf litter and its contribution to SOA for-           is harvested, the rest is left in the field to return to the soil
mation in the global BVOC emissions model, even though               (FranceAgriMer, 2016).
several studies reported a significant contribution to BVOC              The composition and amount of BVOCs emitted from leaf
emissions, describing BVOCs emitted from leaf litter as po-          litter, alongside their associated reactivity, strongly depend
tential contributors to SOA formation (Bigg, 2004; Faiola et         on plant species, decomposition state, and environmental
al., 2014; Isidorov and Jdanova, 2002; Viros et al., 2020).          conditions such as temperature, ultraviolet (UV) light irradi-
The annual global leaf litter production has been estimated          ation, and ozone concentration. Nevertheless, ozone concen-
to be between 75 and 135 Pg dry matter (DM) per year,                tration in rural areas has been estimated to be around 60 ppb
contributing to 10 % of the global annual emissions of ace-          with peaks reaching 80 ppb during the summer (Monks et al.,
tone and methanol (Matthews, 1997; Warneke et al., 1999).            2015). This affects leaf litter directly through chlorosis and
It was found that the leaf litter’s contribution to acetone          cellular damage (Diaz-de-Quijano et al., 2016). Also, ozone
and methanol emissions is due to the degradation processes           indirectly impacts biological and chemical processes such as
driven by microorganisms or abiotic factors (i.e., tempera-          photosynthesis, respiration, stomatal functioning (Yendrek et
ture, radiation), processes known to release partially oxidized      al., 2017), and the emissions of BVOCs (J. Yuan et al., 2017;
VOCs such as acetone and methanol (Warneke et al., 1999).            X. Yuan et al., 2016, 2017). Another important factor affect-
   Rapeseed (Brassica napus) was chosen as model plant               ing the degradation of leaf litter is UV light (Derendorp et
species in this study due to its wide geographic distribution        al., 2011) which is responsible for increased emissions of
and its importance as a crop. Rapeseed is grown to produce           short-length VOCs (i.e., C2 –C5 ) especially in the presence
animal feed, edible vegetable oils, and biodiesel. Rapeseed          of humid air (Derendorp et al., 2011).
was the third-leading source of vegetable oil in the world in            This study aims to investigate the individual and combined
2000, after soybean and palm oil. It is the world’s second-          effects of ozone and UV light irradiation on BVOC emis-
leading source of protein meal after soybean. France is the          sion and the subsequent SOA formation from rapeseed litter,
fifth largest producer worldwide of this specific crop (Fischer      Brassica napus sp. Rapeseed litter was used because it is the
et al., 2014).                                                       third most cultivated species in France after wheat and maize
   The development cycle of rapeseed is divided into three           (French National Statistics, 2019). We investigated the VOC
phases: (1) vegetative, (2) reproduction, and (3) maturation.        emission profiles of the senescent rapeseed leaves for 6 d af-
For the vegetative phase, rapeseed is sown in August. This           ter they were collected. The experiments were carried out in a
phase starts with an epigeous germination during the month           multiphase simulation chamber where leaf litter was exposed
of September. From September to December, the rapeseed               to (i) UV light (UV), (ii) ozone (O3 ), and (iii) a combination
stem will grow from 10 to 20 cm and produce about 20                 of both (UV_O3 ).
leaves, forming a rosette. The reproduction phase starts af-
ter the winter, i.e., between February and March. It is dur-
ing this time that the stem of the rapeseed goes up. Then we         2     Materials and methods
observe the beginning of the elongation. Flowering lasts be-
tween 4 and 6 weeks, and the maturation phase occurs when            2.1    Samples collection
the siliques are formed (in June). In July, they are ready for
harvest. It is in this period that we collected the rapeseed lit-    The leaves of rapeseed (Brassica napus sp.) used during
ter.                                                                 the experiments were collected on 3 June 2019 in the
   Rapeseed residues are often left on the field. The incorpo-       AgroParisTech field, Thiverval-Grignon (48◦ 850 N, 1◦ 950 E).
ration of crop residues into agricultural soils improves soil        The Thiverval-Grignon site is located about 30 km west of
structure, reduces bulk density, reduces evaporation, and de-        Paris, in the north of France. The soil of this site is classified
creases erosion. Rapeseed in this rotation contributes to im-        as Luvisol. It consists of 25 % clay, 70 % silt, and 5 % sand.
proving the organic matter content of the soil. Organic mat-         The site is 15 ha, and the rapeseed leaves were collected us-
ter, which is essential to fertility, contributes to the supply of   ing the random sampling method. To avoid inhomogeneous
nitrogen, to the improvement of structural stability (less sen-      samples in terms of the decomposition stage, all of the leaves
sitivity to soil compaction and erosion), and to an increase         were cut directly from the stems but making sure that they
in the storage capacity of water and mineral elements (i.e.,         were falling or about to fall. Overall, 3 kg of leaves was col-
improvement of the cation exchange capacity) (Tiefenbacher           lected from different plants in the field (field area around
et al., 2021). Therefore, the litter associated with rapeseed is     1 km2 ). The rapeseed litter used for the measurements was
an important aspect of that process.                                 made of leaves at the beginning of senescence. The leaf sam-

Atmos. Chem. Phys., 21, 12613–12629, 2021                                             https://doi.org/10.5194/acp-21-12613-2021
L. Abis et al.: Biogenic VOC emission profiles 12615
2.3 Multiphase simulation chamber
The multiphase atmospheric simulation chamber is schema-
tized in Fig. 2. The atmospheric chamber has a rectangular
shape with 1 m length × 1 m width ×2 m height (total vol-
ume 2 m3 ). The chamber is made of FEP film. The cham-
ber was continuously filled with 6 L min−1 of purified air,
where 2 L min−1 of this total flow was directed inside a glass
bubbler to maintain a constant relative humidity inside the
chamber (RH = 50 ± 5 %) (Fig. 2). The overall air renewal
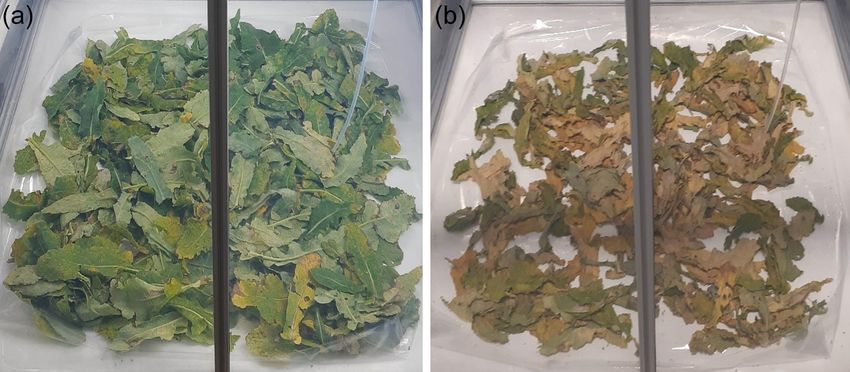
Figure 1. Example of the rapeseed litter condition (a) during the time in the chamber was around 5 h 30 min, which allows for
first day of the VOC and particle measurements and (b) after 6 d of chemical reactions to occur. The chamber was equipped with
VOC and particle measurements. 12 UV lamps (OSRAM lamps, Eversun L80W/79-R), with
six on the left wall and six on the right wall of the cham-
ber. The absolute irradiance within the chamber has been al-
ples were stored at −20 ◦ C. The sampled litter was reused
ready reported by Alpert et al. (2017). Light produced from
for all the measurements, throughout the experimentation,
the UV fluorescent tubes had wavelengths between 300 to
defrosting just the fraction of sample needed for the exper-
400 nm. Alpert et al. (2017) also reported that measurements
iment. At the beginning of each experiment, the leaves had
for λ < 300 nm yielded detection limit values on the order of
visually the same aspect and identical mass to volume ratio
10−3 W m−2 nm−1 ; thus, total light output below 300 nm is
(as an indirect metric of their decomposition). In addition,
negligible. The full spectrum is shown in Fig. S1 for com-
the VOCs were monitored during the stabilization of the ex-
pleteness. In comparison, the solar spectrum at the earth’s
perimental conditions and showed identical patterns.
surface is shown. It was derived using the online quick Tro-
2.2 Samples preparation pospheric Ultraviolet and Visible (TUV) calculator for a so-
lar zenith angle of 0◦ (available at https://gml.noaa.gov/grad/
The rapeseed leaves were acclimatized for about 2 h at 20 ◦ C solcalc/azel.html, last access: 20 September 2020).
before being inserted into the multiphase simulation cham- Temperature, relative humidity, and differential pressure
ber. In this way, leaves reached room temperature (20 ◦ C), (to ensure a slight overpressure in the chamber compared
which corresponds to the average temperature in the North to laboratory air) were monitored using a combined sensor
of France during summertime. This was necessary for repro- for temperature and relative humidity (Vaisala HUMICAP
duction of the real-time conditions under which the rapeseed humidity and temperature probe HMP110; Vaisala differen-
leaves start their decomposition. Once acclimatized, leaves tial pressure transmitter PDT101). Data about the monitored
were weighted and spread out to cover the whole surface of temperature are reported in Fig. S3. VOCs and particle for-
a FEP (fluorinated ethylene propylene) film (with a surface mation were monitored using a high-resolution proton trans-
of 0.64 m2 ) (Fig. 1a). After 6 d of measurement, the surface fer reaction mass spectrometer (PTR-TOF-MS 8000, Ionicon
covered by the rapeseed litter was estimated to be 0.45 m2 Analytik) and a scanning mobility particle sizer spectrometer
(Fig. 1b) using Adobe Photoshop software (V 21.1.1). Pho- (SMPS – model 3080, TSI), respectively.
toshop allowed for the manual selection of the pixels con-
taining the litter; the pixels were converted into surface area 2.4 Experimental setup
(m2 ) using the following formula:
The rapeseed litter was studied within a multiphase simula-
P xlitter tion chamber. The rapeseed litter was tested under three dif-
Alitter = , (1)
P x × m2 ferent conditions to distinguish the potential factors influenc-
ing the VOC emissions and the particle formation. The cho-
where Alitter is the area covered by the rapeseed litter 6 d af-
sen conditions were under (i) UV light irradiation, (ii) ozone,
ter the beginning of the experiment, P xlitter is the number
and (iii) ozone and UV light irradiation at the same time.
of pixels in the litter area, and P x × m2 is the number of
The UV light irradiation was turned off and on following the
pixels per m2 . The initial weight of rapeseed in the cham-
night–day cycle; the UV light was turned on for a total of
ber ranged from 75 to 80 g. After 6 d of measurement, the
7 h d−1 . The ozone was injected into the chamber once a day
weight decreased by 29 %–32 %. After being spread on the
at the same time that the UV light was turned on. The initial
FEP, the samples were introduced into the multiphase simu-
concentration of 80 ppb was progressively consumed during
lation chamber.
the day. Every sample was analysed during 6 d for each of
the previously mentioned conditions. Table 1 summarizes the
different experimental runs performed in this study. For each
of the selected conditions, blank experiments were made for
https://doi.org/10.5194/acp-21-12613-2021 Atmos. Chem. Phys., 21, 12613–12629, 2021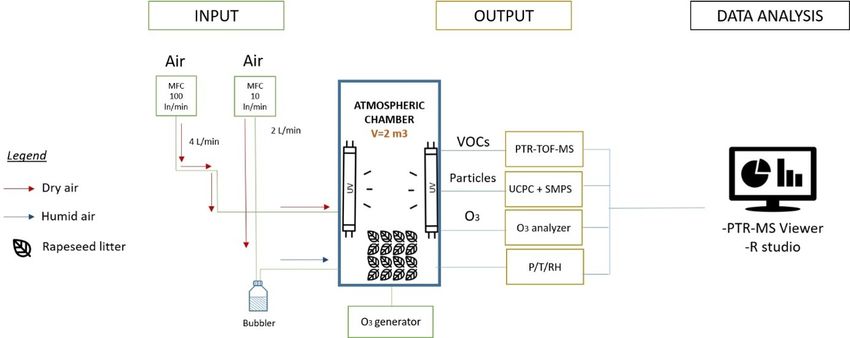
12616                                                                               L. Abis et al.: Biogenic VOC emission profiles

Figure 2. Scheme of the multiphase reaction chamber used for the study of the photoreactivity of the VOCs emitted from senescence
rapeseed. The PTR-TOF-MS has been used for the VOCs detection; the ultrafine condensation particle counter (UCPC) and the SMPS have
been used for the detection of the particle formation and measurement of the particle sizes respectively; and the O3 analyser detected the
ozone inside the chamber, where P (pressure), T (temperature), and RH (relative humidity) have been constantly monitored during the entire
experiment.

3 d under the same conditions and subtracted from the fol-             avoid different ionization conditions of the VOCs within the
lowing experiments.                                                    drift tube. The sample inlet of the PTR-TOF-MS was con-
                                                                       stantly heated at 60 ◦ C to avoid product loss by absorption in
2.5   Particle measurements                                            the inlet tube. The instrument sampled every 30 s with a flow
                                                                       rate of 100 mL min−1 , and the raw data were recorded us-
Particles were detected by means of an SMPS consisting                 ing TofDaq software (Tofwerk AG, Switzerland). The PTR-
of a differential mobility analyser (DMA, model 3085, TSI)             TOF-MS has a mass resolution of 4500 m / 1m. A calibra-
and an ultrafine condensation particle counter (UCPC model             tion gas standard (TO-14A Aromatic Mix, Restek Corpora-
3776 high flow, TSI, d50 >2.5 nm). During the experiments,             tion, Bellefonte, USA) containing 14 VOCs at a concentra-
the scanning particle size ranged from 2.5 to 79.1 nm, and             tion of 100 ± 10 ppb in nitrogen was used to calibrate and
both the sheath and sample flow rates were settled at 3 and            regularly assess the instrument performance, including mass
0.3 L min−1 , respectively. The SMPS inlet was positioned at           resolution, mass accuracy, sensitivity, and relative mass-
180 cm above the rapeseed surface to observe the particle for-         dependent transmission efficiency. The sensitivity of these
mation and growth. The density of the measured particles               compounds ranged between 15 and 70 cps ppb−1 , depending
was assumed to be 1 g cm−3 . The particle loss due to the              on the actual mass. However, since it was not possible to cal-
impact of the chamber walls was calculated based on data               culate the exact sensitivity for all the detected compounds,
from previous experiments performed on the same multi-                 we assumed that the proton reaction constant was always
phase simulation chamber (Alpert et al., 2017; Bernard et al.,         equal to 2 × 10⁻⁹ cm3 s−1 (Cappellin et al., 2011; Kalalian
2016). The estimations of the particle loss used for the cor-          et al., 2020); thus, the average sensitivity of 30 cps ppb−1
rection of the SMPS data are shown in Supplement Fig. S2.              was applied for all the compounds. Moreover, the calibration
                                                                       of the spectra was performed via both an oxygen isotope of
2.6   VOCs measurement                                                 the ion source H18     +
                                                                                         3 O (21.022 m/z) and an ionized acetone
                                                                                         +
                                                                       molecule C3 H7 O (59.0449 m/z) as described by Cappellin
VOCs were detected using the PTR-TOF-MS technique,                     et al. (2011). Those compounds were chosen for the calibra-
which has been already described in detail by Müller et                tion because their identification was straightforward for all
al. (2014). Ionization of the VOCs was carried out using the           the kinds of samples used in this study.
H3 O+ mode. The pressure and voltage of the drift tube were               After calibrating the spectra, a peak table was created
respectively set to 2.2 mbar and 500 V with a temperature              including the largest number of detected compounds. The
of 80 ◦ C. Consequently, the E/N ratio was about 123 Td                threshold for the automatic research feature of the peak was
(Townsend, where 1 Td = 10−17 V cm2 ). These parameters                set to 0.1 cps. Even if the peaks were automatically identi-
were maintained constant during the whole experiment to

Atmos. Chem. Phys., 21, 12613–12629, 2021                                                https://doi.org/10.5194/acp-21-12613-2021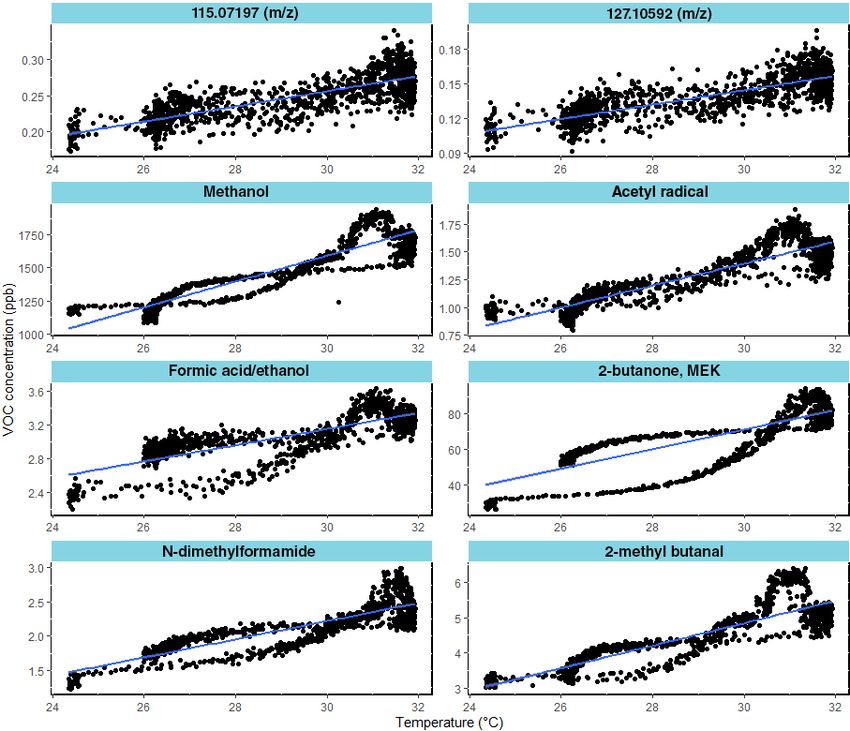
L. Abis et al.: Biogenic VOC emission profiles                                                                                                      12617

Table 1. Experimental conditions.

                Experimental               Colza weight              Surface covered             Days of     Days of    Blank conditions
                conditions                                                                          VOC         SOA
                                                                                                detection   detection
 UV light       7 h d−1 of irradiation     Initial weight: 85 g,     Initial surface covered:          6           1    3 d averaged with 7 h d−1
                with UV                    Weight after 6 d: 52 g    0.64 m2 ;                                          of irradiation with UV
                                                                     surface covered after
                                                                     6 d: 0.45 m2
 Ozone          Initial concentration of   Initial weight: 80 g.     Initial surface covered:          6           1    3 d averaged with an initial
                ozone injected in the      Weight after 6 d: 49 g    0.64 m2 ;                                          concentration of ozone injected
                chamber: 80 ppb                                      surface covered after                              in the chamber of 80 ppbs
                                                                     6 d: 0.45 m2
 UV light       Initial concentration      Initial weight: 80,7 g.   Initial surface covered:          6           1    3 d averaged with an initial
 and ozone      of ozone injected in       Weight after 6 d: 47 g    0.64 m2 ;                                          concentration of ozone injected
                the chamber: 80 ppbs,                                surface covered after                              in the chamber of 80 ppbs and
                7 h d−1 of irradiation                               6 d: 0.45 m2                                       7 h d−1 of irradiation with UV
                with UV

fied, a manual readjustment of every peak was performed to                     ble to distinguish between two ion masses that are closer than
reduce the bias of the automatic peak research. The range of                   the PTR-TOF-MS mass resolution, and (2) the PTR-TOF-
the detected masses was between 31 and 164 m/z. Masses                         MS does not distinguish between isomers (VOCs having the
deriving from the water cluster, such as 37.03, 38.03, 39.03,                  same molecular mass).
and 55.03 m/z, were not taken into account during the anal-
ysis of the dataset.                                                           2.6.2     Data analysis
   Furthermore, the mixing ratio (ppb) was calculated using
the PTR viewer software (V3.2.8, Ionicon, Analytik GmbH)                       The database was filled with 217 variables corresponding to
which used the equation described in Cappellin et al. (2011),                  the number of detected masses for the three different con-
and the VOC emissions fluxes (EVOC , in µg m−2 h−1 ) were                      ditions UV, O3 , and UV_O3 (as mentioned previously). The
calculated as follows:                                                         statistical analysis of the entire dataset was performed us-
                                                                               ing the R software (Version 1.2.5019 – © 2009–2019 RStu-
             Fair × ([VOC]litter − [mVOC]blank ) × MVOC                        dio). At first, we selected the variables that were normally
EVOC =       air ×
                                                                     (2)
            Vmol   ((Slitter-S + Slitter-E ) /2) × 1000 (ng/µg)                distributed by the Shapiro–Wilk test (W >0.9). Secondly, we
                                                                               tested the homogeneity of the variance by the Levene-test
where Fair is the net airflow (Fair = 240 L h−1 ), [VOC]litter is              to perform the analysis of variance (ANOVA) test followed
the concentration (ppb) of the VOC emitted in the chamber                      by the Tukey post hoc test. Furthermore, we tested the dif-
with the samples, and [VOC]blank is the concentration (ppb)                    ferences between the conditions using the principal compo-
of the VOC measured in the empty chamber. MVOC is the                          nent analysis (PCA – package FactormineR). The PCA al-
molecular mass of the corresponding VOC (g mol−1 ), Vmol      air
                                                                               lowed a graphical representation of the whole dataset differ-
is the air molar volume at standard temperature and pres-                      entiating the VOCs emission profiles for the different tested
sure (24.79 L mol−1 at 25 ◦ C and 1 atm), Slitter-S is the ex-                 conditions without bias. A table with the 30 most emitted
posed surface of litter to light when the experiment started,                  compounds and their relative abundance at the three differ-
and Slitter-E is the exposed surface of litter to light when the               ent conditions is presented in Table 1. Finally, the calculation
experiment ended.                                                              of the Shannon index was performed. The Shannon index is
                                                                               a quantitative measure reflecting how many different VOCs
2.6.1    Peak identification method                                            were emitted from each sample. It was calculated with the
                                                                               diversity function of the vegan package (version 2.4-3) in R
The spectra were analysed using the Spectra Analyser tool of                   softwareP  (version 3.2.3). The diversity index was calculated
the PTR viewer software (version 3.2.8, Ionicon). This tool                    as H = VOC EVOC log (EVOC ), where the sum is over all
allowed identification of the compounds corresponding to                       VOCs recorded in the mass table.
each peak in the spectra by searching for the possible combi-
nations of elements leading to the closest molecular weight.
This identification of the VOC was also double-checked with
literature reviews. Even if this method accounted for the most
precise identification of the VOCs, it does not provide a cer-
tain identification of the compounds since (1) it is not possi-

https://doi.org/10.5194/acp-21-12613-2021                                                       Atmos. Chem. Phys., 21, 12613–12629, 2021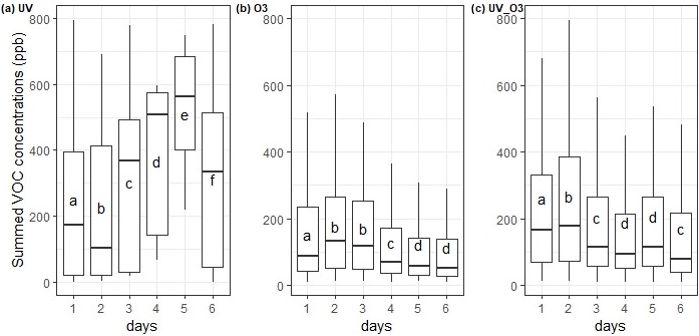
12618 L. Abis et al.: Biogenic VOC emission profiles
3 Results 3.2 Evolution and diversity of the VOC emissions per
day
3.1 Ozone and UV light irradiation effect on the
average VOC concentrations For the UV light experiments, small changes were ob-
served. For example, the average contribution of acetic acid
VOC emissions were measured for 6 d for each condition. (m/z 61.03) increased between 10 %–15 % during days 3
The summed VOC emissions from the different conditions to 5 compared to days 1, 2, and 6, while that of methanol
showed a statistical difference for every day of measurement. (33.03 m/z) increased by 5 % during days 2 and 3. How-
Under UV irradiation (the first condition), the summed VOC ever, the other most emitted VOCs contribution was constant
emissions kept increasing until the fifth day of measurement, during that time (Fig. 5a). For the O3 condition, the most
while during the last day it statistically decreased (Fig. 3a). important change in the average contribution is represented
Whereas, for the conditions O3 and UV_O3 (second and third by the mass 33.03 m/z, which increased by 7 % between the
conditions), the summed VOC emissions increased the sec- fourth and the sixth day (Fig. 5b). It is also worth mention-
ond day and then slowly decreased from the third to the sixth ing that masses 42.03 and 49.99 m/z contributed to less than
day of measurement (Fig. 3b and c). 0.01 % of the total VOC emissions during the first and sec-
Furthermore, the ANOVA test confirmed a difference be- ond day of measurements, while after 3 d their contribution
tween the averages of the summed VOC emissions per day. increased by an 80-fold and 200-fold change, reaching 0.8 %
These results highlight a statistical increase of the summed and 2 % of the VOC relative abundance, respectively. The
VOC emissions under UV irradiation (first condition) and average contribution of the mass 89.06 m/z decreased over
a statistical decrease of the summed VOC emissions over time from 5 % during the first day to 0.5 % during the sixth
time for the O3 and the UV_O3 conditions. The summed day of measurements. Similar behaviour was reported for the
VOC emissions were higher for the UV condition than for mass 73.06 m/z, where its average contribution increased to
the UV_O3 condition. The condition with the lowest VOC 8 % during the second and third measurement day and then
emission rate was with ozone. decreased to 0.5 % of the average contribution during the
The VOC emission profiles of the different conditions are sixth day. Analysing the UV_O3 condition, we noticed that
compared in Fig. 4. The PCA shows that the VOC profiles the variation in the VOC contribution per day is higher than
emitted during the UV condition were separated from the for the other conditions. In addition, the results in Fig. 5c
VOC profiles emitted from the UV_O3 and O3 conditions. reported that the mass 71.05 m/z was strongly emitted dur-
Meanwhile the UV_O3 and the O3 conditions had very sim- ing the sixth day of measurement (30 %), whereas this VOC
ilar profiles since their ellipses are superposed (Fig. 4). The emission did not reach 0.01 % of the contribution in the pre-
major differences in the emission profiles were led by the vious days. The average contribution of the mass 33.03 m/z
different concentrations of 10 compounds at the following decreased over time, passing from 70 % on the first and sec-
m/z values: 45.03, 45.99, 46.03, 47.02, 49.99, 59.049, 60.05, ond day to 30 % on the sixth day of measurements.
73.03, 108.95, and 125.95. Those compounds are also among Moreover, the Shannon index, representing the diversity of
the 30 most emitted compounds through all three conditions emitted VOC, was calculated for each day of measurements
(Table 1). The identification of the 30 most emitted com- to highlight an increase or a decrease of the VOC diversity
pounds for the three different conditions is listed in Supple- with time. The VOC Shannon index showed that there were
ment Table S1. no statistical differences in terms of VOC diversity that were
The 30 most emitted compounds represented 90 % of observed for the UV light condition (S.I. 3.05–3.28) and O3
the summed VOC emissions for each condition. The list condition (p value > 0.05). Concurrently, the UV_O3 condi-
of the most emitted compounds between the O3 con- tion results showed a statistically significant increase of the
dition and UV_O3 conditions was similar, especially in VOC diversity with time (from 1.54 to 2.4). The Shannon in-
terms of the types of emitted compounds. The three dex of the VOC also showed a significantly larger Shannon
most emitted compounds for these two conditions were index for the UV condition compared to the UV_O3 condi-
methanol (CH3 OH+ , 33.03 m/z), acetaldehyde (C2 H4 OH+ , tion (3.15 compared to 2). An intermediate value of 2.35 was
45.03 m/z), and butyric acid (C4 H8 O2 H+ , 89.05 m/z), while obtained for the O3 condition.
for the UV condition the three most emitted VOCs were
acetic acid (61.03 m/z), acetone (59.049 m/z), and methanol 3.3 Ozone and UV light irradiation effect on particle
(33.03 m/z). The average contribution of the VOCs over the formation
6 measurement days showed a large difference for each con-
dition. For instance, methanol contributed to 9 %, 32 %, and Concurrently with the detection of VOC emissions, we also
50 %, for UV, O3 , and UV_O3 , respectively. investigated particle formation for the three different con-
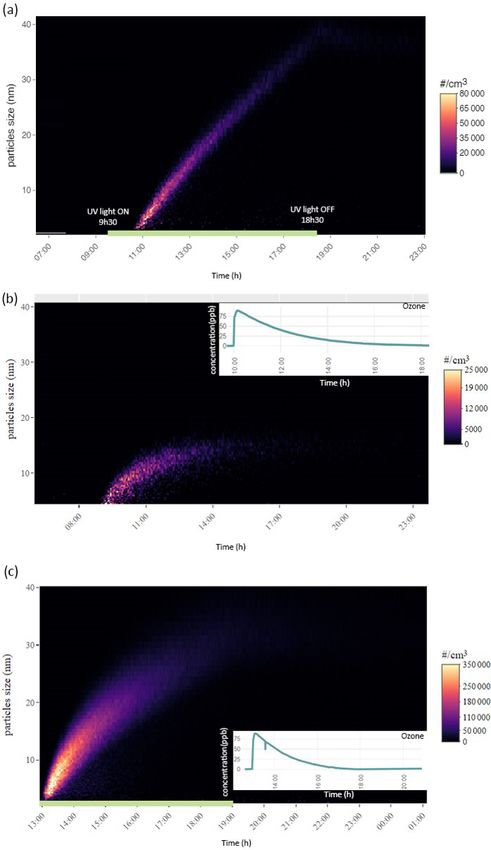
ditions. Under UV irradiation, nucleation started 1 h after
switching on the UV light (Fig. 6a). The initial nucleation
produced a dense number of particles between 5 × 10⁴ and
Atmos. Chem. Phys., 21, 12613–12629, 2021 https://doi.org/10.5194/acp-21-12613-2021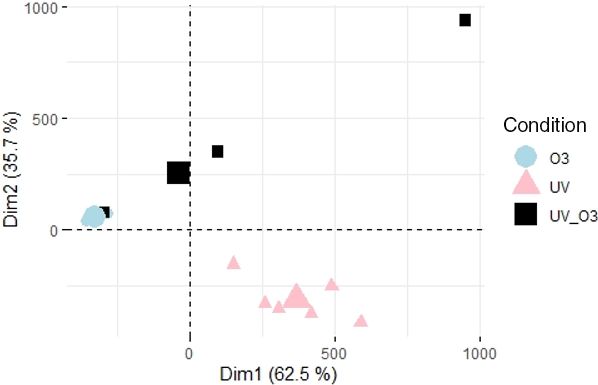
L. Abis et al.: Biogenic VOC emission profiles                                                                                    12619

Figure 3. Summed VOC concentrations for each day (24 h period) incubation condition (a) UV, (b) O3 , and (c) UV_O3 . Letters indicate the
statistical difference obtained by the Tukey test.

                                                                       tion. The positive correlation means that VOC emissions
                                                                       increased with the temperature. Those compounds have a
                                                                       Spearman coefficient higher than −0.80. For the other VOC
                                                                       not displayed in Fig. 7, correlations lower than 0.8 were
                                                                       found.

                                                                       4     Discussion

                                                                       4.1    UV light and ozone affect the diversity of the VOC
                                                                              emission profiles

                                                                       For the O3 and UV_O3 experiments, the VOC diversity de-
                                                                       creased while the methanol contribution increased. Potard et
Figure 4. VOC profiles differences between UV light, UV_O3 , and       al. (2017) observed similar behaviours in their experiment,
O3 conditions; each point represent 1 d measurement. The percent-      which consisted of measuring VOC emissions from soils re-
age of the variance explained by the two first components is shown     ceiving different types of amendment: the highest methanol
on each axis (Dim1 and Dim2).                                          average contribution corresponded to the lowest VOC diver-
                                                                       sity. Moreover, differentiated VOC profiles have been high-
                                                                       lighted in the PCA (Fig. 4) between the UV light experiment
                                                                       and the O3 and UV_O3 experiments. Several mechanisms are
8 × 10⁴ particles cm−3 . Then, the number of particles de-             regulating the VOC emissions and thus affecting the VOC di-
creased, while their diameter increased from 2 to 40 nm.               versity. These mechanisms are discussed in detail in the fol-
Likewise, under the ozone condition (Fig. 6b), a nucleation            lowing paragraphs.
event also started 1 h after the injection of 80 ppb of ozone.
However, compared to the UV light irradiation experiment,              4.2    Effect of ozone and UV light irradiation on the
the ozone injection led to a lower number of particles formed                 most emitted compounds
(2.5×10⁴ particles cm−3 ) with a smaller diameter (< 17 nm).
Nevertheless, when the UV light irradiation was combined               Acetic acid (C2 H4 O2 , 61.03 m/z) and formic acid (CH2 O2
with ozone injection (third condition), the nucleation was             47.02 m/z). Organic acids such as acetic and formic acid are
stronger than the first two cases, reaching a maximum of               mostly emitted from living plants (Kesselmeier and Staudt,
3.5×10⁵ particles cm−3 for particle diameters between 2 and            1999) and from the foliage of trees and crops with fluxes
12 nm (Fig. 6c). Ozone depletion was also faster than in the           of 35 µg m−2 h−1 (Paulot et al., 2011). Viros et al. (2021)
case where only O3 was used (i.e., condition two).                     also detected acetic and formic acid from senescent litter
   Furthermore, in Fig. 7 the group of eight VOCs was pos-             with a flux of 0.05 and 0.98 µg m−2 h−1 , respectively. In this
itively correlated with temperature for the UV_O3 condi-               study, the emission rates of the two organic acids ranged

https://doi.org/10.5194/acp-21-12613-2021                                             Atmos. Chem. Phys., 21, 12613–12629, 2021
12620 L. Abis et al.: Biogenic VOC emission profiles
from 0.76 to 64.28 µg m−2 h−1 for acetic acid and from 0.23
to 9.12 µg m−2 h−1 for formic acid. Mozaffar et al. (2018)
described that the acetic acid emissions were affected by
temperature, as they recorded lower emissions in the early
morning than during the late afternoon. This could explain
the higher emissions of acetic acid observed in our study
where the temperature reached 30 ◦ C, which is higher than
the conditions encountered by Viros et al. (2021), i.e., 22 ◦ C.
Mozaffar et al. (2018), while analysing BVOCs from senes-
cent maize leaf litter, reported an acetic acid contribution to
the total BVOC emission of up to 26 %. Similar results were
obtained in our study where the contribution of the acetic
acid reached 20 % of the total VOC emissions under UV light
conditions.
Methanol (CH4 OH+ , 33.03 m/z). Methanol was the most
emitted compound in O3 and UV_O3 conditions. Methanol
emission from plants is ubiquitous (Bracho-Nunez et al.,
2011; Gonzaga Gomez et al., 2019; Harley et al., 2007; Wiß
et al., 2017). Moreover, methanol is the most emitted VOC
from crops and other plants such as Cistus albidus, Coronilla
valentina, and Prunus persica (Harley et al., 2007) and it of-
ten contributes to more than half of the overall VOC emis-
sions. Hence, in our study, the average methanol contribution
to the total VOCs emission is between 8.9 % (under UV) and
50 % (under UV and O3 ). Gonzaga Gomez et al. (2019) mea-
sured VOC emissions from rapeseed using dynamic cham-
bers and reported that methanol contributed from 56 % to
77 % of the summed VOC emissions. These values are higher
than in the current study. The reason behind this difference
could be that Gonzaga Gomez et al. (2019) measurements
were performed over the whole growing plant, while in our
experiment we only analysed the emission from the leaf lit-
ter. Furthermore, the emissions of methanol from leaves de-
pend on the phenological stage of the plant (Wiß et al., 2017),
which could be another factor differentiating this study from
that of Gonzaga Gomez et al. (2019). In fact, in this study, we
measured mature leaves in the last phenological state, while
Gonzaga Gomez et al. (2019) analysed leaving plants in the
flowering and grain filling stages. Mature leaves are known
to emit less methanol than young ones (Harley et al., 2007).
Methanol is produced via the demethylation of the pectin
by pectin methylesterase (PME) activity. This process occurs
during cell wall growth, which is an intense process happen-
ing during the early stage of leaf expansion (Fall and Ben-
son, 1996). Comparing the results obtained for the UV_O3
condition with that of Harley et al. (2007), where their ex-
perimental conditions were the closest to those used here, we
found that the methanol emissions were in the same range.
The emission flux of methanol under the UV_O3 condition in
the current study is 0.22 ± 0.03 µg g−1 h−1 , while Harley et
Figure 5. VOC relative abundance for rapeseed litter samples un-
al., 2007) reported fluxes ranging from 0.2 to 2.7 µg g−1 h−1
der (a) UV light (b) O3 , and (c) UV_O3 conditions. S.I. is the Shan-
non index representing the diversity of the VOC (for each day). for mature leaves. Moreover, under the UV condition, our
Letters indicate significant differences of the S.I. according to the results show a higher emission rate of methanol, which is
Tukey test with p value < 0.05. in line with previous studies that demonstrated how the UV
light increased the methanol emissions from leaves (Deren-
Atmos. Chem. Phys., 21, 12613–12629, 2021 https://doi.org/10.5194/acp-21-12613-2021L. Abis et al.: Biogenic VOC emission profiles 12621 Figure 6. Temporal evolution of particle number and size distribution, ordinate represents the electrical mobility diameter (nm) and the colour scale the particle number concentration. Particle formation for the first day of measurement under (a) UV light irradiation, (b) ozone injection and (c) UV light irradiation and ozone injection combined. The green horizontal line represents the timeline where the UV light were switched on for (a) the UV light have been turned on at 09:30 LST and turned off at 18:30 LST, for (c) the UV light have been turned on at 12:30 LST and turned off at 19:00 LST. Panels (b) and (c) also display the ozone concentration timeline during the particle formation. https://doi.org/10.5194/acp-21-12613-2021 Atmos. Chem. Phys., 21, 12613–12629, 2021
12622                                                                          L. Abis et al.: Biogenic VOC emission profiles

Figure 7. Correlation between VOC mixing ratios and temperature under the UV_O3 condition. The eight most correlated VOC are shown
(Pearson correlation coefficients >0.8).

dorp et al., 2011; Harley et al., 2007). Greenberg et al. (2012)   with different types of stress such as ozone exposure and leaf
detected a methanol flux of 1.3 µg m−2 h−1 from litter corre-      damage (chlorosis) caused by the sunlight (Seco et al., 2007).
sponding to 0.4 % of the total emission above the canopy, es-      In this study, leaves were under high ozone concentration
timated to be 300 µg m−2 h−1 . In this study, the methanol flux    (60–80 ppb) and intense UV irradiation, which could have
from leaf litter ranged from 4.6 to 28.4 µg m−2 h−1 depend-        accelerated the senescence period of the rapeseed leaves in-
ing on the experimental conditions. Hence, our results sug-        side the chamber. As a result of these stressing conditions,
gest that the contribution to the total above-canopy methanol      we obtained larger acetaldehyde emissions than in previ-
emissions of the rapeseed litter could range from 2 % to           ous studies. For instance, Greenberg et al. (2012) reported a
10 %.                                                              VOC flux for leaf litter under the canopy of 0.3 µg m−2 h−1 ,
   Acetaldehyde (C2 H4 OH+ , 45.03 m/z). Acetaldehyde was          corresponding to 0.2 % of the total above canopy acetalde-
the second most emitted compound for the O3 condition and          hyde emissions, while in this study the emission flux ranged
the third and the fourth most emitted for the UV_O3 and UV         from 1.97 ± 0.01 µg m−2 h−1 for the UV_O3 condition to
experiments, respectively. In general, the mechanisms lead-        26.7 ± 0.2 µg m−2 h−1 for the UV condition. The total above-
ing to acetaldehyde emissions are still uncertain. The most        canopy acetaldehyde emissions reported by Greenberg et
accredited hypothesis is that these emissions are correlated       al. (2012) were 200 µg m−2 h−1 . As for methanol, our study

Atmos. Chem. Phys., 21, 12613–12629, 2021                                          https://doi.org/10.5194/acp-21-12613-2021
L. Abis et al.: Biogenic VOC emission profiles                                                                             12623

suggests a higher contribution (ranging from 2 % to 13 %)         the most emitted VOCs from leaves and was correlated with
to the total above canopy acetaldehyde emissions from leaf        sunlight, because the highest emission peak of acetone oc-
litter.                                                           curred at midday. These findings are in line with the higher
    However, Hörtnagl et al. (2014) reported a burst of           emissions of acetone in the UV light experiment but not with
1900 µg m−2 h−1 after a meadow cutting. Nonetheless, an-          the UV_O3 experiment. Cojocariu et al. (2005) found that
other pathway for the production of acetaldehyde is ethanol       under stress conditions such as high O3 concentration, ace-
oxidation at the leaf level, forming acetaldehyde (Niinemets      tone concentration increased in Fagus sylvatica. This is in
et al., 2014; Seco et al., 2007). This process only occurs        contrast with the results of this study where the O3 concen-
in anaerobic conditions since it is the consequence of the        tration seems to reduce the acetone emissions. The biogenic
ethanolic fermentation pathway. Hence, acetaldehyde can be        nature of the source of acetone cannot be confirmed since, as
formed in leaf tissues, but this pathway cannot be the main       reported by Das et al. (2003), acetone emissions could be the
reason for the acetaldehyde emissions detected in this study,     result of photochemical reactions of other VOCs. Decaying
because the leaf litter was not in an anoxic environment. The     and senescing plants may be another direct source of acetone
magnitude of the acetaldehyde emission rate detected is sim-      (Warneke et al., 1999; Jacob et al., 2002; Karl et al., 2003).
ilar to the one detected by Bachy et al. (2016) from soil
hosting C4 crops (7 ± 9 µg m−2        −1
                                soil h ). Therefore, we under-    Other emitted compound
line the possibility that rapeseed leaf litter might contribute
to tropospheric acetaldehyde emissions at the same level as       Isoprene (C5 H8 H+ , 69.07 m/z). In this study, isoprene was
soil and plants under environmental stress conditions.            the 30th most emitted compound only in the experiment
    Acetoin (C4 H8 O2 H+ , 89.06 m/z). Acetoin was the sec-       without O3 . Its average contribution in the UV light exper-
ond and third most emitted compound for the conditions            iment was 1 % with a flux rate of 3.00 ± 0.03 µg m−2 h−1
UV_O3 and O3 respectively with an average contribution to         or 0.02 µg g−1 h−1 , which is almost 20 times lower than
the summed VOC emissions between 9 % and 11 %. This               the emissions reported by Morrison et al. (2016), where
compound has already been reported as one of the most             the maximum detected flux of isoprene from rapeseed was
emitted compounds from bacteria dwelling in rapeseed sam-         0.35 µg g−1 h−1 . This difference is probably due to the dif-
ples (Wagner et al., 2018). These bacteria have been iden-        ferent samples. Indeed, Morrison et al. (2016) investigated
tified as Enterobacter, Klebsiella, Serratia, Staphylococcus,     branches, while here only the emissions from senescent
and Streptomyces (Schulz and Dickschat, 2007). The pyru-          leaves were considered. However, the flux rate of isoprene re-
vate metabolic pathway of the microorganisms just listed al-      ported by this study is in line with those reported by Gonzaga
lows for the production of the acetoin molecule by the decar-     Gomez et al. (2019), i.e., 0.035 µg g−1 h−1 . Isoprene can also
boxylation of acetolactate (Schulz and Dickschat, 2007). The      be emitted from microorganisms such as bacteria and fungi.
large production of this compound can be attributed to the        Isoprene is an intermediate product of the mevalonate path-
presence of bacteria colonizing the leaves’ surfaces and also     way which leads to the production of essential organic com-
to the favourable conditions for bacteria growth, such as the     pounds within the microorganism’s cells (Hess et al., 2013).
optimal temperature (T = 25 ◦ C) (Membre et al., 2005) and        Isoprene is therefore a metabolite directly related to the pres-
humid atmosphere (RH = 50 %) (Mceldowney and Fletcher,            ence of microorganisms in soil and plants (Hess et al., 2013).
2008) in our experiments.
    Acetone (C3 H6 OH+ , 59.049 m/z). This compound was           4.3   Temperature effect on the BVOC emissions
largely emitted from litter under UV irradiation. The aver-
age contribution of acetone was 13 % under UV light, 1.64 %       Higher temperatures increase chemical reaction rates, cel-
when influenced by both UV and ozone, and 2 % when                lular diffusion rates, and the vapour pressure of the VOCs.
the litter was exposed to ozone only. Acetone has been re-        As a consequence, BVOC emission rates are dependent on
ported to be one of the most emitted compounds by plants          temperature. In this study, we identified eight VOCs emit-
and litter (Gonzaga Gomez et al., 2019; Greenberg et al.,         ted from rapeseed litter which were highly correlated with
2012). Greenberg et al. (2012) reported an average flux of        temperature. Among the most correlated ones, we identified
0.3 µg m−2 h−1 between 11:00 and 17:00. In this study, the        methanol and methyl ethyl ketone (MEK), in agreement with
emissions of acetone were 10 times higher under UV irradia-       previous reports investigating such temperature dependence
tion. Based on Greenberg et al. (2012), the current estimates     from rapeseed plants (Gonzaga Gomez et al., 2019). Harley
of litter contribution to the above canopy acetone emissions      et al. (2007) detected methanol emissions from six different
is 0.1 %. However, the flux reported in Table 2 suggest that      plant species. Their results reported a correlation between its
the litter contribution to acetone emission, in the absence of    emission and the temperature of the leaves and stomatal con-
ozone, could be as large as 6 %.                                  ductance. The mechanisms behind this behaviour have been
    In the study of Gonzaga Gomez et al. (2019), where the        explained by Niinemets and Reichstein (2003). Methanol is
VOC detection has been performed at a different phenologi-        produced within the cell walls, and it diffuses in the liquid
cal stage of the rapeseed plant, acetone was detected among       phase following the diffusion gradient until it reaches the

https://doi.org/10.5194/acp-21-12613-2021                                       Atmos. Chem. Phys., 21, 12613–12629, 2021
12624 L. Abis et al.: Biogenic VOC emission profiles
Table 2. The average of 30 most emitted compound during the 6 d of measurement for the three different conditions: UV light irradiation,
ozone, and UV light irradiation and ozone at the same time. The flux was calculated using the averaged surface of the leaf litter between
the initial covered surface (0.64 m2 ) and the final covered surface (0.45 m2 ). Within the columns m/z, the compounds highlighted as the
most differentiating between the VOC profiles by the PCA are in bold. A tentative identification of the compound here listed is reported in
Supplement Table S1.
Most concentrated Most concentrated Most concentrated
compounds (UV) compounds (O3 ) compounds (UV_ O3 )
m/z BVOC flux Average m/z BVOC flux Average m/z BVOC flux Average
(µg m−2 h−1 ) ± SD∗ contribution (%) (µg m−2 h−1 ) ± SD∗ contribution (%) (µg m−2 h−1 ) ± SD∗ contribution (%)
61.03 64.28 ± 0.60 20.16 33.03 4.59 ± 0.01 31.52 33.03 24.35 ± 0.09 50.40
59.049 41.50 ± 0.06 13.01 45.03 1.44 ± 0.01 9.89 89.06 5.24 ± 0.001 10.85
33.03 28.38 ± 0.17 8.90 89.06 1.16 ± 0.001 7.96 45.03 1.97 ± 0.01 4.09
45.03 26.71 ± 0.20 8.38 73.06 1.15 ± 0.001 7.92 73.06 1.93 ± 0.00 3.99
43.02 18.35 ± 1.90 5.76 87.04 1.10 ± 0.08 7.58 87.04 1.53 ± 0.42 3.18
47.02 9.12 ± 1.20 2.86 61.03 0.76 ± 0.01 5.21 71.04 1.48 ± 0.76 3.07
87.04 7.78 ± 1.17 2.44 43.02 0.61 ± 0.04 4.21 43.02 1.46 ± 0.22 3.02
47.01 7.23 ± 1.66 2.27 71.05 0.46 ± 0.03 3.16 61.03 1.26 ± 0.02 2.60
123.94 5.41 ± 0.08 1.70 59.049 0.30 ± 0.001 2.07 51.04 1.02 ± 0.001 2.12
49.99 5.34 ± 0.02 1.68 47.02 0.23 ± 0.02 1.60 49.01 0.92 ± 0.001 1.90
42.03 5.18 ± 0.47 1.63 60.04 0.22 ± 0.01 1.50 59.049 0.79 ± 0.001 1.64
108.95 3.75 ± 0.10 1.18 51.04 0.19 ± 0.001 1.32 47.05 0.65 ± 0.06 1.34
75.01 3.69 ± 0.05 1.16 87.07 0.18 ± 0.02 1.23 94.99 0.39 ± 0.16 0.81
47.05 3.13 ± 0.08 0.98 49.99 0.14 ± 0.001 0.95 47.02 0.35 ± 19.23 0.73
69.07 3.00 ± 0.03 0.94 75.01 0.14 ± 0.001 0.94 57.07 0.35 ± 0.001 0.73
60.05 2.83 ± 0.30 0.89 47.01 0.09 ± 0.03 0.64 71.08 0.34 ± 0.001 0.71
73.03 2.79 ± 1.04 0.87 43.05 0.09 ± 0.01 0.61 43.05 0.33 ± 0.02 0.67
43.03 2.59 ± 0.34 0.81 46.03 0.09 ± 0.03 0.60 87.07 0.28 ± 0.07 0.58
101.06 2.59 ± 0.41 0.81 42.03 0.07 ± 0.001 0.49 60.05 0.27 ± 0.01 0.56
87.07 2.30 ± 0.20 0.72 31.01 0.07 ± 2.22 0.47 75.012 0.26 ± 0.001 0.55
45.99 2.30 ± 0.33 0.72 45.99 0.07 ± 0.02 0.45 90.06 0.15 ± 0.001 0.32
73.06 2.27 ± 0.04 0.71 43.03 0.06 ± 0.06 0.43 47.01 0.15 ± 0.65 0.31
125.95 2.25 ± 0.07 0.71 123.94 0.06 ± 0.001 0.42 31.02 0.14 ± 0.46 0.30
90.95 2.16 ± 0.06 0.68 47.05 0.05 ± 0.001 0.35 49.99 0.13 ± 0.001 0.27
57.06 2.12 ± 0.08 0.67 88.04 0.05 ± 0.01 0.34 43.03 0.12 ± 0.60 0.25
55.93 1.85 ± 0.06 0.58 73.03 0.05 ± 1.26 0.34 46.03 0.11 ± 0.05 0.23
46.03 1.84 ± 2.19 0.58 55.93 0.05 ± 0.001 0.32 123.94 0.09 ± 0.001 0.18
57.03 1.78 ± 0.74 0.56 90.06 0.05 ± 0.01 0.31 42.03 0.08 ± 0.04 0.16
31.01 1.70 ± 0.21 0.53 74.06 0.05 ± 0.11 0.31 74.06 0.07 ± 0.53 0.15
93.95 1.64 ± 0.10 0.51 108.95 0.04 ± 0.001 0.28 96.007 0.07 ± 0.001 0.14
∗ Conversion to µg g−1 h−1 can be obtained by substituting the averaged surface with the grams of dry matter (45 g).
DM
surface of the cell walls. Then, methanol diffuses in the gas iment in this study with the experiment under the dry condi-
phase into the substomatal cavity and is released as VOC in tions of Faiola et al. (2014) (Table 3), the maximum volume
the ambient air through the stomata. In our study, stomata of SOA particles in our study has the same order of magni-
lock open as a consequence of cellular death (Prats et al., tude as the volume reported by Faiola et al. (2014). The most
2006), and the increased temperature accelerated the diffu- important difference between this study and the previous one
sion process releasing methanol as the most emitted com- is the concentration of the monoterpenes detected. In Faiola
pound from rapeseed leaf litter. et al. (2014) monoterpenes contributed to 80 % of the total
VOC emissions. Monoterpenes, together with isoprene and
4.4 SOA formation from leaf litter BVOC emissions sesquiterpenes, are considered to be the three primary classes
of VOCs forming SOA (Sakulyanontvittaya et al., 2008). Iso-
prene is the most emitted compound from vegetation (Sin-
To our knowledge, an investigation of SOA formation from
delarova et al., 2014) with a relatively small aerosol yield
leaf litter samples has only been reported by the study of
(Henze and Seinfeld, 2006). On the other hand, monoter-
Faiola et al. (2014). Faiola et al. (2014) reported the max-
penes have been known to widely contribute to SOA forma-
imum peak volume of SOA particles obtained through the
tion (Griffin et al., 1999). In this study, monoterpenes were
oxidation of the emitted VOCs by the injection of 130 ppb of
found to be lower than our PTR-TOF-MS detection limit, and
O3 under controlled atmospheric conditions. The experiment
isoprene was only the 30th most emitted compound under
was similar to the one performed here where only 80 ppbs of
UV light irradiation. For instance, furfural has been reported
ozone was injected (O3 condition). Comparing the O3 exper-
Atmos. Chem. Phys., 21, 12613–12629, 2021 https://doi.org/10.5194/acp-21-12613-2021Table 3. Comparison of the SOA formation from leaves litter samples reported in this study and the literature.
Sample type Sampling Measured Type of Experimental Maximum peak of Total aerosol Volume Reference
period particles chamber conditions aerosol formation volume contribution
range (nm) (µm3 cm−3 ) concentration of particles
(µm3 cm−3 ) < 20 nm
https://doi.org/10.5194/acp-21-12613-2021
Mix of Pinus ponderosa, May–June 2012 20–730 Atmospheric 130 ppb of 0.97–5.43 – – Faiola et al. (2014)
L. Abis et al.: Biogenic VOC emission profiles
Pseudotsuga menziesii Pinus chamber O3 in dry
monticola, Larix occidentalis (7.7 m3 ) conditions
litter and soil
Mix of Pinus ponderosa, May–June 2012 20–730 Atmospheric Reproducing 0.29–2.55 – – Faiola et al. (2014)
Pseudotsuga menziesii Pinus chamber raining event
monticola, Larix occidentalis (7.7 m3 ) 130 ppb of O3
litter and soil
Brassica napus litter June 2019 2.5–79.1 Multiphase 60–80 ppb 0.2 15.1 38 % This study
simulation of O3
chamber (2 m3 )
Brassica napus litter June 2019 2.5–79.1 Multiphase Only UV light 0.8 85.4 24 % This study
simulation
chamber (2 m3 )
Brassica napus litter June 2019 2.5–79.1 Multiphase 60–80 ppb of 7.6 787.8 24 % This study
simulation O3 and
chamber (2 m3 ) UV light
Atmos. Chem. Phys., 21, 12613–12629, 2021
1262512626 L. Abis et al.: Biogenic VOC emission profiles
as a precursor of SOA formation, with an aerosol yield rang- tion of UV light irradiation and ozone injection increased the
ing from 0.3 % to 3 % depending on the ozone concentration BVOC emission profile’s diversity. UV light irradiation was
(Colmenar et al., 2020). Acetaldehyde and acetone have been found to affect the production of SOA more than the O3 in-
reported to be taken up into the aerosol phase and to partic- jection. In the presence of both UV light and O3 , SOA for-
ipate in the aerosol-phase reactions (Barsanti and Pankow, mation was 9 and 52 times higher than from solely UV light
2004). Those reactions generate products with a relatively or ozone, respectively.
low vapour pressure, which leads to an additional partition- Low emissions of isoprene were detected, even though the
ing from the gas phase, increasing the organic particulate production of SOA was not negligible. The densest portion
mass (Limbeck et al., 2003; Tong et al., 2006). In this study, of particles produced by litter samples had a diameter lower
acetaldehyde and acetone were found to be correlated with than 20 nm, which might have caused an underestimation of
SOA formation from rapeseed leaf litter and to be largely the SOA formation from litter in other studies that detected a
emitted from 60 to 40 and from 17 to 12 ppb respectively range of particles with a diameter higher than 20 nm.
in the UV_O3 condition. The observed particle formations
highlighted the high oxidation potential of the UV light irra-
diation with a volume of particle production per day higher Code availability. The code is available under request at
than the one found for the O3 experiment (Table 2). More- letizia.abis@tu-berlin.de.
over, the combination of ozone and UV light produced a
larger maximum aerosol volume peak than the one reported
in Faiola et al. (2014) for both dry and wet conditions and the Data availability. Data are available for download at
largest aerosol volume per day compared to the O3 and UV https://doi.org/10.25326/0JXT-M252 (George, 2021).
light experiments (Table 3).
Furthermore, we observed particles in the range from 2.5
Supplement. The supplement related to this article is available on-
to 79.1 nm, while Faiola et al. (2014) detected them between
line at: https://doi.org/10.5194/acp-21-12613-2021-supplement.
20 and 730 nm. In this study, for the O3 experiment, the per-
centage of particles under 20 nm contributed to 38 % of the
total aerosol volume (Table 3). Therefore, aerosol formation
Author contributions. LA took charge of the conceptualization,
from leaf litter was certainly underestimated in this previous data curation, investigation, formal analysis, methodology, visual-
study due to the importance of particles below 20 nm. ization, and writing. CK handled the methodology, investigation,
writing, review and editing. BL handled the methodology and in-
vestigation. TW, LZ, and JC took care of the data curation and in-
5 Conclusions vestigation. SP took care of the investigation, methodology and re-
sources. BL performed writing, review, editing, and investigation.
This study highlighted the possibility that VOC emissions RC performed the conceptualization, data curation, methodology,
from rapeseed leaf litter, which is one of the three most writing, review and editing, funding acquisition, and project admin-
cultivated crops in France and worldwide, could have been istration, supervision, and validation. CG took care of the method-
ology, writing, review and editing, funding acquisition, and project
underestimated. We reported substantial SOA formation for
administration, supervision and validation.
the different studied conditions. In the experiment with UV
and O3 , the aerosol volume measured in the chamber was
790 µm3 cm−3 . It is important to stress that these results may
Competing interests. The authors declare that they have no conflict
correspond to lower limits for SOA production since (i) the of interest.
UV lamps had about seven times lower light intensity at
365 nm than actual solar radiation and (ii) the detection of
the particles was performed up to 79.1 nm; consequently, the Disclaimer. Publisher’s note: Copernicus Publications remains
formation of particles having greater diameters was not de- neutral with regard to jurisdictional claims in published maps and
tected. We, therefore, suggest that SOA formation from leaf institutional affiliations.
litter may have an atmospheric impact. This study also high-
lights the need for further studies to quantify the possible
impact of the SOA formation from leaf litter at a larger scale. Special issue statement. This article is part of the special is-
In this work, we detected the VOC from rapeseed litter sue “Simulation chambers as tools in atmospheric research
samples for 6 d under three different conditions: UV light (AMT/ACP/GMD inter-journal SI)”. It is not associated with a con-
irradiation, ozone injection, and UV light combined with ference.
ozone injection. The experiments were performed under con-
trolled conditions within an atmospheric simulation cham-
ber. The results showed that BVOC emissions from senescent Acknowledgements. This work received funding from the Agence
de la transition écologique (ADEME) under the Cortea program
rapeseed litter impact SOA formation and that the combina-
Atmos. Chem. Phys., 21, 12613–12629, 2021 https://doi.org/10.5194/acp-21-12613-2021You can also read


