Three-Dimensional Surface Deformation in the 2016 M W 7.8 Kaikōura, New Zealand, Earthquake From Optical Image Correlation: Implications for ...
←
→
Page content transcription
If your browser does not render page correctly, please read the page content below
Three-Dimensional Surface Deformation in the 2016 M
      W 7.8 Kaikōura, New Zealand, Earthquake From
      Optical Image Correlation: Implications for Strain
        Localization and Long-Term Evolution of the
              Pacific-Australian Plate Boundary
          Robert Zinke, James Hollingsworth, James Dolan, Russ van Dissen

     To cite this version:
    Robert Zinke, James Hollingsworth, James Dolan, Russ van Dissen. Three-Dimensional Surface De-
    formation in the 2016 M W 7.8 Kaikōura, New Zealand, Earthquake From Optical Image Correla-
    tion: Implications for Strain Localization and Long-Term Evolution of the Pacific-Australian Plate
    Boundary. Geochemistry, Geophysics, Geosystems, AGU and the Geochemical Society, 2019, 20 (3),
    pp.1609-1628. �10.1029/2018GC007951�. �hal-02416376�

                                 HAL Id: hal-02416376
                https://hal.archives-ouvertes.fr/hal-02416376
                                     Submitted on 1 Sep 2021

    HAL is a multi-disciplinary open access            L’archive ouverte pluridisciplinaire HAL, est
archive for the deposit and dissemination of sci- destinée au dépôt et à la diffusion de documents
entific research documents, whether they are pub- scientifiques de niveau recherche, publiés ou non,
lished or not. The documents may come from émanant des établissements d’enseignement et de
teaching and research institutions in France or recherche français ou étrangers, des laboratoires
abroad, or from public or private research centers. publics ou privés.
                                              Copyright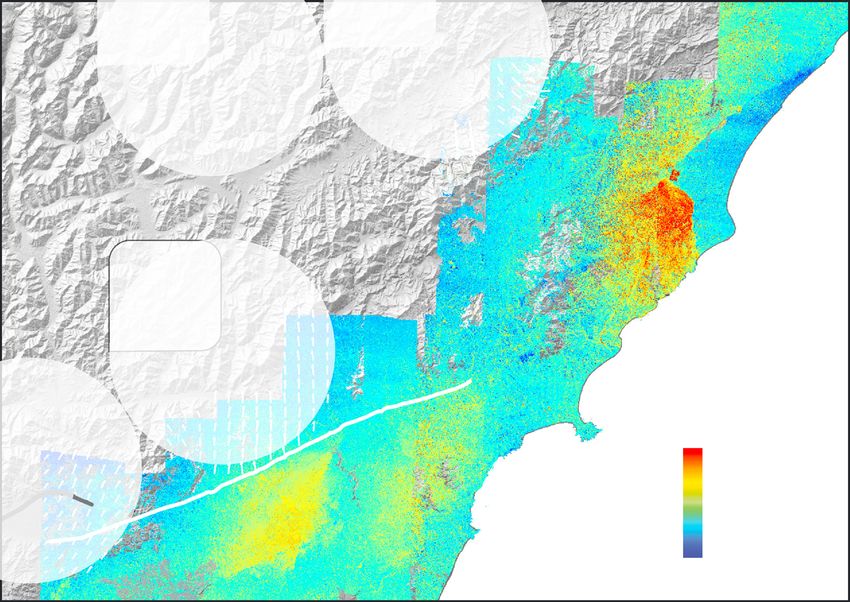
RESEARCH ARTICLE                              Three‐Dimensional Surface Deformation in the 2016 MW
10.1029/2018GC007951
                                              7.8 Kaikōura, New Zealand, Earthquake From Optical
Key Points:
• Correlation of high‐resolution
                                              Image Correlation: Implications for Strain
  optical satellite imagery reveals 3‐D
  surface deformation patterns of the
                                              Localization and Long‐Term Evolution
  2016 MW 7.8 Kaikōura earthquake
• Kinematic analysis shows slip on
                                              of the Pacific‐Australian Plate
  northern faults was subparallel to
  plate motion but slip on southern
                                              Boundary
  faults was transpressional
• Comparison of Kekerengu fault field
                                              Robert Zinke1       , James Hollingsworth2         , James F. Dolan1       , and Russ Van Dissen3
  measurements with image                     1
  correlation measurements reveals
                                              Department of Earth Sciences, University of Southern California, Los Angeles, CA, USA, 2Université Grenoble Alpes,
  up to ~36% distributed deformation          Université Savoie Mont Blanc, CNRS, IRD, IFSTTAR, Grenoble, France, 3GNS Science, Lower Hutt, New Zealand

Supporting Information:
• Supporting Information S1                   Abstract We generated dense, high‐resolution 3‐D ground displacement maps for the 2016 MW 7.8
• Supporting Information S2                   Kaikōura, New Zealand earthquake—the most geometrically and kinematically complex rupture yet
• Table S1
                                              recorded—from stereo WorldView optical satellite imagery using a new methodology that combines subpixel
• Table S2
• Table S3                                    image correlation with a ray‐tracing approach. Our analysis reveals fundamental new details of near‐field
• Table S4                                    displacement patterns, which cannot easily be obtained through other methods. From our detailed correlation
• Table S5
                                              maps, we measured fault slip in 3‐D along 19 faults at 500‐m spacing. Minimum resolvable horizontal slip
• Table S6
• Table S7                                    is ~0.1 m, and vertical is ~0.5 m. Net slip measurements range from 5–100 m capture nearly all (~90%) of the surface deformation.
R. Zinke,
rzinke@usc.edu
                                              1. Introduction
Citation:
                                              The 2016 MW 7.8 Kaikōura, New Zealand, earthquake produced one of the most spatially and kinematically
Zinke, R., Hollingsworth, J., Dolan, J. F.,
& Van Dissen, R. (2019).                      complex ruptures ever recorded. The mainshock occurred shortly after midnight, local time, on 14 November
Three‐dimensional surface deformation         2016, near the town of Waiau in northern South Island, New Zealand (Cesca et al., 2017; Kaiser et al., 2017;
in the 2016 MW 7.8 Kaikōura, New
                                              Litchfield et al., 2018; Nicol et al., 2018). The focal mechanism indicated a nondouble couple source, with
Zealand, earthquake from optical image
correlation: Implications for strain          significant right‐lateral and reverse motion (e.g., www.globalcmt.org/; Duputel & Rivera, 2017,
localization and long‐term evolution of       Hollingsworth et al., 2017, Kaiser et al., 2017). The rupture propagated northeastward for approximately
the Pacific‐Australian plate boundary.
                                              1.5 min, with peak moment release occurring at ~60 s or later (e.g., Cesca et al., 2017; Holden et al., 2017;
Geochemistry, Geophysics, Geosystems,
20, 1609–1628. https://doi.org/10.1029/       Hollingsworth et al., 2017). Fault rupture with surface displacements >1 m was reported along more than
2018GC007951                                  15 onshore and offshore faults (some of which were oriented ~90° to each other), resulting in a total surface
                                              trace length of ~180 km (Stirling et al., 2017; Litchfield et al., 2018; this study). Debate remains as to what role
Received 17 SEP 2018
                                              the subduction megathrust fault played in the earthquake, though it is generally presumed that it, or some
Accepted 9 FEB 2019
Accepted article online 15 FEB 2019           other deep thrust fault, contributed to the overall moment release and likely aided rupture propagation
Published online 28 MAR 2019                  through the complex network of faults (Bai et al., 2017; Cesca et al., 2017; Clark et al., 2017; Duputel &
                                              Rivera, 2017; Hamling et al., 2017; Hollingsworth et al., 2017; Litchfield et al., 2018; Wang et al., 2018).
                                              Immediately following the 14 November mainshock, teams of field geologists began measuring surface
                                              deformation resulting from the rupture (Clark et al., 2017; Kearse et al., 2018; Langridge et al., 2018;
                                              Litchfield et al., 2018; Nicol et al., 2018; Stirling et al., 2017; Williams et al., 2018). These measurements pro-
©2019. American Geophysical Union.            vide key insights into the spatial distribution, kinematics, and complexity of slip in the event. Due to the lim-
All Rights Reserved.                          itations of measurable geomorphic and linear cultural features, however, the field measurements of

ZINKE ET AL.                                                                                                                                                1609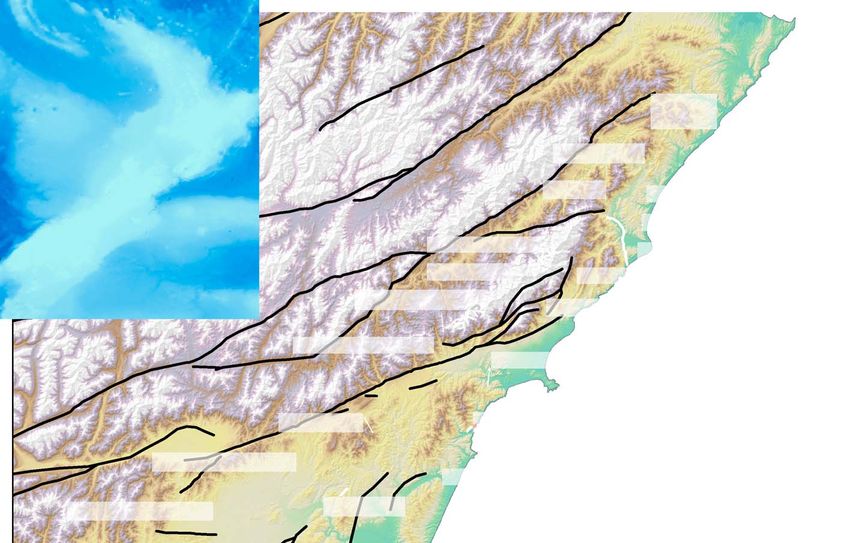
Geochemistry, Geophysics, Geosystems                                                  10.1029/2018GC007951

                   displacement tend to be clustered, leaving large gaps in their spatial coverage. Furthermore, many field mea-
                   surements could only be projected into the fault zone over relatively narrow (several‐meter‐wide) fault‐
                   perpendicular widths, thus potentially missing a component of the total fault offset (Dolan & Haravitch,
                   2014; Milliner et al., 2015, 2016; Rockwell et al., 2002; Shelef & Oskin, 2010; Zinke et al., 2014). To help over-
                   come these limitations, field measurements were often supplemented by remotely sensed data sets, including
                   light detection and ranging (lidar) and interferometric synthetic aperture radar (InSAR). Simultaneously, geo-
                   detic and seismological studies examined broad‐scale patterns of deformation (Bai et al., 2017; Cesca et al.,
                   2017; Hamling et al., 2017; Holden et al., 2017; Hollingsworth et al., 2017; Kaiser et al., 2017; Morishita
                   et al., 2017; Wang et al., 2018; Xu et al., 2018). Although measurements from these studies helped to constrain
                   coarse patterns of surface deformation and to infer fault structure and slip at depth, they lacked the spatial
                   resolution necessary to characterize finer‐scale patterns of surface slip variability or details of the fault zone
                   structure. The limitations of these various geological and geophysical data sets highlight the need for a means
                   of determining fine‐scale, spatially continuous patterns of surface deformation across broad spatial areas,
                   which can link detailed surface deformation patterns with the smoother slip distributions inferred at depth.
                   In this study, we take advantage of very high resolution (~0.5 m) stereo preearthquake and postearthquake
                   WorldView optical satellite images to retrieve a homogeneous 3‐D ground‐surface displacement field in the
                   vicinity of the 2016 Kaikōura earthquake rupture using a new optical image correlation (OIC) methodology.
                   These deformation maps provide the most detailed, seamless, and comprehensive view of surface displace-
                   ment to date, with independent measurements computed every 32 m (with no smoothing imposed through
                   regularization). From these maps, we measured fault‐parallel, fault‐perpendicular, and vertical displace-
                   ments along mapped surface faults. These measurements allow us to determine the kinematics of the rup-
                   tured faults and in turn assess the kinematic consistency between the 2016 earthquake and long‐term
                   patterns of fault deformation expressed in the landscape. Furthermore, our data allowed an opportunity
                   to compare OIC‐derived estimates of near‐field (distributed and localized) displacement along the
                   Kekerengu fault rupture, with detailed published field measurements of fault‐parallel slip (Kearse et al.,
                   2018) to reveal patterns of fault slip localization and distributed off‐fault deformation (OFD). Highly detailed
                   documentation of the near‐field displacement pattern is crucial for understanding the physics of how faults
                   slip, as well as informing models of dynamic fault rupture. More specifically, the Kaikōura earthquake pro-
                   vides a rare opportunity to investigate the surface deformation pattern for one of the most complex earth-
                   quake ruptures ever observed.

                   1.1. Tectonic Setting
                   Northeastern South Island, New Zealand, lies astride the Pacific‐Australian plate boundary, at the transition
                   between the Hikurangi subduction margin to the northeast, and the dextral‐oblique Alpine fault to the south-
                   west (Figure 1; Barnes et al., 1998; Holt & Haines, 1995; Reyners & Cowan, 1993; Wallace et al., 2012). The
                   subducting Pacific plate underlies much of the 2016 earthquake rupture area, at depths as shallow as 20–
                   30 km (Eberhart‐Phillips & Bannister, 2010; Wallace et al., 2012). The Hikurangi Trough terminates east of
                   the Kaikōura peninsula at approximately 43°S, where the buoyant continental crust of the Chatham Rise
                   is unable to subduct beneath South Island (Reyners & Cowan, 1993; Wallace et al., 2012). Here the tectonic
                   regime transitions into continental collision (Eberhart‐Phillips & Bannister, 2010; Nicol et al., 1994; Pettinga
                   et al., 2001; Wallace et al., 2012).The 2016 earthquake ruptured two distinct tectonic domains. North of (and
                   including) the Hope fault lies the Marlborough fault system (MFS), where northeast‐striking oblique right‐
                   lateral faults transfer strain between the Hikurangi subduction zone and Alpine fault (Figure 1; e.g.,
                   Litchfield et al., 2014; Wallace et al., 2012). The Northern Canterbury domain (NCD) lies south of the
                   Hope fault. Here faults are more geometrically and kinematically diverse than in the MFS (Nicol et al.,
                   1994; Pettinga et al., 2001), reflecting the complex interplay of the Hikurangi‐to‐Alpine fault strike‐slip tec-
                   tonics to the north and oblique continental collision to the south, which causes northeast‐southwest oriented
                   thrust faults (Figure 1, inset; Litchfield et al., 2018; Nicol et al., 1994, 2018; Pettinga et al., 2001).

                   2. Methods and Observations
                   2.1. Determination of 3‐D Deformation From Optical Image Correlation
                   OIC has shown great utility in previous studies measuring earthquake‐induced surface deformation (e.g.,
                   Avouac et al., 2014; Avouac & Leprince, 2015; Ayoub et al., 2009; Barnhart et al., 2014; Hollingsworth

ZINKE ET AL.                                                                                                                   1610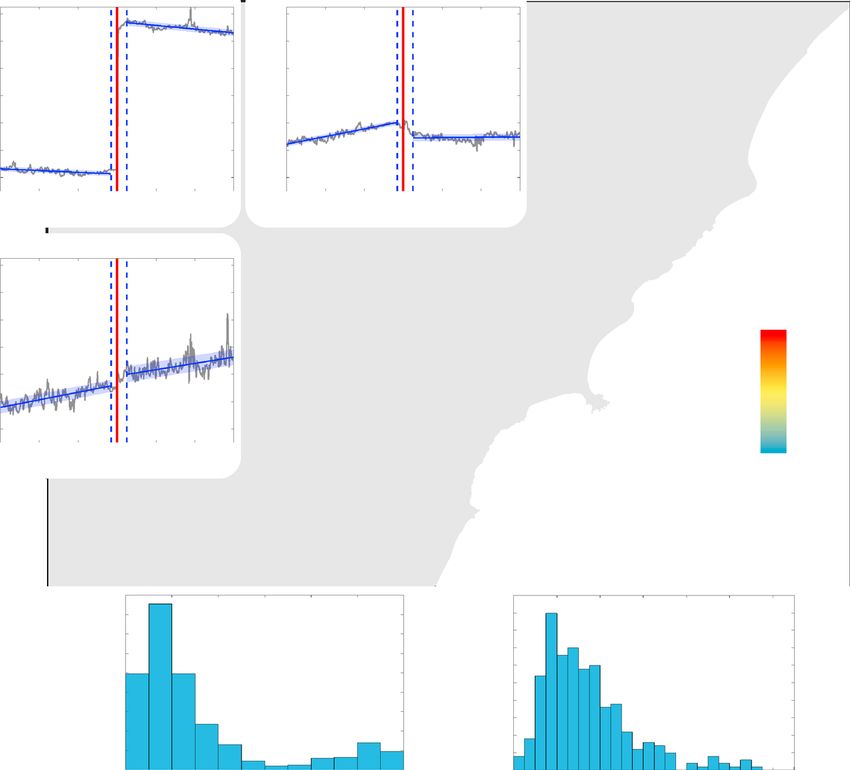
Geochemistry, Geophysics, Geosystems                                                        10.1029/2018GC007951

                   Figure 1. (inset) The Kaikōura region accommodates relative Pacific‐Australian plate motion between the Hikurangi sub-
                   duction zone (Hik) and dextral‐oblique Alpine fault (Alp F). CR is Chatham Rise. Red faults show our mapping of the
                   ground‐surface (or shallow subsurface) rupture in the 2016 earthquake based on gradients in our correlation maps; the
                   Needles fault ruptured the seafloor (Kearse et al., 2018) but is not considered here. Black star is the epicenter of the 14
                   November 2016 mainshock (Nicol et al., 2018). Black lines are active faults (from Langridge et al., 2016) on which we did
                   not observe surface rupture, though the Hikurangi megathrust may have ruptured at depth. The Hope fault separates the
                   MFS (north) from the NCD (south). SKR is Seaward Kaikōura Range. EP is Emu Plain. Base map is Shuttle Radar
                   Topography Mission DEM. Black thick arrow is the plate motion vector (Beavan et al., 2002; DeMets et al., 2010). Black
                   thin arrows and triangles represent fault kinematics in the 2016 rupture. MFS = Marlborough fault system;
                   NCD = Northern Canterbury domain.

                   et al., 2012, 2017; Leprince, Ayoub, et al. (2007); Leprince, Barbot, et al. (2007); Leprince et al., 2008; Michel
                   & Avouac, 2002, 2006; Milliner et al., 2015; Milliner, Dolan, et al., 2016; Milliner, Sammis, et al., 2016; Wei
                   et al., 2011; Zinke et al., 2014). OIC processing tools, such as COSI‐Corr (Leprince, Ayoub, et al., 2007),
                   MicMac (Rosu et al., 2015) and Ames Stereo Pipeline (Shean et al., 2016), provide fast and cost‐effective
                   means for determining continuous maps of on‐fault and off‐fault 2‐D surface displacement with limited
                   decorrelation near the fault (in stark contrast with InSAR measurements, which typically decorrelate
                   close to fault ruptures if the strain gradient between neighboring pixels exceeds a phase cycle). OIC is
                   furthermore capable of providing detailed near‐field surface slip measurements where piercing markers
                   necessary for field measurement are unavailable, and in locations that are otherwise inaccessible to field
                   survey teams. The result is a precise, regularly sampled set of fault displacements that can reveal details of
                   along‐strike surface slip variability and in turn provide insights into the earthquake rupture processes and
                   underlying mechanisms controlling surface deformation patterns (Milliner, Sammis, et al., 2016). Because
                   the correlations capture both on‐fault and off‐fault deformation, comparison of OIC‐derived fault offsets
                   with field measurements (which, in many instances, capture only localized on‐fault slip) can reveal
                   spatial patterns of distributed, off‐fault deformation (Milliner et al., 2015; Milliner, Dolan, et al., 2016;
                   Zinke et al., 2014). When combined with other remote sensing methods, such as InSAR and GPS, these
                   correlations can be used to refine static inversions for slip, especially with regards to the shallowest
                   portions of the crust (Xu et al., 2016). For earthquakes occurring prior to the availability of modern
                   satellite geodetic techniques (e.g., InSAR, GPS, and lidar; before ~1992), OIC provides the only method
                   for remotely characterizing the ground deformation (e.g., Hollingsworth et al., 2012; Marchandon et al.,
                   2018; Milliner et al., 2015).Using a standard 2‐D OIC processing approach (COSI‐Corr; see also Ayoub
                   et al., 2015), Hollingsworth et al. (2017) correlated preearthquake and postearthquake Landsat8 images
                   covering the 2016 rupture area. While providing robust measurements of broad‐scale surface deformation
                   patterns, the coarse pixel size (15 m) of the Landsat8 sensor limits the ability to detect fine‐scale details of
                   ground displacement. Furthermore, given the nadir (i.e., vertical incidence) acquisition geometry of

ZINKE ET AL.                                                                                                                           1611
Geochemistry, Geophysics, Geosystems 10.1029/2018GC007951
Landsat8 (and Sentinel‐2) imagery, OIC can only resolve the horizontal (2‐D) component of displacement,
thus leading to its application predominantly in studying strike‐slip earthquakes (Hollingsworth et al.,
2017). Because the 2016 Kaikōura earthquake produced large (up to 10 m) vertical displacements in addition
to large horizontal slip, properly accounting for this vertical motion becomes critical for adequately charac-
terizing the complex kinematics of the ruptured faults (e.g., Litchfield et al., 2018). More generally, better
constraint of the vertical component of deformation is essential for extending the use of OIC to studying nor-
mal and thrust earthquakes.
In this study, we greatly improved upon the methods used by Hollingsworth et al. (2017) by applying an
advanced workflow to retrieve both the horizontal and vertical displacement fields from correlations of pre-
earthquake and postearthquake high‐resolution stereo imagery. This methodology provides highly detailed
maps of 3‐D surface deformation without the need to combine multiple sensors or generate separate digital
elevation models (DEMs) with which to precisely orthorectify the preearthquake and postearthquake satel-
lite images (which are not always available and yet are essential for the successful correlation of nonstereo
WorldView images using a traditional 2‐D correlation approach; e.g., Kuo et al., 2018).
We applied this technique to stereo WorldView satellite imagery (~0.5‐m pixel), which is much higher reso-
lution than Landsat8 (band 8: 15 m), thereby allowing us to measure finer‐scale (up to 30 times) patterns of
deformation. Crucially, the WorldView images were acquired at oblique (off‐nadir) viewing geometries, thus
preserving a stereo effect between the two images, which we exploited using a simple ray tracing approach to
precisely recover the vertical dimension of ground motion. Following the methods of Avouac and Leprince
(2015), we chose sets of WorldView images such that each ground location was imaged by two preearthquake
images and two postearthquake images (each with opposing viewing geometries to exploit the stereo effect).
For each set, we coregistered three of the images to a master preearthquake image and orthorectified all four
using a relatively coarse‐resolution (8 m) DEM to remove long‐wavelength topographic distortions. We then
correlated each pair of images to create disparity maps for precise determination of tectonic offset and finer‐
scale topographic distortions. Coregistration, orthorectification, and correlation were all performed using
COSI‐Corr software (see, e.g., Leprince, Ayoub, et al., 2007). In much the same way that stereo imagery is
used to create topographic maps, we then used a ray tracing approach between the disparity maps and satel-
lite positions, known from the satellite auxiliary information, to invert for the precise horizontal and vertical
positions of each point on the ground surface. Finally, we directly solved for the 3‐D vectors by simply differ-
encing the preearthquake and postearthquake locations of each point (see Avouac & Leprince, 2015 and sup-
porting information S2). The final result was a map of 3‐D ground displacement measurements every 8 m.
Postprocessing was performed to remove noise and linear ramps within the final correlation maps. The pre-
cise details of the correlation approach are given in the supporting information (Table S1 and Text S2).
Despite the obvious power of this processing methodology, which has been applied to an earthquake only
once previously (in a proof‐of‐concept study documenting the 2010 El Mayor Cucapah earthquake rupture,
see Avouac & Leprince, 2015), the lack of available high‐resolution preearthquake and postearthquake
stereo images has thus far severely limited its potential application for recent earthquake studies. The
2016 Kaikōura earthquake therefore represents the first comprehensive application of this technique to an
earthquake. With increasing demand for multitemporal stereo acquisitions in the future, this new methodol-
ogy will help to facilitate more precise and rapid 3‐D characterization of ground deformation globally, with
application to a wide range of Earth Sciences applications (e.g., Herman et al., 2015).
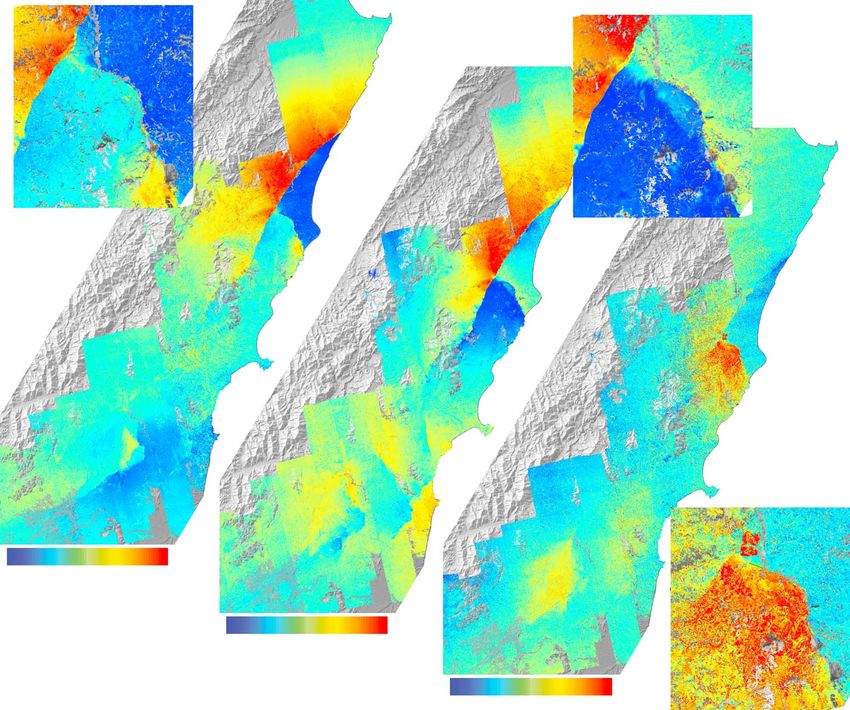
The final EW, NS, and vertical correlation results are presented in Figure 2 (and Figure S1). The correlations
resulted in well‐resolved values (with high signal‐to‐noise ratios) across much of the rupture, providing spa-
tially dense and continuous measurements of surface displacement spanning fault‐perpendicular distances
of ~5–20 km across a total area of ~5,000 km2. The correlations show spatially and kinematically complex
patterns of surface deformation rarely observed in past ruptures. The horizontal correlations contain only
minor or no topographic artifacts unaccounted for by our processing. Horizontal displacements across faults
and landslides on the order of centimeters are detectable as gradients in the correlation maps. The vertical
deformation field shows uplift and downdropping of the ground‐surface along faults, folds, and landslides.
Vertical deformation on the order of a few tens of centimeters is resolvable (the vertical stereo component is
less well resolved than the horizontal because the satellite incidence angles are generally not oriented far off
nadir, i.e.,Geochemistry, Geophysics, Geosystems 10.1029/2018GC007951
Figure 2. Image correlations showing EW, NS, and vertical deformation. Red lines show our mapping of fault ruptures;
gray lines are faults without rupture discernable in our correlations. (insets) Details of the Kekerengu‐Jordan Thrust,
Papatea, and Fidget fault junction. Gray areas show decorrelation caused mostly by landsliding (especially along the
Papatea fault).
Correlation proved challenging in areas of very high topographic relief, where steep mountainous slopes
may be undersampled due to the oblique viewing geometry of the satellite (equivalent to foreshortening
and shadowing effects in InSAR), and where talus‐covered hillslopes tended to crumble (particularly along
the crest of the Seaward Kaikōura Range). Landsliding, particularly along the Papatea fault (e.g., Massey
et al., 2018), led to decorrelation or artificially widened the apparent fault deformation zone where slumping
transported coherent blocks of earth (Figure 2). Agricultural change (harvesting, crop growth, and replant-
ing) also caused decorrelation and spurious values, especially in the southwestern (Emu Plain), and north-
eastern portions of the rupture. Finally, the changing position of shadows from one time of day to the next
biased correlation values in a handful of settings (appearing as topographically correlated noise). This effect
is most notable within a copse of trees near the junction of the Kekerengu‐Jordan Thrust, Papatea, and
Waiautoa faults, where a positive excursion in vertical correlation values is due in part to tectonic uplift,
and in part to shadow artifacts (Figures 1 and 2).
2.2. Fault Trace Mapping
We mapped the fault traces by visually identifying persistent gradients in our correlation results (Figures 1
and 2) and by noting discernable surface faulting in the postevent orthoimages. Our mapping was guided in
part by the Kaikōura surface rupture map provided in the New Zealand active faults database (https://data.
gns.cri.nz/af/, Langridge et al., 2016). Their mapping exclusively included brittle ground‐surface breaks
along discrete faults identified in field investigations (for which we reserve the term ground‐surface rupture).
Along some stretches of fault, it was ambiguous whether the gradients in our correlation maps indicated
fault displacement manifested as discrete ground‐surface rupture or rupture in the shallow subsurface that
did not reach the ground‐surface along discrete planes. Because of this ambiguity, we include both cases in
ZINKE ET AL. 1613Geochemistry, Geophysics, Geosystems 10.1029/2018GC007951
our fault trace maps. The spatial complexity of the fault ruptures in the Kaikōura earthquake (e.g., en echelon
shear zones and subsidiary fault strands separated by only a few meters) required us to define what consti-
tuted a coherent, mappable fault strand. Mapping fault strands >500 m in length, separated from neighbor-
ing strands by at least 500 m, provided the optimal balance between preserving spatial complexity and
resolving robust slip measurements across the fault. In a few cases, notably along the junction of the
Kekerengu and Jordan Thrust faults, we mapped the fault strands with closer spacing. We also mapped
faults as separate strands where the traces changed strike abruptly or intersected other faults. For consis-
tency, we mapped the fault traces as line segments with one point every ~100 m.
With these guidelines, we mapped 19 faults in 48 segments (Figure 1 and Data Set S1). Segment lengths ran-
ged between 0.5 and 26.5 km. All but one of the faults had been previously identified by field teams; one
fault, which we term the Snowflake Spur fault, was not identified in the field (see section 2.3). Along some
of the faults, sharp and continuous deformation gradients in our correlations allowed us to extend the length
of fault rupture beyond the limits of mapped surface rupture identified in the field (e.g., the Fidget fault
between 173°40′E and 173°49′E).
Conversely, some minor stretches of surface rupture reported by field teams were not discernable in our cor-
relation results, likely because the displacements were too small or the surface rupture lengths too short.
These faults include, most notably, the Seaward and Conway stretches of the Hope fault and the Heaver's
Creek fault. Inclusion of these faults in our surface slip analyses would likely make little difference to our
final results, as collectively their surface ruptures are no longer than a few kilometers, and their maximum
displacements are almost allGeochemistry, Geophysics, Geosystems 10.1029/2018GC007951
Figure 3. Net slip measurements (colored dots) from stacked displacement profiles collected every 500 m (black bar in
upper right corner represents measurement profile dimensions: 0.5 km along strike and 6 km perpendicular to strike).
(insets) Three components of slip on the Kekerengu fault. Blue solid lines are linear best fits of surface deformation. Blue
bashed lines show fault zone width. (bottom left) Histogram of all net slip measurements. (bottom right) Histogram of all
valid fault zone width measurements.
measured displacement across one of the faults at a time, to avoid overestimating the total deformation
across the fault system.
In most cases, the near‐fault surface deformation formed >50‐m‐wide zones of distributed deformation.
Within these zones, deformation is accommodated not only by discrete, brittle surface faulting but also by
subsidiary faulting, warping, granular flow, and/or local block rotations (Ben‐Zion & Sammis, 2003;
Milliner et al., 2015; Milliner, Dolan, et al., 2016; Shelef & Oskin, 2010; Zinke et al., 2014). The fault zone
is evident as rollover in our displacement profiles, where displacement values curve into the primary fault
trace (Figure 3, insets). Where fault zone rollover occurred, we ignored the reduced displacement values
within the fault zone, instead projecting our displacement profiles into the fault from the far‐field to capture
the full offset across the fault. Nontectonic phenomena such as landslides, clouds, and shadows, as well as
minor uncorrected topographic residuals, led to spurious local values of apparent deformation in or near
the fault zone. Such phenomena were similarly ignored to provide the most reliable estimates of total surface
displacement. We refer to the width of ignored values as the measurement aperture to distinguish these
values from true fault zone width measurements. In the absence of landslides, clouds, uncorrected topo-
graphic residuals, or other noise in the correlations, the measurement aperture equates to the fault zone
width. Based on the typical noise level of our displacement measurements, we found that fault zone width
could be consistently measured with a precision of ±50 m, though resolution was better in some locations
(e.g., the Kekerengu fault). To determine the measurement aperture, and fault zone width, we simulta-
neously considered the profiles for all three slip components (fault‐parallel and fault‐perpendicular,
and vertical).
ZINKE ET AL. 1615Geochemistry, Geophysics, Geosystems 10.1029/2018GC007951
Figure 4. Rupture kinematics. Black arrows show horizontal surface displacement vectors on map of vertical deforma-
tion. Gray lines show unruptured faults in the SKR; Hope fault separates the MFS and NCD. (insets) Lower hemisphere
projections (colored contours) and rose diagrams of scaled slip vector orientations for slip along MFS and NCD faults.
Black triangles at edges of rose diagrams indicate relative plate motion direction (Beavan et al., 2002; DeMets et al., 2010).
MFS = Marlborough fault system; NCD = Northern Canterbury domain; SKR = Seaward Kaikōura Range.
2.5. Offset Measurement and Fault Zone Width Analysis
In all, we collected 531 measurements of fault offset at 500‐m spacing (Figure 3 and Table S2 and
Data Set S2). Offsets range up to 12.0 ± 0.7 m of net slip, with a mean of 3.2 m and median of 2.0 m. The
MFS faults (north of the Hope fault; Figure 1) had the highest average slip values: ~5.1‐m net slip, with off-
sets commonly >9 m. The largest net displacements were on the Kekerengu (maximum 12.0 ± 0.7 m) and
Papatea (maximum 11.0 ± 0.7 m) faults. Along the NCD faults (south of the Hope fault), displacements were
generally smaller, commonly between 1.0 and 2.5 m, with the north Leader fault having the highest net slip
value (5.5 ± 0.5 m).
System‐wide, fault zone widths ranged fromGeochemistry, Geophysics, Geosystems 10.1029/2018GC007951
insets). On the whole, however, our calculations lead to a coherent picture of near‐surface fault plane atti-
tude and slip vector orientations for most of the studied faults.
We determined the fault plane and slip vector orientations for each of our 531 offset measurements
(Table S6). In typical fault kinematic studies, displacement may be difficult to determine, and all points
are typically assigned equal weight. For our analyses, we scaled our slip measurements in proportion to
the net slip, such that larger net displacement values are more represented than smaller ones. Generally,
our kinematic orientation measurements (summarized for each fault in Figure S3) reflect the broader defor-
mation patterns shown in Figure 4 and agree with broad‐scale field observations of deformation and uplift
(Clark et al., 2017; Kearse et al., 2018; Langridge et al., 2018; Litchfield et al., 2018; Nicol et al., 2018; Stirling
et al., 2017; Williams et al., 2018). Deviations from the overall fault plane attitudes and kinematics stem pri-
marily from local fault structural complexities, such as restraining or releasing bends and steps, which occur
at all observable length scales (≤100 to >10 km). In rare instances (e.g., the Corner Hill fault), the surface
displacement data were too noisy to robustly determine the fault kinematics using our approach. These
few instances (noted in Figure S3) have relatively few (Geochemistry, Geophysics, Geosystems 10.1029/2018GC007951
these faults was confirmed by helicopter field reconnaissance (Kearse et al., 2018) and is consistent with
long‐term slip patterns, indicated by uphill‐facing scarps preserved in the pre‐2016 geomorphology, as
observed in preearthquake stereo aerial photography, the LINZ 8‐m DEM (https://data.linz.govt.nz) and
postearthquake lidar. Interestingly, despite their positions near the top of the fastest‐rising mountain range
in northern South Island (Van Dissen & Yeats, 1991), slip along these two faults produced relative down-
dropping of a graben along the range crest (Figures 2 and Figure S1). Whereas gravitational spreading (as
sackungen) could explain the extensional behavior of these faults, it cannot explain the significant right‐
lateral motion accommodated by each of them nor their relation to the Jordan Thrust fault. Instead, we
invoke a model in which uplift of the Seaward Kaikōura Range is primarily controlled by thrusting and asso-
ciated range‐scale anticlinal folding (possibly along a blind ramp at the base of a fault propagation fold; Van
Dissen & Yeats, 1991). In accordance with this model, the Manakau and Upper Kowhai faults may act as
transtensional structures, accommodating extension along the crest of the fault propagation fold, while
simultaneously transferring right‐lateral strain northeastward from the Hope fault onto the Jordan
Thrust‐Kekerengu fault system.
Prior to the 2016 rupture, the Snowflake Spur fault was only subtly expressed in the topography, suggesting it
has a relatively slow slip rate. Geomorphic evidence for a preexisting structure includes colinear, possibly
right‐laterally offset ridges and bedrock channels visible in the 8‐m LINZ DEM. The dextral kinematics
and northeast‐southwest orientation of the fault are consistent with other nearby faults within the
Seaward Kaikōura Range, including the Manakau and Upper Kowhai faults that ruptured in 2016 and the
Fyffe and lower Kowhai faults that did not rupture (Rattenbury et al., 2006; Van Dissen & Yeats, 1991).
Right‐lateral slip along the Snowflake Spur fault averaged ~1.1 m and generally increased northeastward,
reaching a maximum of ~2.2 m near the southern end of the Manakau fault. The kinematics and orientation
of the Snowflake Spur fault suggest that it likely acts as part of the same system as nearby faults in the
Seaward Kaikōura Range, transferring slip from the Hope fault to the Jordan Thrust‐Kekerengu system.
The fact that the southwestern ~2 km of the Snowflake Spur fault follows the crest of a ridge line (the
Homestead Spur) suggests that the fault lies within the hangingwall of a deeper structure that is likely
responsible for uplift of the Seaward Kaikōura Range.
South of the Hope fault, uplift along the NCD faults generally correlates with topography (e.g., compare
Figure 1 with Figure 2). For example, the reverse‐sinistral Whites fault ruptured through a range of low
mountains north of Oaro, generating westside up movement and accommodating uplift of the highest sum-
mits of the range. The Whites fault does not appear to be the dominant fault within the area, however, as it
cuts across topography and does not consistently correspond with deflected streams or range fronts. The
Hundalee fault bounds the southern edge of these low mountains. Northside up uplift observed in 2016
along the Hundalee is therefore consistent with previous kinematics. Similar to the Whites fault, the
Stone Jug fault cuts through hilly or mountainous terrain, but the Stone Jug fault was evident in the 8‐m
LINZ DEM in some places as scarps and valleys. Loci of uplift to the southwest and east of the Stone Jug fault
correspond with preexisting topographic highs. Our correlations also captured fault‐related uplift and coseis-
mic folding in the Mt. Stewart area, west of the northern Leader fault and north of the eastern stretch of The
Humps fault (Figure 2). Uplift produced by faulting and folding in this area in 2016 is consistent with long‐
term uplift patterns expressed as high hills (Nicol et al., 2018; this study). Though we note that the topogra-
phy of the NCD is at least partially controlled by bedrock structure that predates the Neogene faulting we
investigate here (Nicol et al., 2018; Rattenbury et al., 2006), the uplift patterns resulting from the 2016 earth-
quake evince the influence of active faults in controlling the relief of this area. Thus, despite relatively slow
slip rates and long recurrence intervals along the NCD faults (Litchfield et al., 2018; Nicol et al., 2018), the
correspondence of the fault traces with the topographic features described above suggests that 2016 rupture
patterns were largely consistent with longer‐term patterns of tectonic and landscape deformation.
3.2. Consistency of Rupture Patterns With Long‐Term Kinematics: Implications
The close link between long‐term uplift patterns, as expressed in the pre‐2016 topography, and the coseismic
uplift pattern produced in the earthquake along most faults may help geologists better predict potential rup-
ture patterns in complex fault systems. Given that structural complexities along faults are thought to play a
significant role in controlling the start and end points of earthquake ruptures (e.g., Stirling et al., 1996;
Wesnousky, 1988; Wesnousky, 2006), the Kaikōura earthquake was surprising for its ~180‐km‐long,
ZINKE ET AL. 1618Geochemistry, Geophysics, Geosystems 10.1029/2018GC007951
continuous yet highly segmented rupture pattern. This was especially so in the NCD region, where the active
faults are more discontinuous, less well expressed in the geomorphology, exhibit lower slips rates, and are
considered less structurally mature than the major plate boundary faults to the northeast, such as the
Kekerengu fault (Kearse et al., 2018; Litchfield et al., 2018; Nicol et al., 2018). From a seismic hazard perspec-
tive, a single rupture linking all the broken faults in the 2016 earthquake would not have been expected prior
to the earthquake. Nevertheless, consistency between the long‐term and short‐term uplift patterns demon-
strates that faults in complex networks (such as those in the northern NCD) need not necessarily change
their kinematics in order to accommodate rupture propagation in a geometrically complex rupture.
Detailed characterization of the 2016 Kaikōura rupture is therefore of great importance to our mechanical
understanding of how faults slip, and consequently how ruptures can propagate (or not) through complex
fault networks over multiple earthquake cycles. These observations have fundamental implications for the
potential collective rupture of multisegmented faults and fault networks (e.g., Milliner et al., 2015), which
should therefore be considered in fault rupture scenarios.
A second observation of general importance for predicting future fault activity comes from the anomalous
motion of the Jordan Thrust and Papatea block during the 2016 earthquake. It is generally assumed that
although the relative components of fault movement (e.g., horizontal to vertical slip ratio) can vary slightly
from earthquake to earthquake, the overall kinematics of a fault remain roughly constant through time,
especially over geologically short time periods such as the Holocene. Such consistent behavior results in
the formation of offset landforms, the interpretation of which forms the basis for tectonic geomorphologic
analysis. However, the anomalous slip along the Jordan Thrust fault in the 2016 Kaikōura earthquake sug-
gests that in some cases, long‐term indicators of fault kinematics (e.g., topography) may not adequately pre-
dict the sense of slip in every future earthquake and that kinematic switches may occur without broad‐scale
tectonic reorganizations. Alternatively, evidence of past kinematic reversals identified in the geologic record
(e.g., sets of slickensides with different orientations, as in the 2014 MW 7.7 Balochistan, Pakistan earthquake,
Platt et al., 1988; Zinke et al., 2014) could suggest that a fault previously participated in complex ruptures.
Identification of such phenomena could therefore be of significance to seismic hazard assessment.
3.3. The Snowflake Spur Fault and Controls on Rupture Propagation
Prior to identification of the Snowflake Spur fault, the largest distance between surface rupture end points in
the 2016 earthquake was >~12 km, between the northern tip of the Whites fault and the southern tip of the
Upper Kowhai fault. With identification of the Snowflake Spur fault, this gap decreases to ~4.2 km. The lar-
gest gap in surface rupture extent then becomes ~4.5 km between the eastern tip of the Hundalee fault and
the southern tip of the Whites fault (this distance possibly decreases if offshore rupture of the Hundalee fault
is considered, Williams et al., 2018). Previously, discontinuous ground‐surface fault rupture was mapped
along the Fidget fault; however, rupture appears to be more continuous (at least in the shallow subsurface)
based on our north‐south correlation results (Figure 2 and Figure S1).
The distance between fault tips has a direct effect on the ability of a rupture to propagate or not between seg-
ments (e.g., Wesnousky, 2006). In the 2016 Kaikōura earthquake, continuous rupture propagation through a
complex system of upper plate faults was permitted by (1) rupture of deeper connecting structures such as
the subduction megathrust, or a shallowly dipping midcrustal detachment (e.g., Cesca et al., 2017;
Hamling et al., 2017; Hollingsworth et al., 2017; Litchfield et al., 2018); (2) stress transfer between the upper
plate faults themselves (e.g., Hamling et al., 2017; Nicol et al., 2018); or (3) some combination of these.
Although rupture propagation along a deeper structure is likely, our mapping of the surface rupture (includ-
ing rupture in the shallow subsurface, which may not be identifiable in field studies as discrete breaking of
the ground surface) substantially reduces the gap between the rupture end points of upper plate faults. This
may suggest that stress transfer between upper plate faults indeed played a prominent role in rupture pro-
pagation. For example, static stress modeling by Hamling et al. (2017) indicated that slip on the Humps
and Hundalee faults may have increased the Coulomb failure stress along the Upper Kowhai fault. It is unli-
kely, however, that static stress transfer between the Whites fault and the Snowflake Spur fault aided in rup-
ture propagation across the Hope fault: Although the Whites and Snowflake Spur faults are approximately
colinear, the Whites fault is sinistral and the Snowflake Spur fault is dextral. Such a configuration would not
be ideal for static stress triggering. Instead, rupture may have transferred across the Hope fault by dynamic
stress triggering, or through stress transfer along a deeper structure, such as the subduction interface.
ZINKE ET AL. 1619Geochemistry, Geophysics, Geosystems 10.1029/2018GC007951
3.4. Rupture Propagation Between Tectonic Domains
Using our displacement data, we tested whether the slip kinematics in the 2016 earthquake were fundamen-
tally different between the MFS and NCD and whether the complex fault movements in both the MFS and
NCD collectively accommodate net plate‐parallel motion. Specifically, we grouped our kinematic data into
faults from the MFS and NCD (Figure 4) and scaled our kinematic data values to account for the relative dif-
ferences in net slip associated with each measurement.
To a first order, our data show that patterns of strain accommodation within the MFS are simpler than in the
NCD (Figure 4). In the MFS, surface deformation is mostly oriented NE‐SW and accommodated on faults
that generally strike NE‐SW. A notable exception to this is the NW‐SE slip accommodated by the S‐SE
striking Papatea fault (Figure 4). In contrast, surface deformation patterns in the NCD are highly variable,
with 3‐D deformation vectors arrayed in a diversity of orientations. Here strain was accommodated through
faulting, folding, and block rotation. NCD faults cluster into two sets: (1) a NE‐SW striking set, which mostly
accommodated right‐lateral shear and (2) a NW‐SE set that accommodated left‐lateral shear (Figure S3).
These observations are consistent with those of Nicol et al. (2018), whose kinematic analysis of fault rupture
in the NCD was based primarily on field data.
Our kinematic analyses of offset measurements allowed us to more finely determine the surface slip patterns
expressed in each domain. Rose diagrams in Figure 4 show the scaled slip vector orientations for faults in the
northeastern MFS and southwestern NCD domains, as well as the plate motion vector (~260°; Beavan et al.,
2002; DeMets et al., 2010). In the MFS, the largest component of motion is oriented at ~250°, subparallel to
the plate motion direction. In contrast, slip vector orientations in the NCD are bimodal. Our kinematic
analyses indicate that the primary sense of shear across the NCD faults was oriented ~325° (see NCD rose
diagram in Figure 4). This motion was primarily accommodated by left‐lateral strike‐slip along the
NE‐SW to N‐S oriented structures (i.e., the Leader, Stone Jug, and Whites faults) and by thrusting along
the Hundalee fault. A secondary component of motion along the NCD faults was oriented at ~250°–260°,
almost perfectly parallel to the plate motion direction. This component of shear was primarily accommo-
dated by right‐lateral slip on the east to northeast oriented faults (i.e., The Humps and Conway‐Charwell
faults), excepting the Hundalee fault. These observations are again consistent with recent field studies
(Nicol et al., 2018; Williams et al., 2018). Together, the opposite kinematics of the (reverse‐dextral) northeast
oriented faults and (reverse‐sinistral) north‐northwest oriented faults, as well as the ~60° difference between
groups of slip vector orientations, indicate that the ruptured NCD faults behave as a conjugate fault system
accommodating transpression, with an overall slip direction of ~318°.
These results demonstrate that despite the different fault orientations within each domain, the ruptured
faults composed coherent networks in which kinematics were generally similar, corresponding with fault
orientation (e.g., east striking faults accommodated EW slip). In contrast, the overall patterns of slip were
fundamentally different between the two domains, reflecting the broader tectonic roles played by each.
Specifically, the MFS generally accommodates strike‐slip parallel to the Pacific‐Australian plate motion
direction, whereas the NCD is a complex transition zone between the primarily dextral faults to the north
and thrust faults to the south accommodating continental collision where the Hikurangi subduction margin
terminates against the buoyant Chatham rise (Figure 1). Despite the fundamentally different kinematics of
these domains, the 2016 rupture propagated from one to the other, resulting in substantially greater moment
release than would have occurred had the rupture been arrested within the NCD. Care should therefore be
taken when considering similar differences in tectonic domains as barriers to rupture propagation for the
purposes of seismic hazard assessment (a conclusion shared by Litchfield et al., 2018).
3.5. Implications for the Evolution of the Pacific‐Australian Plate Boundary in Northern South
Island, New Zealand
We also note the rupture of the Manakau, Upper Kowhai, and Snowflake Spur faults, as well as potential
future activity along other faults in the SKR, may represent at attempt by the plate boundary fault network
to geometrically simplify the transition between the Hope fault and Jordan Thrust‐Kekerengu fault system.
Specifically, ~23 mm/year of relative plate motion is transferred from the Hope fault onto the Jordan Thrust‐
Kekerengu fault system (Langrdige et al., 2003; Little et al., 2018; Van Dissen & Yeats, 1991). The Hope and
Jordan Thrust faults intersect at a high angle (~43°), forming a mechanically unfavorable kink across which
ZINKE ET AL. 1620Geochemistry, Geophysics, Geosystems 10.1029/2018GC007951
strain is transferred (Figure 1). Instead, the various faults of the SKR form a ~30° kink angle between the
Hope fault and faults of the SKR (west of the Jordan Thrust), making this zone of strain transfer mechani-
cally more favorable. Transfer of strain through the SKR (and away from the mechanically unfavorable
Hope‐Jordan intersection) via rupture of faults such as the Manakau, Upper Kowhai, and Snowflake Spur
may represent an indication of a longer‐term tectonic progression toward simplifying the geometry of the
plate boundary in this area.
3.6. Off‐Fault Deformation: Analysis
We assessed the degree to which surface deformation along the Kekerengu fault is localized within a narrow,
high‐strain fault core, or expressed as distributed, OFD. To do so, we compared our correlation‐derived mea-
surements of fault offset (which capture the total surface displacement across a fault) to field measurements
of fault slip (which capture deformation across various fault‐perpendicular apertures).
Our analyses focus on the Kekerengu fault, for which many well‐documented field measurements are avail-
able (Kearse et al., 2018) and along which our image correlations provided consistently dense coverage along
the Kekerengu fault. To ensure the highest accuracy possible in calculating OFD, we collected correlation‐
derived offset measurements and fault zone width measurements at 200‐m intervals (Tables S4–S5 and Data
Sets S4–S5). The detailed field measurements provided in the Kearse et al. (2018) data set consist of 99 well‐
documented offsets along the Tinline Downs, Kekerengu, Heaver's Creek, Jordan Thrust, and Upper
Kowhai faults. Their measurements are based on various geomorphic and manmade features, such as fence
lines, roads, paleoseismic trench margins, tree roots, and fluvial channels. Some of their measurements were
unprojected or projected into the fault trace over only a very short (Geochemistry, Geophysics, Geosystems 10.1029/2018GC007951
Figure 5. (a–c) Comparison of fault‐parallel slip profiles along the Kekerengu fault. Black lines and gray fields are our
correlation measurements (200‐m spacing), shown by distance from Kekerengu‐Papatea fault junction. Dark blue lines
show where the Kekerengu fault overlaps with the Jordan Thrust (JT) and Tinline Downs (TD) faults. Pale blue dots are
main fault field measurements from Kearse et al. (2018), binned at 200‐m intervals: (a) all field measurements, (b) discrete
field measurements, and (c) projected field measurements. (d) Blue dots are OFD% for projected field measurements
(unbinned) versus distance across, which they are projected. Gray dashed line shows interpreted decrease in OFD% with
increasing projection distance. (e) Blue dots are OFD% for discrete‐only field measurements versus local slope angle; gray
line shows linear regression (slope m = 0.94; Spearman rank coefficient ρS = 0.52).
represent local maxima in surface slip that are smoothed over in our correlation measurements by both the
32 × 32 pixel correlation window size and the 200 m along strike stacking length of our correlation
measurement profiles (Milliner et al., 2015; Zinke et al., 2014). At either end of the slip profile (Figure 5),
however, the Kekerengu fault is overlapped by the Jordan Thrust and Tinline Downs faults. Therefore, in
measuring offsets from our correlation maps, every attempt was made to capture slip across only the
Kekerengu fault, without influence from the neighboring faults (i.e., the Jordan Thrust and Tinline
Downs faults). Because of the proximity of these faults (typicallyGeochemistry, Geophysics, Geosystems 10.1029/2018GC007951
each projected measurement versus the fault‐perpendicular width over which it was projected (Figure 5d),
two key observations emerge. First, the data show an overall negative trend toward 0% OFD with increasing
projection distance, implying that field measurements projected across increasingly large fault‐
perpendicular distances will eventually capture the full amount of surface displacement. While this
observation is intuitive and serves as the basis for comparing field measurements with image correlation
measurements, it is worth pointing out that in general, the percentage of missing deformation decreases
rapidly as the projection width increases (over meters to tens of meters). Second, the scatter in the data sug-
gest that the distribution of OFD is not uniform along the Kekerengu fault. For instance, field measurements
projected across apertures ofGeochemistry, Geophysics, Geosystems 10.1029/2018GC007951
materials (e.g., bedrock), whereas low‐relief areas commonly correspond to basins in which weaker sedi-
mentary deposits accumulate. If such a relationship holds at the scale of our individual measurements, aver-
aged over 200‐m swaths along the Kekerengu fault, we might expect higher‐relief areas to correspond to
lower amounts of OFD.
To distinguish between these competing hypotheses, we computed the local slope (median slope value from
the LINZ DEM within a 200‐m radius; the same distance over which we stacked our correlation measure-
ment profiles) to which we compared the OFD% values for the discrete‐only measurements (Figure 5e).
We only considered the set of discrete field measurements, because the projected field measurements cap-
ture various amounts of OFD. As shown in Figure 5, we found a weak positive correlation (Spearman rank
coefficient = 0.52) between OFD% with increasing topographic slope, suggesting that OFD% is greater in
steeper areas.
Alternatively, increased OFD in high relief regions along the Kekerengu fault may simply result from
instances of high structural complexity (especially restraining bends) along the fault. Some of the largest
values of OFD% occur along the central portion of the Kekerengu fault, northeast of the Clarence River,
where several prominent restraining bends are likely responsible for uplift of steep local topographic fea-
tures, including Mole Hill (42°1.7′S, 173°55.8′E) and Misty Hill (42°0.5′S, 173°56.0′E). If increases in
OFD% with slope along the Kekerengu fault are ultimately related to uplift and broadening of the fault zone
at restraining bends, these data contribute to an increasing body of knowledge documenting the distribution
surface deformation with fault structural complexities (e.g., Milliner et al., 2015; Van Dissen et al., 2015). Our
results, along with other comparisons of field measurements against remotely sensed data, show that OFD
not only is ubiquitous among surface ruptures but also can constitute a substantial portion of total surface
deformation (e.g., Dolan & Haravitch, 2014; Milliner et al., 2015; Milliner, Dolan, et al., 2016; Zinke et al.,
2014). These observations have significant implications for interpreting differences between geologic slip
rates and geodetic slip deficit rates (i.e., geodetic slip rates), as well as for the use of empirical scaling laws
between surface slip and earthquake magnitude, and the development of potential earthquake microzona-
tion maps for the built environment.
In some locations, studies have reported significant differences between geologic estimates of fault slip rates,
and geodetically inferred slip deficit rates (e.g., the Garlock fault, Dolan et al., 2016; Ganev et al., 2012;
Peltzer et al., 2001; eastern California shear zone, Meade & Hager, 2005; Oskin et al., 2008; Doruneh fault,
Farbod et al., 2016; Walpersdorf et al., 2014; Wasatch fault, Friedrich et al., 2003). In some cases, such as
the eastern California shear zone, geodetic slip deficit rates exceed geologic slip rates, leading some workers
to conclude that those faults are undergoing transiently elevated rates of strain accumulation (e.g., Dolan
et al., 2007; Kozacı et al., 2009; Oskin et al., 2008; Peltzer et al., 2001). However, if OFD is considered in deter-
mining fault slip rates (whether by direct measurement of near‐field warping or by estimating OFD% based
on empirical studies, e.g., Kearse et al., 2018), such differences may narrow considerably (e.g., Dolan &
Haravitch, 2014; Milliner, Dolan, et al., 2016; Shelef & Oskin, 2010). Properly accounting for OFD is there-
fore important for determining the roles of faults in accommodating crustal deformation (e.g., in Tibet,
Tapponier & Molnar, 1976) and characterizing the mechanics of lithospheric rheology based on comparisons
of fault slip rates to geodetically inferred slip deficit rates (Dolan & Meade, 2017; Meade et al., 2013, and
references therein). Furthermore, Quaternary fault slip rates provide an important input for Probabilistic
Seismic Hazard Assessment (e.g., Field et al., 2017; Stirling et al., 2012), and underestimating slip rate
may cause the seismic hazard posed by a fault to be underrepresented.
Consideration of OFD is also important when using empirically derived scaling laws that relate mean or
maximum surface slip to earthquake magnitude (Milliner, Dolan, et al., 2016; Stirling et al., 2012, 2013;
Wells & Coppersmith, 1994; Wesnousky, 2008). For instance, if slip in the most recent earthquake on a fault
is known from a distribution of offset geomorphic features, the moment magnitude expected for that amount
of offset based on empirical scaling laws will vary depending upon whether the offset features are projected
over larger fault‐perpendicular widths or smaller ones (i.e., as the field measurements encompass more or
less OFD), resulting in ambiguity and potential error in estimates of magnitude and expected displacements
in future earthquakes (Milliner, Dolan, et al., 2016). Alternatively, if OFD is not considered in predicting sur-
face slip for a given expected earthquake magnitude, then the empirical scaling laws may overpredict
mean slip.
ZINKE ET AL. 1624Geochemistry, Geophysics, Geosystems 10.1029/2018GC007951
Application of high‐resolution surface displacement data such as those presented above to next‐generation
seismic hazard mitigation strategies requires a thorough understanding of the factors controlling OFD. This
will require not only additional high‐resolution analyses of surface deformation patterns (such as those
presented above) but also detailed mapping and geotechnical characterization of the distribution and
mechanical properties of the near‐surface materials specific to each fault zone. Comprehensive data sets
collected in a variety of geologic settings will facilitate the detailed assessment of possible causes and effects
of distributed versus discrete deformation patterns in future earthquakes. In turn, these analyses will help to
facilitate predictive studies that can assist planners in establishing site‐specific guidelines of likely ground‐
surface deformation patterns in future earthquakes.
4. Conclusions
We used an advanced workflow for optical image correlation of high‐resolution WorldView satellite stereo
imagery to determine the 3‐D surface deformation generated during the 2016 Kaikōura earthquake. The
resulting deformation maps revealed the spatial and kinematic complexity of the 2016 earthquake in unpre-
cedented detail. We identified a previously unrecognized fault, the Snowflake Spur fault, that acts as a con-
tinuation of the Upper Kowhai and Manakau faults and may have aided in rupture propagation. These
faults, together with other, unruptured faults of the Seaward Kaikōura Range, may represent an attempt
by the plate boundary fault system to geometrically simplify the transition between the Hope fault and
the Jordan Thrust‐Kekerengu fault system. From our correlations, we collected 531 measurements of displa-
cement across 19 faults. Our measurements revealed a high degree of spatial variability in surface slip, with
generally smaller displacements in the NCD, and larger displacements in the MFS. Kinematic analysis of our
displacement measurements showed that overall slip patterns in the NCD fundamentally differed from
those in the MFS: faults in the MFS accommodated motion that is primarily subparallel, though slightly
rotated from, the plate motion direction; faults in the NCD, in contrast, accommodated motion that was pri-
marily subperpendicular (and secondarily parallel) to the plate motion direction. These observations demon-
strate that although fault kinematics may be grossly consistent within a tectonic domain, fault ruptures may
cross between tectonic domains with fundamentally different overall kinematic characteristics. Future seis-
mic hazard assessment strategies should include such scenarios. The kinematics of individual faults rup-
tured in the 2016 rupture were generally consistent with their long‐term fault kinematics, as indicated by
the topographic expression of the faults. The most notable exception to this was normal‐dextral coseismic
slip on the Jordan Thrust fault, which typically acts as a reverse‐dextral fault, accommodating uplift of the
Acknowledgments Seaward Kaikōura Range (Van Dissen & Yeats, 1991).
We especially thank Jesse Kearse
(Victoria University of Wellington) for Comparison of our displacement measurements along the Kekerengu fault with published field measure-
his assistance with field measurements ments revealed up to ~36% of surface deformation is accommodated as OFD. The amount of OFD not
and observations; Sebastien Leprince,
whose assistance with implementing
captured by field measurements, however, decreases nonlinearly as the fault‐perpendicular distance over
the 3‐D ray tracing methodology was which the field measurements are projected increases, and most OFD is accommodated within ~100 m of
instrumental; and Francois Ayoub for the primary fault. More high‐resolution surface deformation studies such as that presented above, and
assistance with outlier removal. Thanks
to Paul Morin and Mike Cloutier (UMN
detailed geotechnical characterization of the fault zone materials, are necessary to determine what factors
Polar Geospatial Center) for their assis- control the magnitude and distribution of OFD on faults generally.
tance acquiring WorldView imagery
and Oleg Alexandrov and Scott
McMichael (NASA Ames Research
Center) for help with image processing
References
with Ames Stereo Pipeline. This work Avouac, J.‐P., Ayoub, F., Wei, S. J., Ampuero, J.‐P., Meng, L. S., Leprince, S., et al. (2014). The 2013, MW 7.7 Balochistan earthquake,
was funded by U.S. National Science energetic strike slip reactivation of a thrust fault. Earth and Planetary Science Letters, 391, 128–134. https://doi.org/10.1016/j.
Foundation grant EAR‐1321914 epsl.2014.01.036
(Dolan), with financial support from Avouac, J.‐P., & Leprince, S. (2015). Geodetic imaging using optical systems. In G. Schubert (Ed.), Treatise on Geophysics (pp. 387–424).
research grants by INSU Tellus, and Oxford: Elsevier.
INSU PNTS, and the Harry von Zell Ayoub, F., Leprince, L., & Avouac, J.‐P. (2015). User's guide to COSI‐Corr: Co‐registration of optically sensed images and correlation,
USC Geophysics Research Fund. The California Institute of Technology. Retrieved from http://www.tectonics.caltech.edu/slip_history/spot_coseis/pdf_files/CosiCorr‐
8‐m DEM was available through Land Guide2015a.pdf
Information New Zealand (https:// Ayoub, F., Leprince, S., & Avouac, J.‐P. (2009). Co‐registration and correlation of aerial photographs for ground deformation measure-
www.linz.govt.nz). Thanks to Stephane ments. ISPRS Journal of Photogrammetry and Remote Sensing, 64(6), 551–560.
Dominguez and an anonymous Bai, Y., Lay, T., Cheung, K. F., & Ye, L. (2017). Two regions of seafloor deformation generated the tsunami for the 13 November 2016,
reviewer for their helpful reviews. All Kaikōura, New Zealand, earthquake. Geophysical Research Letters, 44, 6597–6606. https://doi.org/10.1002/2017GL073717
data used can be found in the support- Barnes, P. M., de Lépinay, B. M., Collot, J.‐Y., Delteil, J., & Audru, J.‐C. (1998). Strain partitioning in the transition area between oblique
ing information. subduction and continental collision, Hikurangi margin, New Zealand. Tectonics, 17(4), 534–557. https://doi.org/10.1029/98TC00974
ZINKE ET AL. 1625You can also read


