Halo Screening Level Risk Assessment Package
←
→
Page content transcription
If your browser does not render page correctly, please read the page content below
Office of National Marine Sanctuaries
Office of Response and Restoration

       Screening Level Risk Assessment Package
                                        Halo

                                               March 2013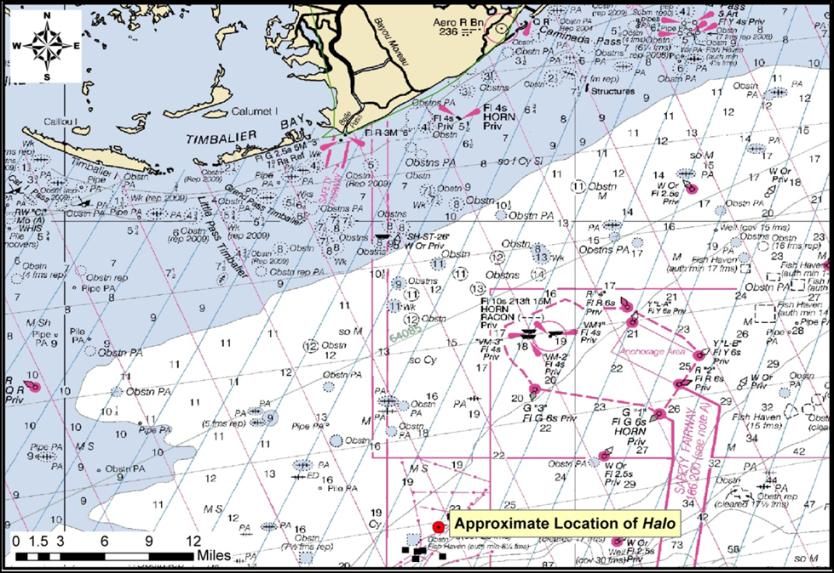
National Oceanic and
Atmospheric Administration

Office of National Marine Sanctuaries
Daniel J. Basta, Director
Lisa Symons
John Wagner

Office of Response and Restoration
Dave Westerholm, Director
Debbie Payton
Doug Helton

Photo: Photograph of Halo
Source: http://www.uboat.net/allies/merchants/ships/1679.html
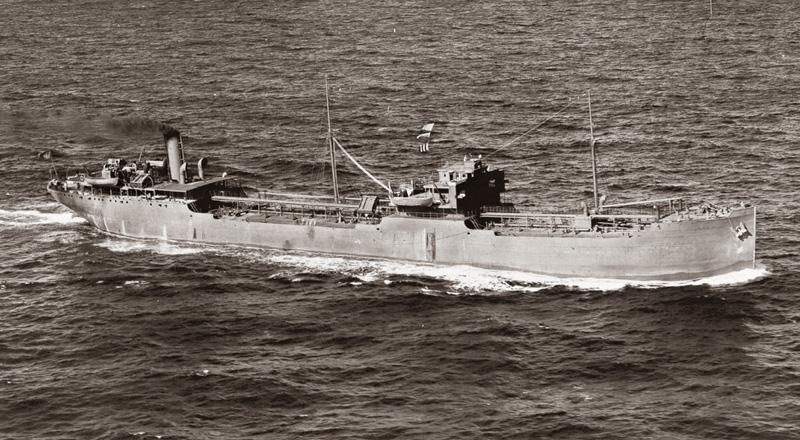
Table of Contents
Project Background .......................................................................................................................................ii

Executive Summary ......................................................................................................................................1

Section 1: Vessel Background Information: Remediation of Underwater Legacy
        Environmental Threats (RULET).....................................................................................................2
  Vessel Particulars .........................................................................................................................................2
  Casualty Information.....................................................................................................................................3
  Wreck Location .............................................................................................................................................4
  Casualty Narrative ........................................................................................................................................4
  General Notes ..............................................................................................................................................5
  Wreck Condition/Salvage History ................................................................................................................5
  Archaeological Assessment .........................................................................................................................6
  Assessment ..................................................................................................................................................6
  Background Information References ............................................................................................................7
  Vessel Risk Factors ......................................................................................................................................8

Section 2: Environmental Impact Modeling ...............................................................................................14
  Release Scenarios Used in the Modeling ...................................................................................................14
  Oil Type for Release ...................................................................................................................................16
  Oil Thickness Thresholds ............................................................................................................................16
  Potential Impacts to the Water Column .......................................................................................................17
  Potential Water Surface Slick ......................................................................................................................18
  Potential Shoreline Impacts.........................................................................................................................20

Section 3: Ecological Resources At Risk ..................................................................................................21
  Ecological Risk Factors ...............................................................................................................................24

Section 4: Socio-Economic Resources At Risk ........................................................................................30
 Socio-Economic Risk Factors .....................................................................................................................33

Section 5: Overall Risk Assessment and Recommendations for Assessment,
        Monitoring, or Remediation ..........................................................................................................38

                                                                                      i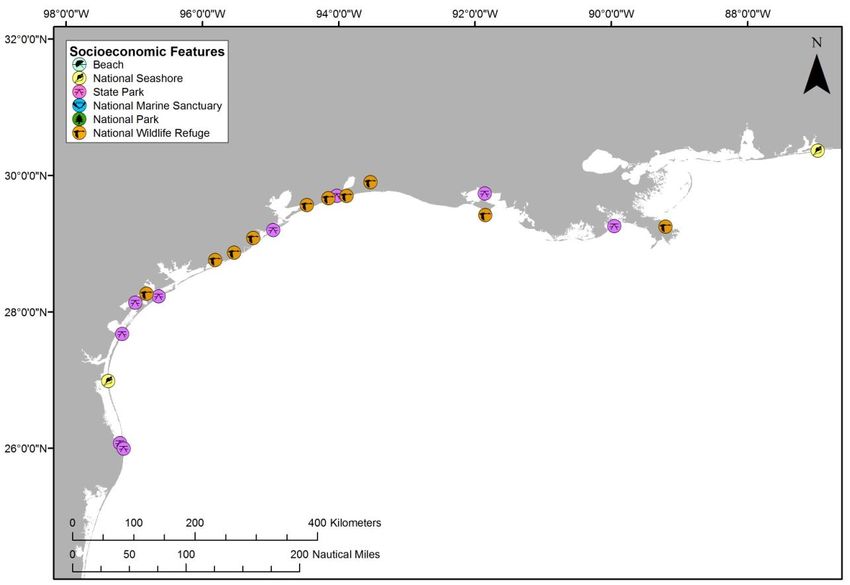
Project Background
The past century of commerce and warfare has left a legacy of thousands of sunken vessels along the U.S.
coast. Many of these wrecks pose environmental threats because of the hazardous nature of their cargoes,
presence of munitions, or bunker fuel oils left onboard. As these wrecks corrode and decay, they may
release oil or hazardous materials. Although a few vessels, such as USS Arizona in Hawaii, are well-
publicized environmental threats, most wrecks, unless they pose an immediate pollution threat or impede
navigation, are left alone and are largely forgotten until they begin to leak.

In order to narrow down the potential sites for inclusion into regional and area contingency plans, in
2010, Congress appropriated $1 million to identify the most ecologically and economically significant
potentially polluting wrecks in U.S. waters. This project supports the U.S. Coast Guard and the Regional
Response Teams as well as NOAA in prioritizing threats to coastal resources while at the same time
assessing the historical and cultural significance of these nonrenewable cultural resources.

The potential polluting shipwrecks were identified through searching a broad variety of historical sources.
NOAA then worked with Research Planning, Inc., RPS ASA, and Environmental Research Consulting to
conduct the modeling forecasts, and the ecological and environmental resources at risk assessments.

Initial evaluations of shipwrecks located within American waters found that approximately 600-1,000
wrecks could pose a substantial pollution threat based on their age, type and size. This includes vessels
sunk after 1891 (when vessels began being converted to use oil as fuel), vessels built of steel or other
durable material (wooden vessels have likely deteriorated), cargo vessels over 1,000 gross tons (smaller
vessels would have limited cargo or bunker capacity), and any tank vessel.

Additional ongoing research has revealed that 87 wrecks pose a potential pollution threat due to the
violent nature in which some ships sank and the structural reduction and demolition of those that were
navigational hazards. To further screen and prioritize these vessels, risk factors and scores have been
applied to elements such as the amount of oil that could be on board and the potential ecological or
environmental impact.

                                                     ii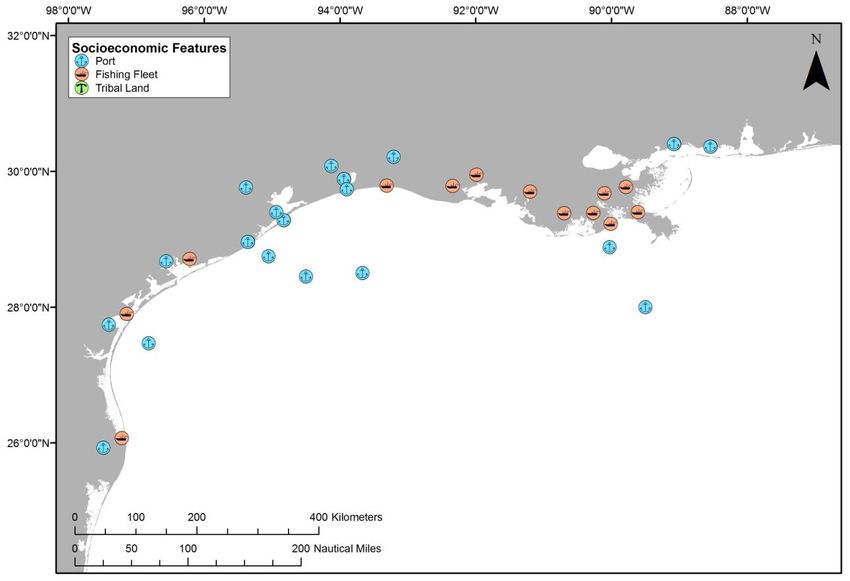
Executive Summary: Halo
The tanker Halo, torpedoed and sunk
during World War II off the coast of
Louisiana in 1942, was identified as a
potential pollution threat, thus a screening-
level risk assessment was conducted. The
different sections of this document
summarize what is known about the Halo,
the results of environmental impact
modeling composed of different release
scenarios, the ecological and socio-
economic resources that would be at risk in
the event of releases, the screening-level
risk scoring results and overall risk
assessment, and recommendations for
assessment, monitoring, or remediation.
                                                                         Vessel Risk Factors                           Risk Score
Based on this screening-level assessment, each                               A1: Oil Volume (total bbl)
vessel was assigned a summary score calculated                               A2: Oil Type
using the seven risk criteria described in this            Pollution
                                                                             B: Wreck Clearance
report. For the Worst Case Discharge, Halo scores          Potential         C1: Burning of the Ship                      Med
                                                           Factors
High with 15 points; for the Most Probable                                   C2: Oil on Water
Discharge (10% of the Worse Case volume), Halo                               D1: Nature of Casualty

scores Medium with 14 points. Given these scores,                            D2: Structural Breakup
                                                           Archaeological
and higher level of data certainty, NOAA                   Assessment
                                                                             Archaeological Assessment                 Not Scored
recommends that this vessel could be investigated                            Wreck Orientation
as a source, and be considered for further                                   Depth
assessment to determine the vessel condition,                                Confirmation of Site Condition
amount of oil onboard, and feasibility of oil              Operational
                                                                                                                       Not Scored
                                                           Factors           Other Hazardous Materials
removal action. The first step would be to contact
                                                                             Munitions Onboard
archaeologists at BOEM/BSEE for more
                                                                             Gravesite (Civilian/Military)
information based on their surveys of the site. At a
                                                                             Historical Protection Eligibility
minimum, an active monitoring program should be
                                                                                                                 WCD       MP (10%)
implemented. Also, this site should be reflected
                                                                             3A: Water Column Resources          Med            Med
within the Area Contingency Plans so that if a             Ecological
                                                                             3B: Water Surface Resources         High           Med
                                                           Resources
mystery spill is reported in the general area.                               3C: Shore Resources                 Med            Med
Outreach efforts with the technical and recreational                         4A: Water Column Resources          Low            Low
                                                           Socio-
dive community as well as commercial and                   Economic          4B: Water Surface Resources         High           High
recreational fishermen who frequent the area               Resources
                                                                             4C: Shore Resources                 Med            Med
would be helpful to gain awareness of changes in           Summary Risk Scores                                    15            14
the site.
                                                       The determination of each risk factor is explained in the document.
                                                       This summary table is found on page 39.

                                                       1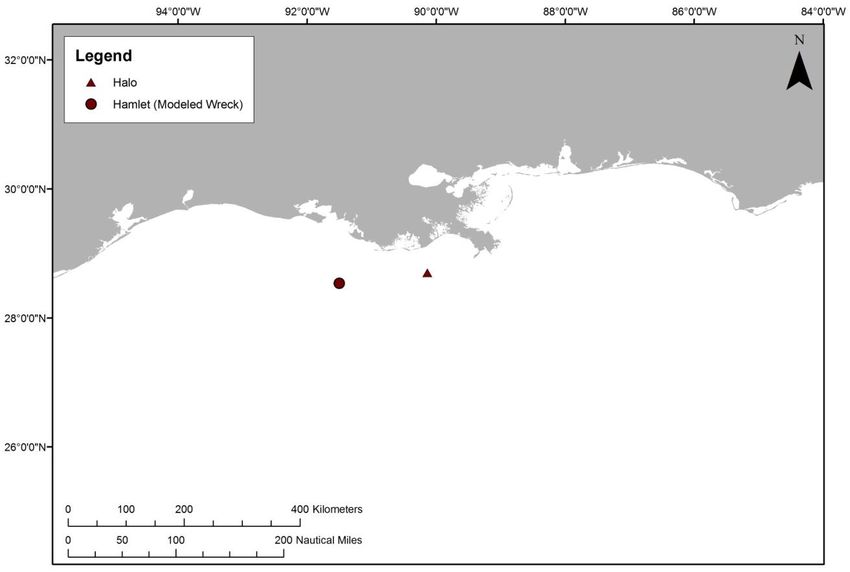
Section 1: Vessel Background Information: Remediation of Underwater Legacy Environmental Threats (RULET)

  SECTION 1: VESSEL BACKGROUND INFORMATION: REMEDIATION OF
        UNDERWATER LEGACY ENVIRONMENTAL THREATS (RULET)

Vessel Particulars

Official Name: Halo

Official Number: 220521

Vessel Type: Tanker

Vessel Class: 7,000 gross ton (10,700
dwt) class tanker

Former Names: N/A

Year Built: 1920

Builder: Bethlehem Steel Company, Alameda, CA

Builder’s Hull Number: 5269A

Flag: American

Owner at Loss: Cities Service Oil Company

Controlled by: Unknown                                                            Chartered to: Unknown

Operated by: Unknown

Homeport: New York, NY

Length: 435 feet                              Beam: 56 feet                                  Depth: 33 feet

Gross Tonnage: 6,986                                                                   Net Tonnage: 4,301

Hull Material: Steel                    Hull Fastenings: Riveted              Powered by: Oil-fired steam

Bunker Type: Heavy Fuel Oil (Bunker C)                                      Bunker Capacity (bbl): 6,734

Average Bunker Consumption (bbl) per 24 hours: 222

Liquid Cargo Capacity (bbl): 75,000                                        Dry Cargo Capacity: Unknown

Tank or Hold Description: Vessel had nine cargo tanks divided port and starboard by an oil-tight
longitudinal bulkhead

                                                     2
Section 1: Vessel Background Information: Remediation of Underwater Legacy Environmental Threats (RULET)
Casualty Information
Port Departed: Galveston, TX Destination Port: New Orleans, LA
Date Departed: May 18, 1942 Date Lost: May 20, 1942
Number of Days Sailing: ≈ 3 Cause of Sinking: Act of War (Torpedoes)
Latitude (DD): 28.70024 Longitude (DD): -90.1334
Nautical Miles to Shore: 24 Nautical Miles to NMS: 212
Nautical Miles to MPA: 0 Nautical Miles to Fisheries: Unknown
Approximate Water Depth (Ft): 500 Bottom Type: Unknown
Is There a Wreck at This Location? The listed coordinates are probably not correct but BOEM should
have accurate coordinates for this shipwreck
Wreck Orientation: Resting on an even keel
Vessel Armament: None
Cargo Carried when Lost: 64,103 bbl of crude oil
Cargo Oil Carried (bbl): 64,103 Cargo Oil Type: Unknown Type of Crude
Probable Fuel Oil Remaining (bbl): Unknown ≤6,500 Fuel Type: Heavy Fuel Oil (Bunker C)
Total Oil Carried (bbl): ≤ 69,603 Dangerous Cargo or Munitions: No
Munitions Carried: None
Demolished after Sinking: No Salvaged: No
Cargo Lost: Yes, partially Reportedly Leaking: No
Historically Significant: Yes Gravesite: Yes
Salvage Owner: Not known if any
3Section 1: Vessel Background Information: Remediation of Underwater Legacy Environmental Threats (RULET)
Wreck Location
Chart Number: 11340
Casualty Narrative
"At 07.58 hours on 20 May 1942, the unescorted and unarmed Halo (Master Ulrich Fred Moller) was hit
by two torpedoes from U-506 about 50 miles from the Southwest Pass of the Mississippi River, while
proceeding on a rapidly changing zigzag pattern at 10.4 knots. The first torpedo struck on the starboard
side under the bridge and completely destroyed this part of the ship. The second hit aft of the bridge but
forward of the engine room. The second explosion broke the ship in two and ignited the cargo. The tanker
plunged bow first with her propeller still turning and sank within three minutes, 23 men of the crew of
eight officers and 34 men managed to leave the ship, but only one raft was left, the four lifeboats and
three other rafts were destroyed by the explosions and fire. The survivors huddled together clinging to
wreckage in the water near the sunken ship throughout the night and the next day. The oil on the surface
burned for six hours. Two men [clung] to a half-burned raft and stayed on it for seven days without food
or water. They were then picked up by Otina and taken to New Orleans.
The other survivors in the water began dying from exposure and injuries. On the third day wreckage
ascended from the tanker and the seven remaining survivors tied boards together with strips of canvas
torn from their life preservers. Crude oil also floated free forming a layer four inches thick. Five days
after the sinking, the Oaxaca picked up the three remaining survivors, but one of these men died at sea.
4Section 1: Vessel Background Information: Remediation of Underwater Legacy Environmental Threats (RULET)
The two men arrived at a hospital in Tampico on 28 May, but one man died 30 minutes after arriving.
Thus, only one officer and two crewmen survived the sinking."
-http://www.uboat.net:8080/allies/merchants/ships/1679.html
Under Ulrich Fred Moller, the Halo sailed from Tampico, Mexico to New Orleans via Galveston, TX. 50
miles from the Southwest Pass of the Mississippi River U-506 (Wurdermann) torpedoed the ship on the
starboard side under the bridge. A second torpedo hit the starboard side aft of the bridge but forward of
the engine room. This tore the ship apart, ignited the cargo, and sent the ship bow first with the propeller
still turning into the water. Three days after the ship went down, wreckage ascended from the wreck
underwater. Crude oil floated on the surface forming a layer four inches thick. 39 were lost.
- B.M. Browing Jr., "U.S. Merchant Vessel War Casualties of World War II", (Naval Institute Press,
1996), 113.
-C. Hocking, "Dictionary of Disasters at Sea During the Age of Steam: Including sailing ships and ships
of war lost in action 1824-1962" (Lloyd's Register of Shipping, 1969), 296.
Sunk by U-506. The first torpedo hit on the starboard side under the bridge and destroyed that part of the
ship. A second torpedo hit ten seconds later on the starboard side aft of the bridge. The engines were
running as the ship nosed towards the bottom, within three minutes of the first attack. The fire burned for
six hours. After a portion of the ship ascended three days after the sinking, crude oil began to come to the
surface and form a four inch layer of a huge oil slick. It took the ship an hour and half to sink, and the "oil
burned on the surface for some time".
---- M. Wiggins "Torpedoes in the Gulf: Galveston and the U-Boats 1942-1943" Texas A&M University
Press, College Station (1995), 46, 77-78.
General Notes
AWOIS Data:
DESCRIPTION
24 NO.816; TANKER, 6986 GT; SUNK 5/20/42 BY SUBM., POSITION ACCURACY 1-3 MILES 61
5/20/42.
SURVEY REQUIREMENTS
INFORMATION
20 TKR, 6986 TONS; TORPEDOED MAY 20, 1942, IN 140 FT.
Wreck Condition/Salvage History
"In 2000, a shipwreck, tentatively identified as Halo, was discovered during a pipeline survey for the oil
industry (Church, 2000). From July 30 to August 1, 2004, the Deep Wrecks science team deployed an
ROV to investigate the site. The vessel's bow is embedded deeper in the seafloor than the stern. The
forecastle's upper region stands only 3.0 m above the ambient seafloor as opposed to the stern, which has
7.3 m of relief. Only half of the bow's windlass can be seen protruding from the sediment. The forward
mast still stands and the top of the mast is approximately 16.5 m above the ambient seafloor. The vessel's
superstructure and the engine is visible through the rear structure. Only portions of Halo's deck remains
were documented because of safety concerns raised by low visibility and potential entanglement. Some
brown rusticles, which are formed by microbes, were observed on the structure. Examples of the
invertebrates documented at the site include sea urchins (Eucidaris tribuloides and two Echinothrix sp.),
5Section 1: Vessel Background Information: Remediation of Underwater Legacy Environmental Threats (RULET)
mollusks (Chama sp., Siratus beauii, and Buccinidae), crustaceans (hermit crabs, possibly Dardanus
insignius), and scleractinian (Madracis myriaster and Pourtalosmilia conferta) and gorgonian
(Placogorgia rudis, Thesea sp. Cf. T. grandiflora, Thesa sp. Cf. T. rubra, and Thesea sp.) corals.
Anthiinae basses--yellowfin bass (Anthias nicholsi), red barbier (Hemathias vivanus), roughtongue bass
(Pronotogrammus martinicensis), Warsaw grouper (Epinephelus nigritus), and yellowedge grouper
(Epinephelus flavolimbatus)--were the most observed fish species. Examples of other reef-associated fish
include vermilion snapper (Rhomboplites aurorubens), greater amberjack (Seriola dumerili), blacktail
moray (Gymnothorax kolpos), red porgy (Pagrus pagrus), deepwater scorpionfish (Setarches guenther),
batfishes (Ogcocephalus sp.), and a single silvery John Dory (Zenopsis conchifera)."
-http://www.tos.org/oceanography/issues/issue_archive/issue_pdfs/22_2/22.2_church.pdf
Archaeological Assessment
The archaeological assessment provides additional primary source based documentation about the sinking
of vessels. It also provides condition-based archaeological assessment of the wrecks when possible. It
does not provide a risk-based score or definitively assess the pollution risk or lack thereof from these
vessels, but includes additional information that could not be condensed into database form.
Where the current condition of a shipwreck is not known, data from other archaeological studies of
similar types of shipwrecks provide the means for brief explanations of what the shipwreck might look
like and specifically, whether it is thought there is sufficient structural integrity to retain oil. This is more
subjective than the Pollution Potential Tree and computer-generated resource at risk models, and as such
provides an additional viewpoint to examine risk assessments and assess the threat posed by these
shipwrecks. It also addresses questions of historical significance and the relevant historic preservation
laws and regulations that will govern on-site assessments.
In some cases where little additional historic information has been uncovered about the loss of a vessel,
archaeological assessments cannot be made with any degree of certainty and were not prepared. For
vessels with full archaeological assessments, NOAA archaeologists and contracted archivists have taken
photographs of primary source documents from the National Archives that can be made available for
future research or on-site activities.
Assessment
The tanker Halo was sunk by German Submarine U-506 off the coast of Louisiana on May 20, 1942. At
the time of its loss, the tanker was carrying 63,000 bbl of crude oil and had a bunker capacity of 6,734 bbl
of Bunker C fuel oil. As the ship travelled from Galveston, Texas destined for New Orleans, two
torpedoes struck the tanker while it was off the coast of Louisiana. According to survivor statements, the
first torpedo struck on the starboard side under the bridge and “blew that part of the ship to bits.” Ten
seconds later, another torpedo struck the starboard side forward of the engine room (Fig. 1-1) and “tore
the ship apart.” Oil was sprayed across the deck of the tanker making it very slick and nearly impossible
to walk on. Soon after being torpedoed, the tanker sank bow first with the propeller still turning and
burning oil marked the site of the attack for another six hours.
6Section 1: Vessel Background Information: Remediation of Underwater Legacy Environmental Threats (RULET)
Figure 1-1: U.S. Coast Guard diagram of the location of torpedo impacts on Halo (Image courtesy of National
Archives, Washington, DC).
Three days after the attack, the survivors remained floating over the site and witnessed debris and oil
begin to float up from the wreck. They reported that the crude oil formed a film four inches thick on the
surface of the water. On May 25, five days after the attack, three survivors were rescued by the Mexican
cargo ship Oaxaca. The master of this vessel reported that the oil slick from Halo was visible for ten
miles from the bridge of his ship. Unfortunately, two of the men that were recovered passed away and
only two more survivors were rescued on May 27, leaving only three survivors out of the tanker’s entire
crew.
Based on the damage caused by the torpedoes and the report of oil coming to the surface after the ship
sank, it is likely that many of the cargo tanks were damaged or breached by the torpedo blasts and may no
longer contain oil. Today, the tanker is also in approximately 500 feet of water and rests on an even keel,
which is an orientation that often leads to the loss of oil from vents and piping long before loss of
structural integrity of hull plates from corrosion or other physical impacts.
Because NOAA archaeologists have never examined the site, we cannot provide additional condition
based assessments of the wreck, but archaeologists with the Bureau of Ocean Energy Management
(BOEM), Bureau of Safety and Environmental Enforcement (BSEE), and C & C Technologies, Inc. have
visited the site and can provide additional information to the U.S. Coast Guard if necessary. If the U.S.
Coast Guard decides to assess the wreck, it should first contact the archaeologists with BOEM and BSEE
for more information as well as to ensure compliance with archaeological standards for assessing a
historic resource.
It should also be noted that this vessel is of historic significance and will require appropriate actions be
taken under the National Historic Preservation Act (NHPA) and possibly the Sunken Military Craft Act
(SMCA) prior to any actions that could impact the integrity of the vessel. This vessel may be eligible for
listing on the National Register of Historic Places and is considered a war grave and appropriate actions
should be undertaken to minimize disturbance to the site.
Background Information References
Vessel Image Sources: http://www.uboat.net/allies/merchants/ships/1679.html
Construction Diagrams or Plans in RULET Database? No
7Section 1: Vessel Background Information: Remediation of Underwater Legacy Environmental Threats (RULET)
Text References:
http://www.tos.org/oceanography/issues/issue_archive/issue_pdfs/22_2/22.2_church.pdf
AWOIS database No. 264
Coast Guard database
B.M. Browing Jr., "U.S. Merchant Vessel War Casualties of World War II", (Naval Institute Press, 1996)
http://www.uboat.net:8080/allies/merchants/ships/1679.html
Vessel Risk Factors
In this section, the risk factors that are associated with the vessel are defined and then applied to the Halo
based on the information available. These factors are reflected in the pollution potential risk assessment
development by the U.S. Coast Guard Salvage Engineering Response Team (SERT) as a means to apply a
salvage engineer’s perspective to the historical information gathered by NOAA. This analysis reflected in
Figure 1-2 is simple and straightforward and, in combination with the accompanying archaeological
assessment, provides a picture of the wreck that is as complete as possible based on current knowledge
and best professional judgment. This assessment does not take into consideration operational constraints
such as depth or unknown location, but rather attempts to provide a replicable and objective screening of
the historical date for each vessel. SERT reviewed the general historical information available for the
database as a whole and provided a stepwise analysis for an initial indication of Low/Medium/High
values for each vessel.
In some instances, nuances from the archaeological assessment may provide additional input that will
amend the score for Section 1. Where available, additional information that may have bearing on
operational considerations for any assessment or remediation activities is provided.
Each risk factor is characterized as High, Medium, or Low Risk or a category-appropriate equivalent such
as No, Unknown, Yes, or Yes Partially. The risk categories correlate to the decision points reflected in
Figure 1-2.
Each of the risk factors also has a “data quality modifier” that reflects the completeness and reliability of
the information on which the risk ranks were assigned. The quality of the information is evaluated with
respect to the factors required for a reasonable preliminary risk assessment. The data quality modifier
scale is:
High Data Quality: All or most pertinent information on wreck available to allow for thorough
risk assessment and evaluation. The data quality is high and confirmed.
Medium Data Quality: Much information on wreck available, but some key factor data are
missing or the data quality is questionable or not verified. Some additional research needed.
Low Data Quality: Significant issues exist with missing data on wreck that precludes making
preliminary risk assessment, and/or the data quality is suspect. Significant additional research
needed.
8Section 1: Vessel Background Information: Remediation of Underwater Legacy Environmental Threats (RULET)
Pollution Potential Tree
Was there oil
onboard? No
(Excel)
Yes or ?
Was the wreck
demolished? Yes Low Pollution Risk
(Excel)
No or ?
Yes
Was significant cargo
Yes Likely all cargo lost?
lost during casualty?
(Research)
(Research)
No or ? No or ?
Is cargo area
Yes Medium Pollution Risk
damaged?
(Research)
No or ?
High Pollution Risk
Figure 1-2: U.S. Coast Guard Salvage Engineering Response Team (SERT) developed the above Pollution Potential
Decision Tree.
In the following sections, the definition of low, medium, and high for each risk factor is provided. Also,
the classification for the Halo is provided, both as text and as shading of the applicable degree of risk
bullet.
Pollution Potential Factors
Risk Factor A1: Total Oil Volume
The oil volume classifications correspond to the U.S. Coast Guard spill classifications:
Low Volume: Minor SpillSection 1: Vessel Background Information: Remediation of Underwater Legacy Environmental Threats (RULET)
The oil volume risk classifications refer to the volume of the most-likely Worst Case Discharge from the
vessel and are based on the amount of oil believed or confirmed to be on the vessel.
The Halo is ranked as High Volume because it is thought to have a potential for up to 70,603 bbl,
although some of that was lost at the time of the casualty due to the explosions. Data quality is medium.
The risk factor for volume also incorporates any reports or anecdotal evidence of actual leakage from the
vessel or reports from divers of oil in the overheads, as opposed to potential leakage. This reflects the
history of the vessel’s leakage. There are no reports of leakage from the Halo.
Risk Factor A2: Oil Type
The oil type(s) on board the wreck are classified only with regard to persistence, using the U.S. Coast
Guard oil grouping1. (Toxicity is dealt with in the impact risk for the Resources at Risk classifications.)
The three oil classifications are:
Low Risk: Group I Oils – non-persistent oil (e.g., gasoline)
Medium Risk: Group II – III Oils – medium persistent oil (e.g., diesel, No. 2 fuel, light crude,
medium crude)
High Risk: Group IV – high persistent oil (e.g., heavy crude oil, No. 6 fuel oil, Bunker C)
The Halo is classified as Medium Risk because the cargo is crude oil, a Group III oil type. Data quality is
high.
Was the wreck demolished?
Risk Factor B: Wreck Clearance
This risk factor addresses whether or not the vessel was historically reported to have been demolished as a
hazard to navigation or by other means such as depth charges or aerial bombs. This risk factor is based on
historic records and does not take into account what a wreck site currently looks like. The risk categories
are defined as:
Low Risk: The wreck was reported to have been entirely destroyed after the casualty
Medium Risk: The wreck was reported to have been partially cleared or demolished after the
casualty
High Risk: The wreck was not reported to have been cleared or demolished after the casualty
Unknown: It is not known whether or not the wreck was cleared or demolished at the time of or
after the casualty
The Halo is classified as High Risk because there are no known historic accounts of the wreck being
demolished as a hazard to navigation. Data quality is high.
1 Group I Oil or Nonpersistent oil is defined as “a petroleum-based oil that, at the time of shipment, consists of hydrocarbon fractions: At least
50% of which, by volume, distill at a temperature of 340°C (645°F); and at least 95% of which, by volume, distill at a temperature of 370°C
(700°F).”
Group II - Specific gravity less than 0.85 crude [API° >35.0]
Group III - Specific gravity between 0.85 and less than .95 [API° ≤35.0 and >17.5]
Group IV - Specific gravity between 0.95 to and including 1.0 [API° ≤17.5 and >10.0]
10Section 1: Vessel Background Information: Remediation of Underwater Legacy Environmental Threats (RULET)
Was significant cargo or bunker lost during casualty?
Risk Factor C1: Burning of the Ship
This risk factor addresses any burning that is known to have occurred at the time of the vessel casualty
and may have resulted in oil products being consumed or breaks in the hull or tanks that would have
increased the potential for oil to escape from the shipwreck. The risk categories are:
Low Risk: Burned for multiple days
Medium Risk: Burned for several hours
High Risk: No burning reported at the time of the vessel casualty
Unknown: It is not known whether or not the vessel burned at the time of the casualty
The Halo is classified as Medium Risk because there was a significant fire reported at the time of
casualty. Data quality is high.
Risk Factor C2: Reported Oil on the Water
This risk factor addresses reports of oil on the water at the time of the vessel casualty. The amount is
relative and based on the number of available reports of the casualty. Seldom are the reports from trained
observers so this is very subjective information. The risk categories are defined as:
Low Risk: Large amounts of oil reported on the water by multiple sources
Medium Risk: Moderate to little oil reported on the water during or after the sinking event
High Risk: No oil reported on the water
Unknown: It is not known whether or not there was oil on the water at the time of the casualty
The Halo is classified as Low Risk because large amounts of oil were reported to have spread across the
water as the vessel went down. Data quality is high.
Is the cargo area damaged?
Risk Factor D1: Nature of the Casualty
This risk factor addresses the means by which the vessel sank. The risk associated with each type of
casualty is determined by the how violent the sinking event was and the factors that would contribute to
increased initial damage or destruction of the vessel (which would lower the risk of oil, other cargo, or
munitions remaining on board). The risk categories are:
Low Risk: Multiple torpedo detonations, multiple mines, severe explosion
Medium Risk: Single torpedo, shellfire, single mine, rupture of hull, breaking in half, grounding
on rocky shoreline
High Risk: Foul weather, grounding on soft bottom, collision
Unknown: The cause of the loss of the vessel is not known
The Halo is classified as Low Risk because there were multiple torpedo detonations. Data quality is high.
Risk Factor D2: Structural Breakup
This risk factor takes into account how many pieces the vessel broke into during the sinking event or
since sinking. This factor addresses how likely it is that multiple components of a ship were broken apart
including tanks, valves, and pipes. Experience has shown that even vessels broken in three large sections
11Section 1: Vessel Background Information: Remediation of Underwater Legacy Environmental Threats (RULET)
can still have significant pollutants on board if the sections still have some structural integrity. The risk
categories are:
Low Risk: The vessel is broken into more than three pieces
Medium Risk: The vessel is broken into two-three pieces
High Risk: The vessel is not broken and remains as one contiguous piece
Unknown: It is currently not known whether or not the vessel broke apart at the time of loss or
after sinking
The Halo is classified as High Risk because it is not broken apart and remains in one contiguous piece.
Data quality is high.
Factors That May Impact Potential Operations
Orientation (degrees)
This factor addresses what may be known about the current orientation of the intact pieces of the wreck
(with emphasis on those pieces where tanks are located) on the seafloor. For example, if the vessel turtled,
not only may it have avoided demolition as a hazard to navigation, but it has a higher likelihood of
retaining an oil cargo in the non-vented and more structurally robust bottom of the hull.
The Halo is resting upright on the bottom. Data quality is high.
Depth
Depth information is provided where known. In many instances, depth will be an approximation based on
charted depths at the last known locations.
The Halo is believed to be 500 feet deep. Data quality is high.
Visual or Remote Sensing Confirmation of Site Condition
This factor takes into account what the physical status of wreck site as confirmed by remote sensing or
other means such as ROV or diver observations and assesses its capability to retain a liquid cargo. This
assesses whether or not the vessel was confirmed as entirely demolished as a hazard to navigation, or
severely compromised by other means such as depth charges, aerial bombs, or structural collapse.
The Halo has been surveyed by BOEM and C&C Technologies. Data quality is high.
Other Hazardous (Non-Oil) Cargo on Board
This factor addresses hazardous cargo other than oil that may be on board the vessel and could potentially
be released, causing impacts to ecological and socio-economic resources at risk.
There are no reports of hazardous materials onboard. Data quality is high.
Munitions on Board
This factor addresses hazardous cargo other than oil that may be on board the vessel and could potentially
be released or detonated causing impacts to ecological and socio-economic resources at risk.
12Section 1: Vessel Background Information: Remediation of Underwater Legacy Environmental Threats (RULET)
The Halo did not carry any munitions. Data quality is high.
Vessel Pollution Potential Summary
Table 1-1 summarizes the risk factor scores for the pollution potential and mitigating factors that would
reduce the pollution potential for the Halo. Operational factors are listed but do not have a risk score.
Table 1-1: Summary matrix for the vessel risk factors for the Halo color-coded as red (high risk), yellow (medium
risk), and green (low risk).
Data
Risk
Vessel Risk Factors Quality Comments
Score
Score
Maximum of 70,603 bbl, not reported to be
A1: Oil Volume (total bbl) Med
leaking
A2: Oil Type High Cargo is crude oil, a Group III oil type
Pollution B: Wreck Clearance High Vessel not reported as cleared
Potential C1: Burning of the Ship High A significant fire was reported Med
Factors Large amounts of oil were reported on the
C2: Oil on Water High
water
D1: Nature of Casualty High Multiple torpedo detonations
D2: Structural Breakup High The vessel remains in one contiguous piece
Detailed sinking records and site reports of
Archaeological Not
Archaeological Assessment High this ship exist, assessment is believed to be
Assessment Scored
very accurate
Wreck Orientation High Upright
Depth High 500 ft
Visual or Remote Sensing
High Location has been surveyed
Confirmation of Site Condition
Operational Other Hazardous Materials Not
High No
Factors Onboard Scored
Munitions Onboard High No
Gravesite (Civilian/Military) High Yes
Historical Protection Eligibility
High NHPA and possibly SMCA
(NHPA/SMCA)
13Section 2: Environmental Impact Modeling
SECTION 2: ENVIRONMENTAL IMPACT MODELING
To help evaluate the potential transport and fates of releases from sunken wrecks, NOAA worked with
RPS ASA to run a series of generalized computer model simulations of potential oil releases. The results
are used to assess potential impacts to ecological and socio-economic resources, as described in Sections
3 and 4. The modeling results are useful for this screening-level risk assessment; however, it should be
noted that detailed site/vessel/and seasonally specific modeling would need to be conducted prior to any
intervention on a specific wreck.
Release Scenarios Used in the Modeling
The potential volume of leakage at any point in time will tend to follow a probability distribution. Most
discharges are likely to be relatively small, though there could be multiple such discharges. There is a
lower probability of larger discharges, though these scenarios would cause the greatest damage. A Worst
Case Discharge (WCD) would involve the release of all of the cargo oil and bunkers present on the
vessel. In the case of the Halo this would be about 71,000 bbl (rounded up from the sum of 64,103 bbl of
crude oil as cargo and 6,500 bbl of Bunker C fuel oil) based on current estimates of the maximum amount
of oil remaining onboard the wreck.
The likeliest scenario of oil release from most sunken wrecks, including the Halo, is a small, episodic
release that may be precipitated by disturbance of the vessel in storms. Each of these episodic releases
may cause impacts and require a response. Episodic releases are modeled using 1% of the WCD. Another
scenario is a very low chronic release, i.e., a relatively regular release of small amounts of oil that causes
continuous oiling and impacts over the course of a long period of time. This type of release would likely
be precipitated by corrosion of piping that allows oil to flow or bubble out at a slow, steady rate. Chronic
releases are modeled using 0.1% of the WCD.
The Most Probable scenario is premised on the release of all the oil from one tank. In the absence of
information on the number and condition of the cargo or fuel tanks for all the wrecks being assessed, this
scenario is modeled using 10% of the WCD. The Large scenario is loss of 50% of the WCD. The five
major types of releases are summarized in Table 2-1. The actual type of release that occurs will depend on
the condition of the vessel, time factors, and disturbances to the wreck. Note that episodic and chronic
release scenarios represent a small release that is repeated many times, potentially repeating the same
magnitude and type of impact(s) with each release. The actual impacts would depend on the
environmental factors such as real-time and forecast winds and currents during each release and the
types/quantities of ecological and socio-economic resources present.
The model results here are based on running the RPS ASA Spill Impact Model Application Package
(SIMAP) two hundred times for each of the five spill volumes shown in Table 2-1. The model randomly
selects the date of the release, and corresponding environmental, wind, and ocean current information
from a long-term wind and current database.
When a spill occurs, the trajectory, fate, and effects of the oil will depend on environmental variables,
such as the wind and current directions over the course of the oil release, as well as seasonal effects. The
14Section 2: Environmental Impact Modeling
magnitude and nature of potential impacts to resources will also generally have a strong seasonal
component (e.g., timing of bird migrations, turtle nesting periods, fishing seasons, and tourism seasons).
Table 2-1: Potential oil release scenario types for the Halo.
Release per Relative
Scenario Type Time Period Release Rate Response Tier
Episode Likelihood
Fairly regular
Chronic 100 bbl over
71 bbl intervals or More likely Tier 1
(0.1% of WCD) several days
constant
Episodic Over several hours
710 bbl Irregular intervals Most Probable Tier 1-2
(1% of WCD) or days
Most Probable Over several hours
7,100 bbl One-time release Most Probable Tier 2
(10% of WCD) or days
Large Over several hours
35,500 bbl One-time release Less likely Tier 2-3
(50% of WCD) or days
Over several hours
Worst Case 71,000 bbl One-time release Least likely Tier 3
or days
The modeling results represent 200 simulations for each spill volume with variations in spill trajectory
based on winds and currents. The spectrum of the simulations gives a perspective on the variations in
likely impact scenarios. Some resources will be impacted in nearly all cases; some resources may not be
impacted unless the spill trajectory happens to go in that direction based on winds and currents at the time
of the release and in its aftermath.
For the large and WCD scenarios, the duration of the release was assumed to be 12 hours, envisioning a
storm scenario where the wreck is damaged or broken up, and the model simulations were run for a
period of 30 days. The releases were assumed to be from a depth between 2-3 meters above the sea floor,
using the information known about the wreck location and depth.
As discussed in the NOAA 2013 Risk Assessment for Potentially Polluting Wrecks in U.S. Waters,
NOAA identified 87 high and medium priority wrecks for screening-level risk assessment. Within the
available funds, it was not feasible to conduct computer model simulations of all 87 high and medium
priority wrecks. Therefore, efforts were made to create “clusters” of vessels in reasonable proximity and
with similar oil types. In general, the wreck with the largest potential amount of oil onboard was selected
for modeling of oil release volumes, and the results were used as surrogates for the other vessels in the
cluster. In particular, the regression curves created for the modeled wreck were used to determine the
impacts to water column, water surface, and shoreline resources. The Halo, with up to 71,000 bbl
onboard, was clustered with the Hamlet, which was modeled at 115,000 bbl of crude oil. Figure 2-1
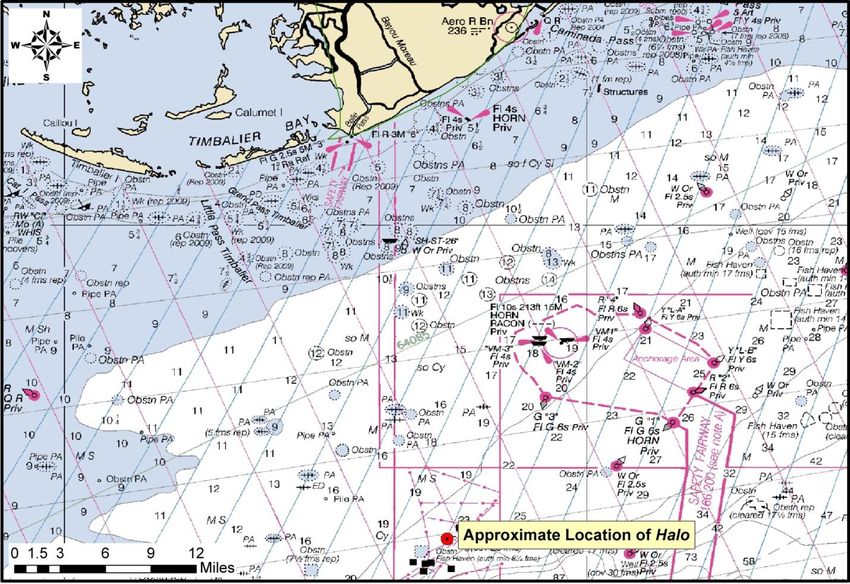
shows the location of both vessels.
15Section 2: Environmental Impact Modeling
Figure 2-1: Location of the Halo (red triangle), the wreck discussed in this package, and the Hamlet (red circle)
which was the wreck that was actually modeled in the computer modeling simulations. The results for the
Hamlet are used as surrogates to estimate the impacts of releases from the Halo, as discussed in the text.
It is important to acknowledge that these scenarios are only for this screening-level assessment. Detailed
site/vessel/and seasonally specific modeling would need to be conducted prior to any intervention on a
specific wreck.
Oil Type for Release
The Halo contained a maximum of 64,103 bbl of crude oil (a Type III oil) as cargo and 6,500 bbl of
Bunker C fuel oil as the fuel (a Group IV oil). Thus, the spill model for the Hamlet, which was run using
crude oil, was used for this scoping risk assessment of the Halo.
Oil Thickness Thresholds
The model results are reported for different oil thickness thresholds, based on the amount of oil on the
water surface or shoreline and the resources potentially at risk. Table 2-2 shows the terminology and
thicknesses used in this report, for both oil thickness on water and the shoreline. For oil on the water
surface, a thickness of 0.01 g/m2, which would appear as a barely visible sheen, was used as the threshold
for socio-economic impacts because often fishing is prohibited in areas with any visible oil, to prevent
contamination of fishing gear and catch. A thickness of 10 g/m2 was used as the threshold for ecological
impacts, primarily due to impacts to birds, because that amount of oil has been observed to be enough to
mortally impact birds and other wildlife. In reality, it is very unlikely that oil would be evenly distributed
on the water surface. Spilled oil is always distributed patchily on the water surface in bands or tarballs
with clean water in between. So, Table 2-2a shows the number of tarballs per acre on the water surface
for these oil thickness thresholds, assuming that each tarball was a sphere that was 1 inch in diameter.
16Section 2: Environmental Impact Modeling
For oil stranded onshore, a thickness of 1 g/m2 was used as the threshold for socio-economic impacts
because that amount of oil would conservatively trigger the need for shoreline cleanup on amenity
beaches. A thickness of 100 g/m2 was used as the threshold for ecological impacts based on a synthesis of
the literature showing that shoreline life has been affected by this degree of oiling.2 Because oil often
strands onshore as tarballs, Table 2-2a shows the number of tarballs per m2 on the shoreline for these oil
thickness thresholds, assuming that each tarball was a sphere that was 1 inch in diameter.
Table 2-2a: Oil thickness thresholds used in calculating area of water impacted. Refer to Sections 3 and 4 for
explanations of the thresholds for ecological and socio-economic resource impacts.
Sheen Approximate Sheen No. of 1 inch
Oil Description Threshold/Risk Factor
Appearance Thickness Tarballs
Socio-economic Impacts to Water
0.01 ~5-6 tarballs
Oil Sheen Barely Visible 0.00001 mm Surface/Risk Factor 4B-1 and 2
g/m2 per acre
(see Section 4)
Ecological Impacts to Water
~5,000-6,000
Heavy Oil Sheen Dark Colors 0.01 mm 10 g/m2 Surface/ Risk Factor 3B-1 and 2
tarballs per acre
(see Section 3)
Table 2-2b: Oil thickness thresholds used in calculating miles of shoreline impacted. Refer to Sections 3 and 4 for
explanations of the thresholds for ecological and socio-economic resource impacts.
Oil Approximate Sheen No. of 1 inch
Oil Description Threshold/Risk Factor
Appearance Thickness Tarballs
Socio-economic Impacts to
~0.12-0.14
Oil Sheen/Tarballs Dull Colors 0.001 mm 1 g/m2 Shoreline Users/Risk Factor 4C-1
tarballs/m2
and 2
Ecological Impacts to Shoreline
Oil Slick/Tarballs Brown to Black 0.1 mm 100 g/m2 ~12-14 tarballs/m2
Habitats/Risk Factor 3C-1 and 2
Potential Impacts to the Water Column
Impacts to the water column from an oil release from the Halo will be determined by the volume of
leakage. Because oil from sunken vessels will be released at low pressures, the droplet sizes will be large
enough for the oil to float to the surface. Therefore, impacts to water column resources will result from
the natural dispersion of the floating oil slicks on the surface, which is limited to about the top 33 feet.
The metric used for ranking impacts to the water column is the area of water surface in mi2 that has been
contaminated by 1 part per billion (ppb) oil to a depth of 33 feet. At 1 ppb, there are likely to be impacts
to sensitive organisms in the water column and potential tainting of seafood, so this concentration is used
as a screening threshold for both the ecological and socio-economic risk factors for water column
resource impacts. To assist planners in understanding the scale of potential impacts for different leakage
volumes, a regression curve was generated for the water column volume oiled using the five volume
scenarios, which is shown in Figure 2-2, which is the regression curve for the Hamlet. Using this figure,
the water column impacts can be estimated for any spill volume. On Figure 2-2, arrows are used to
2 French, D., M. Reed, K. Jayko, S. Feng, H. Rines, S. Pavignano, T. Isaji, S. Puckett, A. Keller, F. W. French III, D. Gifford, J.
McCue, G. Brown, E. MacDonald, J. Quirk, S. Natzke, R. Bishop, M. Welsh, M. Phillips and B.S. Ingram, 1996. The CERCLA
type A natural resource damage assessment model for coastal and marine environments (NRDAM/CME), Technical
Documentation, Vol. I - V. Final Report, Office of Environmental Policy and Compliance, U.S. Dept. Interior, Washington, DC.
17Section 2: Environmental Impact Modeling
indicate the where the WCD for the Halo plots on the curve and how the area of the water column impact
is determined. Note that the water column impact decreases for the worst case discharge spill volume,
because a significant amount of oil is removed from the water column due to sedimentation in the
modeling results. Increased sedimentation will increase impacts to benthic habitats.
Figure 2-2: Regression curve for estimating the area of water column at or above 1 ppb aromatics impacted as a
function of spill volume for the Halo. This regression curve was generated for the Hamlet, which has the
same oil type and similar volume of potential releases as the Halo. The arrows indicate where the WCD for
the Halo falls on the curve and how the area of water column impact can be determined for any spill volume.
Potential Water Surface Slick
The slick size from an oil release from the Halo is a function of the quantity released. The estimated water
surface coverage by a fresh slick (the total water surface area “swept” by oil over time) for the various
scenarios is shown in Table 2-3, as the mean result of the 200 model runs for the Hamlet then using the
regression curve shown in Figure 2-3 to calculate the values for the different release scenarios for the
Halo. Note that this is an estimate of total water surface affected over a 30-day period. The slick will not
be continuous but rather be broken and patchy. Surface expression is likely to be in the form of sheens,
tarballs, and streamers. In the model, the representative crude oil used for this analysis spreads to a
minimum thickness of approximately 975 g/m2, and the oil is not able to spread any thinner, owing to its
high viscosity. As a result, water surface oiling results are identical for the 0.01 and 10 g/m2 thresholds.
The location, size, shape, and spread of the oil slick(s) from an oil release from the Halo will depend on
environmental conditions, including winds and currents, at the time of release and in its aftermath. Refer
to the risk assessment package for the Hamlet for maps (Figs. 2-2 and 2-3) showing the areas potentially
affected by slicks using the Most Probable volume and the socio-economic and ecological thresholds.
18Section 2: Environmental Impact Modeling
Table 2-3: Estimated slick area swept on water for oil release scenarios from the Halo, based on the model results
for the Hamlet.
Estimated Slick Area Swept
Scenario Type Oil Volume (bbl) Mean of All Models
0.01 g/m2 10 g/m2
Chronic 71 870 mi2 870 mi2
Episodic 710 2,700 mi2 2,700 mi2
Medium 7,100 8,300 mi2 8,200 mi2
Large 35,500 18,000 mi2 17,000 mi2
Worst Case Discharge 71,000 25,000 mi2 24,000 mi2
The actual area affected by a release will be determined by the volume of leakage, whether it is from one
or more tanks at a time. To assist planners in understanding the scale of potential impacts for different
leakage volumes, a regression curve was generated for the water surface area oiled using the five volume
scenarios for the Hamlet, which is shown in Figure 2-3 and referenced in Table 2-3. Using this figure, the
area of water surface with a barely visible sheen can be estimated for any spill volume from the Halo.
Figure 2-3: Regression curve for estimating the amount of water surface oiling as a function of spill volume for the
Halo, showing both the ecological threshold of 10 g/m2 and socio-economic threshold of 0.01 g/m2, based
on the model results for the Hamlet. The arrows indicate where the WCD for the Halo falls on the curve and
how the area of water surface impact can be determined for any spill volume. The curves for each threshold
are so similar that they plot on top of each other.
19Section 2: Environmental Impact Modeling
Potential Shoreline Impacts
Based on these modeling results, shorelines from the Chandeleur Islands in Louisiana west and south to
below Brownsville, Texas into Mexico are at risk. (Refer to Figure 2-6 in the Hamlet package to see the
probability of oil stranding on the shoreline at concentrations that exceed the threshold of 1 g/m2, for the
Most Probable release). However, the specific areas that would be oiled will depend on the currents and
winds at the time of the oil release(s), as well as on the amount of oil released. Estimated miles of
shoreline oiling above the socio-economic threshold of 1 g/m2 and the ecological threshold of 100 g/m2
by scenario type are shown in Table 2-4.
Table 2-4: Estimated shoreline oiling from leakage from the Halo, based on the modeling results for the Hamlet.
Estimated Miles of Shoreline Estimated Miles of Shoreline
Scenario Type Volume (bbl)
Oiling Above 1 g/m2 Oiling Above 100 g/m2
Chronic 71 19 1
Episodic 710 27 4
Medium 7,100 40 14
Large 35,500 52 32
Worst Case Discharge 71,000 58 46
The actual shore length affected by a release will be determined by the volume of leakage and
environmental conditions during an actual release. To assist planners in scaling the potential impact for
different leakage volumes, a regression curve was generated for the total shoreline length oiled using the
five volume scenarios for the Hamlet, as detailed in Table 2-4 and shown in Figure 2-4. Using this figure,
the shore length oiled can be estimated for any spill volume from the Halo.
Figure 2-4: Regression curve for estimating the amount of shoreline oiling at different thresholds as a function of spill
volume for the Halo, based on the model results for the Hamlet. The arrows indicate where the WCD for the
Halo falls on the curve and how the length of shoreline impact can be determined for any spill volume.
20Section 3: Ecological Resources at Risk
SECTION 3: ECOLOGICAL RESOURCES AT RISK
Ecological resources at risk from a catastrophic release of oil from the Halo (Table 3-1) include numerous
guilds of birds, particularly those sensitive to surface oiling while rafting or plunge diving to feed and are
present in nearshore/offshore waters. Coastal marshes and barrier islands support large number of nesting
shorebirds and wading birds and provide foraging grounds for overwintering shorebirds and waterfowl
and migrating shorebirds and passerines. Kemp’s ridley sea turtles use coastal waters heavily to travel
between nesting beaches in South Texas and Mexico and foraging grounds near the Mississippi River
Delta. In addition, nearshore waters of the Gulf support highly productive coastal fisheries for both finfish
and invertebrates.
Table 3-1: Ecological resources at risk from a release of oil from the Hamlet.
(FT = Federal threatened; FE = Federal endangered; ST = State threatened; SE = State endangered).
Species Group Species Subgroup and Geography Seasonal Presence
Coastal Birds Louisiana coastal islands and bays are important habitat for wintering waterfowl, Ospreys present during
supporting densities of up to 900 birds per square mile winter
Raptors (American kestrel, northern harriers, red-tailed hawk, turkey vulture,
Cooper’s hawk, osprey, bald eagle) can all be present in the coastal marshes Mottled duck nests
Half of North American population of mottled duck inhabits Louisiana Mar-Sep
Bird Nesting and Mississippi Delta (Pass a Loutre State WMA, Delta NWR) Piping plover present
Migratory *bp = breeding pairs, otherwise numbers are individual bird counts Aug-May
Hotspots Nesting habitat for mottled duck (445), secretive marsh birds, wading birds,
brown pelican (2-3,000 bp) Wilson’s plover nests
High densities of king rails in the marsh May-Aug
Habitat for 100,000 wintering waterfowl, including canvasback (9,000), northern
pintail (48,000), gadwall (36,000) Short-billed dowitcher
Wintering habitat for western sandpiper, least sandpiper, and dunlin present in winter
Barataria-Terrebonne Bays Roseate spoonbill
Grand Isle State Park is important migratory bird stopover nests Mar-Jul
Snowy plover stopover site
High abundances of overwintering blue and green-winged teal, American Mottled duck nests
wigeon, ring-necked duck, lesser scaup, mallard, gadwall, and geese Mar-Sep
Piping plovers overwintering on Elmer’s Island, W Grand Terre, and Fourchon
Egrets nest Feb-Jul
east (~50 total)
Nesting: Short-billed dowitcher (1,800), Wilson’s plover (176 bp), black skimmer
Ibises nest Apr-Aug
(899), gull-billed tern (>100), Forster’s tern (600-900 bp), least tern (321 bp),
little blue heron (2,690 bp), white ibis (2,500), roseate spoonbill (125 bp)
Herons nest Mar-Aug
Isle Dernieres & Timbalier Islands
Gulls nest Apr-Jul
Raccoon Island - high abundance of brown pelican, Wilson’s plover, royal and
sandwich tern, great, snowy and reddish egret, great blue and tricolored heron Skimmers nest May-
Important wintering habitat: piping plover (50-100), snowy plover (Section 3: Ecological Resources at Risk
Species Group Species Subgroup and Geography Seasonal Presence
Marsh and scrub habitats important for rails, cranes, gulls, shorebirds, and terns
Chenier plain
Shell Keys Isl.: stopover for white pelicans (1,807), brown pelicans, terns, gulls
> 400k overwintering ducks and geese
Mottled duck (1,000-2,000) present
Nesting: Forster’s tern (800 bp), gull-billed tern (200 bp), black skimmer (400
bp), roseate spoonbill (200 bp)
Piping plover (30), long-billed dowitcher (6,000) habitat present
Bolivar Flats
100,000s of birds
Resting and feeding location for migrating shorebirds (American avocet,
American golden-plover, semipalmated plover, Wilson’s plover, piping plover,
snowy plover)
Resident mottled duck
Breeding roseate spoonbills (50)
Jigsaw Island
Nesting: American oystercatcher (5 bp), black skimmer (10 bp), laughing gull
(50 bp), Caspian tern (6 bp), royal tern (600 bp), sandwich tern (300 bp),
tricolored heron
North Deer Island
20-40k pairs of 17 bird species nest here; Can have 20k pairs of white ibis and
1,000 pairs of brown pelican, 2-3,000 pairs of laughing gull
Mustang Bayou Isl. – wading birds, black skimmer, gull-billed and royal tern nesting
East Matagorda (Dressing Point)
Nesting laughing gull (>2,000), royal tern (>1,000), sandwich tern (1,000),
reddish egret (20-30), tricolored heron (500), snowy egret (200), great egret
(200), great blue herons, white ibis (historically thousands, currentlyYou can also read