Combining atmospheric and snow radiative transfer models to assess the solar radiative effects of black carbon in the Arctic
←
→
Page content transcription
If your browser does not render page correctly, please read the page content below
Atmos. Chem. Phys., 20, 8139–8156, 2020
https://doi.org/10.5194/acp-20-8139-2020
© Author(s) 2020. This work is distributed under
the Creative Commons Attribution 4.0 License.

Combining atmospheric and snow radiative transfer models to
assess the solar radiative effects of black carbon in the Arctic
Tobias Donth1 , Evelyn Jäkel1 , André Ehrlich1 , Bernd Heinold2 , Jacob Schacht2 , Andreas Herber3 , Marco Zanatta3 ,
and Manfred Wendisch1
1 Leipzig Institute for Meteorology (LIM), University of Leipzig, Leipzig, Germany
2 Leibniz Institute for Tropospheric Research, (TROPOS), Leipzig, Germany
3 Alfred Wegener Institute Helmholtz Centre for Polar and Marine Research (AWI), Bremerhaven, Germany

Correspondence: Evelyn Jäkel (e.jaekel@uni-leipzig.de)

Received: 23 January 2020 – Discussion started: 5 February 2020
Revised: 15 June 2020 – Accepted: 18 June 2020 – Published: 13 July 2020

Abstract. The magnitude of solar radiative effects (cooling      ders of magnitude larger than that by atmospheric BC. Sim-
or warming) of black carbon (BC) particles embedded in           ilarly, the daily mean total heating rate (6 K d−1 ) within a
the Arctic atmosphere and surface snow layer was explored        snowpack due to absorption by the ice was more than 1 order
on the basis of case studies. For this purpose, combined at-     of magnitude larger than that of atmospheric BC (0.2 K d−1 ).
mospheric and snow radiative transfer simulations were per-      Also, it was shown that the cooling by atmospheric BC of the
formed for cloudless and cloudy conditions on the basis of       near-surface air and the warming effect by BC embedded in
BC mass concentrations measured in pristine early summer         snow are reduced in the presence of clouds.
and more polluted early spring conditions. The area of inter-
est is the remote sea-ice-covered Arctic Ocean in the vicin-
ity of Spitsbergen, northern Greenland, and northern Alaska
typically not affected by local pollution. To account for the    1   Introduction
radiative interactions between the black-carbon-containing
snow surface layer and the atmosphere, an atmospheric and        Black carbon (BC) aerosol particles, which mostly originate
snow radiative transfer model were coupled iteratively. For      from incomplete combustion of organic material (Bond et al.,
pristine summer conditions (no atmospheric BC, minimum           2013; Petzold et al., 2013), absorb and scatter solar radia-
solar zenith angles of 55◦ ) and a representative BC particle    tion in the visible wavelength range and, therefore, influence
mass concentration of 5 ng g−1 in the surface snow layer, a      the atmospheric solar radiative energy budget. The manifold
positive daily mean solar radiative forcing of +0.2 W m−2        sources of BC particles and their atmospheric transport paths
was calculated for the surface radiative budget. A higher load   have been studied extensively (Law et al., 2014). However,
of atmospheric BC representing early springtime conditions       the source strengths of the emissions are hard to quantify,
results in a slightly negative mean radiative forcing at the     which makes it challenging to quantify the transport of BC
surface of about −0.05 W m−2 , even when the low BC mass         particles into the Arctic by simulations (Stohl et al., 2013;
concentration measured in the pristine early summer condi-       Arnold et al., 2016; Schacht et al., 2019). Major sources of
tions was embedded in the surface snow layer. The total net      BC particles are forest fires, industrial activities, and traffic-
surface radiative forcing combining the effects of BC em-        related emissions, which are the main factors in lower lati-
bedded in the atmosphere and in the snow layer strongly de-      tudes: northern parts of Europe, America, and Siberia. The
pends on the snow optical properties (snow specific surface      BC particles emitted at the surface of the midlatitudes are
area and snow density). For the conditions over the Arctic       lifted and transported into the Arctic, where they can stay for
Ocean analyzed in the simulations, it was found that the at-     several days and longer (Liu et al., 2011). Contrarily, parti-
mospheric heating rate by water vapor or clouds is 1 to 2 or-    cles produced locally in the Arctic through ship traffic emis-
                                                                 sions, flaring from the oil industry, or other ground-based ac-

Published by Copernicus Publications on behalf of the European Geosciences Union.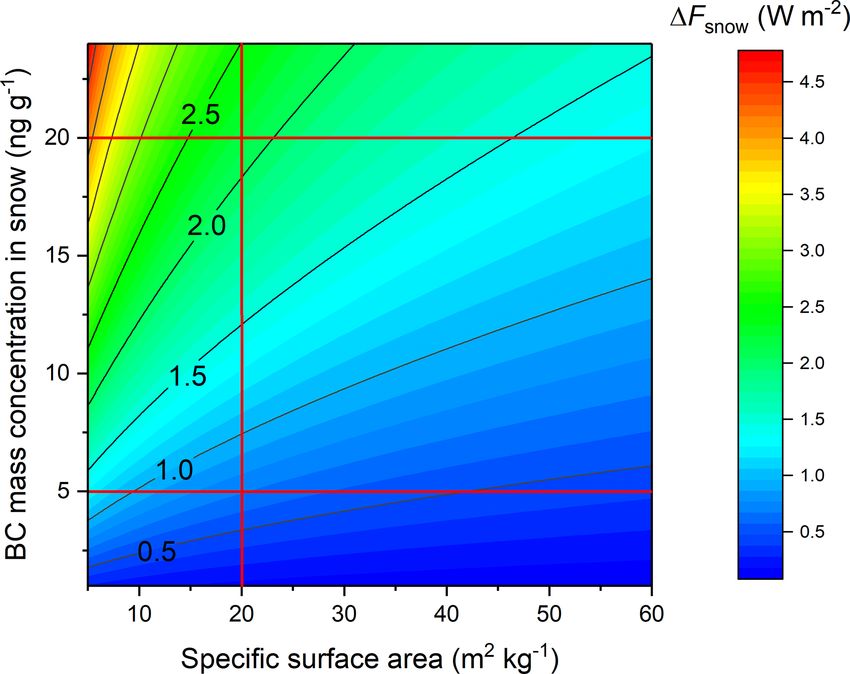
8140                                                                  T. Donth et al. : Solar radiative effects of black carbon

tivities settle down quickly on the surface and may alter the       (Table 1), which would lead to a reduction of the snow sur-
radiation budget within the snowpack (Bond et al., 2013). To-       face albedo of around 1 %. For typical Arctic summer con-
day, local sources are only a minor component. In the future,       ditions with a downward irradiance of 400 W m−2 at the sur-
a strong intensification of the ship traffic in the Arctic Ocean    face, a snow surface albedo reduction by 1 % would cause an
and further polluting human activities are expected (Corbett        additional absorption of solar radiative energy of 4 W m−2
et al., 2010). Still, the direct radiative impact by these future   (Flanner et al., 2007). As a further consequence, the absorp-
additional BC particle emissions is assumed to be of minor          tion by BC particles supports the melting of snow and in-
importance (Gilgen et al., 2018).                                   creases the snow grain size due to an enhanced snow meta-
   The BC magnitude of the atmospheric particle mass con-           morphism, leading to further reduction of the surface albedo.
centrations (in units of nanograms per cubic meter) depends         The increase in the snow grain size also feeds back to the
on the season and general meteorological conditions. In the         absorption by BC particles, which is more efficient for larger
case of BC particle plumes reaching the Arctic by long-range        snow grain sizes (Warren and Wiscombe, 1980).
transport, atmospheric concentrations of up to 150 ng m−3              BC particles suspended in the atmosphere influence the
were observed (Schulz et al., 2019). Sharma et al. (2013)           absorption and scattering of the incoming solar radiation. If
compared atmospheric BC particle mass concentrations mea-           atmospheric BC particles are located in high altitudes, en-
sured during different Arctic campaigns. They identified            hanced backscattering and absorption of incoming solar ra-
large differences depending on region and season. Mea-              diation by the BC layer lead to a reduction of the solar ra-
surements in spring 2008 covering Alaska and northern               diation reaching the surface. At the same time, the absorbed
Canada showed values above 200 ng m−3 in higher altitudes,          radiation warms the atmospheric BC layer. In extreme cases,
while in spring 2009 more pristine air masses were encoun-          the absorption due to atmospheric BC particles can affect the
tered, showing BC particle mass concentrations of less than         thermodynamic stability of the BC-containing atmospheric
100 ng m−3 integrated over the entire vertical column.              layer (Wendisch et al., 2008). The radiative heating of the
   To quantify the amount of BC in a snowpack volume, the           lofted BC layers and the local cooling of the surface may
BC mass concentration (nanograms of BC in 1 g of snow) is           enhance the thermodynamic stability of the Arctic boundary
used commonly. Typical values observed in Greenland range           layer over the snow- and ice-covered areas (Flanner, 2013).
between 1 and 10 ng g−1 and in the Canadian Arctic between             Several regional and global climate models account for the
5 and 20 ng g−1 , and in the northern parts of Russia val-          opposite radiative effects of atmospheric BC particles and
ues may reach 100 ng g−1 . Table 1 summarizes observational         snow-embedded BC particles (Samset et al., 2014). How-
data of measured BC mass concentrations in snow for dif-            ever, estimates of the total net forcing rely on the accuracy
ferent Arctic regions, as reported by Doherty et al. (2010),        of the distribution of the BC particles assumed in the particu-
Forsström et al. (2013), and Pedersen et al. (2015). The num-       lar model. Samset et al. (2014) compared 13 aerosol models
bers given in Table 1 were derived from different measure-          from the AeroCom Phase II; all of them included BC. They
ment methods. More precisely, thermal–optical techniques            found that modeled atmospheric BC particle mass concentra-
were applied in Forsström et al. (2013) and Pedersen et al.         tions often show a spread over more than 1 order of magni-
(2015) and provide the elemental carbon (EC) mass concen-           tude. In remote regions, dominated by long-range transport,
tration, while filter transmission methods result in BC con-        these models tend to overestimate the atmospheric BC con-
centrations (Doherty et al., 2010). As a consequence of the         centrations compared to airborne observations. On the other
different measurement methods, the ratio of the BC to EC            hand, an underestimation of deposition rates induces a lower
concentration in snow can reach values of 1.3 as reported by        BC mass concentration in snow (Namazi et al., 2015). While
Dou et al. (2017). A full discussion of the EC / BC terminol-       this may introduce significant local and temporal uncertain-
ogy can be found in Petzold et al. (2013).                          ties of the BC concentration and related radiative effects,
   Due to the absorption of solar radiation, BC particles may       long-term trends and mean multi-model results are represen-
contribute to the currently ongoing drastic Arctic climate          tative for Arctic-wide observations (Sand et al., 2017).
changes (called arctic amplification; e.g., Wendisch et al.,           Most previous studies quantifying the radiative impact of
2017). The absorption effect can add to the warming of the          BC particles focused either on estimates of cooling or warm-
atmosphere or the snowpack, when the BC particles are sus-          ing effects in the atmosphere (e.g., Wendling et al., 1985;
pended either in the air or embedded in the snow. Further-          Samset et al., 2013) or on radiative effects of BC in the snow
more, the BC particles may lead to a reduction of the snow          surface layer (Dou and Cun-De, 2016). In contrast, this pa-
surface albedo if the BC sediments on or into the snowpack          per combines both effects by iteratively coupling radiative
(Sand et al., 2013). Warren (2013) estimated a decrease of          transfer simulations in both compartments, the atmosphere
2 % in snow albedo in the visible spectral range for a snow-        and the snowpack. On the basis of measured Arctic BC par-
pack with a BC mass concentration of 34 ng g−1 , which cor-         ticle mass concentrations for spring and summer months, the
responds to the maximum value observed on the Greenland             instantaneous radiative forcing of BC particles embedded in
ice sheet (Doherty et al., 2010). More typical BC mass con-         the snow surface layer and in the atmosphere was quantified
centrations in Arctic snow range between 5 and 20 ng g−1            for specific cases. Here, the instantaneous radiative forcing

Atmos. Chem. Phys., 20, 8139–8156, 2020                                              https://doi.org/10.5194/acp-20-8139-2020
T. Donth et al. : Solar radiative effects of black carbon 8141
Table 1. Values of the black carbon mass concentration in snowpack observed in different regions and seasons in the Arctic. Note that Ped-
ersen et al. (2015) and Forsström et al. (2013) derived the mass concentration of elemental carbon applying a thermal–optical measurement
method.
Location Season BC mass Method Source
concentration
(ng g−1 )
Svalbard region March–April 13 filter transmission Doherty et al. (2010)
Arctic Ocean snow Spring 7 filter transmission Doherty et al. (2010)
Arctic Ocean snow Summer 8 filter transmission Doherty et al. (2010)
Northern Norway May 21 filter transmission Doherty et al. (2010)
Central Greenland Summer 3 filter transmission Doherty et al. (2010)
Svalbard region March–April 11–14 thermal–optical Forsström et al. (2013)
Corbel, Ny-Ålesund March 21 thermal–optical Pedersen et al. (2015)
Barrow April 5 thermal–optical Pedersen et al. (2015)
Ramfjorden, Tromsø April 13 thermal–optical Pedersen et al. (2015)
Valhall, Tromsø April 137 thermal–optical Pedersen et al. (2015)
Fram Strait April 22 thermal–optical Pedersen et al. (2015)
refers to the change of the surface radiation budget caused luted case) in early spring with low Sun and lower BC con-
by the presence of BC particles. With the help of the coupled centration (pristine conditions) in early summer during the
model, the interaction of radiative effects in the atmosphere polar day. The Arctic Research of the Composition of the
and the snowpack was considered. In particular, the role of Troposphere from Aircraft and Satellites (ARCTAS) spring
clouds in the cooling or warming effect caused by BC parti- campaign was performed in April 2008 (Jacob et al., 2010;
cles was examined. Due to the fact that clouds enhance the at- Matsui et al., 2011). The aircraft operation of ARCTAS
mospheric multi-scattering between surface and cloud layer, mainly took place in northern Alaska and the Arctic Ocean.
but also enhance the surface albedo (Choudhury and Chang, Similar SP2 measurements were performed during the Po-
1981), it is expected that clouds also alter the radiative im- lar Airborne Measurements and Arctic Regional Climate
pact by BC particles. To our knowledge, this interaction was Model Simulation Project (PAMARCMiP) campaigns (Her-
not explicitly discussed in previous publications. ber et al., 2012; Stone et al., 2010). In this paper, mea-
The radiative transfer simulations used in this study were surements from the PAMARCMiP 2018 observations con-
based on airborne observations of atmospheric BC concen- ducted from 10 March to 8 April 2018 were analyzed. The
tration in the Arctic, which were taken during three field research flights, starting from Station Nord, Greenland, were
campaigns in the European and Canadian Arctic. The applied performed above the sea ice in the Arctic Ocean north of Sta-
models and observations are introduced in Sect. 2. Section 3 tion Nord and the Fram Strait. In contrast to both spring cam-
discusses the radiative forcing of BC particles on the surface paigns, the Arctic CLoud Observations Using airborne mea-
solar radiative budget. Vertical profiles of heating rates in the surements during polar Day (ACLOUD) campaign was con-
atmosphere and in the snowpack are presented for clean and ducted in early summer 2017 characterizing the atmosphere
polluted conditions. To estimate the impact of BC particles, over the Arctic Ocean north and west of Svalbard (Wendisch
effective heating rates are calculated by separating the BC et al., 2019; Ehrlich et al., 2019). ACLOUD was coordinated
radiative effect from the total heating rates. with the Physical Feedbacks of Arctic Boundary Layer, Sea
Ice, Cloud and Aerosol (PASCAL) cruise of the research ves-
sel Polarstern which provided a ground-based characteriza-
2 Configuration of radiative transfer simulations and tion of snow properties (Wendisch et al., 2019).
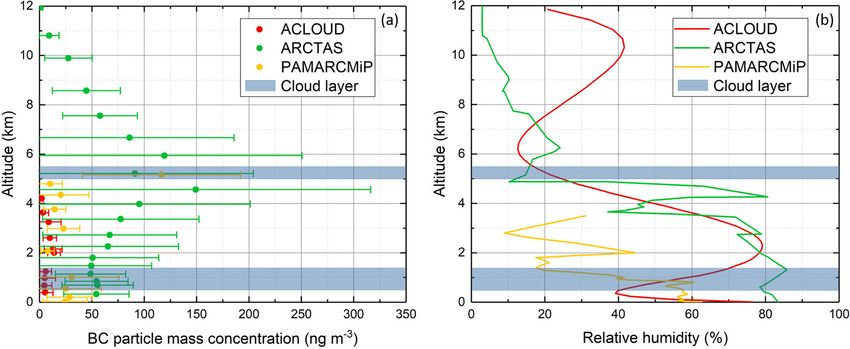
iterative model coupling Mean vertical profiles of the measured atmospheric BC
particle mass concentrations averaged for each of the three
2.1 BC profiles from aircraft campaigns campaigns (ACLOUD, ARCTAS, and PAMARCMiP), are
shown in Fig. 1a. The conditions between the individual
The input for the radiative transfer simulations was adapted flights were highly variable (see the standard deviation of
to campaign-specific conditions. The atmospheric BC par- each layer in Fig. 1). ACLOUD shows rather low mean BC
ticle mass concentrations were derived from airborne mea- concentrations, which do not exceed 30 ng m−3 . During PA-
surements with the Single Particle Soot Photometer (SP2; MARCMiP, the background concentrations were similarly
Moteki and Kondo, 2007). Measured profiles of the atmo- low, with the exception of measurements at about 5 km alti-
spheric BC were used from three aircraft campaigns repre- tude, where more than 100 ng m−3 was recorded. For ARC-
senting typical cases with higher BC concentrations (pol-
https://doi.org/10.5194/acp-20-8139-2020 Atmos. Chem. Phys., 20, 8139–8156, 2020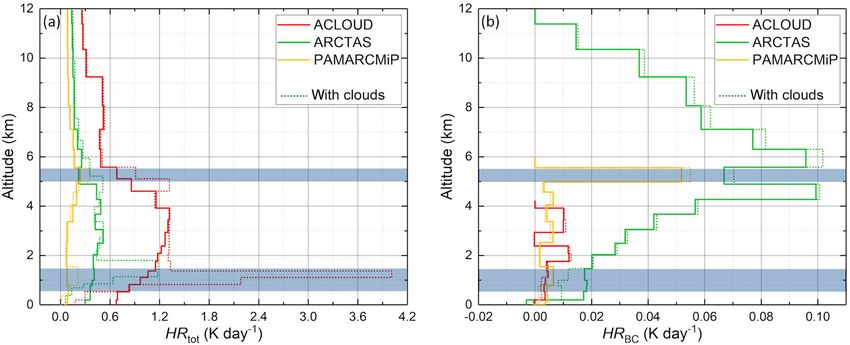
8142                                                                    T. Donth et al. : Solar radiative effects of black carbon

TAS observations, conducted at lower latitudes, significantly            The meteorological input for the model was based on stan-
higher BC concentrations of up to 150 ng m−3 were ob-                 dard profiles of trace gases, temperature, humidity, and pres-
served. Similar to PAMARCMiP, the maximum concentra-                  sure from Anderson et al. (1986). Sub-Arctic summer con-
tions were observed at about 5 km altitude, indicating that the       ditions were chosen for the early summer case (ACLOUD)
BC particles were linked to long-range transport (Nakoudi et          and subarctic winter conditions for the winter and spring
al., 2020). Besides the differences in atmospheric BC con-            cases (ARCTAS, PAMARCMiP). The standard profiles were
centrations, the range of the daily solar zenith angle (SZA)          adapted to observations from radio soundings near the air-
and, thus, the available incoming solar radiation varied sig-         borne observations or dropsondes released during the flights
nificantly for the three campaign periods. When analyzing             and represent the middle of the individual campaign periods.
the radiative impact of BC on the basis of daily averages, the        Figure 1b shows the profiles of relative humidity used for
magnitude of the incident solar radiation and the length of           the simulations. PAMARCMiP was characterized by rather
the day play a major role. While the early summer condi-              dry air. Only in the boundary layer was an average humidity
tions of ACLOUD were characterized by the polar day and               up to 60 % often observed linked to boundary layer clouds.
SZA between 55 and 78◦ , during ARCTAS the available in-              ACLOUD and ARCTAS showed a higher relative humidity
coming solar radiation was lower due to lower values of the           at a higher altitude of up to 6 km, which indicates the influ-
SZA (minimum at noon of 62.5◦ ). PAMARCMiP was con-                   ence of higher-level clouds.
ducted in the most northern region and earlier in the year,              To test the sensitivity of the BC radiative effects with re-
such that the Sun was about 9.5 h below the horizon and the           spect to cloud occurrence, two cloud layers were syntheti-
minimum SZA was 79◦ at noon. Table 2 summarizes the key               cally included in the atmospheric profiles as illustrated in
characteristics of the three analyzed data sets.                      Fig. 1. The cloud layer properties were based on observa-
   Therefore, the constructed profiles of PAMARCMiP and               tions by Bierwirth et al. (2013), Leaitch et al. (2016), and
ACLOUD are assumed to be representative for Arctic early              Blanchard et al. (2017) to represent typical Arctic cloud con-
spring and early summer conditions, respectively.                     ditions. A low-level liquid water cloud was placed between
                                                                      500 m and 1.4 km representing the humid boundary layer ob-
                                                                      served during PAMARCMiP. The liquid water content in-
2.2    Atmospheric radiative transfer model
                                                                      creases from 0.1 g m−3 at cloud base to 0.3 g m−3 at cloud
                                                                      top; the cloud particle effective radius increased from 6 to
To simulate vertical profiles of the spectral upward and              12 µm. The second cloud layer represents a thin ice water
downward irradiance, the library for radiative transfer rou-          cloud and was positioned between 5 and 5.5 km representing
tines and programs (libRadtran, Emde et al., 2016; Mayer              the higher-level clouds observed during ACLOUD and ARC-
and Kylling, 2005) was used (http://www.libradtran.org/               TAS. This thin cloud was assumed to be homogeneous with
doku.php, last access: 10 June 2020). The model also pro-             an ice water content of 0.006 g m−3 and an effective cloud
vides the ratio of the direct to global irradiance fdir/glo , which   particle radius of 40 µm, according to airborne measurements
is required as a boundary condition of the snowpack radiative         reported by Wyser (1998) and Luebke et al. (2013). Optical
transfer model. As a solver for the radiative transfer equation,      properties of the liquid cloud droplets were calculated from
the Discrete Ordinate Radiative Transfer solver (DISORT) 2            Mie theory, while the ice crystal optical properties are based
(Stamnes et al., 2000) routine running with 16 streams was            on Fu (2007). The assumed cloud properties correspond to a
chosen.                                                               cloud optical thickness of 15 for the water cloud and 0.2 for
   For the calculations, a plane-parallel atmosphere was as-          the thin ice cloud.
sumed, which is justified for the Arctic conditions during the
three campaigns. Using a pseudo-spherical geometry in li-             2.3   Snowpack radiative transfer model
bRadtran would change the broadband downward irradiance
by less than 0.1 % (0.7 %) for a calculation with a SZA of            The Two-streAm Radiative TransfEr in Snow model
60◦ (75◦ ). The vertical resolution of the simulated irradi-          (TARTES, https://github.com/ghislainp/tartes, last access:
ances was adjusted to the measured BC profiles, ranging be-           6 February 2020) was used to simulate the radiative trans-
tween 100 m and 1 km. The spectral resolution of the simu-            fer through the snowpack (Libois et al., 2013, 2014). In
lations was set to 1 nm covering a wavelength range between           TARTES, the snow profile is constructed of a predefined
350 and 2400 nm. The extraterrestrial spectrum was taken              number of horizontally homogeneous snow layers, which al-
from Gueymard (2004). The BC optical properties including             lows us to account for the stratification of the snowpack. To
the refractive index, density, extinction coefficient, single-        consider the single-scattering properties of each layer, the
scattering albedo, and scattering phase function from the             method described by Kokhanovsky and Zege (2004) is ap-
OPAC aerosol database were applied (Hess et al., 1998). Cor-          plied in TARTES. To solve the radiative transfer equation,
responding to the campaign average BC profiles, the range of          the delta-Eddington approximation (Joseph et al., 1977) is
the SZA values was set to values representing the campaign            used. As a result, TARTES computes the spectral surface
conditions (see Table 2).                                             albedo and the profile of the irradiance within the snowpack.

Atmos. Chem. Phys., 20, 8139–8156, 2020                                                https://doi.org/10.5194/acp-20-8139-2020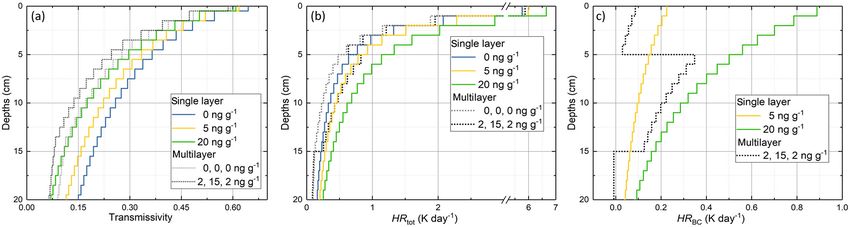
T. Donth et al. : Solar radiative effects of black carbon                                                                             8143

Table 2. Region, period, solar zenith angle range, and maximum BC particle mass concentration and mean optical depth of BC at the 500 nm
wavelength characterizing the three data sets obtained within ARCTAS, ACLOUD, and PAMARCMiP.

                                            ARCTAS                     ACLOUD                    PAMARCMiP
         Region                             Alaska/northern Canada     Svalbard/Arctic Ocean     Northern Greenland/ Arctic Ocean
         Latitude (◦ )                      71                         78                        82
         Period                             April 2008                 May–June 2017             March–April 2018
         SZA (◦ )                           63–90                      55–78                     79–90
         Night length (h)                   8.6                        0.0                       9.4
         Max. BC concentration (ng m−3 )    149                        13                        117
         BC optical depth at 500 nm         0.008                      0.0003                    0.006
         Data reference                     Jacob et al. (2010)        Ehrlich et al. (2019)     Herber (2019)

Figure 1. Mean profiles of atmospheric BC particle mass concentration (a) and relative humidity (b) averaged for each of the three campaigns
(ACLOUD, ARCTAS, and PAMARCMiP) as used for the radiative transfer simulations. Horizontal bars indicate the standard deviation. The
positions of the two implemented cloud layers (blue shaded area) are marked.

As the boundary condition, the SZA and fdir/glo have to be                 The input parameters of the snowpack model are summa-
predefined. For each of the snow layers, the optical and mi-            rized in Table 3. For the bottom layer, a soil albedo of 0.3
crophysical properties have to be given, such as the snow               was assumed representing the reflection properties below the
density (ρice ), the specific surface area (SSA), and the snow          snowpack. The impact of the soil albedo on the albedo of the
grain shape parameters, which represents a mixture of dif-              snow surface depends on the depth of the overlying snow-
ferent grains as suggested by Libois et al. (2013). Further-            pack. Sensitivity studies have shown that for snow depths of
more, the specific values of the so-called absorption enhance-          more than 20 cm the albedo of a snow surface is indepen-
ment parameter B = 1.6 and the geometric asymmetry fac-                 dent of the choice of the soil albedo below. In this study the
tor g G = 0.85 were applied. The specific surface area can be           snowpack depth was set to 1 m thickness. Reference simu-
translated into the optical snow grain size ropt by                     lations assuming a pristine homogeneous snow layer were
                                                                        performed. Simulations including BC impurities were based
              3                                                         on BC particle mass concentrations summarized in Table 1
ropt =              .                                          (1)
         ρice · SSA                                                     (Doherty et al., 2010; Forsström et al., 2013; Pedersen et al.,
                                                                        2015) and observations during PASCAL and PAMARCMiP.
   TARTES allows us to consider impurities in each snow
                                                                        For the simulations of a single homogeneous snow layer, typ-
layer, which are characterized by the impurity type and mass
                                                                        ical BC particle mass concentrations of 5 and 20 ng g−1 were
concentration. The impurities are externally mixed and as-
                                                                        chosen. The default values of snow density and SSA were
sumed to interact by Rayleigh scattering. To simulate a BC-
                                                                        based on measurements during PASCAL and PAMARCMiP
containing snow layer, the complex refractive index and the
                                                                        and were set to 300 kg m−3 and 20 m2 kg−1 , respectively. To
density of BC particles given by Bond et al. (2013) are ap-
                                                                        analyze the sensitivity of the snow surface albedo with re-
plied.

https://doi.org/10.5194/acp-20-8139-2020                                                   Atmos. Chem. Phys., 20, 8139–8156, 2020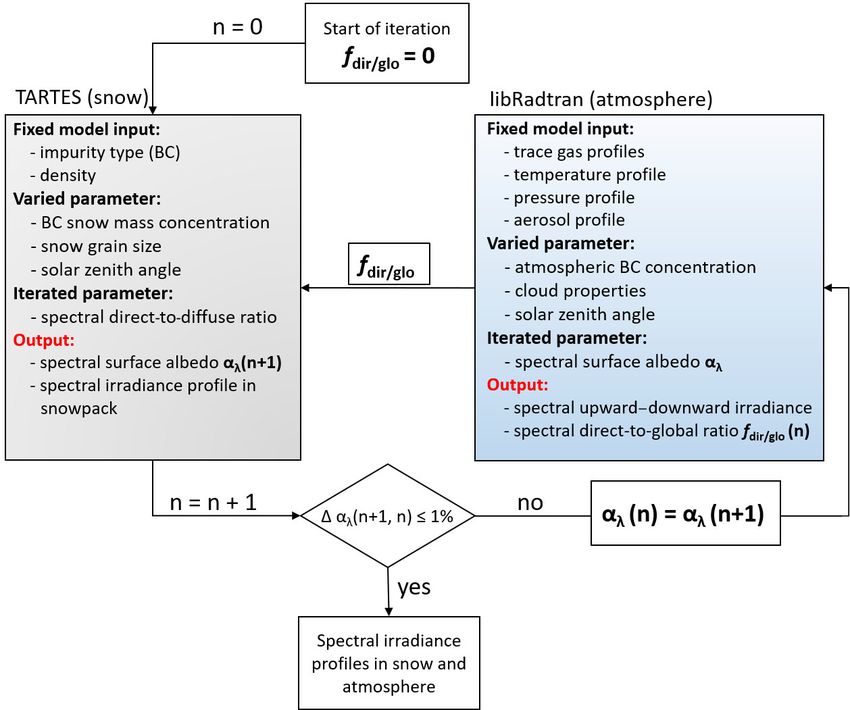
8144                                                                  T. Donth et al. : Solar radiative effects of black carbon

spect to the snow grain size, SSA values of 5 and 60 m2 kg−1        bRadtran, which is in turn used to readjust TARTES, starting
were used. The vertical model resolution was set to 1 cm.           a revised iteration (n + 1) to calculate a new spectral surface
   In addition to the simulations of a homogeneously mixed          albedo αλ (n + 1). This procedure was repeated until the de-
snow layer, a second model setup was used to consider a mul-        viation of the surface albedo calculated in the previous step
tilayer snowpack. Pit measurements in Greenland (Doherty            (n) and calculated in the revised step (n + 1) decreases below
et al., 2010) identified typical multilayer structures, where       1 %. Exemplarily, Fig. 3 illustrates the change of the spectral
BC accumulated in a melting layer approximately 10 cm be-           surface albedo for a cloudless case without atmospheric BC
low the surface. Referring to these measurements, the snow-         and a SZA of 60◦ . The BC mass concentration in snow was
pack of the second model setup consists of three snow layers.       set to 5 ng g−1 . Two iteration steps were necessary in this par-
The top layer is 5 cm and the BC-containing middle layer is         ticular example to match the 1 % termination criterion, which
10 cm thick. The bottom layer below continues to 1 m depth.         is a typical number for all studied cases. Starting with purely
For this multilayer approach, BC was included in the mid-           diffuse conditions allows faster calculations in cloudy cases.
dle layer, representing an aged melting layer in which im-          This quick convergence of the iteration enables the consid-
purities had accumulated (SSA = 20 m2 kg−1 , snow density           eration of different cloud properties and atmospheric condi-
of 350 kg m−3 , and a BC mass concentration of 15 ng g−1 ).         tions and facilitates the calculation of the radiative effects of
The top layer was assumed to be of fresh and clean snow             BC particles in the atmosphere and within the snowpack si-
with SSA = 40 m2 kg−1 , a snow density of 250 kg m−3 , and          multaneously. The assumption of a pure diffuse illumination
a BC mass concentration of 2 ng g−1 , representing measure-         in the initial run caused no significant difference of the cal-
ments from the PASCAL campaign. The aged snow layer at              culated visible snow albedo to the first and second iteration
the bottom was characterized by an enhanced snow grain size         step. In contrast, the iterated direct-to-global ratio adjusts the
and density of SSA = 10 m2 kg−1 and ρice = 450 kg m−3 , re-         snow albedo in the near infrared because the direct fraction
spectively, and a BC mass concentration of 2 ng g−1 .               is quickly approaching unity in this spectral range.

2.4    Iterative coupling                                           2.5   Quantities used to characterize the impact of BC
                                                                          particles
The surface albedo is an important boundary condition to
simulate the radiative transfer in the atmosphere. It depends       In the following, the surface radiative forcing of BC particles
on the illumination conditions defined by the solar zenith an-      and profiles of heating rates are analyzed. The total radia-
gle, the spectral distribution of downward irradiance, and the      tive forcing at the surface 1Ftot is separated into the forcing
ratio of direct-to-global irradiance (e.g., Wiscombe and War-       of BC particles suspended in the atmosphere 1Fatm and the
ren, 1980; Gardner and Sharp, 2010; Stapf et al., 2019). The        forcing of BC particles deposited in the snowpack 1Fsnow .
transition from cloudy to cloudless atmospheric conditions          1Fsnow is defined by the difference of the net irradiance
increases the direct-to-global ratio (fdir/glo ) and the contri-    (downward minus upward solar irradiance) if BC is consid-
bution of short wavelengths to the broadband downward ir-           ered in the snow layer (Fnet,BC ) and a clean reference case
radiance (Warren, 1982). Therefore, a cloud cover typically         without BC in the snow layer (Fnet,clean ). Similarly, 1Fatm is
increases the broadband surface albedo. For example, simu-          defined as the difference between the net irradiances derived
lations with TARTES assuming cloudless and cloudy condi-            for BC in snow and the atmosphere and the atmospheric BC-
tions changed the broadband snow surface albedo from about          free reference case:
0.8 to 0.9 for a SZA of 60◦ and a snowpack (no impuri-
ties) characterized by SSA = 20 m2 kg−1 . As clouds absorb
solar radiation mostly at wavelengths larger than 1000 nm,          1Fi = Fnet,BC − Fnet,clean ,                                  (2)
the shorter wavelengths, where BC particles strongly absorb
solar radiation, become more relevant. Because of the signif-       with index “i” standing for “tot”, “atm”, or “snow”. For the
icant surface–cloud interactions, the atmospheric and snow-         separated forcings, Fnet,clean refers to either a clean atmo-
pack radiative transfer models need to be coupled, interac-         sphere or a clean snow layer, while the other part does con-
tively. Therefore, an iterative method coupling libRadtran          sider BC particles. The default case of a clean atmosphere
and TARTES via their boundary conditions, surface albedo,           used a BC mass concentration in the snow layer of 5 ng g−1 .
and direct-to-global ratio (fdir/glo ) of the incident radiation,   Vice versa, the default case of a clean snow layer assumed
was applied. Both parameters were transferred between the           the atmospheric BC profile of the ACLOUD campaign. For
models as schematically illustrated in Fig. 2.                      1Ftot , the clean reference assumed both a pristine atmo-
   In the first iteration step, only diffuse radiation was as-      sphere and pristine snow layer.
sumed (fdir/glo = 0) to calculate the snow surface albedo by           The calculation of atmospheric and snow heating rate pro-
TARTES, which subsequently serves as input for the libRad-          files H R(z) (K d−1 ) was based on the net irradiances at the
tran simulations. Then a new spectral direct-to-global ratio        top (t) and bottom (b) of selected atmospheric or snow layer
representing the atmospheric conditions was calculated by li-       z, the layer density ρ(z), the specific heat capacity under con-

Atmos. Chem. Phys., 20, 8139–8156, 2020                                               https://doi.org/10.5194/acp-20-8139-2020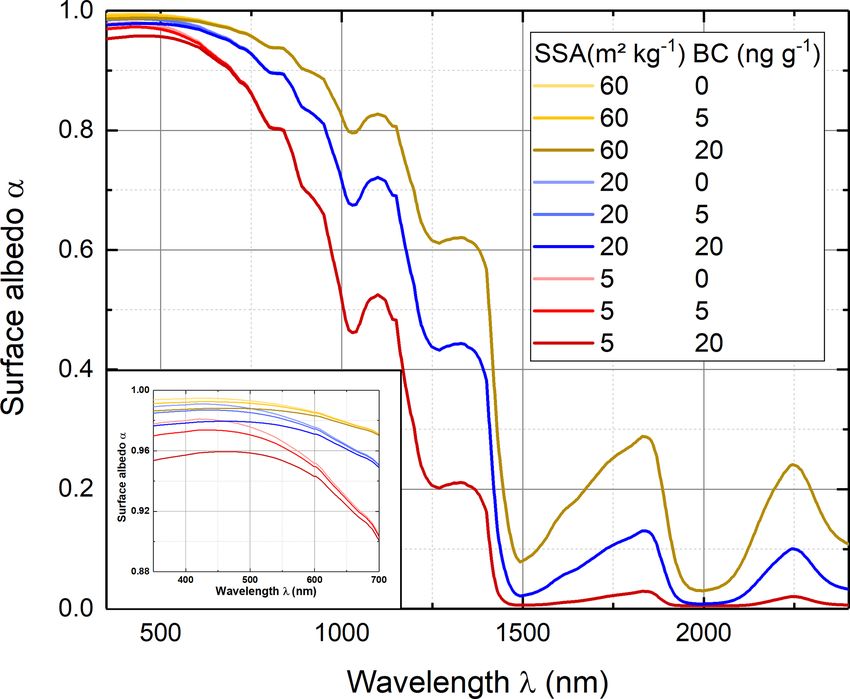
T. Donth et al. : Solar radiative effects of black carbon                                                                              8145

Table 3. Snowpack model setups for the single-layer and multilayer cases. The default SSA for the single-layer case is 20 m2 kg−1 .

                                                           Single layer                    Multilayer
                                                                           Top layer     Middle layer   Bottom layer
                       Depth (cm)                                   100            5              10              85
                       BC mass concentration (ng g−1 )             5/20            2              15               2
                       SSA (m2 kg−1 )                           5/20/60           40              20              10
                       Density (kg m−3 )                            300          250             350             450

Figure 2. Schematics of the coupling of TARTES (gray box) and libRadtran (blue box) by exchanging the spectral surface albedo and the
direct-to-global ratio. The list of varied parameters addresses the variables which were changed between the different realizations. Only the
iterated parameters fdir/glo and αλ were adjusted within an individual iteration cycle.

stant pressure cp , and the layer thickness (zt − zb ):                   HRclean (z):
           1T       Fnet (zt ) − Fnet (zb )
HR(z) =       (z) =                               .             (3)       HRBC (z) = HRtot (z) − HRclean (z).                            (4)
           1t       ρ(z) · cp · (zt − zb )
For atmospheric profiles, the vertical resolution from the BC                If not indicated differently, radiative effects reported in
profiles was used. Similarly, the heating rate profiles within            this study refer to daily means accounting for the change of
the snowpack were calculated applying Eq. (3) by accounting               the SZA and the nighttime. Therefore, simulations were per-
for the snow density (set to 300 kg m−3 ) and the specific heat           formed for a full diurnal cycle with a temporal resolution of
capacity of ice cp,snow = 2060 J kg−1 K−1 at a temperature of             5 min. The simulated upward and downward irradiance were
0 ◦ C. The layer thickness within TARTES and therefore the                averaged. Then these daily mean irradiances were applied to
resolution of the heating rate profiles is 1 cm.                          calculate mean values of 1Ftot , 1Fatm , 1Fsnow , HRtot (z),
   To separate the contribution of BC particles to the to-                and HRBC (z).
tal heating rate, the effective BC heating rate HRBC (z) was
calculated as the difference between the total heating rate
HRtot (z) and the heating rate of the clean reference case

https://doi.org/10.5194/acp-20-8139-2020                                                    Atmos. Chem. Phys., 20, 8139–8156, 2020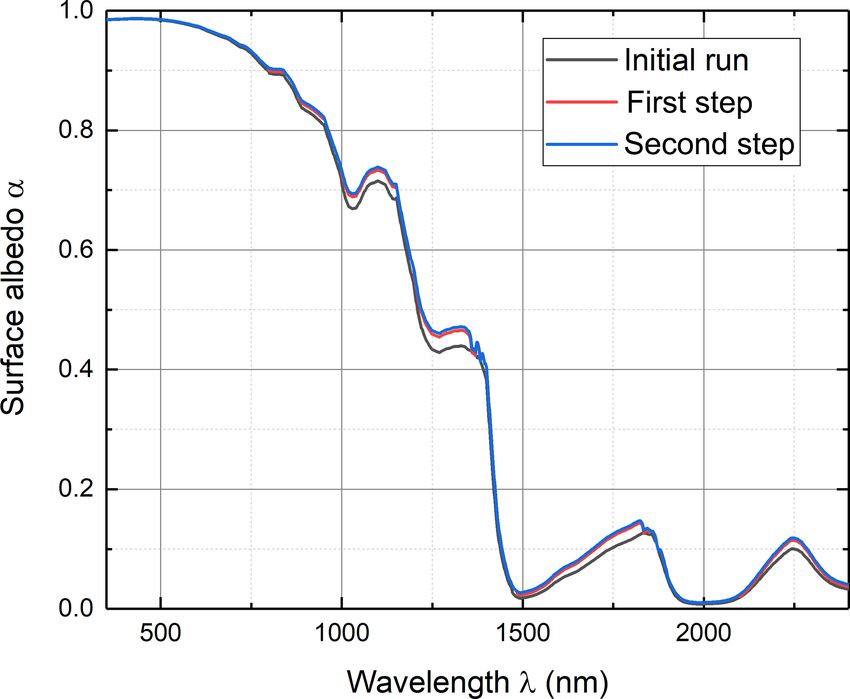
8146                                                                   T. Donth et al. : Solar radiative effects of black carbon

Figure 3. Change of the spectral snow albedo for cloudless con-      Figure 4. Spectral surface albedo of snow for cloudless conditions
ditions with a SZA of 60◦ due to the iterative adjustment by the     and a SZA of 60◦ for different SSA and BC particle mass concen-
coupled atmosphere and snow radiative transfer models. The initial   trations. The inlay shows an enlargement of the spectral albedo be-
run assumes a direct-to-global ratio of zero.                        tween 350 and 700 nm.

3     Results                                                        allow for a deeper penetration of the incident radiation into
                                                                     the snowpack. Since the penetration depth for aged snow is
3.1     Radiative impact of BC at surface level                      deeper, the probability is higher that the radiation gets ab-
                                                                     sorbed by the BC particles, leading to a decrease in the spec-
3.1.1    Effect on surface albedo                                    tral surface albedo.
                                                                        In the same way, the radiative forcing of BC particles em-
The reduction of the snow surface albedo by BC impuri-               bedded in the snow layer was calculated for overcast cloudy
ties depends on the snow grain size. Here, changes of the            conditions (predefined low-level liquid water cloud case) to
snow surface albedo due to the combination of BC impuri-             assess the relevance of changes of the BC mass concentra-
ties and snow grain size variations were evaluated for Arc-          tion compared to variations in SSA and the illumination con-
tic conditions. The single-layer snowpack setup, as defined          ditions. To estimate the relevance for the surface energy bud-
in Sect. 2, was used together with atmospheric properties            get, the solar broadband forcing was analyzed by calculat-
representing the ACLOUD conditions. The SZA was set to               ing the broadband albedo αbb . Therefore, the spectral albedo
a constant value of 60◦ . Figure 4 shows the spectral snow           simulated by TARTES and the spectral downward irradiance
                                                                       ↓
albedo for variable BC particle mass concentrations (0, 5,           Fλ (λ) simulated by libRadtran were used:
and 20 ng g−1 ) as calculated with TARTES. The selected                      R           ↓
SSA values represent different snow types, as freshly fallen                     α(λ) · Fλ (λ) dλ
                                                                     αbb =                        .                                 (5)
snow with small snow grains (SSA = 60 m2 kg−1 ), aged                             R ↓
                                                                                    Fλ (λ) dλ
snow which has undergone snow metamorphism (SSA =
5 m2 kg−1 ) when surface temperature approaches 0 ◦ C, and              The calculated broadband surface albedo values are sum-
moderately aged snow without melting (SSA = 20 m2 kg−1 ),            marized in Table 4 for the cloudy and cloudless cases, re-
which was considered the default case. As expected, the              spectively. For both cases, even the most extreme BC mass
highest values of surface albedo were obtained for the case          concentration reduced the surface albedo by less than 1 %.
with clean and fresh snow. Adding BC particles caused a de-          Contrarily, the snow grain size and the presence of clouds
crease in the spectral surface albedo, in particular in the visi-    cause significant changes of the snow albedo. The differ-
ble spectral range up to 700 nm, shown in the enlargement of         ence of the broadband surface albedo between fresh and aged
Fig. 4. In contrast, the near-infrared spectral range was dom-       snow ranges up to 0.12 and 0.08 for cloudless and cloudy
inated by ice absorption, which is affected by the SSA (grain        conditions, respectively, which is of the same order of mag-
size).                                                               nitude as the effect of clouds (0.12 for fresh snow and 0.07
   From the simulations shown in Fig. 4 it becomes appar-            for aged snow). Therefore, for Arctic conditions, the impact
ent that the decrease in surface albedo with increasing BC           of BC impurities on the broadband snow albedo is of mi-
mass concentration is stronger for aged snow than for fresh          nor importance, compared to the impact of modifying the
snow. Fresh snow with smaller grains leads to an enhanced            snow grain size. Also, Warren and Wiscombe (1980) and
backscattering of the incident radiation, while larger grains        Warren (2013) found only a small reduction of the broadband

Atmos. Chem. Phys., 20, 8139–8156, 2020                                                  https://doi.org/10.5194/acp-20-8139-2020
T. Donth et al. : Solar radiative effects of black carbon 8147
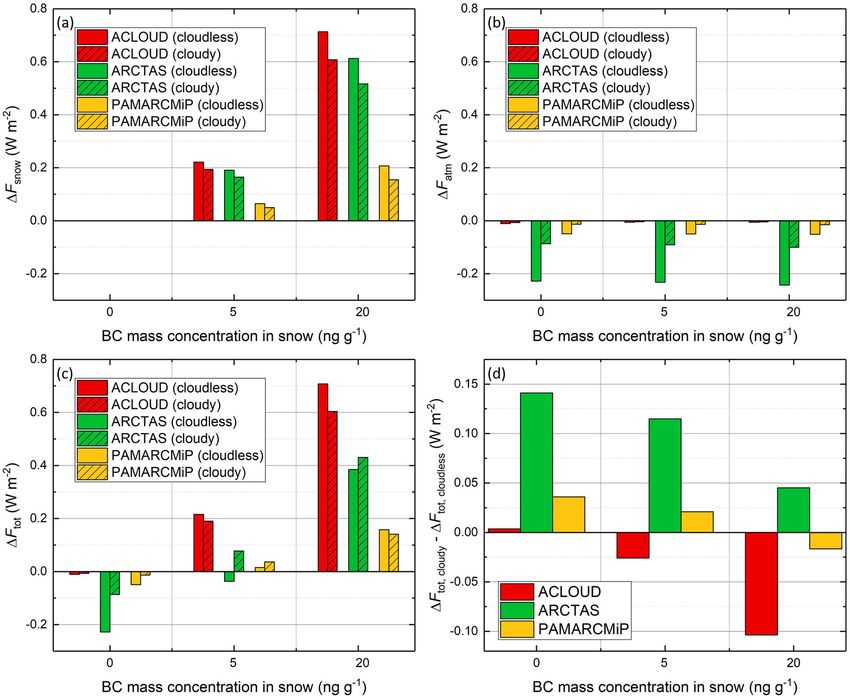
ing 1Fatm was calculated. Additionally, the total radiative
forcing 1Ftot combining the atmospheric and snow BC was
analyzed. Figure 6 summarizes the daily averaged 1Fsnow
(panel a), 1Fatm (panel b), and 1Ftot (panel c) for different
BC particle mass concentrations in snow (0, 5, 20 ng g−1 ) on
cloudless and cloudy conditions.
The BC particles embedded in snow lead to warming ef-
fects of up to 0.7 W m−2 for high BC mass concentrations of
20 ng g−1 and ACLOUD conditions. For ARCTAS 1Fsnow
was slightly lower and for PAMARCMiP reduced by a factor
of about 3. This difference is caused by the lower maximum
Sun elevation during PAMARCMiP (location in higher lati-
tude) resulting in a lower amount of available incoming solar
irradiance compared to ACLOUD and ARCTAS (see range
of SZA in Table 2).
Atmospheric BC particles reduce the incident solar ra-
diation at the surface due to extinction, such that the at-
Figure 5. Solar surface radiative forcing of BC impurities in mospheric radiative forcing 1Fatm is negative in all sce-
snow 1Fsnow calculated for different SSA values and BC particle narios (Figure 6b). This cooling at the surface is strongest
mass concentrations. The atmospheric conditions correspond to the with values up to −0.2 W m−2 in cloudless conditions for
ACLOUD case with a fixed SZA of 60◦ . Horizontal red lines indi- the ARCTAS case, where the largest atmospheric BC par-
cate typical Arctic conditions with rather clean and more polluted
ticle concentrations were observed. Despite having a BC
snow; the vertical line represents the most typical SSA.
optical depth of similar magnitude, the PAMARCMiP case
(AODBC = 0.006) shows a weaker radiative cooling com-
albedo between 0 % and 1 % for fresh snow and 0 %–3 % for pared to the ARCTAS case (AODBC = 0.008) caused by the
aged snow when adding BC with a mass concentration of higher solar zenith angles in PAMARCMiP. Minor cooling
34 ng g−1 to the clean snow. of less than −0.02 W m−2 was observed for the ACLOUD
case, where the atmosphere was rather clear with significant
3.1.2 Surface radiative forcing reduced atmospheric BC particle concentrations (factor of
10 lower than during ARCTAS). Comparing the simulations
The decrease in the snow surface albedo due to an increase with different BC mass concentrations in snow showed only
in BC particle mass concentration or snow grain size directly few effects of the surface properties on the radiative forcing
alters the surface radiative forcing 1Fsnow . To quantify these of atmospheric BC. A slight decrease in 1Fatm with increas-
radiative effects, 1Fsnow was first calculated for a fixed so- ing BC mass concentrations was observed for the ARCTAS
lar zenith angle of 60◦ . A typical Arctic range of BC parti- case, indicating that a lower surface albedo enhances the ra-
cle mass concentrations in snow and SSA values assuming diative forcing of atmospheric BC particles.
the ACLOUD atmospheric conditions was applied. Figure 5 The cooling effect of atmospheric BC counteracts the
shows a contour plot of 1Fsnow for combinations of SSA and warming effect of BC particles in snow and can lead to a
BC particle mass concentrations. For a BC particle mass con- positive and negative total radiative forcing. Figure 6c shows
centration of 5 ng g−1 in snow representing clean conditions the total radiative forcing 1Ftot for all cases. For BC mass
and a SSA larger than 20 m2 kg−1 , 1Fsnow ranges between concentration of 20 ng g−1 , all cases showed a total warm-
0.4 and 0.7 W m−2 . Higher BC particle mass concentrations ing effect when the warming of BC in the snowpack ex-
increase 1Fsnow depending on the snow grain size or SSA. ceeds the cooling by atmospheric BC. The strongest warm-
The strongest increase in the solar radiative warming was cal- ing effect of up to 0.7 W m−2 was found for the ACLOUD
culated for small SSA values, corresponding to larger snow case which is characterized by the pristine atmospheric con-
grain sizes. With the larger penetration depth for a smaller ditions in the Arctic summertime. For less polluted snow
SSA, more radiation can be absorbed by the BC particles. (5 ng g−1 ), warming and cooling scenarios can occur depend-
To compare the radiative forcing at the surface of atmo- ing on the concentration of atmospheric BC (ARCTAS shows
spheric BC particle profiles observed during the three air- a slight cooling) and the solar zenith angle (ACLOUD shows
craft campaigns ACLOUD, PAMARCMiP, and ARCTAS, a significant warming effect). 1Ftot calculated for ACLOUD
the daily averaged surface radiative forcing was then an- even exceeds the warming effect of PAMARCMiP for the
alyzed. To limit the degree of freedom, the SSA was set higher BC mass concentration in the snow layer. This clearly
to a default value of SSA = 20 m2 kg−1 representative for demonstrates that the competition between the individual BC
snow-covered Arctic sea ice. To estimate the relevance of radiative forcings 1Fatm and 1Fsnow is strongly driven by
the atmospheric BC particles, their separated radiative forc-
https://doi.org/10.5194/acp-20-8139-2020 Atmos. Chem. Phys., 20, 8139–8156, 20208148 T. Donth et al. : Solar radiative effects of black carbon
Table 4. Broadband surface albedo (αbb ) of fresh (SSA = 60 m2 kg−1 ) and aged snow (SSA = 5 and 20 m2 kg−1 ) depending on the BC
particle mass concentration and illumination condition.
Cloudless case αbb Cloudy case αbb
SSA (m2 kg−1 ) BC mass concentration (ng g−1 ) BC mass concentration (ng g−1 )
0 5 20 0 5 20
5 0.76 0.76 0.75 0.88 0.87 0.87
20 0.83 0.83 0.82 0.92 0.92 0.92
60 0.87 0.87 0.87 0.95 0.95 0.94
solar zenith angle and the available solar radiation and is less The PAMARCMiP case, characterized by the low Sun
affected by the BC concentrations itself. elevation, in general, showed a reduced effect by clouds.
The available solar irradiance is strongly affected by the Here, the reduction of the cooling effect of atmospheric BC,
presence of clouds. Therefore, the impact of clouds on the 1Fatm , and the increase in the BC snow forcing, 1Fsnow ,
BC radiative forcing was analyzed. Two cloud layers as de- compete with each other and result in different total cloud
fined in Sect. 2.2 were implemented in the simulations and radiative effects. Model runs with and without the upper
considered in the calculation of 1Ftot/atm/snow (clean cloudy ice cloud layer did not show any significant difference in
and polluted cloudy case in Eq. 2) to extract the pure BC 1Ftot/atm/snow , which allows the conclusion that mainly the
radiative forcing. In Fig. 6 the BC radiative forcing of the presence of the low liquid water clouds affects the radiative
cloudy scenarios are shown by the shaded bars. The magni- forcing of BC particles.
tudes of 1Fsnow (panel a) and 1Fatm (panel b) are always In summary, the comparison of the radiative forcing by BC
reduced by the presence of clouds. 1Fsnow drops by about particles in snow and the atmosphere with typical concentra-
15 % in all cases (0.1 W m−2 for ACLOUD and ARCTAS tions and mass concentrations observed in Arctic spring and
and high BC mass concentration in snow), while 1Fatm in- summer is rather small compared to other parameters (SZA,
creases by more than 50 %, which amounts for ARCTAS to grain size) which contribute to solar cooling or heating at the
an absolute increase of 0.14 W m−2 . Clouds reduce 1Fsnow surface level. The highest radiative cooling of BC particles
because less radiation reaches the surface and can be ab- was in the range of 1 W m−2 and is estimated for low SZA,
sorbed by BC particles in the snowpack. The shift from a high BC particle mass concentrations, and large grains.
mostly direct illumination of the snow surface by the Sun to
a diffuse illumination below the clouds is less significant as 3.2 Vertical radiative impact of BC particles in the
demonstrated in Table 4. atmosphere and snow
These different cloud effects counterbalance in the total
radiative forcing 1Fatm (Fig. 6c). To illustrate the total effect 3.2.1 Heating rate profiles in the atmosphere
by clouds, Fig. 6d shows the difference between cloudy and
cloudless simulations. In all scenarios, still slight differences To quantify the absorption of solar radiation by Arctic at-
between cloudy and cloudless conditions were observed, but mospheric BC particles and consequent local warming ef-
with different directions. For the ACLOUD case, the clouds fects, profiles of the heating rates were simulated for the
reduce the warming effect of BC particles mainly due to a three cases ACLOUD, ARCTAS, and PAMARCMiP. Based
reduction of radiation that reaches the surface. As almost no on simulations with and without atmospheric BC, the total
atmospheric BC was present, only 1Fsnow is affected. heating rate HRtot (z) and the effective heating rate of BC
For the ARCTAS cases, the clouds always increased particles HRBC (z) were calculated (see Eqs. 3 and 4). Fig-
1Ftot . For a BC mass concentration of 5 ng g−1 even the sign ure 7 shows daily averaged profiles of HRtot (z) and HRBC (z)
shifts from a total cooling to a total warming effect of BC. calculated for the three BC profiles. Solid lines represent
For ARCTAS, with high atmospheric BC concentrations, the the cloudless scenarios while dotted lines show simulations
presence of clouds mainly reduce the cooling effect of the where the two predefined cloud layers were added. The loca-
atmospheric BC, 1Fatm . As the atmospheric BC layer was tion of the clouds is indicated by the gray shaded area. The
located mostly above the cloud, the radiative effect of the highest total heating rates in cloudless conditions were found
clouds, which is typically much stronger than the absorption for the ACLOUD case, with maximum values of more than
by the atmospheric BC, reduces the significance of the atmo- 1.2 K d−1 at about 2–4 km altitude. This altitude range was
spheric BC forcing. For higher BC mass concentrations in characterized by enhanced humidity leading to a stronger
the snow, the increase in 1Ftot by adding a cloud becomes absorption of solar radiation by the water vapor. The spring
weaker because 1Fsnow simultaneously slightly decreases in campaigns ARCTAS and PAMARCMiP were characterized
cloudy conditions. by lower water vapor concentrations (factor of 4 and 10
Atmos. Chem. Phys., 20, 8139–8156, 2020 https://doi.org/10.5194/acp-20-8139-2020T. Donth et al. : Solar radiative effects of black carbon 8149 Figure 6. Daily mean of the solar surface radiative forcing simulated for the conditions of the three campaigns ACLOUD, PAMARCMiP, and ARCTAS assuming a fixed SSA of 20 m2 kg−1 . The separated forcings by BC embedded in snow (1Fsnow , panel a), atmospheric BC (1Fatm , panel b), and the total forcing (1Ftot , panel c) are shown. The daily mean solar radiative forcing of BC in cloudy conditions is displayed by shaded bars. The difference of 1Ftot between simulations with and without clouds is given in (d). lower than for ACLOUD, respectively) and reduced inci- heating rates were observed only for the ARCTAS and PA- dent solar radiation due to the time of year and latitude of MARCMiP cases with values up to 0.1 K d−1 . The profiles the observations. This leads to significant lower values of of HRBC (z) are strongly correlated with the vertical distri- HRtot (z) compared to the ACLOUD case. While ARCTAS bution of BC particles in the measured profiles. Maximum showed a similar vertical pattern with maximum HRtot (z) HRBC (z) values were located in the pollution layers. The of 0.5 K d−1 in the lower troposphere below 5 km altitude, pollution layer observed during PAMARCMiP at 5 km and the conditions during PAMARCMiP lead to a maximum of the BC layers of ARCTAS above 5 km altitude showed the HRtot (z) of about 0.25 K d−1 located at 5–6 km altitude. This largest relative impact of BC particles where nearly one-fifth corresponds to the rather dry lower troposphere observed in and one-third, respectively, of the total solar heating is at- springtime in the central Arctic. By adding clouds in the sim- tributed to BC absorption. In lower altitudes of the ARC- ulations, the highest HRtot (z) values were observed within TAS case, the enhanced absorption by water vapor reduced the liquid water cloud layer, where solar radiation is absorbed the relative importance of BC particles. For the summer case by the cloud particles. Similar to the cloudless scenarios, the of ACLOUD, HRBC (z) was rather small at all altitudes and ACLOUD case showed the highest values of HRtot (z) with contributed to the total radiative heating by only 10 %. How- up to 4.1 K d−1 at cloud top of the lower liquid cloud layer. ever, in low altitudes, the absolute values of HRBC (z) were The absorption in the ice cloud is less pronounced, and the of the same order for both ACLOUD and the PAMARCMiP. increase in HRtot (z) is significantly lower. This illustrates that the effect of a higher BC particle con- The profiles of the effective BC heating rate HRBC (z) centration during PAMARCMiP was compensated for by the (Fig. 7b) show a completely different pattern compared to dependence of HRBC (z) on the amount of the available in- HRtot (z). In general, HRBC (z) was about 1 order of magni- coming solar radiation and the atmospheric water vapor con- tude lower than HRtot (z) for all three cases. Significant BC centration. https://doi.org/10.5194/acp-20-8139-2020 Atmos. Chem. Phys., 20, 8139–8156, 2020
8150                                                                T. Donth et al. : Solar radiative effects of black carbon

   Adding clouds in the simulations affected HRBC (z) of the      hancement of the snow metamorphism is located, profiles
three cases differently. While the clean atmosphere layer of      of the heating rates within the snowpack HRtot (z) were cal-
ACLOUD and the PAMARCMiP cases shows almost no dif-               culated. To quantify how BC particles deposited in snow
ferences to cloudless conditions, a minor cloud effect was        may change these heating profiles, the effective BC heat-
observed for the ARCTAS case and the polluted layer of PA-        ing rates HRBC (z) were derived in a second step. Figure 8
MARCMiP. In both cases, the ice cloud led to a slight in-         shows HRtot (z) (panel a) and HRBC (z) (panel b) for all cases
crease in HRBC (z) by about 5 % within and above the cloud        in the first 20 cm of the snowpack. For all cases, the to-
layer. This was caused by the enhanced reflection of the in-      tal heating rate rapidly decreases by 1 order of magnitude
coming radiation which led to additional absorption of the        within the first 10 cm of depth. The simulation for the single-
reflected radiation by the atmospheric BC particles. At al-       layer (solid lines) snowpack shows the maximum values of
titudes between the ice and liquid water clouds no signifi-       HRtot (z) which were located in the topmost layers and reach
cant effect by the clouds was observed. Within and below the      values up to 6.6 K d−1 (note the scale break in Fig. 8a).
liquid water cloud HRBC (z) was significantly reduced by al-         Assuming different BC mass concentrations in the single-
most 0.01 K d−1 for the ARCTAS case. This cloud effect was        layer case slightly increases HRtot (z) in the entire column.
caused by the strong reflection of radiation at the cloud top     In the multilayer case, this increase is limited to the upper
leading to a reduction of radiation reaching into and below       part of the profile. This contribution of BC particles to the
the cloud layer.                                                  total radiative heating was quantified by HRBC (z) and shown
   Comparing all simulations, it can be concluded that the        in Fig. 8b. The largest HRBC (z) values were observed for the
absolute radiative effects of atmospheric BC particles are po-    most polluted single-layer case with a BC mass concentration
tentially strongest in early spring when incoming solar radi-     of 20 ng g−1 . For this case, the contribution by BC particles
ation starts to increase and BC particle concentration is still   amounts to almost 0.9 K d−1 in the topmost layer, dropping
high enough. Furthermore, the surface conditions in spring        down to a value of less than 0.1 K d−1 at 20 cm snow depth.
were dominated by snow and ice coverage, which causes an          Compared to the total radiative effect, HRBC (z) contributes
increase in the amount of upward radiation contributing to        about 15 % to the heating rate at the top snow layer and 40 %
the atmospheric heating rate. In late spring and summer, the      to the heating in the base layer. For the typical Arctic BC
BC particle concentration decreased rapidly, while the ab-        mass concentration of 5 ng g−1 , this contribution of BC par-
sorption by water vapor became more and more dominant             ticles is significantly lower, ranging between 3 % and 20 %.
with increasing temperatures.                                        The multilayer cases are characterized by smaller snow
                                                                  grains in the top layer (SSA = 40 m2 kg−1 ) compared to the
3.2.2   Heating rate profiles in the snowpack                     single-layer cases (SSA = 20 m2 kg−1 ) and, therefore, shows
                                                                  reduced values of HRtot (z). According to the structure of the
Not only the snow albedo but also the transmission of ra-         snowpack, HRBC (z) is largest in the layer of the highest BC
diation through the snowpack is affected by BC particles.         mass concentration. Beneath this layer (z < 15 cm) the heat-
For the atmospheric boundary conditions of the ACLOUD             ing rates for the pristine and polluted cases are almost simi-
case, the radiative transfer in the snowpack was simulated        lar (HRBC (z) ≈ 0 K d−1 ). In this base layer, the largest snow
and analyzed for different single-layer and multilayer sce-       grains are assumed (lowest SSA), which increases the ab-
narios as introduced in Table 3. The transmissivity was cal-      sorption of radiation by the snow ice water.
culated from the ratio of the downward irradiance in the             Based on these results, it becomes evident that the absorp-
snow layer to the downward irradiance at the top of the snow      tion of solar radiation by the ice water of the snow grains
layer. Figure 8a shows the transmissivity profiles of solar ra-   dominates the total heating rate in the snowpack, especially
diation within the snowpack. The homogeneous single-layer         at the top layer, where most radiation is absorbed. There-
reference case without BC particles (SSA = 20 m2 kg−1 ) il-       fore, in Arctic conditions the snow grain size typically plays
lustrates the general decrease in transmissivity, which is re-    a larger role than the concentration of BC particles embedded
duced to 0.3 in 20 cm snow depth. Adding a typical Arc-           in snow. To estimate if BC particles can accelerate the snow
tic BC concentration of 5 ng g−1 reduces the transmissivity       metamorphism, coupled snow physical models need to be ap-
to almost 0.2. This obviously may have an impact on the           plied (e.g., Tuzet et al., 2017). However, compared to the re-
radiative processes below the snowpack, in and below the          sults reported by Tuzet et al. (2017), who studied alpine snow
sea ice as discussed by, e.g., Tuzet et al. (2019) and Marks      with at least a magnitude higher BC mass concentrations, for
and King (2014). The inhomogeneous multilayer case shows          Arctic conditions it is likely that the self-amplification of the
in general lower transmissivities due to the enhanced re-         snow metamorphism is dominated by the reduction of the
flection of the smaller snow grains at the top of the layer       surface albedo.
(SSA = 60 m2 kg−1 down to 5 cm depth) but also indicates a           Simulations in cloudy conditions (not shown here) re-
significant dimming effect of the BC particles.                   sulted in a reduced HRtot (z) and HRBC (z) because the clouds
   To assess, in which layers of the snowpack the strongest       reduce the incoming solar radiation. Similarly, a change of
absorption of solar radiation and, therefore, a potential en-     the solar zenith angle affects the results by changing the

Atmos. Chem. Phys., 20, 8139–8156, 2020                                             https://doi.org/10.5194/acp-20-8139-2020
You can also read


