Health monitoring in birds using bio loggers and whole blood transcriptomics
←
→
Page content transcription
If your browser does not render page correctly, please read the page content below
www.nature.com/scientificreports
Konstanzer Online-Publikations-System (KOPS)
URL: http://nbn-resolving.de/urn:nbn:de:bsz:352-2-1wmrg280kro601
OPEN Health monitoring in birds using
bio‑loggers and whole blood
transcriptomics
Elinor Jax1,2*, Inge Müller1,2, Stefan Börno3, Hanna Borlinghaus4, Gustaw Eriksson5,
Evi Fricke1,2, Bernd Timmermann3, Helene Pendl6, Wolfgang Fiedler1,2, Karsten Klein4,
Falk Schreiber4,7, Martin Wikelski1,2,8, Katharine E. Magor9 & Robert H. S. Kraus1,2
Monitoring and early detection of emerging infectious diseases in wild animals is of crucial global
importance, yet reliable ways to measure immune status and responses are lacking for animals in the
wild. Here we assess the usefulness of bio-loggers for detecting disease outbreaks in free-living birds
and confirm detailed responses using leukocyte composition and large-scale transcriptomics. We
simulated natural infections by viral and bacterial pathogens in captive mallards (Anas platyrhynchos),
an important natural vector for avian influenza virus. We show that body temperature, heart rate
and leukocyte composition change reliably during an acute phase immune response. Using genome-
wide gene expression profiling of whole blood across time points we confirm that immunostimulants
activate pathogen-specific gene regulatory networks. By reporting immune response related changes
in physiological and behavioural traits that can be studied in free-ranging populations, we provide
baseline information with importance to the global monitoring of zoonotic diseases.
Wild animals are important reservoirs of a wide range of infectious diseases, of which some have the potential
to spill over to humans (zoonoses)1. Major modern human diseases such as influenza and salmonellosis are
frequently of zoonotic o rigin2. While zoonoses may have major impact on human health, the natural hosts
of these diseases often show little signs of disease upon infection3. This allows for these diseases to persist in
reservoir species with a risk of interspecies transmission to more susceptible host-species. Reservoir host physi-
ology and behaviour during infection affect survival and disease duration in the h ost4 and therefore also affect
the spread of infectious d iseases5. Still little is known about the immune response of reservoir hosts in their
natural environment3. Several hurdles have constrained our understanding of pathogen dynamics and immune
responses in wild reservoir hosts. These include, but are not limited to (1) the scarce availability of toolsets avail-
able for measuring immune responses in free-ranging non-model species in comparison to those available for
well-studied model species6,7, and (2) lack of detailed experimental data from many reservoir species making it
difficult to interpret the results from immunological tests in a field setting3,7.
The innate immune system provides the first line of defence against pathogens. An important part of the
innate immune system is the acute-phase response (APR), a rapid and systemic response activated by trauma,
inflammation, stress and infection8. The APR is triggered by the release of proinflammatory cytokines in immune
cells, and is characterised by a suite of molecular, physiological, and behavioural c hanges9,10. Animals with an
activated APR usually have a febrile response within hours of pathogen e xposure11, but the duration and mag-
nitude of the febrile response differ between host species12–14 and depend on the type of stimuli14–16. Besides
fever, animals usually display sickness behaviours such as lethargy, depression and anorexia during the A PR9,10.
The APR has an important role for the recovery and survival of the host during infection4,17, and may thus affect
the risk of further transmission of infectious a gents5,17. Learning about the APR in reservoir species is therefore
important for understanding their potential role in the spread of zoonotic diseases, and monitoring their APR
in the field could be used as a warning system for disease outbreaks.
1
Department of Migration, Max Planck Institute of Animal Behavior, 78315 Radolfzell, Germany. 2Department
of Biology, University of Konstanz, 78464 Konstanz, Germany. 3Sequencing Core Facility, Max Planck
Institute for Molecular Genetics, 14195 Berlin, Germany. 4Department of Computer and Information Science,
University of Konstanz, 78464 Konstanz, Germany. 5Department of Biology, Lund University, 223 62 Lund,
Sweden. 6Pendl Lab, 6300 Zug, Switzerland. 7Faculty of Information Technology, Monash University,
Clayton, VIC 3800, Australia. 8Centre for the Advanced Study of Collective Behaviour, University of Konstanz,
78464 Konstanz, Germany. 9Department of Biological Sciences and Li Ka Shing Institute of Virology, University of
Alberta, Edmonton, AB T6G 2R3, Canada. *email: ejax@ab.mpg.de
Scientific Reports | (2021) 11:10815 | https://doi.org/10.1038/s41598-021-90212-8 1
Vol.:(0123456789)www.nature.com/scientificreports/
Rapid advancement of bio-logging technologies now allows for the study of physiology and behaviour of
free-living animals18. Bio-loggers that can detect changes in important characteristics of the APR (including body
temperature, movement patterns and energy expenditure) are increasingly being used in wildlife r esearch19, and
thus provide information that could be used for identifying signs and symptoms of disease in reservoir species.
Similarly, rapid advances in and decreased costs of next generation DNA and RNA sequencing technologies now
allow researchers to study the underlying mechanisms of the APR in non-model species, and provides disease
markers for studying immune status and responses in wild populations20–22. While these technological advances
have been used to study changes in behaviour23, physiology24 and regulation of immune genes in free-living
animals25, they have so far not been studied simultaneously during the APR in reservoir species of zoonotic dis-
eases. Studies that define the baseline for these measurements and their deviation during the immune response
in reservoir species will provide a valuable resource for disease monitoring in natural populations.
The aim of this study was to identify reliable and repeatable, integrated multi-scale monitoring methods from
several biological fields that will facilitate ecological immunology studies and disease monitoring in wild bird
reservoirs. Further we wanted to identify k nown20,26 and novel candidate genes that are upregulated during differ-
ent stages of the APR and in response to different pathogens, in tissues that can easily and repeatably be collected
in free-living birds. For this purpose, we experimentally induced immune responses in an important natural
vector for avian influenza virus (AIV), the mallard (Anas platyrhynchos)27,28. While mallards show few signs of
disease when infected with low pathogenic strains of AIV29, they can show clinical signs and symptoms includ-
ing fever, anorexia, neurological signs and death when infected with highly pathogenetic A IV30,31. To study the
APR in mallards, we triggered the immune response in captive mallards using non-infectious immunostimulants
and monitored the response with state-of-the-art bio-loggers measuring 3D acceleration, heart rate, and body
temperature and with high throughput RNA sequencing technologies. Our specific aims were to (1) examine
the magnitude and timing of changes in the bio-logged parameters, (2) assess whether a correspondent immune
response can be detected in global gene expression profiles from whole blood, and (3) determine the specificity
of the immune response to different stimulants, using transcriptomics and gene regulatory network analyses.
Results
Body temperature, heart rate and activity. We challenged mallards with three types of non-infectious
immuno-stimulants, thereby mimicking natural infections by RNA viruses (polyinosinic:polycytidylic acid,
poly I:C), gram-negative bacteria (lipopolysaccharide, LPS) and gram-positive bacteria (cell walls of heat-killed
Staphylococcus aureus). To determine if the immunostimulants caused physiological and behavioural changes in
the mallards, we monitored changes in body temperature, heart rate and activity in three individuals per treat-
ment group using bio-loggers (Supplementary Information Figure S1). We fitted generalised additive mixed
models (GAMMs) to the data until 18.5 h post stimulation (hps) for each physiological measurement (Supple-
mentary Information Tables S1–S3) to compare the effect of the different treatments.
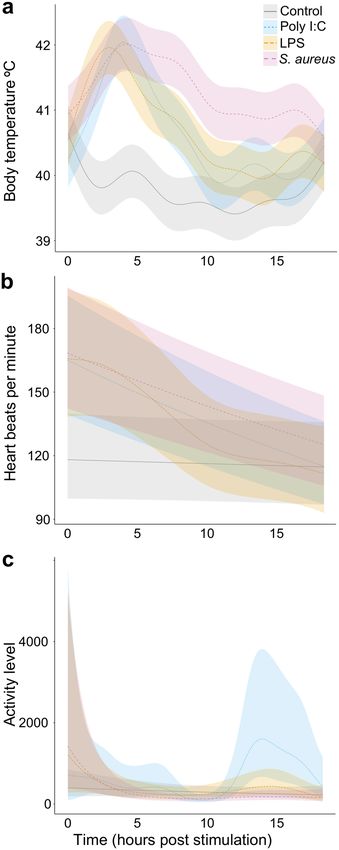
To track the timing of the febrile response, we measured body temperature after administration of immune
stimulants. The average body temperature increased in all treatment groups when compared to the control group
(Fig. 1a). The maximum mean temperature in the poly I:C group was reached after 4.1 hps (n = 3, mean 42.04 °C,
95% Credible Intervals (CrI) 41.63–42.45 °C) and was elevated until 10.5 hps. The maximum mean temperature
in the LPS group was reached after 3.0 hps (n = 3, mean 41.96 °C, CrI 41.55–42.37 °C), and was elevated until 14.9
hps. The maximum mean temperature in the S. aureus group was reached after 4.2 hps (n = 3, mean 42.01 °C, CrI
41.60–42.42 °C) and was elevated until 18.5 hps—compared to ~ 40–41 °C in the control group.
To assess the stress response, we examined the heart rate in the mallards following stimulation. The average
heart rate was elevated in all treatment groups immediately following the stimulation (Fig. 1b). The heart rate
remained higher in the stimulated groups than in the control group until 8.8 hps for the poly I:C group, until 7.8
hps for the LPS group, and until 13.8 hps for the S. aureus group.
Inactivity is often a sign of disease, so we monitored activity levels using high definition accelerometers that
record acceleration along three a xes32. No clear differences were apparent during the response to treatment,
however, ducks showed increased activity upon recovery from the viral mimic (Fig. 1c).
Leukocyte differential count. Acute phase response to disease is often accompanied by the recruitment
of neutrophils into circulating blood resulting in a blood neutrophilia. Like neutrophils, their counterpart in
birds, heterophils, are critically involved in the immediate response to pathogens33. To confirm that changes in
blood leukocyte composition accompanied immune responses to stimulants in our study, we estimated the mean
leukocyte proportions (Supplementary Information Text S1 and Figure S2) and the heterophil:lymphocyte (H:L)
ratio for each treatment group. We performed differential leukocyte counts on more than 200 cells on stained
blood films using light microscopy for five individuals per treatment group at each time point. We observed an
increase in the H:L ratio, with a peak at 6 hps, for all treatment groups (Fig. 2).
Genome wide gene expression profiling. RNA‑sequencing and differential gene expression. To iden-
tify differentially expressed genes (DEGs) following administration of immune stimulants, we performed full
transcriptome sequencing on blood samples from three females and three males for each treatment and time-
point, adding up to a total of 120 samples (Supplementary Information Text S2). As our preliminary analyses
did not detect a clear difference in the response between females and males, we included individuals from both
sexes in the differential expression analyses (Supplementary Information Text S3). The number of DEGs for each
treatment group peaked at 1016 following poly I:C challenge, 256 for the LPS challenge and 94 for the S. aureus
challenge, however, this differed between the time-points (Supplementary Datasets S1–S3, Supplementary In-
formation Figure S3). In the poly I:C and the LPS treatment group the majority of the genes were differentially
Scientific Reports | (2021) 11:10815 | https://doi.org/10.1038/s41598-021-90212-8 2
Vol:.(1234567890)www.nature.com/scientificreports/
Figure 1. Physiological changes following challenge with immune stimulants. Changes in (a) body
temperature, (b) heart rate and (c) activity level were measured remotely using bio-loggers. Mean and 95%
credible interval for each treatment group was plotted until 18.5 h post stimulation, as estimated from the
posterior distribution of the GAMM. An activity value of 0 means no activity, while higher values mean more
movement in either or all of the three axes.
Scientific Reports | (2021) 11:10815 | https://doi.org/10.1038/s41598-021-90212-8 3
Vol.:(0123456789)www.nature.com/scientificreports/
before
stimulation 3 hps 6 hps 12 hps 24 hps
60
40
Control
H:L ratio Poly I:C
LPS
S. aureus
20
0
Treatment and hours post stimulation
Figure 2. Elevated H:L ratios in mallard blood following challenge with immune stimulants. Mean H:L ratio
and 95% credible intervals as estimated from the posterior distribution from the multinomial model (n = 5
ducks/timepoint).
expressed at 3 and 6 hps, indicating a rapid response to the treatments. In contrast, the majority of DEGs in the S.
aureus treatment group were detected at 12 hps. To identify key genes that can be used to assess immune status in
a field experiment, we identified the top DEGs from each time point and each treatment (Fig. 3, Supplementary
Information Tables S4–S6, Text S4). The overlap of significantly DEGs between the different treatment groups
was moderate, with roughly 13.6%, 7.5%, 4%, and 0% of the DEGs in any of the treatment groups being shared
between two or more treatment groups at time points 3 h, 6 h, 12 h and 24 hps respectively (Supplementary In-
formation Figure S4, Text S5). Thus, the differential gene expression analyses suggest that the immune response
to each immunostimulant is unique.
Gene ontology (GO) analysis and enrichment test. We performed a gene ontology (GO) analysis to investigate
whether certain biological processes and pathways were overrepresented in our list of DEGs. We found a signifi-
cant overrepresentation of Reactome pathways in the poly I:C treatment group at 3 (n = 25), 6 (n = 29), and 12 h
(n = 14) ps and in the LPS treatment group 3 (n = 62) and 6 hps (n = 29) (Supplementary Datasets S5–S6). In the
poly I:C treatment group, overrepresented Reactome pathways were found within functions such as antiviral
responses, adaptive and innate immune system, and interferon signaling (Fig. 4 and Supplementary Dataset S5,
Supplementary Information Text S6). Several of the overrepresented Reactome pathways in the LPS treatment
group were related to T-cell activation and signaling, adaptive immune system functions and heat shock and
stress responses (Fig. 4 and Supplementary Dataset S6, Supplementary Information Text S6). No overrepre-
sented pathways were detected for the S. aureus treatment group. The overrepresented Reactome Pathways with
the highest enrichment score for each of these groups are shown in Fig. 4. The results from the GO overrepre-
sentation analysis for the Biological Processes (Supplementary Information Figure S5, Text S7) were similar to
those from the GO overrepresentation analysis for the Reactome pathway.
Data mapping onto KEGG pathways. To further explore the specificity of the immune response to each immu-
nostimulant, we visualised the gene expression profiles for each treatment and time point in the context of gene
networks. To facilitate exploration of the results as well as future comparative studies, we built an interactive
webpage (http://orn-files.iwww.mpg.de/dgeviz) where the gene expression fold changes are illustrated on seven
immune related pathways from the Kyoto Encyclopedia of Genes and Genomes (KEGG) database34–36. The fold
changes and corrected p values for all treatments and pathways are available in Supplementary Dataset S7.
The Reactome pathways showing highest differential gene expression following poly I:C stimulation included
RIG-like receptor, TLR3, and interferon-alpha signaling pathways, as expected. Within the RIG-I/MDA5 signal-
ing pathway several genes were significantly upregulated at one or several of the time points following the poly
I:C treatment (Fig. 5, Supplementary Dataset S1). Most notably, RIG-I (Retinoic acid-Inducible Gene I; also
called DDX58) and MDA5 (Melanoma Differentiation-Associated protein 5; also called IFIH1) were upregulated
at early time points, as were the activating protein TRIM25 (Tripartite Motif Containing 25), and downstream
signaling molecules TRAF (TNF Receptor Associated Factor) and FADD (Fas Associated Via Death Domain),
Scientific Reports | (2021) 11:10815 | https://doi.org/10.1038/s41598-021-90212-8 4
Vol:.(1234567890)www.nature.com/scientificreports/
a Poly I:C b LPS c S. aureus
ADI1 BCL11B ALAD
B4GALNT4 C1QB ALMS1
BCL2L15 CD101 ATIC 5
CMPK2 CD1D B4GALT1
CNP CYGB CD3G
0
CYGNIN DNASE2B ENTPD2
EPSTI1 HTRA1 EPM2A
HYDIN IL1R2 GIPC2 −5
IFI6 IL22RA2 IL7R
IFIT5 IL9 LYG2
IFITM1 LYG2 MLLT6
LAO1 MAS MORC4
OAS3 MRGPRH MTR
OASL NDST4 NT5E
PLAC8 NETO2 NUF2
PML PLD4 SKA1
RSAD2 PTX3 SLC25A25
SDC4 SAA3 SLC5A3
TGM4 SLC4A8 STK38L
Uncharacterized TREM2 TGM3
12 hps
12 hps
12 hps
3 hps
6 hps
24 hps
3 hps
6 hps
24 hps
3 hps
6 hps
24 hps
Figure 3. Heatmap illustrating the log2 fold change of the differentially expressed genes (rows) that were most
up- or downregulated for each time point (column) and treatment group (FDR < 0.05). Red indicates that the
gene expression was higher-, and blue indicates that the gene expression was lower in the treatment group than
in the control group. For genes that could not be assigned a gene name from the mallard genome, hits identified
through the BLAST search is shown (for more details see Supplementary Information Tables S4–S7 and
Supplementary Dataset S4. Gene name changed from IFITM3 to IFITM1, following the suggested nomenclature
in Blyth, et al.61. All DEGs from the treatment groups are listed in Supplementary Datasets S1–S3.
and interferon regulatory protein IRF7 (Interferon Regulatory Factor 7). Details of the toll-like receptor signaling
pathway and the Influenza A pathway are shown and discussed in Supplementary Information (Figures S6–S7,
Text S8).
Gene expression of target genes. We measured gene expression of five key immune genes, identified in our tran-
scriptome analysis for the poly I:C treatment group, from nine individuals using real-time qPCR to validate our
RNA-seq results. The gene expression results from the real-time qPCR confirmed the RNA-seq results (Supple-
mentary Information Figures S8–S9). Of the five measured genes, RSAD2 was the most highly expressed gene,
followed by RIG-I, TLR3 and IRF7 (Supplementary Information Figure S8). Finally, the genes mined from our
transcriptome analyses provide a panel of target genes for analysis of antiviral responses in mallards.
Discussion
We quantified several important physiological traits in healthy and immune-challenged individuals of birds
in a controlled setup, and thereby provide crucial information that can be used for disease monitoring in wild
populations. By combining state-of-the-art bio-loggers to monitor an immune response in progress with high
throughput sequencing technologies to characterise genome wide gene expression profiles in blood samples col-
lected across several timepoints, we were able to examine the duration and magnitude of the immune response
in relation to each immune-stimulant.
An acute phase response includes physiological and behavioural changes. Studying such changes during
infection in animals is not trivial, and usually includes disturbance of the animals for sampling or observation.
One of the main goals of this study was to investigate if the acute phase response (APR) can be monitored using
on-animal bio-loggers, technologies that have great applications for remote, long-term disease monitoring in
wild populations. For this purpose, we recorded changes in body temperature, heart rate and activity in control
and immune challenged mallards using bio-loggers, while simultaneously monitoring the cellular response using
blood immune assays. Elevated body temperature can be used to quantify the extent of a fever response in birds37.
Heart rate is linked to oxygen consumption via Fick’s equation and is often used as a means of estimating energy
expenditure in (wild) animals38,39. High definition accelerometers that record acceleration along three axes can be
Scientific Reports | (2021) 11:10815 | https://doi.org/10.1038/s41598-021-90212-8 5
Vol.:(0123456789)www.nature.com/scientificreports/
a Poly I:C
b LPS
60
Antiviral mechanism by IFN−stimulated genes Association of TriC/CCT with target proteins during biosynthesis
CD28 co−stimulation Attenuation phase 50
Chemokine receptors bind chemokines BBSome−mediated cargo−targeting to cilium
Costimulation by the CD28 family CD28 co−stimulation 40
Generation of second messenger molecules Chemokine receptors bind chemokines
30
Interferon alpha/beta signaling Cooperation of Prefoldin and TriC/CCT in actin and tubulin folding
ISG15 antiviral mechanism Costimulation by the CD28 family 20
Negative regulators of RIG−I/MDA5 signaling DAG and IP3 signaling
NF−kB activation through FADD/RIP−1 pathway mediated by caspase−8 and −10 EGFR interacts with phospholipase C−gamma 10
PD−1 signaling FCERI mediated Ca+2 mobilization
0
Phosphorylation of CD3 and TCR zeta chains Folding of actin by CCT/TriC
Regulation of HSF1−mediated heat shock response Formation of tubulin folding intermediates by CCT/TriC
RIG−I/MDA5 mediated induction of IFN−alpha/beta pathways Generation of second messenger molecules
The role of Nef in HIV−1 replication and disease pathogenesis HSF1−dependent transactivation
Toll Like Receptor 3 Cascade PD−1 signaling
TRAF3−dependent IRF activation pathway Phosphorylation of CD3 and TCR zeta chains
TRAF6 mediated IRF7 activation PLC−gamma1 signalling
TRAF6 mediated NF−kB activation Prefoldin mediated transfer of substrate to CCT/TriC
Translocation of ZAP−70 to Immunological synapse TCR signaling
TRIF−mediated TLR3/TLR4 signaling Translocation of ZAP−70 to Immunological synapse
3 hps
6 hps
12 hps
3 hps
6 hps
Figure 4. Heatmap illustrating overrepresented Reactome Pathways with the highest fold enrichment score for
the poly I:C and LPS treatment groups. Pathways that were significantly overrepresented (FDR < 0.05) are shown
in red colour, with faint red indicating lower fold enrichment score and dark red a higher fold enrichment score.
Pathways that were not significantly overrepresented are shown in grey for that particular treatment group and
time point. No Reactome Pathways were overrepresented in the S. aureus treatment group, nor 24 hps in the
poly I:C treatment group or 12/24 hps in the LPS treatment group. All overrepresented gene ontology terms are
listed in Supplementary Datasets S5–S6.
RIG-I-like receptor signaling pathway - Anas platyrhynchos (mallard) - Poly I:C
Gene expression Activation
log2 fold changes
Inhibition
Endoplasmic reticulum
-3.0
CYLD
RNF125 Indirect effect
Ubiquitin mediated Gene Binding / association
Paramyxoviridae TRIM25 proteolysis 0.2
Newcastle disease virus +u ISG15 ATG12
-u Mitochondria Phosphorylation
Sendai virus TBKBP1 SIKE1 Time point ps: +p
+u PIN1
Orthomyxoviridae 3h, 6h, 12h, 24h Dephosphorylation
Influenza virus AZI2 -p
5'ppp ssRNA RIG-I ATG5
Rhabdoviridae DDX3X Type I Interferon Ubiquitination
short dsRNA
Vesicular stomatitis virus +u
TMEM173
Rabies virus TANK IKBKE INFA
6.5
Flaviviridae NLRX1
IRF3 INFB
Japanese encephalitis virus OTUD5
Hepatitis C virus DNA INFW
TBK1 IRF7
-u +p INFE
INFK Protein synthesis
Flaviviridae IKBKG Growth arrest
LGP2 MAVS TRAF3
West Nile Virus IKBKG Dendritic cell activation
Dengue virus NK cell activation
Reoviridae TKFC FADD CASP8 IKBKB NFKBIA
+p CTL differentiation
Reovirus Antibody production
Inflammatory cytokines
TRADD Apoptosis
RIPK1 CASP10 CHUK -+-
RNF125 IL8
DNA
Picornaviridae +u NFKB1
Enzephalomyokarditis virus
Apoptosis CXCL10
Polio virus
MDA5
Rhinovirus long dsRNA
Theiler's virus IL12A
Mengovirus TRAF2 MAP3K7
Foot and Mouth disease JNK IL12B
TNFA
MAPK8 MAPK9
Ubiquitin mediated TRAF6
MAP3K1
proteolysis MAPK10
p38
MAPK signaling MAPK11 MAPK12
pathway
MAPK13 MAPK14
Figure 5. Log2 fold changes of the expression level between the poly I:C and control treatments mapped on the
RIG-I like receptor signaling pathway from the KEGG database34–36. Red indicates that the gene expression was
higher, and blue indicates that the gene expression was lower in the poly I:C treatment group than in the control
group. White indicates no change or a similar change in the poly I:C treatment group as in the control group.
Each box represents one gene in the pathway and the columns within the box show the gene expression fold
change for the four time points; 3, 6, 12 and 24 hps from left to right. For more details see http://orn-files.iwww.
mpg.de/dgeviz/RIG_PICButton.html.
Scientific Reports | (2021) 11:10815 | https://doi.org/10.1038/s41598-021-90212-8 6
Vol:.(1234567890)www.nature.com/scientificreports/
used to detect subtle changes in behaviour, while minimising any potential interference from a human observer’s
perspective32. We detected a clear and rapid increase in the core body temperature as well as heart rate in all
immune challenged mallards, which correlated well with the timepoints when the white blood cell composition
and gene expression profiles were altered in the immune challenged ducks. In contrast, no significant differences
in activity levels between the treatment groups were detected during the acute phase response.
The cost of an upregulated immune response is debated40, yet continuous long-term heart rate data are rarely
reported in disease ecology studies. It is therefore still unknown, too, whether heart rate and associated energy
expenditure increase significantly in birds during common infections, such as A IV28. Here we found that the
heart rate of mallards became elevated during the acute phase response in all immunological treatments. As
heart rate loggers may become more commonly used in ecological studies in the future19 we expect that we will
soon gain additional insights into the magnitude, duration and function of elevated heart rates during infections
in wild birds.
While a host’s physiological response to an infection is important, a behavioural response such as sickness
behaviour is similarly essential and ubiquitous17. Unexpectedly, we did not find differences in activity patterns
between the immune challenged and the control birds. Currently we do not know whether the lack of a difference
is a result of the captive conditions of our experimental design, a subclinical course of the APR due to the lower
pathogenicity of the stimulant compared to the true pathogen, or whether it also reflects the possibility that the
movement patterns of wild mallards are not affected by some infections23. We will follow up on this question in
a sequel study that will investigate movement patterns in free-ranging mallards.
While certain physiological and behavioural responses can be monitored remotely, others require a biological
sample from the animal. Luckily, blood samples can often be obtained easily, non-destructively and repeatedly
from animals upon capture. Here we inferred the immune status and health of mallards by observing changes
in the number of leukocytes in the blood. We saw a change in white blood cell composition in all treatment
groups throughout the experimental protocol, but to a much lower level in the control group. The change in the
control group suggests that leukocyte composition changed either due to the injection of saline, and/or due to
some stressful condition during the course of the experiment. Handling stress itself can alter the white blood cell
composition in b irds41. Nevertheless, the change in heterophil:lymphocyte (H:L) ratio was more pronounced in
all treatment groups than in the control group (Fig. 2) and correlated well with the timeline of the acute phase
reaction.
We deliberately focused both on duration and magnitude of the acute phase response in the mallards to
provide guidelines on when to measure the response when using these pyrogens. The peak body temperature
in mallards was already observed after 3–4.5 h post stimulation, similar to what was previously found in Pekin
ducks (Anas platyrhynchos domesticus)16,42. Likewise, the differential gene expression and the leukocyte count
analyses show that the timing of the fever response correlated well with the number of genes that were differen-
tially expressed in the treatment groups (Fig. 1a and Supplementary Information S3) as well as the increase in
H:L ratio (Fig. 2). In future studies, focus could thus be given to one or a few of the characteristics measured here.
Our study is a first step to understand the immunocompetence in truly wild animals. While our initial
studies examined immune responses of a non-domestic species under controlled conditions, we are aware that
subsequent studies will need to be done entirely in the wild. Our strategy here was to reduce the complexity of
the environment and to induce an immune response using immunostimulants. These immunostimulants are
non-infectious compounds that trigger an immune response, but do not make the animal an infectious carrier.
They can therefore be used in field experiments to study the immune response without spreading infectious
agents37. In our study we aimed to test if immunostimulants (poly I:C, LPS and inactivated S. aureus) activate
pathogen-specific gene regulatory networks in mallards.
Several of the most highly differentially expressed genes in the poly I:C treatment (Fig. 3a) are interferon
stimulated genes (ISGs) that are activated during viral infections in ducks, including viperin (RSAD2), IFITM1
(Interferon induced transmembrane protein 1), IFIT5 (Interferon induced protein with tricopeptide repeats 5)
and OASL (2′–5′ oligoadenylate synthetase-like)43. Poly I:C also induced a rapid and sustained upregulation of the
IFI6 (IFN-α-inducible protein 6) in the ducks, an effector that blocks the replication of flaviviruses such as West
Nile virus44. This indicates that poly I:C induced a typical antiviral response in the mallards. Several of the most
upregulated genes in the LPS treatment group are involved in defence response, including TREM2 (triggering
receptor expressed on myeloid cells 2), IL1R2 (Interleukin-1 receptor 2), PTX3 (Pentraxin 3), LYG2 (lysozyme
G2) and IL22RA2 (Interleukin 22 Receptor Subunit Alpha 2) (Fig. 3b). The most upregulated gene in the LPS
treatment group (PTX3) was recently proposed as an important marker to monitor inflammatory conditions in
poultry, as it is upregulated in response to bacterial and viral infections in c hickens45. While the role of PTX3 is
largely unknown in ducks, it was upregulated during early stage of egg drop syndrome virus infection in duck
embryo fibroblast cells46. Interestingly, no significant upregulation of PTX3 was detected in the mallards in
response to poly I:C or inactivated S. aureus (Supplementary Datasets S1 and S3). While PTX3 is likely a good
marker for LPS in mallards, its role in antiviral and antibacterial response in mallards thus needs to be further
investigated. Another highly upregulated gene in the LPS treatment group (IL1R2), was recently proposed as
a biomarker for differentiating gram-negative and gram-positive bacterial infections in mice, as this gene was
expressed at a higher level in mice challenged with inactive gram-negative bacteria (Escherichia coli) than inac-
tive gram-positive bacteria (S. aureus)47. In line with the results in mice, IL1R2 was differentially expressed in
the ducks treated with LPS (Supplementary Dataset S2) but not with the inactivated S. aureus (Supplementary
Dataset S3). However, as few genes were highly up- or downregulated in the mallards treated with inactivated
S. aureus (Supplementary Dataset S3) more research is required to determine if IL1R2 is also a good marker for
differentiating gram-negative and gram-positive bacterial infections in mallards.
One of the top ten differentially expressed genes in the S. aureus treatment group (LYG2), was also differen-
tially expressed in the LPS and the poly I:C treatment group (Supplementary Dataset S1–S2). In fact, this was one
Scientific Reports | (2021) 11:10815 | https://doi.org/10.1038/s41598-021-90212-8 7
Vol.:(0123456789)www.nature.com/scientificreports/
of the few genes that was differentially expressed in all treatment groups (Supplementary Dataset S1–S3). While
the role of this gene in the duck immune response is unknown, LYG2 is upregulated in response to b acterial48 as
49
well as v iral infections in chicken. It is thus plausible that this gene may be involved in the immune response
to a broad range of pathogens in ducks as well.
Results from our gene ontology analyses show that the immunological stimulants induce pathogen-specific
changes, which justify their use as surrogates to live pathogens in future manipulative studies. Several antiviral
pathways were overrepresented in the poly I:C treatment groups, including the RIG-I/MDA5 signalling pathway
(Fig. 4, Supplementary Dataset S5). RIG-I and MDA5 are pattern recognition receptors that recognise RNA
viruses in the c ytoplasm50, and activate a cascade of immune proteins which subsequently triggers the produc-
tion of type I interferons51. The RIG-I/MDA5 signalling pathway is involved in the clearance of viruses with
high relevance for mammals as well as birds50,51, and are upregulated in ducks infected with AIV52,53, Newcastle
disease virus54, duck hepatitis virus55, and duck plague virus56. Considering that the mallard is a vector for viral
diseases with major impact on human health and that several antiviral pathways were upregulated in the poly I:C
treatment group (Fig. 4), this stimulant will be of particular interest for future ecological immunology studies in
mallards. We also found that several pathways and biological processes related to immune function, inflammation
and stress response were activated in the LPS treatment group (Fig. 4, Supplementary Information Figure S5), as
has been seen in p asserines20,57. Interestingly, although inactivated S. aureus (the Gram-positive bacterial mimic)
induced an increase in body temperature and heart rate as well as a change in leukocyte composition, only a
low number of differentially expressed genes (DEGs) were detected in mallards stimulated with this pyrogen.
We think that we are only observing a part of the immune response usually triggered by live S. aureus infection,
as live S. aureus activate the NGF β-TRKA signaling axis following stimulation of the NLRP3 inflammasome58.
Therefore, we suggest that LPS, but not inactivated S. aureus, has a great potential for mimicking bacterial infec-
tions in ecological immunology studies in mallards.
Many of the genes that were differentially expressed in the mallards in our study are uncharacterised, and
could not be identified using a similarity search against the other genomes used in our study. This demonstrates
that there is still a lot to learn about the immune system in birds as well as some important model species. Further,
the function of some genes that were differentially expressed in the mallards is unknown. One such example is
the B4GALNT4 (Beta-1,4-N-Acetyl-Galactosaminyltransferase 4) gene which was one of the most upregulated
genes in the poly I:C treatment group (Fig. 3a, Supplementary Dataset S1, Supplementary Information Table S4).
While mice deficient in B4GALNT3 (Beta-1,4-N-Acetyl-Galactosaminyltransferase 3), a paralog of B4GALNT4,
have reduced protection against influenza virus59, the role of B4GALNT4 in the response to viral infections is
unknown60. B4GALNT4 is located next to the IFITM3 (Interferon Induced Transmembrane Protein 3) gene,
which is known to restrict influenza virus61. IFITM3 is upregulated in mallards during influenza infection61,
and was also one of the most upregulated genes in our poly I:C treated mallards (Supplementary Information
Table S4). If further research supports our suggestion that B4GALNT4 is involved in the viral immune response
in mallards, this gene is a good candidate for future functional studies with potential to improve our understand-
ing of how mallards clear viral infections.
In many cases, the natural reservoir of EIDs show little to no signs of disease when being infected by the
same pathogen that causes serious damage in other species3. Comparative transcriptomics and pathway analyses
have great potentials for detecting subtle differences in the immune system that relate to specific differences in
susceptibility or resistance to infections. If future studies move towards evaluating RNA-seq in the framework
of pathways, then such differences will become more evident. By visualising the gene expression changes on
these pathways for the mallard and creating an interactive webpage where the results can be evaluated (http://
orn-files.iwww.mpg.de/dgeviz/) we provide means for future comparisons of the immune response in different
species, including species with differences in severity of pathogenesis to AIV. When assessing gene expression
in a pathway framework it is important to keep in mind that reference pathways are usually built on knowledge
from model species such as human or mouse. The function of certain elements in the pathway used in this study
might hence be different in the mallard, or even differ between the mallard and closely related species. One such
example with relevance for this study is that birds lack the mammalian TLR6 and T LR962. Other differences that
will be of relevance for future comparative immunology studies in birds are that chicken, but not duck, lack the
RIG-I and TRIF related adapter molecule (TRAM, also known as TICAM-2) proteins53,63. TRAM bridges the
TLR4 and TRIF in the TLR3- and TLR4-mediated MyD88-independent signalling pathway, and is an important
part of the TLR4 pathway64. As more genomic and transcriptomic studies are undertaken, a key next step will be
the construction of species-specific immune regulatory networks for species with importance as hosts of EIDs.
In this study we used attached and implanted bio-loggers as well as blood-based assays to record several
characteristics of the immune response simultaneously. While a combination of different measuring techniques is
indispensable for obtaining a comprehensive picture of the immune response, each technique has inherent practi-
cal limitations. The heart-rate and body temperature bio-loggers used in this study require surgical implantation,
which may not be feasible in certain species and field settings. Blood-based assays in turn may be available to
more research groups, but baseline information may not be available for many reservoir species hampering the
interpretation of results. The technology to use within a particular study thus has to be determined based on the
ecology of the species of interest and the research question in mind. We expect that the continuous technological
development (including smaller sensors, improved ability to transmit data, and novel attachment and recovery
methods)65 combined with appropriate archiving and trans-disciplinary sharing of data (e.g. movebank.org) will
facilitate the usage of bio-loggers for disease monitoring in the future.
In conclusion, we show that poly I:C and LPS induce a rapid and predictable acute phase response in mallards.
We confirm that body temperature and heart rate increase during the acute phase response, and that this can
be monitored remotely using on-animal bio-loggers. In combination with GPS data from tracking devices that
can record movements of animals on a large scale66, we can now get closer to understanding the epidemiology
Scientific Reports | (2021) 11:10815 | https://doi.org/10.1038/s41598-021-90212-8 8
Vol:.(1234567890)www.nature.com/scientificreports/
of diseases such as AIV in mallards. By analysing the transcriptome after immune stimulation, we did not only
gain novel insights into the molecular mechanisms behind this immune reaction but also showed that pathogen-
specific immune pathways were upregulated in the blood during the acute phase response.
Materials and methods
All methods are described in more detail in the Supplementary Information.
Immune challenge. Forty-four first generation captive-bred mallards (Anas platyrhynchos) were included
in the study. The mallards were housed in groups of three in outdoor aviaries at the Max Planck Institute for
Ornithology (MPIO) in Radolfzell, Germany. The aviaries measured 3 m x 4 m × 2.5 m (w × l × h) and contained
a water basin and a shelter with nesting material (Supplementary Information Text S9).We treated the mallards
with one of three immunostimulants to mimic infections by different pathogens. The double-stranded RNA
molecule polyinosinic:polycytidylic acid (poly I:C, 1 mg/kg) was used to mimic a viral infection, lipopolysac-
charide (LPS, 100 µg/kg) was used to mimic a Gram-negative bacterial infection, and cell walls of heat-killed
Staphylococcus aureus (approx. 2.5 × 10¹⁰ cell walls) were used to mimic a Gram-positive bacterial infection.
These compounds are all used as common tools for scientific research on the immune response and have all
been shown to induce an increase in body temperature in Pekin ducks (Anas platyrhynchos domesticus)16. As
body temperature as well as heart rate can be elevated in birds during stress or handling67, the experiment was
divided into two parts. The first part of the experiment (Experiment 1) allowed us to monitor changes in body
temperature, heart-rate and movement patterns from the individuals without disturbance, while the second part
of the experiment (Experiment 2) allowed us to collect blood samples that were used to study differential gene
expression and white blood cell composition (Supplementary Information Figure S1).
In Experiment 1 we recorded changes in physiology and behaviour during the acute phase response using
bio-loggers. For this purpose, we implanted heart rate and body temperature sensors (E-obs GmbH, Grünwald,
Germany, www.e-obs.de) in the abdominal cavity of 12 individuals. Four weeks after surgery, we attached accel-
eration loggers (E-obs GmbH, Grünwald, Germany, www.e-obs.de) to the back of the same individuals using
a customised b ackpack68. We divided the individuals into four groups of three individuals each, which then
received one of the treatments. The individuals were left in the aviaries with minimal disturbances after stimula-
tion to avoid changes in physiology and behaviour due to handling stress.
In Experiment 2 we repeated the treatments to collect blood samples for leukocyte counts and global gene
expression analysis. An additional 32 mallards were included in the second stimulation event to ensure that
enough samples were available for further analysis. The treatment was repeated after a minimum of two weeks
to avoid potential short-term tolerance effects to the stimulants16,69. Once again, the individuals (n = 44) were
divided into four groups (n = 11) and stimulated with one of the three treatments or the control. Blood samples
were collected before stimulation and at a number of time points post stimulation (ps) (3 h, 6 h, 12 h, and 24 h).
For more detailed description see Supplementary Information (Text S9).
Body temperature, heart rate, activity data and leukocyte composition. We used bio-loggers
to observe changes in physiology and behaviour during the acute phase response. Briefly, we recorded body
temperature, electrical activity of the heart, and acceleration data for three individuals per treatment. The data
was downloaded remotely using an e-obs base station located outside the aviaries. We calculated the heart rate as
beats per minute for every five-minute period from the electrocardiograms. We estimated the activity level of the
mallards by calculating the mean of the variance of the acceleration measurements from each axis, f ollowing70.
We fitted generalised additive mixed models (GAMMs) to the data for each physiological measurement, to
investigate whether they differed between the treatments. We estimated the mean from the posterior distribution
using a Bayesian framework for each measurement.
We performed a leukocyte differential count and calculated the heterophil:lymphocyte (H:L) ratio to get a
better understanding of what changes occur in the leukocyte composition during the acute phase response in
mallards. We prepared blood smears for five individuals per treatment and time point and determined the pro-
portion of heterophils, lymphocytes, monocytes, eosinophils, and basophils using light microscopy. Staining and
evaluation of blood films was performed by Pendl Lab, Switzerland. We fitted a multinomial model to estimate
and compare the proportions of each leukocyte type in the different treatments and time points. The mean of
the H:L ratio was estimated from the posterior distribution of the multinomial model.
We report the 95% Credible Intervals (CrI) using the 2.5% and 97.5% quantiles from the posterior distribution
from each model. The mean of each measurement was considered different from the mean of the control group
when the CrI of the treatment group did not include the estimated mean from the control group.
For more detailed description see Supplementary Information (Text S10, Table S8).
Genome wide gene expression profiling. We monitored changes in the whole transcriptome in whole
blood before and after the immune-stimulation for six individuals per treatment, using next generation RNA-
sequencing to determine whether relevant immune pathways were upregulated in the respective treatments.
We sequenced mRNA libraries on the Illumina HiSeq2500, and performed differential gene expression analysis
using packages edgeR71 and limma72 as described in 73. Briefly, we computed empirical Bayes moderated t- and
B-statistics, correcting for possible sex and individual differences using fixed and random factors, respectively,
to identify genes that were differentially expressed due to treatment. Genes with an FDR adjusted p value < 0.05
were considered differentially expressed. We used Venn diagrams to explore whether the same genes were dif-
ferentially expressed in the treatment groups and at different time points, and visualised the expression level
for the differentially expressed genes (DEGs) using heatmaps. We conducted a gene ontology (GO) analysis in
Scientific Reports | (2021) 11:10815 | https://doi.org/10.1038/s41598-021-90212-8 9
Vol.:(0123456789)www.nature.com/scientificreports/
PANTHER74 to retrieve GO IDs75 for the DEGs and to find pathways that were overrepresented in each treat-
ment group.
We visualised the gene expression data on seven immune related pathways (apla04620 Toll-like receptor
signaling pathway, apla04621 NOD-like receptor signaling pathway, apla05132 Salmonella infection, apla05164
Influenza A, apla04623 Cytosolic DNA-sensing pathway, apla04672 Intestinal immune network for IgA produc-
tion, apla04622 RIG-I-like receptor signaling pathway) from the KEGG d atabase34–36 in the VANTED s oftware76.
All pathways were compiled into an interactive webpage (http://orn-files.iwww.mpg.de/dgeviz/). The web-based
pathway visualizations contain hyperlinks to a description of each gene via the KEGG webpage, including the
gene and protein sequence and links to the National Centre for Biotechnology Information (NCBI) and Ensemble.
For the poly I:C treatment we validated the RNA-seq results using real-time quantitative PCR (qPCR) (Sup-
plementary Information Text S3), and thereby also provide a panel of target genes for specific future antiviral
gene expression studies in mallards.
For more detailed description see Supplementary Information (Text S3, Table S9, Figure S10) and Supple-
mentary Dataset S7.
Ethics statement. The experiment was approved by the federal authorities of the German state of Baden-
Württemberg (Regierungspräsidium Freiburg, approval no. AZ: 35-9185.81/G-15/130). Based on § 42 TierSch-
VersV (German legislative decree for the conduct of animal experiments) the approval of the authorities has to
follow the votum of a commission for animal experiments. This commission is comparable to the ethical com-
mittees in other countries, but, according to German legislation, it is not appointed by the research institutes
but by the state authorities. The study was carried out in compliance with the ARRIVE guidelines (https://arriv
eguidelines.org).
Data availability
Raw Illumina sequences have been deposited at the NCBI’s Sequence Read Archive (SRA) database under the
accession no. PRJNA728347.
Received: 28 January 2021; Accepted: 6 May 2021
References
1. Van Doorn, H. R. Emerging infectious diseases. Medicine 42, 60–63. https://doi.org/10.1016/j.mpmed.2013.10.014 (2014).
2. Karesh, W. B. et al. Ecology of zoonoses: Natural and unnatural histories. Lancet 380, 1936–1945. https://doi.org/10.1016/S0140-
6736(12)61678-X (2012).
3. Mandl, J. N. et al. Reservoir host immune responses to emerging zoonotic viruses. Cell 160, 20–35. https://doi.org/10.1016/j.cell.
2014.12.003 (2015).
4. Hasday, J. D., Fairchild, K. D. & Shanholtz, C. The role of fever in the infected host. Microbes Infect. 2, 1891–1904. https://doi.org/
10.1016/S1286-4579(00)01337-X (2000).
5. Lopes, P. C., Block, P. & König, B. Infection-induced behavioural changes reduce connectivity and the potential for disease spread
in wild mice contact networks. Sci. Rep. 6, 31790. https://doi.org/10.1038/srep31790 (2016).
6. Lemus, J. A., Vergara, P. & Fargallo, J. A. Response of circulating T-lymphocytes to a coccidian infection: Insights from a parasiti-
zation-vaccination experiment. Funct. Ecol. 24, 638–645 (2010).
7. Schountz, T. Immunology of bats and their viruses: Challenges and opportunities. Viruses 6, 4880–4901. https://doi.org/10.3390/
v6124880 (2014).
8. Cray, C., Zaias, J. & Altman, N. H. Acute phase response in animals: A review. Comput. Med. 59, 517–526 (2009).
9. Hart, B. L. Biological basis of the behavior of sick animals. Neurosci. Biobehav. Rev. 12, 123–137. https://doi.org/10.1016/S0149-
7634(88)80004-6 (1988).
10. Owen-Ashley, N. T. & Wingfield, J. C. Acute phase responses of passerine birds: Characterization and seasonal variation. J. Ornithol.
148, 583–591. https://doi.org/10.1007/s10336-007-0197-2 (2007).
11. Harden, L. M., du Plessis, I., Poole, S. & Laburn, H. P. Interleukin-6 and leptin mediate lipopolysaccharide-induced fever and
sickness behavior. Physiol. Behav. 89, 146–155. https://doi.org/10.1016/j.physbeh.2006.05.016 (2006).
12. Sköld-Chiriac, S., Nord, A., Tobler, M., Nilsson, J. -Å. & Hasselquist, D. Body temperature changes during simulated bacterial
infection in a songbird: Fever at night and hypothermia during the day. J. Exp. Biol. 218, 2961–2969 (2015).
13. Owen-Ashley, N. T., Turner, M., Hahn, T. P. & Wingfield, J. C. Hormonal, behavioral, and thermoregulatory responses to bacterial
lipopolysaccharide in captive and free-living white-crowned sparrows (Zonotrichia leucophrys gambelii). Horm. Behav. 49, 15–29.
https://doi.org/10.1016/j.yhbeh.2005.04.009 (2006).
14. Koutsos, E. A. & Klasing, K. C. The acute phase response in Japanese quail (Coturnix coturnix japonica). Comp. Biochem. Phys. C
128, 255–263. https://doi.org/10.1016/S1532-0456(00)00199-X (2001).
15. Jones, C. A., Edens, F. W. & Denbow, D. M. Influence of age on the temperature response of chickens to Escherichia coli and Sal‑
monella typhimurium endotoxins. Poult. Sci. 62, 1553–1558. https://doi.org/10.3382/ps.0621553 (1983).
16. Marais, M., Gugushe, N., Maloney, S. K. & Gray, D. A. Body temperature responses of pekin ducks (Anas platyrhynchos domesticus)
exposed to different pathogens. Poult. Sci. 90, 1234–1238. https://doi.org/10.3382/ps.2011-01389 (2011).
17. Ashley, N. T. & Wingfield, J. C. In Ecoimmunology (eds. Demas, G.E. & Nelson, R.J.) 45–91 (Oxford University Press, 2011).
18. Sherub, S., Fiedler, W., Duriez, O. & Wikelski, M. Bio-logging, new technologies to study conservation physiology on the move: A
case study on annual survival of Himalayan vultures. J. Comp. Physiol. A 203, 531–542. https://d oi.o
rg/1 0.1 007/s 00359-0 17-1 180-x
(2017).
19. Wilmers, C. C. et al. The golden age of bio-logging: How animal-borne sensors are advancing the frontiers of ecology. Ecology 96,
1741–1753. https://doi.org/10.1890/14-1401.1 (2015).
20. Meitern, R., Andreson, R. & Hõrak, P. Profile of whole blood gene expression following immune stimulation in a wild passerine.
BMC Genom. 15, 533 (2014).
21. Jax, E., Wink, M. & Kraus, R. H. Avian transcriptomics: Opportunities and challenges. J. Ornithol. 159, 599–629. https://doi.org/
10.1007/s10336-018-1532-5 (2018).
22. Mueller, R. C. et al. Avian Immunome DB: An example of a user-friendly interface for extracting genetic information. BMC Bio‑
inform. 21, 1–16. https://doi.org/10.1186/s12859-020-03764-3 (2020).
Scientific Reports | (2021) 11:10815 | https://doi.org/10.1038/s41598-021-90212-8 10
Vol:.(1234567890)www.nature.com/scientificreports/
23. Bengtsson, D. et al. Does influenza A virus infection affect movement behaviour during stopover in its wild reservoir host?. R.
Soc. Open Sci. 3, 150633 (2016).
24. Adelman, J. S., Córdoba-Córdoba, S., Spoelstra, K., Wikelski, M. & Hau, M. Radiotelemetry reveals variation in fever and sickness
behaviours with latitude in a free-living passerine. Funct. Ecol. 24, 813–823. https://doi.org/10.1111/j.1365-2435.2010.01702.x
(2010).
25. Martin, L. B., Liebl, A. L. & Kilvitis, H. J. Covariation in stress and immune gene expression in a range expanding bird. Gen. Comp.
Endocrinol. 211, 14–19. https://doi.org/10.1016/j.ygcen.2014.11.001 (2015).
26. Fleming-Canepa, X. et al. Duck innate immune responses to high and low pathogenicity H5 avian influenza viruses. Vet. Microbiol.
228, 101–111. https://doi.org/10.1016/j.vetmic.2018.11.018 (2019).
27. Olsen, B. et al. Global patterns of influenza A virus in wild birds. Science 312, 384–388 (2006).
28. Jourdain, E. et al. Influenza virus in a natural host, the mallard: Experimental infection data. PLoS ONE 5, e8935. https://doi.org/
10.1371/journal.pone.0008935 (2010).
29. Kuiken, T. Is low pathogenic avian influenza virus virulent for wild waterbirds?. Proc. R. Soc. B 280, 20130990. https://doi.org/10.
1098/rspb.2013.0990 (2013).
30. Pantin-Jackwood, M. J. et al. Pathogenicity and transmission of H5 and H7 highly pathogenic avian influenza viruses in mallards.
J. Virol. 90, 9967–9982. https://doi.org/10.1128/JVI.01165-16 (2016).
31. Hulse-Post, D. et al. Molecular changes in the polymerase genes (PA and PB1) associated with high pathogenicity of H5N1 influenza
virus in mallard ducks. J. Virol. 81, 8515–8524. https://doi.org/10.1128/JVI.00435-07 (2007).
32. Shepard, E. L. et al. Identification of animal movement patterns using tri-axial accelerometry. Endang. Species Res. 10, 47–60.
https://doi.org/10.3354/esr00084 (2008).
33. Harmon, B. G. Avian heterophils in inflammation and disease resistance. Poult. Sci. 77, 972–977. https://doi.org/10.1093/ps/77.7.
972 (1998).
34. Kanehisa, M. & Goto, S. KEGG: Kyoto encyclopedia of genes and genomes. Nucleic Acids Res. 28, 27–30. https://doi.org/10.1093/
nar/28.1.27 (2000).
35. Kanehisa, M. Toward understanding the origin and evolution of cellular organisms. Protein Sci. 28, 1947–1951. https://doi.org/
10.1002/pro.3715 (2019).
36. Kanehisa, M., Furumichi, M., Sato, Y., Ishiguro-Watanabe, M. & Tanabe, M. KEGG: Integrating viruses and cellular organisms.
Nucleic Acids Res. 49, D545–D551. https://doi.org/10.1093/nar/gkaa970 (2021).
37. Adelman, J. S., Bentley, G. E., Wingfield, J. C., Martin, L. B. & Hau, M. Population differences in fever and sickness behaviors in a
wild passerine: A role for cytokines. J. Exp. Biol. 213, 4099–4109. https://doi.org/10.1242/jeb.049528 (2010).
38. Butler, P. J., Green, J. A., Boyd, I. & Speakman, J. Measuring metabolic rate in the field: The pros and cons of the doubly labelled
water and heart rate methods. Funct. Ecol. 18, 168–183. https://doi.org/10.1111/j.0269-8463.2004.00821.x (2004).
39. Steiger, S. S., Kelley, J. P., Cochran, W. W. & Wikelski, M. Low metabolism and inactive lifestyle of a tropical rain forest bird inves-
tigated via heart-rate telemetry. Physiol. Biochem. Zool. 82, 580–589 (2009).
40. Lochmiller, R. L. & Deerenberg, C. Trade-offs in evolutionary immunology: Just what is the cost of immunity?. Oikos 88, 87–98.
https://doi.org/10.1034/j.1600-0706.2000.880110.x (2000).
41. Davis, A. K. Effect of handling time and repeated sampling on avian white blood cell counts. J. Field Ornithol. 76, 334–338. https://
doi.org/10.1648/0273-8570-76.4.334 (2005).
42. Maloney, S. K. & Gray, D. A. Characteristics of the febrile response in Pekin ducks. J. Comp. Physiol. B 168, 177–182. https://doi.
org/10.1007/s003600050134 (1998).
43. Evseev, D. & Magor, K. E. Innate immune responses to avian influenza viruses in ducks and chickens. Vet. Sci. 6, 5. https://doi.org/
10.3390/vetsci6010005 (2019).
44. Richardson, R. B. et al. A CRISPR screen identifies IFI6 as an ER-resident interferon effector that blocks flavivirus replication. Nat.
Microbiol. 3, 1214. https://doi.org/10.1038/s41564-018-0244-1 (2018).
45. Burkhardt, N. B. et al. The long pentraxin PTX3 is of major importance among acute phase proteins in chickens. Front. Immunol.
10, 124. https://doi.org/10.3389/fimmu.2019.00124 (2019).
46. Wang, X., Qi, X., Yang, B., Chen, S. & Wang, J. RNA-Seq analysis of duck embryo fibroblast cell gene expression during the early
stage of egg drop syndrome virus infection. Poult. Sci. 98, 404–412. https://doi.org/10.3382/ps/pey318 (2018).
47. Lang, Y. et al. Interleukin-1 receptor 2: A new biomarker for sepsis diagnosis and gram-negative/gram-positive bacterial differ-
entiation. Shock 47, 119–124. https://doi.org/10.1097/SHK.0000000000000714 (2017).
48. Matulova, M. et al. Chicken innate immune response to oral infection with Salmonella enterica serovar Enteritidis. Vet. Res. 44,
37. https://doi.org/10.1186/1297-9716-44-37 (2013).
49. Smith, J. et al. Systems analysis of immune responses in Marek’s disease virus-infected chickens identifies a gene involved in
susceptibility and highlights a possible novel pathogenicity mechanism. J. Virol. 85, 11146–11158. https://doi.org/10.1128/JVI.
05499-11 (2011).
50. Yoneyama, M. & Fujita, T. Function of RIG-I-like receptors in antiviral innate immunity. J. Biol. Chem. 282, 15315–15318. https://
doi.org/10.1074/jbc.R700007200 (2007).
51. Takeuchi, O. & Akira, S. MDA5/RIG-I and virus recognition. Curr. Opin. Immunol. 20, 17–22. https://doi.org/10.1016/j.coi.2008.
01.002 (2008).
52. Wei, L. et al. Duck MDA5 functions in innate immunity against H5N1 highly pathogenic avian influenza virus infections. Vet.
Res. 45, 66. https://doi.org/10.1186/1297-9716-45-66 (2014).
53. Barber, M. R., Aldridge, J. R., Webster, R. G. & Magor, K. E. Association of RIG-I with innate immunity of ducks to influenza. Proc.
Natl. Acad. Sci. USA 107, 5913–5918. https://doi.org/10.1073/pnas.1001755107 (2010).
54. Kang, Y. et al. Host innate immune responses of ducks infected with Newcastle disease viruses of different pathogenicities. Front.
Microbiol. 6, 1283. https://doi.org/10.3389/fmicb.2015.01283 (2015).
55. Song, C. et al. Effect of age on the pathogenesis of DHV-1 in Pekin ducks and on the innate immune responses of ducks to infec-
tion. Arch. Virol. 159, 905–914. https://doi.org/10.1007/s00705-013-1900-7 (2014).
56. Li, N. et al. Pathogenicity of duck plague and innate immune responses of the Cherry Valley ducks to duck plague virus. Sci. Rep.
6, 32183. https://doi.org/10.1038/srep32183 (2016).
57. Scalf, C. S., Chariker, J. H., Rouchka, E. C. & Ashley, N. T. Transcriptomic analysis of immune response to bacterial lipopolysac-
charide in zebra finch (Taeniopygia guttata). BMC Genom. 20, 1–14. https://doi.org/10.1186/s12864-019-6016-3 (2019).
58. Hepburn, L. et al. A Spaetzle-like role for nerve growth factor β in vertebrate immunity to Staphylococcus aureus. Science 346,
641–646. https://doi.org/10.1126/science.1258705 (2014).
59. Nakamura, S. et al. Influenza A virus-induced expression of a GalNAc transferase, GALNT3, via MicroRNAs is required for
enhanced viral replication. J. Virol. 90, 1788–1801. https://doi.org/10.1128/JVI.02246-15 (2016).
60. Allen, E. K. et al. SNP-mediated disruption of CTCF binding at the IFITM3 promoter is associated with risk of severe influenza
in humans. Nat. Med. 23, 975. https://doi.org/10.1038/nm.4370 (2017).
61. Blyth, G. A., Chan, W. F., Webster, R. G. & Magor, K. E. Duck IFITM3 mediates restriction of influenza viruses. J. Virol. 90, 103–116.
https://doi.org/10.1128/JVI.01593-15 (2016).
62. Brownlie, R. & Allan, B. Avian toll-like receptors. Cell Tissue Res. 343, 121–130. https://d oi.o
rg/1 0.1 007/s 00441-0 10-1 026-0 (2011).
Scientific Reports | (2021) 11:10815 | https://doi.org/10.1038/s41598-021-90212-8 11
Vol.:(0123456789)You can also read


