Heterogeneous CO2 and CH4 content of glacial meltwater from the Greenland Ice Sheet and implications for subglacial carbon processes - The Cryosphere
←
→
Page content transcription
If your browser does not render page correctly, please read the page content below
The Cryosphere, 15, 1627–1644, 2021
https://doi.org/10.5194/tc-15-1627-2021
© Author(s) 2021. This work is distributed under
the Creative Commons Attribution 4.0 License.

Heterogeneous CO2 and CH4 content of glacial meltwater from the
Greenland Ice Sheet and implications for subglacial
carbon processes
Andrea J. Pain1,a , Jonathan B. Martin1 , Ellen E. Martin1 , Åsa K. Rennermalm2 , and Shaily Rahman1,b
1 Department  of Geological Sciences, University of Florida, Gainesville, FL 32611, USA
2 Department  of Geography, Rutgers, The State University of New Jersey, Piscataway NJ 08854, USA
a now at: University of Maryland Center for Environmental Science, Horn Point Lab, Cambridge, MD 21613, USA
b now at: Department of Marine Science, University of Southern Mississippi, Stennis Space Center, MS 39529, USA

Correspondence: Andrea J. Pain (apain@umces.edu)

Received: 18 June 2020 – Discussion started: 3 July 2020
Revised: 22 February 2021 – Accepted: 24 February 2021 – Published: 1 April 2021

Abstract. Accelerated melting of the Greenland Ice Sheet        Sheet. Future work should constrain the extent and controls
has increased freshwater delivery to the Arctic Ocean and       of heterogeneity to improve our understanding of the impact
amplified the need to understand the impact of Greenland        of Greenland Ice Sheet melt on Arctic greenhouse gas bud-
Ice Sheet meltwater on Arctic greenhouse gas budgets. We        gets, as well as the role of continental ice sheets in green-
evaluate subglacial discharge from the Greenland Ice Sheet      house gas variations over glacial–interglacial timescales.
for carbon dioxide (CO2 ) and methane (CH4 ) concentrations
and δ 13 C values and use geochemical models to evaluate sub-
glacial CH4 and CO2 sources and sinks. We compare dis-
charge from southwest (a sub-catchment of the Isunnguata        1   Introduction
Glacier, sub-Isunnguata, and the Russell Glacier) and south-
ern Greenland (Kiattut Sermiat). Meltwater CH4 concentra-       Glaciers play an important role in global chemical cycles
tions vary by orders of magnitude between sites and are sat-    due to the production of fine-grained sediments that partic-
urated with respect to atmospheric concentrations at Kiattut    ipate in carbonate and silicate mineral weathering reactions
Sermiat. In contrast, meltwaters from southwest sites are su-   (Table 1), which are the principal sink of atmospheric CO2
persaturated, even though oxidation reduces CH4 concentra-      over geologic timescales (Berner et al., 1983; Walker et al.,
tions by up to 50 % during periods of low discharge. CO2        1981). Variations in the weathering intensity of comminuted
concentrations range from supersaturated at sub-Isunnguata      sediments may contribute to glacial–interglacial atmospheric
to undersaturated at Kiattut Sermiat. CO2 is consumed by        CO2 variations as sediments are alternately covered by ice
mineral weathering throughout the melt season at all sites;     and exposed following ice retreat. However, the importance
however, differences in the magnitude of subglacial CO2         of CO2 consumption by mineral weathering is poorly un-
sources result in meltwaters that are either sources or sinks   derstood, including effects from the advance and retreat of
of atmospheric CO2 . At the sub-Isunnguata site, the predom-    continental ice sheets (Ludwig et al., 1999). Recent eval-
inant source of CO2 is organic matter (OM) remineralization.    uations of carbon budgets in proglacial environments indi-
However, multiple or heterogeneous subglacial CO2 sources       cate that mineral weathering results in net sequestration of
maintain atmospheric CO2 concentrations at Russell but not      atmospheric CO2 , suggesting that proglacial systems are un-
at Kiattut Sermiat, where CO2 is undersaturated. These re-      derrecognized as Arctic CO2 sinks (St Pierre et al., 2019);
sults highlight a previously unrecognized degree of hetero-     however, alternate processes could lead to the production of
geneity in greenhouse gas dynamics under the Greenland Ice      greenhouse gases in glacial systems. For instance, CH4 pro-
                                                                duction in anaerobic subglacial environments driven by the

Published by Copernicus Publications on behalf of the European Geosciences Union.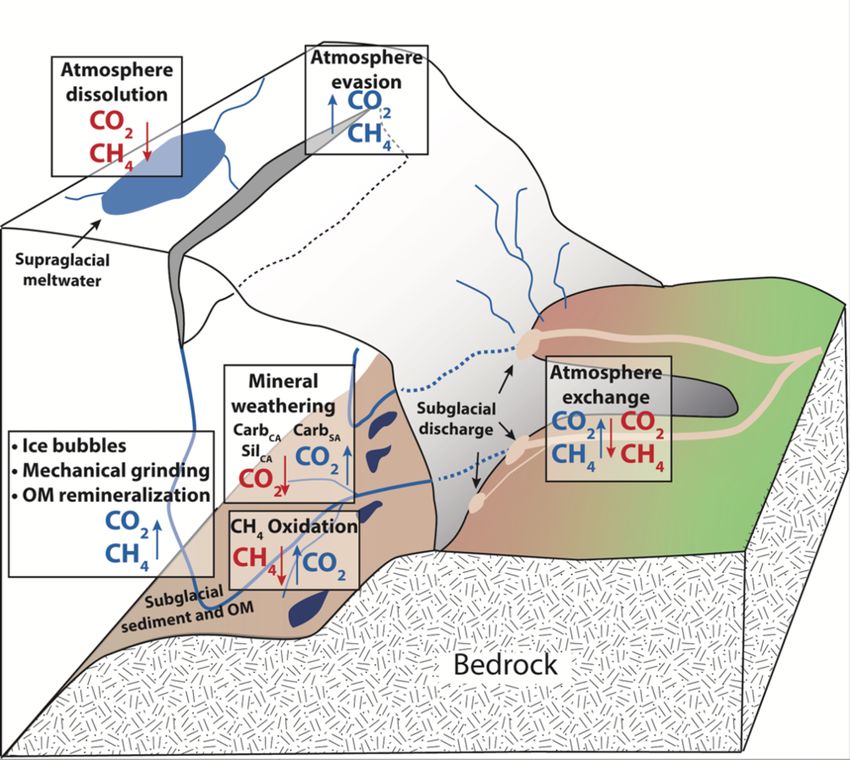
1628                                             A. J. Pain et al.: Heterogeneous CO2 and CH4 content of glacial meltwater

remineralization of organic matter (OM) contained in soils
and forests covered during glacial margin fluctuations has
been suggested as a potential carbon feedback to drive warm-
ing (Sharp et al., 1999; Wadham et al., 2008). Because the
global warming potential of CH4 is 25 times greater than
CO2 , even limited subglacial methanogenesis has the po-
tential to strongly impact the greenhouse gas composition
of glacial meltwater. Combined inorganic and organic sub-
glacial processes may therefore produce glacial meltwater
that is a source or sink of greenhouse gas. While the net im-
pact of these processes on modern carbon fluxes is poorly
constrained, determining these impacts will improve mod-
ern carbon budgets as well as depictions of how fluxes may
have evolved during the advance and retreat of continental
ice sheets.
   In subglacial environments where remineralization is lim-
ited by low OM availability, the major element solute load
of glacial meltwater is typically dominated by products of
mineral weathering reactions (Tranter, 2005). The extent of
mineral weathering in subglacial environments depends in           Figure 1. Conceptual diagram of subglacial sources and sinks of
part on the availability of acids to drive reactions, namely       CO2 and CH4 . Arrows indicate the direction of fluxes. Boxes rep-
sulfuric and carbonic acids (Table 1). Sulfuric acid is de-        resent processes, and sources of gases to subglacial meltwaters are
rived from the oxidation of reduced sulfur species, which          indicated by blue text, while sinks of gases to subglacial meltwater
largely occur as iron sulfide minerals including pyrite (Tran-     are indicated by red text. Gas bubbles, mechanical grinding, and
                                                                   OM remineralization are grouped because all are CO2 and CH4
ter, 2005). Sulfide oxidation may occur abiotically; however,
                                                                   sources.
the kinetics of microbially mediated sulfide oxidation is sev-
eral orders of magnitude faster and may lead to local deple-
tion of oxygen given a sufficient supply of sulfide minerals
(Sharp et al., 1999). In contrast, carbonic acid may be derived    land Ice Sheet (Wadham et al., 2019). The is the last re-
from multiple external or in situ sources of CO2 to the sys-       maining ice sheet in the Northern Hemisphere following col-
tem. The dominant external source is supraglacial meltwa-          lapse of other ice sheets since the Last Glacial Maximum
ter that flows to the subglacial system through moulins fol-       (∼ 20 ka). It has been losing mass at increasing rates that av-
lowing equilibration with atmospheric CO2 (Fig. 1). Unlike         eraged 286 ± 20 Gt/yr between 2010–2018, representing a 6-
proglacial environments where free exchange between water          fold increase since the 1980s (Mouginot et al., 2019). While
and the atmosphere may resupply CO2 consumed by weath-             mineral weathering significantly modifies the chemical com-
ering, subglacial environments may be partially or fully iso-      position of Greenland Ice Sheet subglacial discharge (e.g.,
lated from the atmosphere, limiting further atmospheric CO2        Hindshaw et al., 2014; Deuerling et al., 2018; Urra et al.,
invasion and thus the extent of mineral weathering with car-       2019) and should consume CO2 similar to other glacial and
bonic acid. However, additional atmospheric CO2 may be de-         proglacial environments, the recent identification of micro-
livered in open portions of the subglacial environment though      bially driven reactions (including methanogenesis) in sub-
exchange in fractures or moulins along subglacial flow paths       glacial environments of the Greenland Ice Sheet indicates
or in partially air filled conduits, allowing a much greater       that organic processes may also play a role (Dieser et al.,
magnitude of carbonic acid mineral weathering (Graly et al.,       2014; Lamarche-Gagnon et al., 2019). The relative impor-
2017). CO2 may also be derived from in situ sources, such          tance of subglacial greenhouse gas sinks (CO2 consumption
as gaseous CO2 contained in ice bubbles of basal ice or fluid      through mineral weathering) and sources (such as OM rem-
inclusions in rocks that release volatiles (including CO2 ) fol-   ineralization) determines the greenhouse gas composition of
lowing mechanical grinding (Macdonald et al., 2018). When          subglacial discharge, which may then serve as a source or a
OM is available, its remineralization also generates CO2 (and      sink of atmospheric greenhouse gases. Constraining the rela-
potentially CH4 ) along with nutrients, but low OM availabil-      tive impacts and variability of these processes underneath the
ity in many subglacial systems limits remineralization as a        Greenland Ice Sheet will provide important information re-
CO2 source (Fig. 1).                                               garding the current and future impact of Greenland Ice Sheet
   The role of subglacial carbon processes may play an in-         loss on Arctic carbon budgets, as well the role of continental
creasingly important role in modern Arctic carbon budgets          ice sheets on carbon cycle feedbacks.
as disproportionate warming increases glacial meltwater and           To evaluate the net impact of carbon processes on the
sediment fluxes to the ocean, particularly from the Green-         greenhouse gas composition of subglacial discharge of the

The Cryosphere, 15, 1627–1644, 2021                                                     https://doi.org/10.5194/tc-15-1627-2021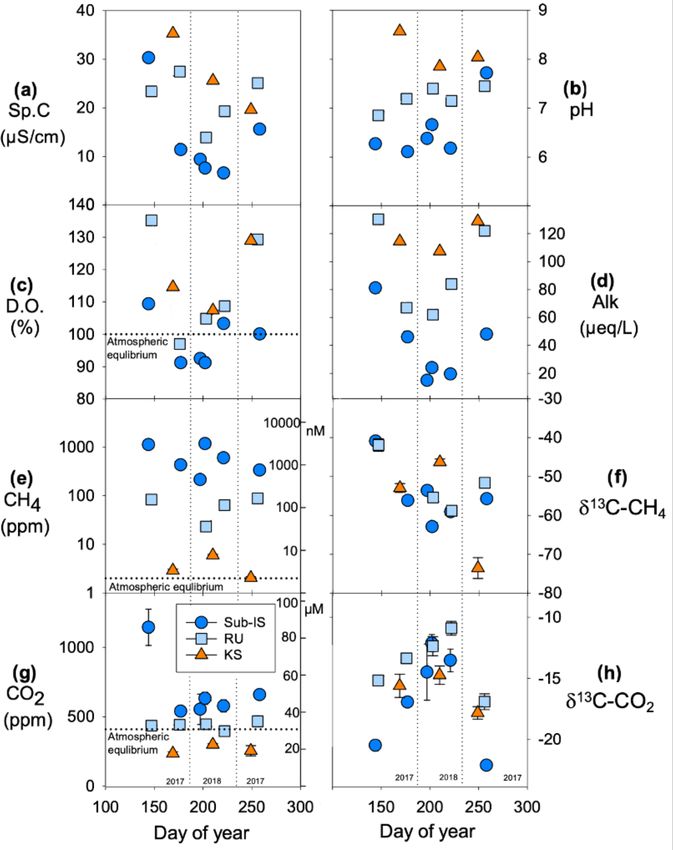
A. J. Pain et al.: Heterogeneous CO2 and CH4 content of glacial meltwater 1629
Table 1. Mineral weathering reactions and impacts on dissolved CO2 concentrations.
Eq. Mineral Acid Abbreviation∗ Reaction Impact on CO2
(1) Carbonate Carbonic CarbCA (Ca, Mg)CO3 + H2 O+ CO2 → (Ca2+ , Mg2+ )+ 2HCO− 3 CO2 sink
(2) Sulfuric CarbSA 2(Ca, Mg)CO3 + H2 SO4 → 2(Ca2+ , Mg2+ )+ SO−2 4 + H2 O + CO2 CO2 source
(3a) Silicate Carbonic SilCA (Ca, Mg)Al2 Si2 O8 + 2CO2 + 3H2 O → (Ca2+ , Mg2+ )+ 2HCO− 3 + Al2 Si2 O5 (OH)4 CO2 sink
(3b) (Na, K)AlSi3 O8 + CO2 + 5.5H2 O → (Na, K) + HCO− 3 + 0.5Al2 Si2 O5 (OH)4 + 2H4 SiO4 CO2 sink
(4a) Sulfuric SilSA (Ca, Mg)Al2 Si2 O8 + H2 SO4 + H2O → (Ca2+ , Mg2+ )+ SO−24 + Al2 Si2 O5 (OH)4 No impact
(4b) 2(Na, K)AlSi3 O8 + H2 SO4 + 9H2 O → 2(Na+ , K+ )+ SO2−
4 + Al2 Si2 O5 (OH)4 No impact
∗ Abbreviations are based first on the mineral class (carbonate: carb; silicate: sil) and then on the acid (carbonic acid: CA; sulfuric acid: SA).
Greenland Ice Sheet, we compare water chemistry, dissolved 2018, respectively (van As et al., 2018). The total catchment
CO2 and CH4 concentrations, and gas stable isotopic com- size for the Isunnguata is 15 900 km2 , though the size of the
positions between three subglacial discharge sites draining sub-catchment draining to the Northern Tributary is much
land-terminating glaciers of the Greenland Ice Sheet over the smaller with a drainage area of approximately 40 km2 (Lind-
melt seasons of 2017 and 2018 (Fig. 2). We employ mass bäck et al., 2015; Rennermalm et al., 2013); therefore, we
balance models utilizing the concentrations of major cations hereby refer to this site as the sub-Isunnguata watershed. The
and anions to determine the magnitude of the impact on total drainage area for the Russell Glacier is not precisely
CO2 concentrations from mineral weathering reactions (Ta- known; however, the catchment draining both the Russell
ble 1). These results are combined with measured gas con- and Leverett glaciers has been estimated at approximately
centrations and δ 13 C to determine the relative importance of 900 km2 (Lindbäck et al., 2015), while the Leverett drainage
mineral weathering compared to OM remineralization on the area alone is estimated at approximately 600 km2 (Hawk-
CH4 and CO2 content of subglacial discharge. We also as- ings et al., 2016). We therefore estimate the Russell drainage
sess the temporal and spatial variability of these processes area at approximately 300 km2 , though it may be consider-
under the Greenland Ice Sheet to improve our understanding ably smaller (van de Wal and Russell, 1994). Discharge from
of carbon cycling in Greenland subglacial environments and the third site in southern Greenland, Kiattut Sermiat (KS;
the implications of Greenland Ice Sheet mass loss on Arctic 61◦ 120 13.500 N, 45◦ 190 49.100 W), drains to the Kuusuaq River
carbon budgets. near the town of Narsarsuaq. While Kuusuaq discharge is not
monitored, a previous study using dye tracing techniques es-
timated approximately 0.22 km3 of discharge in 2013, and
2 Methods its catchment size was estimated at 36 km2 (Hawkings et al.,
2016).
2.1 Study locations Underlying lithologies differ between sites. Southwest
Qinnguata Kuussua sites are located near the boundary be-
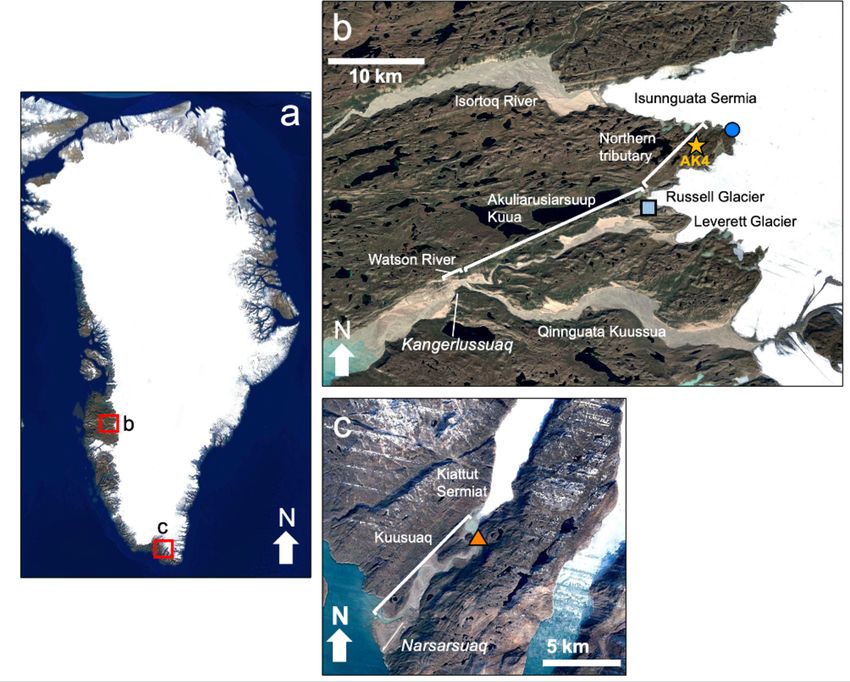
Our three subglacial discharge locations are located in south- tween the Archean craton to the south and the southern
west (Fig. 2a, b) and southern (Fig. 2a, c) Greenland (pictures Nagssugtoqidian Orogen to the north (Henriksen et al.,
given in the Supplement). Our sub-Isunnguata watershed (IS; 2009). The Archean block is composed of granites and gran-
67◦ 090 27.100 N, 50◦ 030 25.000 W) and Russell Glacier water- ulite facies orthogneisses that were intruded by mafic dikes
shed (RU; 67◦ 050 22.100 N, 50◦ 140 18.700 W) drain to the Aku- during Paleoproterozoic rifting. These rocks were deformed
liarusiarsuup Kuua, which is a tributary to the Qinnguata and modified during subsequent continent-to-continent colli-
Kuussua. The short stretch of river downstream of the con- sion in the Paleoproterozoic to create the amphibolite facies
fluence of the Akuliarusiarsuup Kuua and the main stem of gneisses of the southern Nagssugtoqidian Orogen (van Gool
the Qinnguata Kuussua near the town of Kangerlussuaq is et al., 2002). Kiattut Sermiat lies within the Paleoprotero-
also known as the Watson River (Fig. 2b). The majority of zoic Ketilidian fold belt (Henriksen et al., 2009). Lithologies
drainage from the Isunnguata Glacier drains to the north- in this region include the Julianehåb granite and associated
ern Isortoq River (Fig. 2); however, a sub-catchment of the basic intrusions and the sedimentary and volcanic rocks of
Isunnguata drains to a stream that directly feeds the Aku- the Mesoproterozoic Gardar Province that include a suite of
liarusiarsuup Kua, which we refer to as the Northern Trib- alkaline igneous rocks and basaltic dikes with interbedded
utary, while the Akuliarusiarsuup Kuua refers to river that sandstones (Kalsbeek and Taylor, 1985; Upton et al., 2003).
flows between the outlet of the Russell Glacier and the con- Previous studies have characterized chemical weathering
fluence with the Qinnguata Kuussua (Fig. 2b). Watson River reactions in subglacial discharge to the Akuliarusiarsuup Kua
discharge is monitored by PROMICE (Programme for Mon- and Qinnguata Kuussua (Deuerling et al., 2018; Hasholt et
itoring of the Greenland Ice Sheet; van As et al., 2018), and al., 2018; Yde et al., 2014), in the Kuusuaq that drains Kiat-
total discharge was 4.3 and 3.6 km3 of water in 2017 and tut Sermiat (Hawkings et al., 2016), and in comparison be-
https://doi.org/10.5194/tc-15-1627-2021 The Cryosphere, 15, 1627–1644, 2021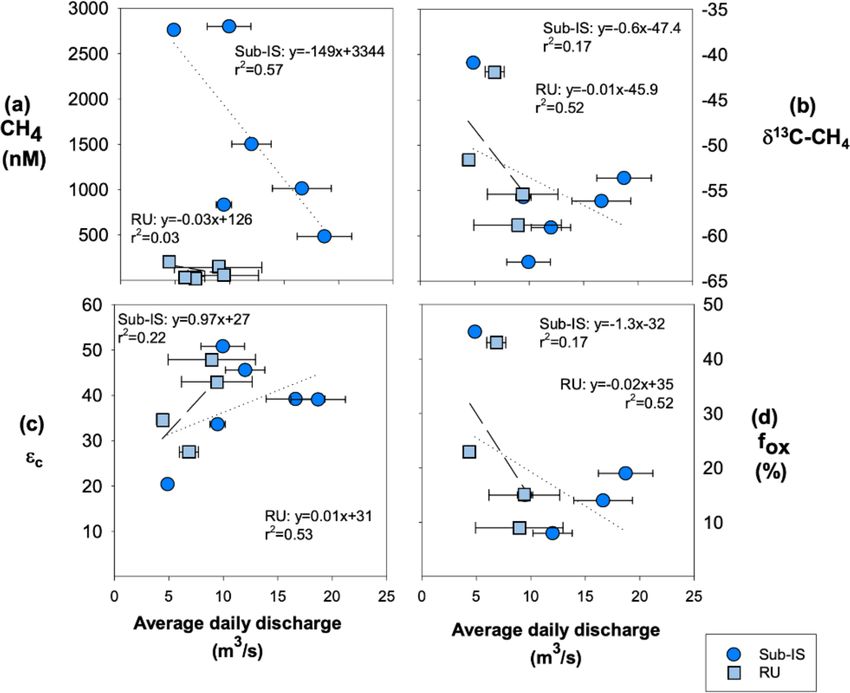
1630                                                 A. J. Pain et al.: Heterogeneous CO2 and CH4 content of glacial meltwater

Figure 2. Google Earth satellite images of study locations in (a) Greenland including (b) locations near the town of Kangerlussuaq, including
the sub-Isunnguata water sampling location (dark blue circle) and Russell water sampling location (light blue square). The gold star represents
the location of AK4, where proglacial river discharge records were collected. (c) Location of Kiattut Sermiat site (orange triangle) near the
town of Narsarsuaq in southern Greenland where water samples were collected. © Google Earth.

tween these two sites (Urra et al., 2019). There has been ex-             which was less than 10 m for the sub-Isunnguata site and ap-
tensive work regarding ice sheet dynamics and hydrology in                proximately 100 m for the Russell Glacier site. Subglacial
the southeast glaciers draining to the Akuliarusiarsuup Kua               discharge from Kiattut Sermiat site flowed through a glacial
and Qinnguata Kuussua (Van As et al., 2017, 2018; Lind-                   meltwater lake prior to arriving at the sampling location,
bäck et al., 2015) as well as southern Kuusuaq catchments                 which was approximately 1.1 km from the glacial outlet
(Warren and Glasser, 1992; Winsor et al., 2014). Subglacial               (Fig. 2) and therefore may experience a more interaction
permafrost has been identified near the sub-Isunnguata site               with atmospheric gases during transport from the subglacial
(Ruskeeniemi et al., 2018) and mostly likely formed during                discharge site to our sampling location. We collected water
Holocene fluctuations in the ice sheet margin. While a sim-               samples by pumping water through a 0.5 cm flexible PVC
ilar Holocene ice retreat and re-advance may have occurred                tube that was placed in flowing water as far as possible from
in southern Greenland (Larsen et al., 2016), it is unknown                shore (approximately 1–2 m). A YSI Pro Plus sensor that was
whether this retreat led to the organic deposits below the ice            calibrated daily was installed in an overflow cup filled from
sheet.                                                                    the bottom to measure specific conductivity (Sp.C), temper-
                                                                          ature, pH, dissolved oxygen, and oxidation–reduction po-
2.2    Sample collection                                                  tential (ORP). These parameters were monitored until sta-
                                                                          ble, between about 10 and 30 min, after which samples were
We collected water samples from subglacial discharge sites                collected and preserved in the field according to the solute
in spring and fall of 2017 and the summer of 2018 to ob-                  to be measured after being filtered through a 0.45 µm trace-
serve seasonal variations in water chemistry. To minimize                 metal grade Geotech high-capacity disposable canister filter.
atmospheric influence, samples were collected as close as                 Samples for cations and anions were collected in HDPE bot-
possible to the glacier front where subglacial waters emerge,

The Cryosphere, 15, 1627–1644, 2021                                                            https://doi.org/10.5194/tc-15-1627-2021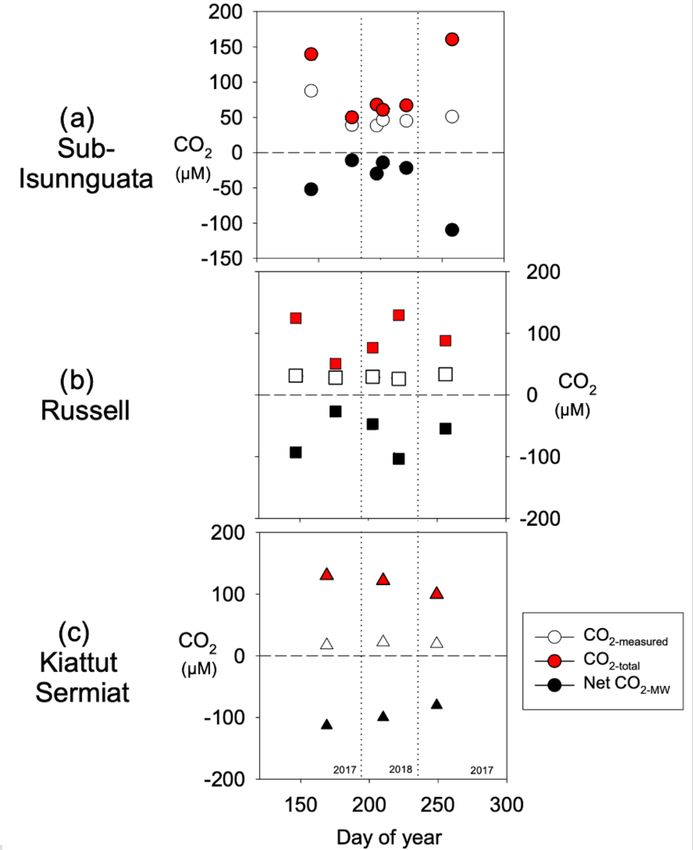
A. J. Pain et al.: Heterogeneous CO2 and CH4 content of glacial meltwater                                                  1631

tles; cation samples were preserved with Optima-grade ul-        analyses was less than 5 %. DIC concentrations were mea-
trapure nitric acid (pH < 2), while no preservative was added    sured on a UIC (coulometrics) 5011 CO2 coulometer cou-
to anion samples. Dissolved inorganic carbon (DIC) samples       pled with an AutoMate Preparation Device. Samples were
were filtered through 0.2 µm filters directly to the bottom      acidified, and the evolved CO2 was carried through a silver
of 20 mL Qorpak glass vials and allowed to overflow until        nitrate scrubber to the coulometer where total C was mea-
sealed tightly with no headspace.                                sured. Accuracy was calculated to be ±0.1 mg/L based on
   Gas samples were collected in duplicate via headspace ex-     measurement of check standards.
tractions according to methods outlined in Repo et al. (2007)
and Pain et al. (2019b). Unfiltered water was pumped into        2.4   Methane modeling
the bottom of 500 mL bottles until they overflowed. Bottles
were immediately capped with rubber stoppers fitted with         To assess CH4 sources and sinks, we calculate εc , or the car-
two three-way inlet valves. A total of 60 mL of water was        bon isotopic fractionation factor between CO2 and CH4 as
extracted from one inlet and replaced with 60 mL of atmo-        defined in Whiticar (1999):
spheric air (for spring and fall 2017 sampling trips) or ul-
                                                                 εc = δ 13 CCO2 − δ 13 CCH4 .                                (5)
trapure N2 gas in a gas bag (summer 2018 sampling trip).
Bottles were shaken for 2 min to equilibrate headspace gas       Values of εc reflect methanogenesis pathways (acetoclastic or
with water, and headspace gas was extracted and immedi-          CO2 reduction) as well as the extent of oxidation. Values of
ately injected into 60 mL glass serum bottles that had been      εc between approximately 40 ‰ and 55 ‰ are produced for
evacuated immediately prior to sample introduction. Sam-         CH4 generated via acetoclastic methanogenesis, while CO2
ples were stored at room temperature until analysis, which       reduction produces values between approximately 55 ‰ and
occurred within 1 week of collection. Measured headspace         90 ‰. Lower values (εc between 5 and 30) result when CH4
concentrations were converted to dissolved concentrations        oxidation predominates. Modern atmospheric input without
using methods outlined in Pain et al. (2019b). When atmo-        additional alteration of CO2 or CH4 isotopic systematics re-
spheric air was used for headspace extractions, atmosphere       sults in a εc value of approximately 40 (Whiticar, 1999).
samples were collected in tandem and analyzed to correct            We calculated CH4 oxidation using the isotopic method
the calculated dissolved CO2 and CH4 concentrations and          outlined in Mahieu et al. (2008) and Preuss et al. (2013). The
isotopic compositions for atmospheric CO2 and CH4 . This         fraction of oxidized methane (fox ) in an open system is given
correction altered CH4 concentrations by up to 22 % for one      by
sample from the Russell Glacier, though less than 5 % for all
other samples, and resulted in a correction of δ 13 C-CH4 of                   δE − δP
up to 1.3 ‰. For CO2 , the correction altered concentrations     fox =                          ,                            (6)
                                                                         1000 × (αox − αtrans )
by up to 15 % for one sample collected at Kiattut Sermiat,
though less than 10 % for all other samples, and resulted in a   where δE is the measured δ 13 C-CH4 value for each water
correction of δ 13 C-CO2 of up to 0.4 ‰.                         sample, δP is δ 13 C-CH4 of produced methane, αox is the
   In samples collected in fall 2017 and summer 2018, al-        oxidation fractionation factor, and αtrans is a fractionation
kalinity was measured in the field laboratory within 3 d         factor resulting from diffusive transportation of CH4 . While
of collection by titration with 0.01 N HCl using the Gran        the exact value of δP is unknown, diagenetic alteration of
method. Because alkalinity measurements were not avail-          δ 13 C-CH4 values through oxidation or transport only enrich
able for the spring 2017 sampling trip, we estimate alkalin-     δ 13 C-CH4 signatures; therefore, the value of δP is taken as
ity with PHREEQC modeling and the phreeqc.dat database           the most depleted δ 13 C-CH4 signature assuming it is the
(Parkhurst, 1997) using major cations and anions, pH, tem-       least impacted by diagenetic alteration. Literature-reported
perature, and DIC concentrations as model inputs.                values for αox range between 1.003 and 1.049. We calcu-
                                                                 late the fraction of oxidized methane with the largest frac-
2.3   Laboratory analysis                                        tion factor (αox = 1.049; Mahieu et al., 2008), which yields
                                                                 the minimum amount of CH4 oxidation required to explain
Gas samples were analyzed for CO2 and CH4 concentrations         the observed variations in δ 13 CH4 and thus is a conserva-
as well as δ 13 C-CO2 and δ 13 C-CH4 on a Picarro G2201-i        tive estimate for CH4 oxidation, and actual oxidation ratios
cavity ring-down spectrometer in the field within a few days     may be higher. Literature-reported values for αtrans vary from
of collection. Carbon isotopic compositions are reported in      1 for advection-dominated systems to 1.0178 for diffusion-
reference to Vienna Pee Dee Belemnite (VPDB). Check              dominated porous media (de Visscher et al., 2004; Mahieu et
standards of known CO2 and CH4 concentrations and iso-           al., 2008; Preuss et al., 2013). We assume that transport is ad-
topic compositions were measured during each sample run          vection dominated and thus assume αtrans = 1; however, dif-
and were accurate within 10 %. Anion and cation concentra-       fusive transport of CH4 may result in fractionation of CH4 in
tions were measured on an automated Dionex ICS-2100 and          the subglacial environment and lead to relatively lower esti-
ICS-1600 ion chromatograph, respectively. Error on replicate     mates of fox . Because hydrologic connectivity between sub-

https://doi.org/10.5194/tc-15-1627-2021                                                 The Cryosphere, 15, 1627–1644, 2021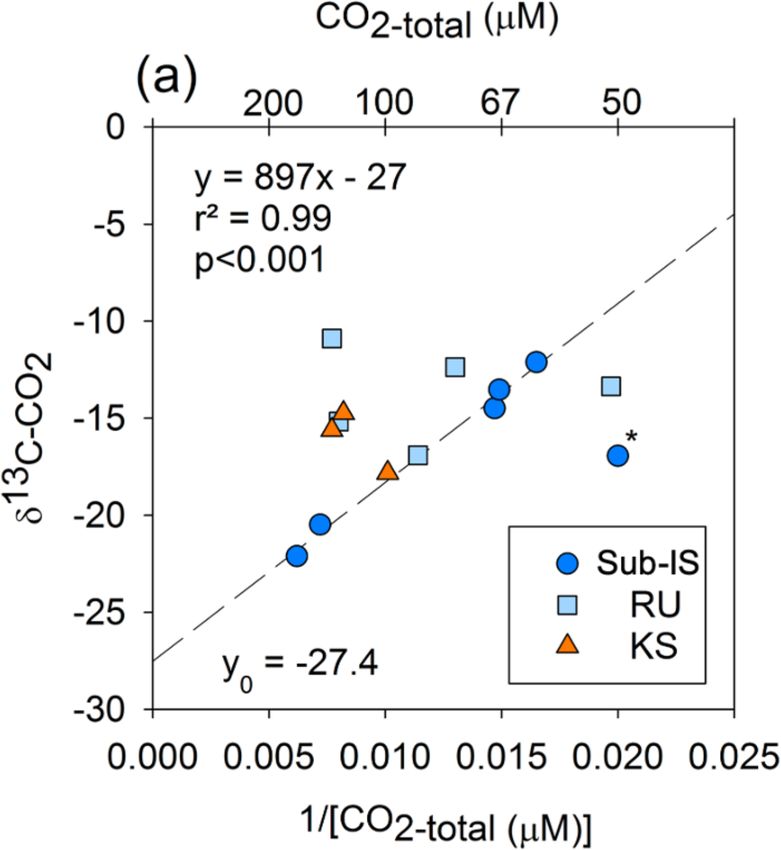
1632                                            A. J. Pain et al.: Heterogeneous CO2 and CH4 content of glacial meltwater

glacial methanogenic meltwater pockets and drainage fea-         that the concentration of CO2 measured at the subglacial out-
tures is not well described, the relative importance of ad-      let is equivalent to the net change in CO2 due to mineral
vective compared to diffusive CH4 transport within the sub-      weathering plus the sum of all other subglacial CO2 sources
glacial drainage system is not well understood; however, it      and sinks. We refer to the sum of all other subglacial CO2
is presumed to be an advection-dominated system in which         sources and sinks as CO2-total , which represents the amount
expanding drainage networks access and drain methanogenic        of CO2 that must have been supplied to the subglacial envi-
meltwater pockets throughout the melt season.                    ronment to balance the mineral weathering CO2 sink:

2.5    Mineral weathering and carbonate modeling                 CO2-measured = Net CO2-MW + CO2-total .                   (10)

We used major cation and anion concentrations and alkalin-       The sources of CO2 to CO2-total may be evaluated through
ity to partition solutes into the four mineral weathering re-    the use of Keeling plots, which are constructed as the in-
actions in Table 1 after correcting solute concentrations for    verse of CO2 concentrations ([CO2 ]−1 ) versus stable iso-
marine aerosol deposition using measured chloride concen-        topic composition (δ 13 C-CO2 ). If variations in the concen-
trations and standard seawater element ratios. The mass bal-     tration and isotopic composition of CO2 arise from the mix-
ance model followed the methods of Deuerling et al. (2019).      ing of two CO2 reservoirs with constant isotopic compo-
After apportioning solutes to mineral weathering reactions,      sitions and concentrations (Keeling, 1958), a linear rela-
we used the stoichiometries of reactions to calculate the im-    tionship is expected between [CO2 ]−1 and δ 13 C-CO2 . The
pact of each reaction on dissolved CO2 concentrations (Ta-       y intercept of a regression between these variables repre-
ble 1). The mineral weathering model apportions solutes to       sents the isotopic composition of the high-CO2 end-member.
reactions in Table 1 based on the ratios of Ca/Na and Mg/Na      Because measured CO2 concentrations include both sub-
in silicate minerals in stream bed load samples, which were      glacial CO2 sources and sinks, which may include consid-
taken to be 0.54 and 0.38, respectively, for sub-Isunnguata      erable consumption through mineral weathering reactions,
and Russell Glacier samples (Deuerling et al., 2019; Hind-       the magnitude of the total subglacial CO2 source is taken
shaw et al., 2014; Wimpenny et al., 2010, 2011) and 0.39 and     as CO2-total . We therefore construct Keeling plots between
0.27, respectively, for Kiattut Sermiat samples (Da Prat and     [CO2-total ]−1 and measured δ 13 C-CO2 values because while
Martin, 2019). Because mineral weathering reactions may          mineral weathering impacts the concentration of CO2 , its iso-
both add and remove CO2 , we discuss both the net impact of      topic composition is not appreciably altered (Myrttinen et al.,
mineral weathering on CO2 concentrations (Net CO2-MW ),          2012) compared to the range of isotopic compositions of po-
which may have a positive or negative value,                     tential CO2 end-members, namely OM remineralization, at-
                                                                 mospheric CO2 , and lithogenic CO2 sources due to mechan-
[Net CO2-MW ] = [CO2-CarbCA ] + [CO2-CarbSA ]                    ical grinding (Fig. 1).
  + [CO2-SilCA ],                                         (7)
                                                                 2.6   Discharge relationships
as well as the total impact of mineral weathering on CO2
                                                                 We evaluate the relationship between subglacial CH4 and
concentrations (Total CO2-MW ),
                                                                 CO2 dynamics and glacial meltwater river discharge records
[Total CO2-MW ] = |[CO2-CarbCA ]| + |[CO2-CarbSA ]|              collected downstream of the sub-Isunnguata and upstream
                                                                 of the Russell sampling sites. Proglacial river discharge was
  + |[CO2-SilCA ]|,                                       (8)
                                                                 collected in the Akuliarusiarsuup Kuua (AK) River at the
where changes in the concentrations of CO2 are defined by        AK4 site, 2 km downstream of the sub-Isunnguata sampling
their absolute values. To discuss the relative importance of     site (Fig. 2b). The river discharge dataset is an updated and
individual reactions, we define proportional contributions of    extended version of Rennermalm et al. (2012) using refer-
each reaction as follows:                                        ence and regression models to correct Solinst level logger
                                                                 drift in water stage (Solinst, 2017) and a total of 57 dis-
                |[CO2-CarbCA ]|                                  charge measurements to convert continuous water stage to
%CO2-CarbCA =                    × 100,                 (9a)
              [Total CO2-MW ]                                    discharge. The standard uncertainty (i.e., the 68th percent
                |[CO2-CarbSA ]|                                  confidence interval or 1 standard deviation) was determined
%CO2-CarbSA =                    × 100,                 (9b)     to be 17 % using methods and recommendations provided by
              [Total CO2-MW ]
               |[CO2-SilCA ]|                                    Herschy (1999), ISO Guide 98-3 (2008), and WMO (2010).
%CO2-SilCA =                    × 100.                  (9c)        Because diurnal fluctuations in river discharge can be
             [Total CO2-MW ]
                                                                 large, and differing water travel times from subglacial outlet
We combine measured CO2 concentrations with Net                  sites to the discharge monitoring site induces a lag between
CO2-MW in order to determine the magnitude of CO2 pro-           maximum daily discharge at subglacial discharge sites and
duction or consumption in the subglacial environment due to      the AK4 site outlet, we compare subglacial CH4 and CO2
processes besides mineral weathering. This analysis assumes      concentrations to average daily discharge, calculated as the

The Cryosphere, 15, 1627–1644, 2021                                                 https://doi.org/10.5194/tc-15-1627-2021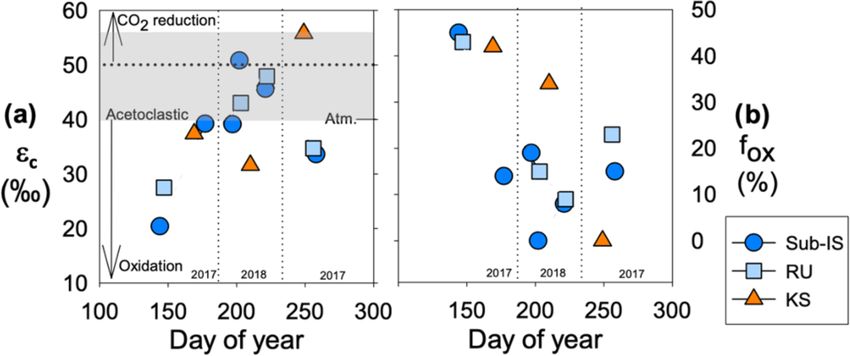
A. J. Pain et al.: Heterogeneous CO2 and CH4 content of glacial meltwater 1633
average of hourly discharge estimates over the days on which are close to atmospheric equilibrium at Kiattut Sermiat
subglacial discharge water samples were collected. We use (4 ± 2 ppm or 9 ± 5 nM). Mean δ 13 C-CH4 values (Fig. 3f)
the AK4 site discharge records for evaluating concentration– are similar between sub-Isunnguata (−54.7 ± 7.5 ‰), Rus-
discharge relationships for both sub-Isunnguata and Russell sell (−52 ± 7.3 ‰), and Kiattut Sermiat (−57.6 ± 14.2 ‰).
sites. Although this site is upstream of the Russell Glacier, Measured CO2 concentrations (Fig. 3g) are consistently
its close proximity to the Russell Glacier suggests it is more supersaturated with respect to atmospheric concentra-
likely to reflect local melting patterns similar to those that tions for sub-Isunnguata (685 ± 230 ppm or 58 ± 18 µM),
would be controlling discharge dynamics at the Russell than near atmospheric equilibrium for Russell (442 ± 31 ppm
discharge records collected at the Watson River outlet. While or 29 ± 4 µM), and undersaturated for Kiattut Sermiat
Watson River discharge records are also available through (263 ± 33 ppm or 19 ± 2 µM). Mean δ 13 C-CO2 values
PROMICE (van As et al., 2018), which includes some con- (Fig. 3h) are lower in spring and fall for sub-Isunnguata
tributions from the Russell Glacier, the Watson River in- (−16.6 ± 4.0 ‰) compared to Russell (−13.7 ± 2.3 ‰) and
cludes discharge from the Akuliarusiarsuup Kuua (draining Kiattut Sermiat (−16.1 ± 1.6 ‰) sites, though similar sea-
sub-Isunnguata, Russell, and Leverett catchments) as well as sonal variation occurs for all sites with relatively more de-
the much larger Qinnguata Kuussua catchment, and therefore pleted values in the spring and fall compared to summer.
Watson River discharge records are not likely to be repre-
sentative of the temporal changes in the magnitude and vari- 3.2 Methane oxidation and relationship with discharge
ability of discharge from the much smaller Russell Glacier
catchment. Values of εc are similar over time for sub-Isunnguata
(38 ± 10 ‰) and Russell (38 ± 9 ‰) and are relatively higher
in the summer sampling period, while Kiattut Sermiat εc val-
3 Results ues are higher on average (42 ± 13 ‰) with lowest values in
the summer (Fig. 4a). Estimates of fox are similar between
3.1 Temporal variability in water chemistry and gas sub-Isunnguata (17 ± 15 %), Russell (23 ± 15 %), and Kiat-
concentrations tut Sermiat sites (25 ± 22 %; Fig. 4b). However, fox values
are higher in the spring and fall sampling times compared to
Chemical parameters differ spatially between subglacial summer for sub-Isunnguata and Russell and approach 50 %
discharge sites as well as temporally through the 2017– in the spring, while Kiattut Sermiat values decrease through-
2018 melt seasons. Comparing the means and standard de- out the melt season.
viations of water samples collected throughout 2017 and CH4 concentrations, δ 13 C-CH4 values, and fox are weakly
2018, specific conductivity (Sp.C; Fig. 3a) is typically high- negatively correlated to average daily discharge for both sub-
est at Kiattut Sermiat (26 ± 8 µS/cm), followed by Rus- Isunnguata and Russell sites (Fig. 5a, b and d), while εc
sell (22 ± 5 µS/cm) and sub-Isunnguata sites (13 ± 9 µS/cm; is weakly positively correlated with discharge for both sub-
Fig. 3a). All sites show variability over time, with lowest val- Isunnguata and Russell (Fig. 5c).
ues occurring in the summer for sub-Isunnguata and Rus-
sell, while Sp.C drops continuously with days of the year 3.3 Mineral weathering impacts on CO2 and
for Kiattut Sermiat. Sites differ in pH, and average val- relationship with discharge
ues at Kiattut Sermiat (8.2 ± 0.4) are higher than both Rus-
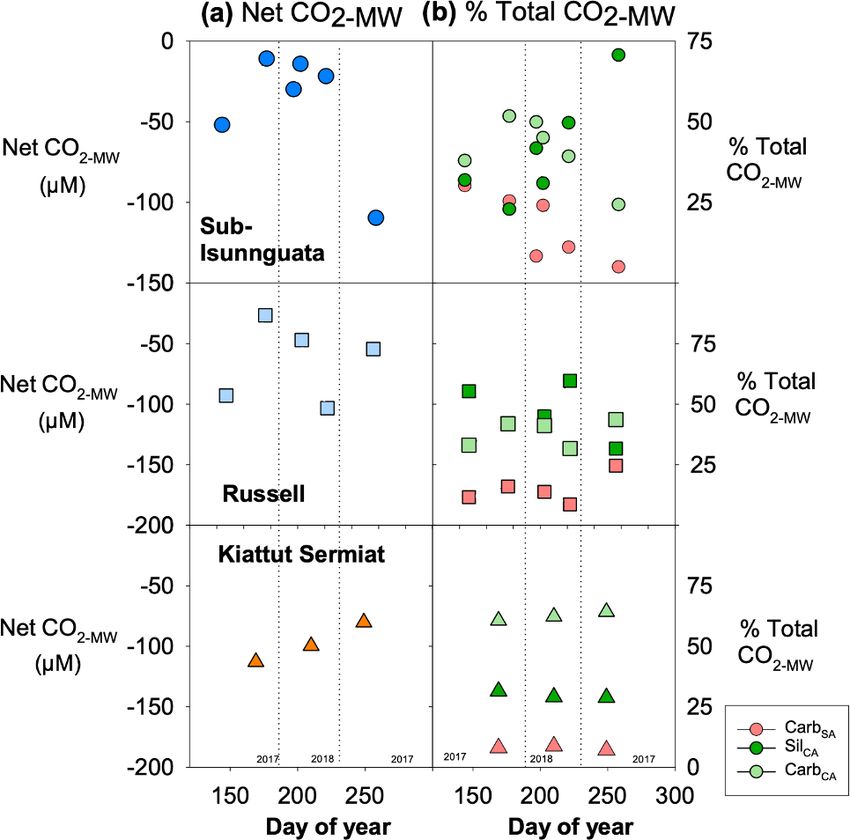
sell (7.2 ± 0.2) and sub-Isunnguata (6.6 ± 0.6; Fig. 3b), and Mineral weathering leads to net sequestration of CO2 at all
while values vary over time, no consistent trend is iden- three sites (Fig. 6a). The magnitude of net 1CO2 differs be-
tified between sites. The saturation of dissolved oxygen tween sites with the lowest average values at sub-Isunnguata
(D.O.) with respect to atmospheric concentrations is sim- (−39 ± 37 µM) followed by Russell (−65 ± 32 µM) and Ki-
ilar between sites, though sub-Isunnguata (98 ± 8 %) val- attut Sermiat (−98 ± 17 µM) sites. Individual mineral weath-
ues fall below Russell (115 ± 16 %) and Kiattut Sermiat ering reactions produce differing contributions between sites
(117 ± 11 %) during all sampling times and exhibit under- and over time, with notable differences between southwest
saturation in the mid-summer samples, while Russell and sites (sub-Isunnguata and Russell) and the southern Kiat-
Kiattut Sermiat are consistently supersaturated (Fig. 3c). tut Sermiat site (Fig. 6b). For instance, the proportional
Alkalinity is similar at Russell (93 ± 31 µeq/L) and Kiat- contribution of CarbSA is similar between sub-Isunnguata
tut Sermiat (93 ± 26 µeq/L), which are higher than at sub- (17 ± 11 %) and Russell (15 ± 6 %) but lower at Kiattut Ser-
Isunnguata (39 ± 25 µeq/L), but all reach minimum val- miat (8 ± 1 %; Fig. 6b). Kiattut Sermiat has a relatively
ues in summer (Fig. 3d). CH4 concentrations differ by or- greater contribution from CarbCA (62 ± 2 %) compared to
ders of magnitude between sites (Fig. 3e) and are consis- sub-Isunnguata (41 ± 10 %) and Russell (38 ± 6 %), while
tently supersaturated with respect to atmospheric concentra- SilCA is lower at Kiattut Sermiat (28 ± 1 %) compared to
tions at sub-Isunnguata (648 ± 411 ppm or 1575 ± 997 nM) sub-Isunnguata (41 ± 17 %) and Russell (47 ± 11 %). Kiattut
and Russell (58 ± 33 ppm or 110 ± 78 nM) sites, while they Sermiat additionally exhibits low seasonal variability in the
https://doi.org/10.5194/tc-15-1627-2021 The Cryosphere, 15, 1627–1644, 2021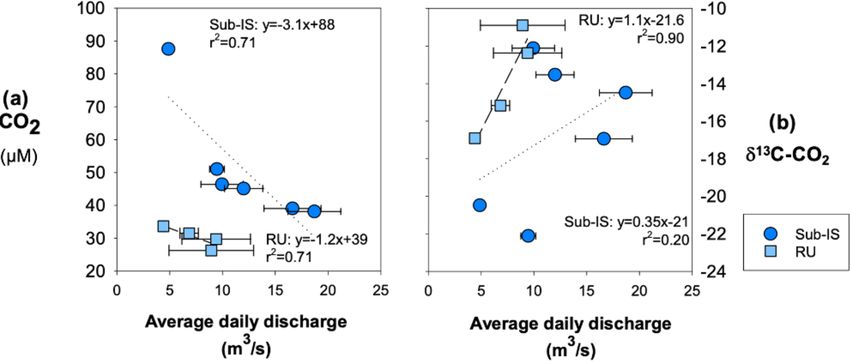
1634                                                A. J. Pain et al.: Heterogeneous CO2 and CH4 content of glacial meltwater

Figure 3. Chemical parameters at sub-Isunnguata (sub-IS), Russell (RU), and Kiattut Sermiat (KS) subglacial water sampling sites versus
day of year for (a) specific conductivity (Sp.C), (b) pH, (c) dissolved oxygen (D.O.) percent saturation, (d) alkalinity (Alk), (e) measured
CH4 concentrations (left y axis in ppm and right y axis in nM), (f) δ 13 -CH4 values, (g) measured CO2 concentrations (left y axis in ppm and
right y axis in µM), and (h) δ 13 C-CO2 values. Atmospheric equilibrium concentrations are indicated by dashed lines and taken as 1.9 ppm
for CH4 and 410 ppm for CO2 . Error bars on CH4 and CO2 concentrations and stable isotopic compositions represent the standard deviation
of replicates and are smaller than symbols for some data points.

proportional contributions of individual mineral weathering              sub-Isunnguata, 94 ± 33 µM for Russell, and 117 ± 16 µM
reactions compared to sub-Isunnguata and Russell sites.                  for Kiattut Sermiat.
   CO2-total represents CO2 concentrations in the subglacial                For both sub-Isunnguata and Russell sites, average daily
environment prior to addition and/or consumption of CO2                  discharge is negatively correlated with CO2 concentrations
through mineral weathering (Eq. 10; Fig. 7). Because the                 (Fig. 8a), while it is positively correlated with δ 13 C-CO2
Net CO2-MW is always negative (more consumption than                     (Fig. 8b).
production), the value of CO2-total is always greater than                  Keeling plots between [CO2-total ]−1 and δ 13 C-CO2 for
measured concentrations (CO2-measured ). Regardless of dif-              each site indicate no linear relationship for Russell or Ki-
ferences in CO2-measured between sites, the average CO2-total            attut Sermiat samples; however, a strong linear correlation is
values are similar between sites and average 91 ± 47 µM for              observed for sub-Isunnguata (r 2 = 0.99; p < 0.001) samples

The Cryosphere, 15, 1627–1644, 2021                                                           https://doi.org/10.5194/tc-15-1627-2021
A. J. Pain et al.: Heterogeneous CO2 and CH4 content of glacial meltwater                                                           1635

Figure 4. CH4 dynamics over the course of the 2017 and 2018 melt seasons including (a) the carbon fractionation factor (εc ) between
dissolved CO2 and CH4 and (b) the fraction of CH4 oxidized (fox ) for sub-Isunnguata (sub-IS), Russell (RU), and Kiattut Sermiat (KS)
samples. Fields of εc representing methanogenesis and oxidation values are based on Whiticar (1999). Values of εc between approximately
40 and 55 (gray shaded region in panel a) are produced for methanogenesis via acetate fermentation, while CO2 reduction produces values
between approximately 50 and 90. Lower values result from a predominant isotopic signature of CH4 oxidation. Atmospheric input without
additional alteration of CO2 or CH4 isotopic systematics results in a εc value of approximately 40.

Figure 5. Relationships between average daily discharge and CH4 dynamics including (a) CH4 concentrations, (b) δ 13 C-CH4 , (c) fox , and
(d) εc for sub-Isunnguata (sub-IS) and Russell (RU) samples. Regressions are shown by dotted lines for Isunnguata and dashed lines for
Russell samples. Horizontal error bars represent the standard deviation of average daily discharge for days samples were collected and are
smaller than symbols for some data points.

with the removal of one outlier, which also had the lowest             4   Discussion
CO2-total value (Fig. 9).
                                                                       We observe orders of magnitude variability in dissolved
                                                                       CH4 and CO2 concentrations in subglacial discharge of the
                                                                       Greenland Ice Sheet, indicating significant differences in the
                                                                       magnitudes of the sources and sinks of these gases across

https://doi.org/10.5194/tc-15-1627-2021                                                       The Cryosphere, 15, 1627–1644, 2021
1636 A. J. Pain et al.: Heterogeneous CO2 and CH4 content of glacial meltwater
Figure 6. Mineral weathering model results in (a) net impact of
mineral weathering reactions on CO2 (Net CO2-MW ; Eq. 7) for
Isunnguata, Russell, and Kiattut Sermiat subglacial discharge sites
(where negative values of Net CO2-MW indicate net sequestration
of CO2 due to mineral weathering) and (b) the proportional con-
tribution of each mineral weathering reaction to the total change in Figure 7. Calculated CO2-total values for (a) sub-Isunnguata,
CO2 (% Total CO2-MW Eqs. 9a–9c). (b) Russell, and (c) Kiattut Sermiat subglacial discharge against day
of the year.
time and space. Supersaturation of both CO2 and CH4 with
respect to atmospheric concentrations indicates that sub-
Isunnguata discharge is a source of both gases to the atmo- Greenland Ice Sheet. CH4 supersaturation occurs at the two
sphere, the neighboring Russell Glacier discharges water that subglacial discharge sites that flow to the Akuliarusiarsuup
is a source of CH4 but near equilibrium with respect to CO2 , Kuua (sub-Isunnguata and Russell), and concentrations are
and Kiattut Sermiat in southern Greenland is a sink of at- similar to the ranges reported in discharge of the Leverett
mospheric CO2 but near equilibrium with respect to CH4 Glacier (up to 600 nM; Lamarche-Gagnon et al., 2019), lo-
(Fig. 3e, g). Because CH4 dynamics may be largely micro- cated near the Russell Glacier in this study (Fig. 2b). How-
bially driven, while CO2 dynamics include microbial as well ever, CH4 concentrations are near atmospheric equilibrium
as abiotic mineral weathering processes, we first discuss CH4 for the Kiattut Sermiat site (Fig. 3e). Because methanogene-
dynamics including a comparison of concentrations, isotopic sis is an anaerobic OM remineralization pathway, it is more
compositions, and extent of oxidation between sites and over likely to occur in subglacial environments isolated from at-
the melt season. We then discuss CO2 concentrations, im- mospheric O2 sources. Widespread observations of methano-
pacts of mineral weathering reactions (Table 1), and an as- genesis in glacial meltwater of southwest Greenland from
sessment of subglacial CO2 sources, including OM reminer- this and other studies (Christiansen and Jørgensen, 2018;
alization. These assessments will contribute to our under- Dieser et al., 2014; Lamarche-Gagnon et al., 2019), and lim-
standing of the variability and controls of CH4 and CO2 con- ited observations of CH4 in subglacial discharge in southern
centrations in subglacial discharge from the Greenland Ice Greenland, suggests heterogeneity in subglacial conditions
Sheet and may improve predictions of the impact of future that support methanogenesis. Methanogenesis fueled by or-
ice melt on Arctic carbon budgets. ganic material overridden during ice sheet growth has been
suggested as a potential climate feedback over glacial inter-
4.1 Sources and sinks of CH4 glacial timescales (Wadham et al., 2008) and may contribute
to observed variations in CH4 concentrations.
Differences in CH4 concentrations and relationships with Subglacial methane concentrations may additionally be
discharge between sites imply heterogeneity in both the ex- controlled by hydrologic factors as the subglacial hydro-
tent and controls of subglacial methanogenesis under the logical network develops throughout the melt season and
The Cryosphere, 15, 1627–1644, 2021 https://doi.org/10.5194/tc-15-1627-2021A. J. Pain et al.: Heterogeneous CO2 and CH4 content of glacial meltwater 1637
Figure 8. Relationships between average daily discharge (a) CO2 concentrations and (b) δ 13 C-CO2 . Regressions are shown by dotted lines
for sub-Isunnguata and dashed lines for Russell samples. Horizontal error bars represent the standard deviation of average daily discharge
for days samples were collected and are smaller than symbols for some data points.
channelization of meltwater conduits increases subglacial tion and discharge, as was observed in Lamarche-Gagnon et
drainage efficiency (Andrews et al., 2015; Cowton et al., al. (2019).
2013). Drainage efficiency impacts both subglacial water res- Our results suggest heterogeneity in the extent of methano-
idence time as well the transport of aerobic supraglacial melt- genesis between outlet glaciers but homogeneity of the mi-
water to the ice bed. Both residence time and oxygen delivery crobial methanogenesis pathway as well as CH4 oxidation
may impact subglacial redox status and methanogenesis po- dynamics between sites. Methanogenesis pathways may be
tential and favor methanogenesis when oxygen supply rates evaluated by δ 13 C-CH4 as well as εc values because they
are low compared to OM remineralization rates. This con- impart distinct δ 13 C signatures to CH4 and CO2 (Whiticar
dition is most likely to be met in distributed subglacial sys- and Schoell, 1986). Dieser et al. (2014) measured a micro-
tems that are hydrologically isolated with limited inputs from bial δ 13 C-CH4 production signal at the Russell Glacier with
aerobic supraglacial meltwater. Such a hydrologic control values between −63 ‰ and −64 ‰, which was interpreted
on methanogenesis is supported by the negative correlation to reflect a possible combination of CH4 produced through
between CH4 concentrations and average daily discharge at both acetoclastic and CO2 reduction pathways. The most
both sites (Fig. 5a). This correlation would suggest that either depleted δ 13 C-CH4 value measured at the sub-Isunnguata
CH4 production occurs predominantly during periods of low in this study was −62.7 ‰, close to values measured by
discharge and greater residence time or higher discharge re- Dieser et al. (2014) (Fig. 3f) and similar to values reported by
sults in the dilution of a CH4 -laden subglacial water source. Lamarche-Gagnon et al. (2019) for the Leverett Glacier. The
While both mechanisms would lead to a similar relationship similar isotopic ratio between our samples and that measured
between discharge and CH4 concentrations, they carry dif- in active methanogenic communities could indicate that sim-
ferent implications for subglacial methanogenesis. If limited ilar methanogenesis pathways occur across this region or that
by residence time, a hydrologic link between glacial hydrol- the δ 13 C-CH4 of stored subglacial CH4 has not been fraction-
ogy and subglacial biogeochemistry would be established be- ated by oxidation or transport in the peak melt season when
cause supraglacial discharges deliver terminal electron ac- we observe these depleted δ 13 C-CH4 values.
ceptors to the ice bed and would limit methanogenesis. If pre- While the exact contributions from each methanogenesis
dominantly controlled by dilution, however, active methano- pathway cannot be inferred from isotopic information alone,
genesis would not be required – only the existence of melt- the range of εc values at outlet glaciers are consistent with
water pockets containing CH4 that may or may not have been predominantly acetoclastic methanogenesis during the peak
recently produced. Further discussion of these mechanisms melt season (Fig. 4a). However, εc values fall below the ex-
is outside the scope of this study. While we have limited pected range from acetoclastic methanogenesis during the
data to make further inferences about hydrologic controls of early and late melt seasons and may result from variations
methanogenesis, the presence of several outliers at the sub- in the extent of subglacial CH4 oxidation. Seasonal variation
Isunnguata site in particular (Fig. 5a) highlights the possi- in CH4 oxidation is supported by consistency between εc and
bility for additional controls including stochastic drainage fox values, which both indicate the greatest impact of oxida-
events or heterogeneity in subglacial CH4 concentrations that tion (approaching 50 %) in the early melt season compared
result in variability in the relationship between concentra- to peak melt season (Fig. 4a, b), with additional evidence of
elevated CH4 oxidation in the late melt season at both sub-
https://doi.org/10.5194/tc-15-1627-2021 The Cryosphere, 15, 1627–1644, 20211638 A. J. Pain et al.: Heterogeneous CO2 and CH4 content of glacial meltwater
Isunnguata and Russell sites. Because our water sampling 4.2 Sources and sinks of CO2
locations were slightly downstream of glacial discharge out-
lets, there is also the possibility that outgassing in between Dissolved CO2 concentrations in subglacial discharge are
the outlet and our sampling location reduced dissolved CH4 consistently supersaturated with respect to atmospheric con-
concentrations and led to more enriched isotopic composi- centrations at the sub-Isunnguata site, near atmospheric equi-
tions of remaining dissolved CH4 . It is likely that some out- librium at the Russell Glacier, and undersaturated at Kiattut
gassing did occur; however, it is unlikely that the extent of Sermiat, indicating that glacial meltwater from the Greenland
outgassing between the glacial outlet and our sampling lo- Ice Sheet can serve as either a source or sink of CO2 to the at-
cation would vary significantly between sampling times, and mosphere. Similar to CH4 , differences in dissolved CO2 dy-
thus outgassing would not fully explain temporal differences namics (Fig. 3g) imply variability in carbon processes under
in concentration, δ 13 C-CH4 , fox , or εc . While our measured the Greenland Ice Sheet. We first discuss potential subglacial
gas concentrations and isotopic compositions likely reflect CO2 sources, including OM remineralization, followed by a
some modification of CH4 and CO2 isotopic compositions discussion of CO2 consumption due to mineral weathering.
due to outgassing, the differences over time are more likely
due to changes in subglacial CH4 dynamics than outgassing. 4.2.1 Subglacial CO2 sources
The extent of CH4 oxidation may be controlled by multiple
factors including oxygen availability, subglacial residences There are many potential sources of CO2 in the subglacial
time, and subglacial hydrology, similar to methanogenesis. environment including dissolution of atmospheric gases in
A hydrologic control of CH4 oxidation is supported by re- air-filled conduits or fractures in ice, CO2 contained in ice
lationships between fox and εc with average daily discharge bubbles (Fig. 1; Anklin et al., 1995; Graly et al., 2017),
(collected at site AK4; Fig. 2b) at both sub-Isunnguata and mechanical grinding and volatilization of fluid inclusions in
Russell sites: fox is negatively correlated with discharge for bedrock (Macdonald et al., 2018), and OM remineralization.
both sites (Fig. 5b) while εc is positively correlated with dis- While previous studies have indicated that additional atmo-
charge (Fig. 5c). While weak, these correlations suggest that spheric CO2 input through fractures and air-filled conduits
CH4 oxidation is greatest during periods of low flow, which may supply sufficient CO2 to drive mineral weathering ob-
may be associated with longer residence times to allow sub- served in many subglacial environments, including several
glacial CH4 oxidation; however, this relationship could also sites in Greenland (Graly et al., 2017), CO2 is also a prod-
result from differences in CH4 sources throughout the melt uct of OM remineralization, which is believed to account for
season as the subglacial drainage network expands. Assum- CH4 concentrations elevated above atmospheric equilibrium
ing the former, the delivery of oxygen to the subsurface by at the two southwest sites in this study. Both CO2 and CH4
supraglacial melting does not appear to be a limiting factor in exhibit negative correlations with average daily discharge for
subglacial CH4 oxidation, which should increase fox as more both sub-Isunnguata and Russell sites and could suggest a
oxygenated supraglacial water is delivered to the subglacial common OM remineralization source (Fig. 8a). While the
system. Instead, the observed greater CH4 oxidation during magnitude of this source and its relative importance com-
periods of low discharge may reflect mixing of methane-rich pared to other subglacial CO2 sources is currently unknown,
subglacial meltwater pockets and aerobic subglacial meltwa- differing sources of carbonic acid for mineral weathering re-
ter leading to CH4 oxidation. Longer transit times during pe- actions carry different implications for subglacial CO2 bud-
riods of low flow may allow more subglacial methane oxida- gets. For instance, carbonic acid weathering driven by inva-
tion to occur than during peak discharge, when the develop- sion of atmospheric CO2 would represent a sink of atmo-
ment of channelized flow paths reduces meltwater residence spheric CO2 , but carbonic acid weathering driven by OM
time in the subglacial environment. remineralization would instead serve to consume CO2 from
Our results indicate a high degree of heterogeneity in sub- in situ sources and limit the potential for subglacial meltwa-
glacial methanogenesis under the Greenland Ice Sheet, as ter to be an atmospheric CO2 source once discharged from
well as a significant impact of CH4 oxidation, which serves the glacier. Determining the sources of carbonic acid to sub-
to reduce atmospheric CH4 fluxes. Given the observed spatial glacial weathering reactions is therefore critical to under-
and temporal heterogeneity of CH4 concentrations and pro- stand the controls of mineral weathering in subglacial envi-
cesses, further investigation of the spatial variability in outlet ronments and its role in atmospheric CO2 sequestration.
glacier CH4 concentrations is needed to determine the impact Comparisons between measured δ 13 C-CO2 in subglacial
of Greenland Ice Sheet loss on Arctic and global CH4 bud- discharge samples and likely δ 13 C-CO2 values of CO2
gets, while a better understanding of the controls of these dif- sources indicate that CO2 sources differ between sites, with
ferences will improve models of how CH4 fluxes from sub- OM remineralization as the most important CO2 source at
glacial discharge will change with continued warming. the sub-Isunnguata but likely not the predominant or sole
source at Russell or Kiattut Sermiat glaciers. Keeling plots
of [CO2-total ]−1 versus δ 13 C-CO2 indicate that CO2-total may
be represented by a two-end-member mixing model for sub-
The Cryosphere, 15, 1627–1644, 2021 https://doi.org/10.5194/tc-15-1627-2021A. J. Pain et al.: Heterogeneous CO2 and CH4 content of glacial meltwater 1639
scatter in the Keeling plots indicates variability in the CO2
concentration and/or isotopic composition of end-members,
or significant contributions of at least one other major sub-
glacial CO2 source. We address both possibilities here. While
atmospheric CO2 concentrations and δ 13 C values should be
relatively invariable, CO2-OM may vary both in concentra-
tion and isotopic composition, depending on variability in the
quantity and composition of organic deposits as well as rem-
ineralization rates. For instance, if remineralization largely
occurs in hydrologically isolated subglacial meltwater pock-
ets, some variability in the concentration and δ 13 C-CO2 of
CO2-OM is likely. While no data yet exist to characterize the
variability in subglacial OM reservoirs, variability in either
concentration or isotopic composition of CO2-OM could plau-
sibly result in the scatter shown in Fig. 9. Additional sub-
glacial CO2 sources from ice bubbles, or lithogenic CO2 lib-
erated by mechanical grinding, would be expected to enrich
rather than deplete the δ 13 C-CO2 values of the samples rel-
ative to modern atmospheric δ 13 C-CO2 values. Ice bubbles
Figure 9. Keeling plot indicating correlations between the magni- contain gaseous CO2 at concentrations and isotopic composi-
tude of CO2-total and δ 13 C-CO2 and for sub-Isunnguata (sub-IS), tions reflecting atmospheric conditions during ice formation.
Russell (RU), and Kiattut Sermiat (KS) samples. Asterisk denotes While heterogeneity may result from gas bubbles recording
the outlier not included in the regression between CO2-total and changes in atmospheric CO2 , variability in δ 13 C-CO2 of gas
δ 13 C-CO2 for sub-Isunnguata samples. The plotted regression line bubble CO2 should be only a few per mill, which is small
was constructed using the sub-IS samples only.
compared to the variation observed in Russell and Kiattut
Sermiat samples (e.g., Tipple et al., 2010; Fig. 9). Gas bub-
ble CO2 should also be 13 C-enriched compared to modern
Isunnguata discharge but not for discharge from the Russell atmospheric CO2 due to fossil fuel contributions and thus
and Kiattut Sermiat glaciers (Fig. 9). Mixing model end- would be unlikely to cause the observed depletion of 13 C in
members include a 13 C-enriched, lower-concentration CO2 the subglacial water.
source and a 13 C-depleted, higher-concentration CO2 source. Recent work has also highlighted the potential for sub-
The y intercept of the regression between [CO2-total ]−1 ver- glacial mechanical grinding to result in CO2 production
sus δ 13 C-CO2 , which represents the isotopic signature of through the volatilization of bedrock fluid inclusions (Mac-
the high-CO2 end-member, is −27.4 ‰. This value is close donald et al., 2018). While this process was found to pro-
to what would be expected from OM remineralization as duce sufficient CO2 to drive approximately 20 % of min-
indicated by remineralized OM in Greenlandic heath soils eral weathering in Svalbard subglacial environments, the ex-
that produced δ 13 C-CO2 of approximately −27‰ to −25 ‰ pected isotopic composition of lithogenic CO2 is more 13 C-
(Ravn et al., 2020) and thawed Alaskan permafrost soils that enriched than our measured δ 13 C-CO2 values. For instance,
produced δ 13 C-CO2 of between −20 ‰ to −30 ‰ (Mau- estimates of δ 13 C for bulk hydrocarbons in fluid inclusions
ritz et al., 2019), both of which may be similar to sub- in the Ilímaussaq alkaline complex of South Greenland have
glacial organic matter. The low-CO2 end-member could re- values of −4.5 ± 1.5 ‰ (Madsen, 2001), which is close to the
flect atmospheric CO2 input, with an associated δ 13 C-CO2 δ 13 C-CO2 of CO2 in fluid inclusions in the Bamble granulite
value of approximately −8 ‰. While the δ 13 C-CO2 value sector of South Norway (∼ −6 ‰; Newton et al., 1980). Be-
of the lowest-CO2-total samples in the sub-Isunnguata Keel- cause mechanical grinding should not fractionate the δ 13 C-
ing plot (e.g., highest [CO2-total ]−1 not including the out- CO2 values (Lüders et al., 2012), our low δ 13 C-CO2 values
lier) is slightly depleted compared to atmospheric values suggest this source is small relative to other sources.
at −12.1 ‰, even the lowest CO2 concentrations measured One additional source or sink of CO2 to some of our
at sub-Isunnguata are supersaturated with respect to atmo- samples is atmospheric exchange as water flows from the
spheric concentrations (Fig. 3g). Consistent CO2 supersat- subglacial outlet site to our sampling sites. However, atmo-
uration suggests that OM remineralization contributes CO2 spheric CO2 exchange after discharge would have the same
even for low-CO2 -concentration samples and isotopically de- impact on Keeling plots as atmospheric CO2 exchange prior
pletes the subglacial CO2 reservoir. to discharge. Incorporation of an atmospheric source be-
While δ 13 C-CO2 values of Russell and Kiattut Sermiat tween the outlet and sample site would be most likely at Ki-
samples are within the range of sub-Isunnguata samples, attut Sermiat, where CO2 concentrations are undersaturated
suggesting possible contributions of CO2-atm and CO2-OM , with respect to atmospheric concentrations, which would
https://doi.org/10.5194/tc-15-1627-2021 The Cryosphere, 15, 1627–1644, 2021You can also read