Fusiform Gyrus Face Selectivity Relates to Individual Differences in Facial Recognition Ability
←
→
Page content transcription
If your browser does not render page correctly, please read the page content below
Fusiform Gyrus Face Selectivity Relates to Individual
            Differences in Facial Recognition Ability

                    Nicholas Furl, Lúcia Garrido, Raymond J. Dolan, Jon Driver,
                                       and Bradley Duchaine

Abstract
■ Regions of the occipital and temporal lobes, including a re-     robust relationships between face selectivity and face identifi-
gion in the fusiform gyrus (FG), have been proposed to con-        cation ability in FG across our sample for several convergent
stitute a “core” visual representation system for faces, in part   measures, including voxel-wise statistical parametric mapping,
because they show face selectivity and face repetition suppres-    peak face selectivity in individually defined “fusiform face areas”
sion. But recent fMRI studies of developmental prosopagnosics      (FFAs), and anatomical extents (cluster sizes) of those FFAs.
(DPs) raise questions about whether these measures relate to       None of these measures showed associations with behavioral
face processing skills. Although DPs manifest deficient face       expression or object recognition ability. As a group, DPs had
processing, most studies to date have not shown unequivocal        reduced face-selective responses in bilateral FFA when com-
reductions of functional responses in the proposed core re-        pared with non-DPs. Individual DPs were also more likely than
gions. We scanned 15 DPs and 15 non-DP control participants        non-DPs to lack expected face-selective activity in core regions.
with fMRI while employing factor analysis to derive behavioral     These findings associate individual differences in face process-
components related to face identification or other processes.      ing ability with selectivity in core face processing regions.
Repetition suppression specific to facial identities in FG or to   This confirms that face selectivity can provide a valid marker
expression in FG and STS did not show compelling relation-         for neural mechanisms that contribute to face identification
ships with face identification ability. However, we identified     ability. ■

INTRODUCTION
                                                                   more strongly to faces than to nonface objects (cf. Yovel &
Developmental prosopagnosia (DP) is a condition in which           Kanwisher, 2005). Neural responses in core regions can
individuals (DPs) with otherwise normal vision, intelli-           also attenuate in response to repeated facial information
gence, and social functioning show face recognition im-            (i.e., repetition suppression). In normal observers, iden-
pairments in the absence of evident brain injury. Although         tity repetition typically suppresses regions in the fusiform
numerous behavioral studies have enhanced understanding            gyrus (FG) while repeating more changeable attributes,
of the cognitive bases of DP (Bentin, Degutis, DʼEsposito, &       such as expression, typically leads to BOLD suppression
Robertson, 2007; Humphreys, Avidan, & Behrmann, 2007;              in other regions such as STS (e.g., see Fox, Moon, Iaria,
Duchaine & Nakayama, 2006b; Behrmann, Avidan, Marotta,             & Barton, 2009; Rotshtein, Henson, Treves, Driver, &
& Kimchi, 2005), progress on the neural basis of DP is more        Dolan, 2005; Andrews & Ewbank, 2004; Winston, Henson,
limited to date, with the few existing studies of this reviewed    Fine-Goulden, & Dolan, 2004).
below.                                                                Although these core face-related brain regions suggest
   An influential account of the functional neuroanatomy           possible loci for neural deficits in DPs, there is scant evi-
of face perception (Haxby, Hoffman, & Gobbini, 2000)               dence to date showing functional deficits in these re-
describes a so-called core system in the occipital and tem-        gions. DP case studies using fMRI have mainly reported
poral lobes. These core regions are considered responsible         relatively normal face-selective responses in FG (e.g., see
for visual recognition of facial attributes (Haxby et al.,         Minnebusch, Suchan, Köster, & Daum, 2009; Thomas
2000) and are distinguished from a more “extended sys-             et al., 2009; Behrmann, Avidan, Gao, & Black, 2007; Williams,
tem,” which further processes information resulting from           Berberovic, & Mattingley, 2007; Avidan, Hasson, Malach,
visual recognition. The proposed “core” regions have               & Behrmann, 2005; Hasson, Avidan, Deouell, Bentin, &
been associated with face selectivity: they typically respond      Malach, 2003). Despite these numerous “null” (i.e., ap-
                                                                   parently normal) findings, some atypical findings in in-
                                                                   dividual cases have been identified, including some DPs
                                                                   with no face selectivity (Minnebusch et al., 2009; Bentin
University College London                                          et al., 2007; Hadjikhani & de Gelder, 2002), weakened

© 2011 Massachusetts Institute of Technology                              Journal of Cognitive Neuroscience 23:7, pp. 1723–1740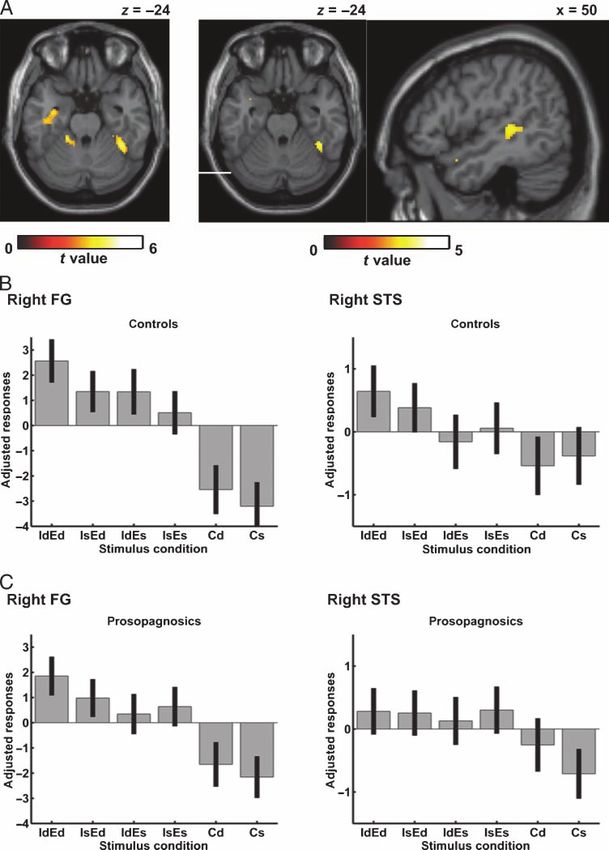
face selectivity (Avidan & Behrmann, 2009), or expression-         METHODS
dependent FG face selectivity (van de Stock, van de Riet,          Participants
Righart, & de Gelder, 2009). One study (using an unusually
large sample of DPs) found that voice recognition deficits         Our sample initially included 20 right-handed DPs who
in DPs were associated with reduced face selectivity in            contacted the Web site www.faceblind.org and reported
core regions (von Kriegstein et al., 2008). Studies examining      severe face recognition difficulties in everyday life. See
repetition suppression have reported apparently normal             Garrido et al. (2009) for more information about this partici-
suppression to repeated (familiar) faces in DPs (Avidan &          pant sample. We confirmed that these participants merited
Behrmann, 2009; Williams et al., 2007; Avidan et al., 2005).       classification as DPs by using the Cambridge Face Memory
    Thus, functional imaging of DP has provided inconsis-          Test (CFMT in its original form; Duchaine & Nakayama,
tent or incomplete evidence for substantially altered neural       2006a) and the Famous Faces Test (FFT; Duchaine &
function in the “core” regions that have been associated           Nakayama, 2005). These tests have been validated on DPs
with face processing in studies of people with typical face        in previous studies that also provided the mean CFMT value
skills. But such evidence might still be reconciled with           (mean ± SD = 57.90 ± 7.91) from 50 non-DP controls
a role for these core regions in DP if, for example, face-         (Duchaine & Nakayama, 2006a) and the mean FFT value
related effects were reduced or variable in DPs rather than        (0.89 ± 0.09) from 22 non-DP controls (Garrido, Duchaine,
being completely abolished. It remains possible that the           & Nakayama, 2008). We observed that all of the DPs in the
magnitude of functional abnormalities might relate sys-            present study scored more than two standard deviations
tematically to the extent of reduced face skills. Indeed           below those non-DP means (on both tests). All non-DP
one open possibility, which has not been rigorously inves-         participants (see below) in the present study scored better
tigated to date, is that DPs might constitute the lower tail       than this criterion for the CFMT and all but two for the FFT.
of a fairly continuous distribution of face identification         All the DPs showed impaired performance compared with
ability. If so, one would not predict discrete, all-or-nothing     the non-DP averages using a modified t test (Crawford &
functional deficits that should be easily observed in every        Howell, 1998) for single cases. Three DPs were excluded
individual DP. Instead, one would predict functional neuro-        from the study because of neurological or visual abnormality
anatomic correlates of performance might be best de-               (epilepsy, brain injury, strabismus). The remaining 17 DPs
tected by testing for continuous relationships between             (11 women) were compared with a sample of 18 non-DP
fMRI measures and a wide range of behavioral face iden-            participants (11 women), who were matched for age and
tification ability across both DPs and individuals exhibiting      IQ. Scores on the CFMT and FFT tests in the present study
normal variation in face skills.                                   are shown in Figure 1 for the DPs and the non-DP group.
    Here, we aimed to implement such an “individual differ-        The ages of DP and non-DP groups did not significantly dif-
ences” approach by testing not only a sample large enough          fer (mean ± SD: DPs = 30.9 ± 7.5, non-DP = 28.9 ± 5.7),
to allow conventional group contrasts (DPs vs. non-DPs)            t(33) = 0.89, p = .38, nor did IQ (DPs = 123.9 ± 7.8,
but also a more systematic analysis of neuroimaging data           non-DP = 118.9 ± 8.8), t(33) = 1.7, p = .1 (note that IQ
in relation to the subject-by-subject scores on a battery of
tests. We recently applied this approach successfully in a
purely structural MRI analysis of 17 DPs and 18 non-DP
comparison participants (Garrido et al., 2009). We tested
these participants with a battery of behavioral tasks assess-
ing judgments of facial identity, facial expression, and non-
face object recognition. Using factor analysis, we showed
that we could derive summary scores for orthogonal com-
ponents of behavioral performance from this battery. Em-
pirically, this yielded separate face identity, face expression,
and nonface object behavioral components. In our MRI
morphometric analysis, these factor scores showed linear
relationships with gray matter volume in temporal cortex
across the entire sample (Garrido et al., 2009).
    Using the same factor analytic approach to individual dif-
ferences in behavioral performance, we now extend our
analysis of this sample by exploring the relationship of face
identification performance deficits to the aforementioned
fMRI measures of functional face selectivity and repetition        Figure 1. Face identification ability in non-DPs and DPs. Performance
                                                                   of all study participants on the original Cambridge Face Memory Test
suppression. We hypothesized that the use of these mea-
                                                                   (CFMT) is indicated on the x-axis, and Famous Faces Test (FFT) is
sures may reveal hitherto undiscovered relationships be-           indicated on the y-axis. Each point represents one participant. We defined
tween face identification ability and fMRI signal in the core      some participants as DPs on the basis of performance significantly
face-related brain regions, such as FG.                            lower than published non-DP means on both of these two tests.

1724     Journal of Cognitive Neuroscience                                                                        Volume 23, Number 7
measurements were unavailable for two DPs) as measured         cal Neuroscience, Psychology Section, Karolinska Institute).
by Wechsler Abbreviated Scale of Intelligence (PsychCorp,      For each of four male identities (Figure 2A), we chose photo-
Harcourt Assessment Inc., San Antonio, TX). A neuroradiol-     graphs acquired on two different days which depicted three
ogist inspected the structural T1- and T2-weighted MRI         viewpoints (left or right three-quarters plus frontal) and
scans for all these participants and found no evident neuro-   four emotional expressions (happy, fearful, neutral, and
logical abnormity in any. All 35 participants showed normal    angry). We converted all photographs to grayscale, cropped
or corrected-to-normal visual acuity as tested with Test       the faces to occlude hair and clothing, normalized the im-
Chart 2000 (Thompson Software Solutions, Hatfield, UK).        ages to have luminance distributed with equal mean and
Of these participants, 15 DPs and 15 non-DP controls elected   range, and then placed them on a gray background. We also
to return for the fMRI experiment. Informed consent was ob-    digitized photographs of four model classic cars in left or
tained in accordance with procedures approved by The Joint     right three-quarters plus frontal views (Figure 2A). These
Ethics Committee of The National Hospital for Neurology        photographs were resized to approximate the size of the
and Neurosurgery and The Institute of Neurology, London.       face stimuli, and then the same image preparations were
                                                               implemented as described for the face stimuli.
Stimuli for fMRI Study
                                                               fMRI Experiment: Design and Procedures
The stimuli were digitized photographs taken from the
KDEF database (Lundqvist, Flykt, & Öhman, 1998; The            Throughout the fMRI experiment, participants viewed
Karolinska Directed Emotional Faces, Department of Clini-      15.2-sec blocks, followed by 4 sec of fixation (Figure 2B).

Figure 2. Stimuli and design.
(A) Examples of the car
stimuli plus facial identities
and expressions. (B) The time
course of an example block
(IdEd condition shown). (C)
Participants viewed six types
of blocks. Cs = the same
car appeared eight times;
Cd = four different cars
each appeared twice in
random order; IdEd =
four identities, and four
expressions each appeared
twice; IsEd = the same
identity appeared throughout,
but four expressions each
appeared twice; IdEs = four
identities each appeared
twice, but the expression
was the same throughout;
IsEs = all faces showed the
same identity and expression
throughout (but still across
different viewpoints, see
main text).

                                                                                                        Furl et al.    1725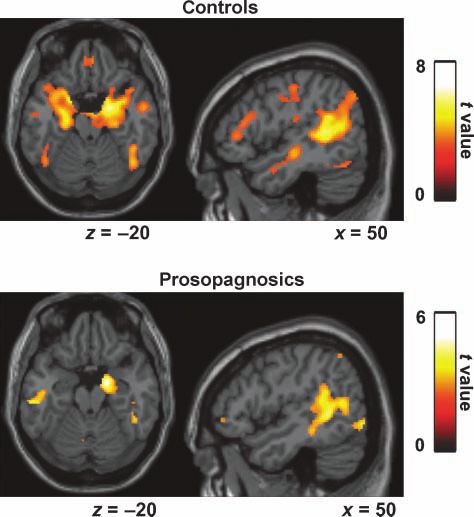
Each block comprised eight successive stimulus presenta-                       Throughout the experiment, each of these six block types
tions, which were 1700 msec each and were preceded by                          was presented 24 times.
a 200-msec fixation cross. Participants fixated on a cross
at the center of the screen (and image) and pressed a
key when this cross appeared black on a randomly se-                           fMRI Data Acquisition
lected one third of image presentations (otherwise white).
                                                                               We used a Siemens Trio 3T system (Siemens, Erlangen,
Throughout a block, participants viewed images of either
                                                                               Germany) to acquire T2*-weighted echo-planar functional
all faces or all cars. Each image depicted one of the three
                                                                               brain volumes. For each participant, we acquired 430 vol-
views, selected pseudorandomly subject to the constraint
                                                                               umes in each of three scanning sessions. A volume com-
that the same view was never immediately repeated (Fig-
                                                                               prised 32 transverse slices aligned parallel to the inferior
ure 2B). There were two types of car blocks: In cars-same
                                                                               aspect of the temporal lobes. Images were acquired at a
blocks (Cs), participants viewed eight images of a particular
                                                                               volume repetition time (TR) of 2176 msec with an in-plane
one of the four cars. In cars-different blocks (Cd), partici-
                                                                               resolution of 3 × 3 mm, 2 mm slice thickness, and 1 mm
pants saw all four cars, each presented twice in random
                                                                               slice gap, with echo time = 30 msec and a flip angle of
order. There were four types of face blocks (Figure 2C),
                                                                               90°. We discarded the two volumes commencing each ses-
which conformed to the four cells of a 2 × 2 factorial design
                                                                               sion to avoid magnetic equilibrium contamination. In
(Winston et al., 2004). The first factor was Identity repeti-
                                                                               another scanning session (Garrido et al., 2009), T1-weighted
tion: identities could be the same (Is) or different (Id).
                                                                               MDEFT and T2-weighted structural scans were acquired.
The second factor was Expression repetition: expressions
could be same (Es) or different (Ed). For identity-different/
expression-different blocks (IdEd), each of the four iden-
                                                                               Factor Analysis of Behavioral Test Battery
tities and each of the four expressions appeared twice
in random order. For identity-same/expression-different                        We administered a test battery comprising 11 behavioral
blocks (IsEd), all eight images depicted the same identity,                    measures to the 35 participants (17 DPs and 18 non-DPs;
with each emotion expressed twice throughout the block.                        see Table 1 and Supplementary Table 1). Each task required
For identity-different/expression-same blocks (IdEs), we                       recognition of facial identity, facial emotional expression,
presented the four identities twice, always expressing the                     or nonface objects. These data, for all measures and all
same emotion. For identity-same/expression-same blocks                         participants (i.e., across the entire sample, including both
(IsEs), every image depicted one of the four identities,                       DPs and non-DP participants, in accord with our “individ-
always expressing one of the four emotions (Figure 2B).                        ual differences” approach), were submitted to a standard

Table 1. Varimax-rotated Principal Component Weights for Behavioral Tests
                                                          Factor

Test                                           1              2      3                                     Reference
                               0                    a
Old/new face identity (A )                   0.87          0.11     0.15           Duchaine and Nakayama (2005)
CFMT (original version)                      0.86          0.38     0.17           Duchaine and Nakayama (2006a, 2006b)
FFT                                          0.80          0.34     0.25           Duchaine and Nakayama (2005)
Sequential identity matching                 0.76          0.16     0.13           Garrido et al. (2009)
Cambridge Face Perception                    0.43          0.63     0.00           Duchaine, Germine, and Nakayama (2007), Duchaine,
                                                                                    Yovel, and Nakayama (2007)
Old/new horses (A0)                          0.04          0.85b    0.16           Duchaine and Nakayama (2005)
Old/new cars (A0)                            0.23          0.84    −0.06           Duchaine and Nakayama (2005)
Cambridge hair memory                        0.16          0.61     0.17           Garrido et al. (2009)
                                                                           c
Facial expression films                      0.13          0.12     0.87           Garrido et al. (2009)
Eyes test                                    0.13          0.21     0.80           Baron-Cohen, Wheelwright, Hill, Raste, and Plumb (2001)
Sequential expression matching               0.39        −0.15      0.49           Garrido et al. (2009)

CFMT = Cambridge face memory test; FFT = Famous faces test.
a
    Bold items in this column are identity recognition tests.
b
    Bold items in this column are object recognition tests.
c
    Bold items in this column are expression recognition tests.

1726         Journal of Cognitive Neuroscience                                                                         Volume 23, Number 7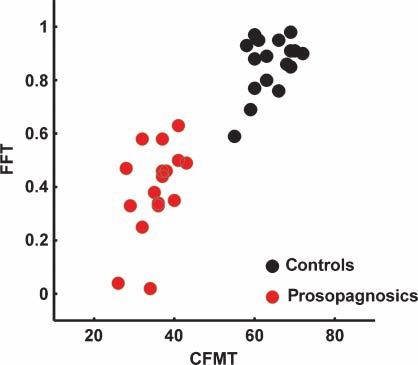
PCA of the correlation matrix with varimax rotation of the      SPM Group Analysis
ensuing eigenvector components, as implemented by the
                                                                For first-level, fixed-effects analysis, we computed our
SPSS software package for Windows (Rel. 11.0.1. 2001;
                                                                contrasts of interest for each participant (e.g., face > car se-
SPSS Inc., Chicago, IL). We evaluated the first three fac-
                                                                lectivity, identity repetition suppression and expression
tors (eigenvalues > 1.0) and computed all participantsʼ
                                                                repetition suppression). For our SPM group analysis, whole-
factor scores on these three factors. These factor scores
                                                                brain images of these contrasts were tested statistically
were then used as independent variables in regressions in-
                                                                using “second level” analyses, which treated participants
cluding the fMRI data for all participants.
                                                                as a random effect. To test face selectivity and repetition
                                                                suppression within groups, contrast images were subjected
fMRI Preprocessing and SPM First-level Analysis                 to one-tailed, one-sample t tests. To test whether non-DPs
                                                                controls differed from DPs, contrast estimates were sub-
We preprocessed and analyzed the fMRI data using SPM5
                                                                jected to two-sample t tests. Finally, these contrasts were
(Wellcome Trust Centre for Neuroimaging, London; http://
                                                                tested using linear regressions with the behavioral factor
www.fil.ion.ucl.ac.uk/spm/) in conjunction with in-house
                                                                scores. These regressions were carried out by computing
MATLAB programs (The Mathworks, Natick, MA). Func-
                                                                the best-fitting line to the data from all participants, when
tional scans were realigned, normalized to the standard
                                                                considering the data from all participants (i.e., from both
Montreal Neurological Institute (MNI) echo-planar image
                                                                groups), in accord with our “individual differences” ap-
template, and then smoothed to an 8-mm FWHM Gaussian
                                                                proach (for the same approach to structural MR data, see
kernel in accord with the standard SPM approach.
                                                                also Garrido et al., 2009).
   At the first level of individual subjects, we computed
                                                                   We first identified clusters of contiguously significant vox-
mass univariate time-series models for each participant
                                                                els at an uncorrected threshold ( p < .005, as also used for
using proportional scaling, AR(1) autocorrelation mod-
                                                                display purposes in the figures). We then tested these clus-
eling, a 1/128-Hz high-pass filter, and regressor convo-
                                                                ters for cluster-level FWE correction p < .05 using Gaussian
lution with the SPM canonical hemodynamic response
                                                                random field theory. We corrected using the whole-brain
model. Covariates of no interest in the design matrix
                                                                volume or used conventional small-volume corrections
included the six head-motion parameters computed dur-
                                                                only for regions about which we had a priori hypotheses.
ing realignment. Six experimental regressors modeled
                                                                To use small volumes conservatively, we required cluster-
the onset of each image within the two car and four face
                                                                level FWE-corrected significance on the basis of both (a) a
block types. We statistically controlled for any correla-
                                                                10-mm radius sphere surrounding coordinates found in at
tions between low-level image similarity and block type
                                                                least one previous fMRI study reporting face-selective or
by adding additional parametric regressors, which mod-
                                                                face repetition suppression effects (Fox et al., 2009; Hein
eled the pixel-wise correlation of each presented image
                                                                & Knight, 2008; Rotshtein et al., 2005; Andrews & Ewbank,
and its predecessor (Winston et al., 2004). The first im-
                                                                2004; Winston et al., 2004; Allison, Puce, & McCarthy, 2000)
age in each block (which had no predecessor) was as-
                                                                and (b) single hemisphere anatomic masks of the posterior
signed the average similarity for the rest of the block
                                                                fusiform cortex or superior or middle temporal gyrus (for
for this aspect of the analysis. The mean pixel-wise corre-
                                                                posterior and mid-STS), as derived from the Harvard-Oxford
lations in each condition were as follows: IdEd = 0.1633,
                                                                probabilistic atlas available with FSL 4.1 (FMRIB, Oxford, UK;
IsEd = 0.2511, IdEs = 0.1743, IsEs = 0.2831, Cd = 0.1639,
                                                                http://www.fmrib.ox.ac.uk/fsl) and thresholded at 25% of
Cs = 0.2059.
                                                                maximum intensity. Exactly the same masks were also used
   Analysis of the group data then proceeded in two parallel
                                                                for small volume correction in the structural study of Garrido
ways. For SPM group analysis, inferences about brain ac-
                                                                et al. (2009). For completeness, we additionally tested small
tivations were made on the basis of whole-brain statistical
                                                                volume corrections in the vicinity of the precuneus and pos-
parametric maps, using the mass univariate approach and
                                                                terior cingulate on the basis of a location recently implicated
family-wise error (FWE) correcting for multiple corrections
                                                                in DP (Avidan & Behrmann, 2009), but no significant results
at the cluster level using the SPM5 software. This standard
                                                                were obtained using small volumes for these structures. We
SPM approach was thus conducted in a voxel-wise manner.
                                                                also allowed small-volume correction of amygdala for con-
For the ROI group analysis, ROIs were identified in indi-
                                                                trasts related to existing hypotheses about expression pro-
vidual participants, with visual confirmation of their ana-
                                                                cessing. These were implemented on the basis of 10-mm
tomical location. Then parameter estimates from the peak
                                                                radius spheres surrounding MNI coordinates reported in
of each individually defined ROI were extracted for the vari-
                                                                previous studies of facial expression processing (Das et al.,
ous conditions in the main experiment for further analy-
                                                                2005; Vuilleumier, Armony, Driver, & Dolan, 2003).
sis in MATLAB (see below). Thus, the ROI analyses differ
from the group SPM analysis in considering functionally
defined individual ROIs that can fall at somewhat different
                                                                Group Analysis of Individual ROIs
voxels in different participants, unlike the voxel-wise SPM
group analysis. We also analyzed the cluster sizes of partic-   Whereas SPM group analysis provided inference at every
ular ROIs (see below).                                          voxel-wise location in the brain in the form of a statistical

                                                                                                            Furl et al.    1727
parametric map, ROI group analyses provided inference regression analyses comparing the scores derived from
about activity in localized regions as defined in individual these factors with fMRI responses in the whole sample
participants (which might thus correspond to somewhat (both non-DPs and DPs considered together, in accord
different voxels, albeit from similar brain structures, in with our “individual-differences” approach, as described
different participants). The anatomical location of each later). For completeness, in the Supplementary Results,
ROI was confirmed visually with reference to canonical we considered any relations of the fMRI data to the be-
and subject-specific T1-weighted scans in MNI space. Here, havioral factors within one or other group (DP or non-
we used “FG” to refer in general to neuroanatomic loca- DP) considered alone, although that approach inevitably
tions within the FG, and we reserved the term “fusiform has less power.
face area” (FFA) to refer more specifically to just the func-
tionally defined (individually face-selective) ROI located
Face Selectivity: SPM Group Analysis
within FG. We identified bilateral FFAs and occipital face
areas (OFAs), plus an individual ROI in the right posterior We began by searching every voxel in the whole brain for
STS, using the contrast all faces > all cars thresholded at face selectivity (i.e., we tested the contrast: all faces > all
p < 1 × 10⁻⁴ uncorrected. Voxels in these regions fell cars) at p < .05 FWE-corrected cluster level. We report
within the identifiable boundary of just one ROI. For partic- whole-brain corrected effects or small volume corrections
ipants who lacked a face-selective area with this criterion, where applicable. All participants were included in the
we explored liberal uncorrected significance thresholds (as SPM group analyses, regardless of whether they also ex-
liberal as p < .05) to confirm that obvious face-selective pressed individually defined ROIs.
areas were not visibly discernable; no areas were found For non-DP participants, we observed face-selective
for these cases even with the more lax criteria. peaks in regions of bilateral FG, bilateral posterior STS,
We computed the extent of the ROI cluster sizes for non- right mid-STS, anterior temporal cortex, and bilateral amyg-
DP participants versus DPs. When participants lacked an dala, with significant effects also spreading into bilateral
ROI, the cluster size for that ROI was designated as zero medial-temporal cortex (Figure 3 and Table 2). When we
for this analysis. We also sought a measure of individual computed the same contrast for the DP participants (Fig-
ROI response independent of cluster size. For this pur- ure 3 and Table 2), substantially fewer voxels were visible:
pose, we extracted beta parameters from first-level fixed-
effects models at the peak voxel in each ROI (peak for
the functionally defining contrast, e.g., all faces > all cars).
Participants who lacked an identifiable face-selective re-
gion had no peak voxel and so were excluded from the
analysis of individual peaks. The ROI peaks and the cluster
sizes were each submitted to two-sample t tests, com-
paring non-DP participants and DPs. Importantly, we also
tested for any relationships these two measures (for ROI
peaks and cluster sizes) might have with the behavioral
factor scores using linear regression across the entire sam-
ple, in accord with our “individual differences” approach.
Please note that all our ROIs were defined independently
of their relation with the behavioral scores and so did not
bias any such relationship.
RESULTS
Factor Scores for Identity-related
Recognition Ability
Our factor analysis identified three orthogonal factors that
were readily interpretable as related to an individualʼs abil-
ity to recognize facial identities, nonface objects, and facial
expressions respectively. These results were previously
published in Garrido et al. (2009) and so are only briefly Figure 3. SPM random-effects analysis of face selectivity. Regions in
summarized in Supplementary Results and Supplementary stereotactic space showing significant differences between all faces
and all cars in non-DP controls (top) and DPs (bottom) include right
Table 1. We were especially interested in scores on the
and left FG and right posterior and mid-STS. The right hemisphere
first behavioral factor, which provide a summary measure is shown on the right-hand side of the transverse images. All clusters
of facial identification ability that is necessarily orthogonal p(FWE) < .05 at the cluster level, whole brain corrected, except left
to the object- and expression-related factors. We ran linear FG (small volume corrected).
1728 Journal of Cognitive Neuroscience Volume 23, Number 7Table 2. Linear Relationships between Face Selectivity and Behavioral Factor Scores
Peak MNI (x y z) z Score Cluster Size ( Voxels)
Non-DPs: All Faces > All Cars
Right STSa 54 −42 8 5.87 2464
a
Bilateral amygdalae, medial-temporal cortices and hippocampi 20 −4 −18 5.72 6821
a
Right FG 46 −48 −24 5.07 298
a
Left STS −56 −46 12 4.72 1692
Left FGb 46 −50 −28 3.99 213
DPs: All Faces > All Cars
Right amygdalaa 18 −6 −20 4.96 418
a
Right STS, middle temporal gyrus and FG 54 −44 14 4.53 1575
Positive Linear Associations with Identification Factor (1)
Left temporal polea −34 18 −28 5.14 299
b
Right FG 46 −62 −18 3.55 98
b
Left FG −48 −58 −28 4.26 193
Positive Linear Associations with Expression-related Factor (3)
Right visual cortexa 12 −88 20 4.74 237
b
Right amygdala/uncus 22 0 −32 4.53 1575
p(FWE) < .05 cluster-level corrected.
a
Whole brain corrected.
b
Small volume corrected.
1,993 voxels in DP clusters, but 11,488 voxels in non-DP cation factor scores were associated with increased face
clusters. For DPs, one cluster peaked in right amygdala selectivity.
and spread into right medial-temporal cortex, whereas an- We also tested for significant linear relationships with
other peaked in right posterior STS and spread inferiorly the second and third behavioral factors. As the second
into the right FG. In DPs, anterior temporal cortex and and third factors were derived to be orthogonal to the
left FG showed no significantly face-selective voxels. De- first, they reflect noncorrelated abilities in our participants.
spite the visible differences in the significant statistical We observed no significant interactions between the re-
parametric maps for the two groups considered separately, gressor for first factor and those of the other two factors.
when we contrasted non-DPs and DPs directly using a Moreover, the regressor for the second (object-related)
one-tailed two-sample t test, no regions were significant factor showed no significant linear relationship. For the
at p(FWE) < .05, using either whole brain or small volume third (expression-related) factor, across the whole sample,
correction. we observed correlations with face selectivity in a region
We nevertheless observed significant effects of face rec- bordering the right posterior amygdala and uncus (small
ognition ability when using linear regression to test for volume corrected for the right amygdala) and a region
quantitative relationships between face selectivity in fMRI (whole brain corrected) of early visual cortex (Figure 4
and the identity-related factor scores as measured behav- and Table 2).
iorally (Figure 4 and Table 2) across the entire sample in In sum, we found robust correlations between face iden-
accord with our “individual differences” approach. No- tification ability across our entire sample and face selectivity
tably, we found such effects in bilateral FG, within the in FG and anterior temporal cortex; but we found no com-
distribution of face-selective effects observed in non-DP parable relationship when considering the other factor
participants. A region near the left temporal pole was also scores. The lack of a relationship with FG for the third factor
significant at p(FWE) < .05 cluster level using whole-brain seems unlikely to reflect a simple lack of statistical power,
correction (Figure 4 and Table 2). In all three regions (right as linear relationships were detected outside of FG and tem-
and left FG and left temporal pole), better face identifi- poral pole (in visual cortex and amygdala) for that factor.
Furl et al. 1729Identification of Individual ROIs However, at such lowered thresholds, many participants
showed first-level results contaminated by uniformly distrib-
We also assessed face-selective ROIs for every individual
uted background noise permeating the whole brain, from
participant. As in previous studies (Minnebusch et al.,
which it proved problematic to discern any weakly signifi-
2009; Bentin et al., 2007; Williams et al., 2007; Avidan
cant ROIs. We therefore optimized our operational def-
et al., 2005; Hasson et al., 2003; Hadjikhani & de Gelder,
inition by selecting an uncorrected significance level that
2002), most DPs evinced right FFAs. There were three ex-
offered unambiguously interpretable ROIs (for at least some
ceptions (Figure 5 and Supplementary Table 3): one DP
of the core areas) in every participant, relative to the pre-
lacked any reliable right ventral temporal face selectivity
sence of background noise and obvious false-positives. We
(hence obtained an ROI cluster size of zero for this). Two
note also that although our ROI selection procedure neces-
additional DPs showed right temporal lobe face selectivity
sarily had led to the exclusion of some participants from the
that was diffuse and not divided into distinct regions (even
ROI group analysis (Figure 5 and Supplementary Table 3),
at more conservative thresholds), so we eliminated those
no participants were excluded from the SPM group analysis.
two DPs from further ROI group analysis. The absence of
We thus sought to avoid any potential weaknesses associ-
left FFA was more common. Five DPs and two non-DPs
ated with either individual ROI or group SPM approaches
lacked left FFAs. Eight DPs and three non-DPs lacked any
alone by demonstrating key findings that were convergent
reliable face-selective activation within the right STS. One
across both approaches.
of the aforementioned DPs with diffuse right temporal lobe
To summarize, all participants were included in the SPM
face selectivity had no separable region in right posterior
group analysis. All participants were also included in the
STS and so was excluded from ROI group analysis of right
ROI group analysis of cluster sizes, except for the two par-
posterior STS. We note that posterior STS face selectivity
ticipants with undifferentiated face selectivity (see above).
was not likely to be missed in these DPs because of our
For the analysis of individual ROI peaks, participants were
choice of threshold. Indeed, most DPs lacking STS selec-
excluded from analysis only if they failed to clearly manifest
tivity nevertheless showed some abnormal face selectivity
the relevant ROI. The excluded participants are shown in
in the form of a nearby cluster located near V5, which was
black in the matrix shown in Figure 5 and listed as “no
visibly outside the STS. As we have no unequivocal evi-
ROI” in Supplementary Table 3.
dence suggesting this region might be homologous to pos-
terior STS as observed in non-DP participants, we did not
classify it as STS. The presence or absence of clearly defined
Face Selectivity and Cluster Size: Group Analysis
OFA was not associated with DP. Five DPs and six non-DPs
of Individual ROIs
lacked right OFA, whereas nine DPs and seven non-DPs
lacked left OFA. The matrix in Figure 5 shows the peak difference between
We note that the operational definition of an ROI de- faces and cars for each ROI in each participant. Rows are
pended on the choice of significance threshold. To avoid sorted within group by the identity-related behavioral fac-
false positives, we could have relied on conservative thresh- tor. Rows filled in black depict the participants mentioned
olds that were multiple comparison corrected at the first above who did not show any identifiable ROI and were
level (e.g., see Avidan & Behrmann, 2009) or required re- therefore excluded from further analyses of ROI peaks.
sponses to faces to be numerically at least twice that of re- From this matrix, a positive association is evident between
sponses to nonface objects (cf. Yovel & Kanwisher, 2005). the identity-related factor scores and face selectivity at the
However, these more conservative criteria inevitably in- ROI peaks. These visual observations were confirmed sta-
crease the tendency to “miss” effects that might be apparent tistically as follows.
at less stringent uncorrected thresholds. Accordingly, for Using one-tailed, two-sample t tests, we found significant
purely descriptive purposes, we also explored more liberal differences in peak face selectivity (faces > cars) between
uncorrected significance thresholds such as p < .01 or p < non-DPs and DPs for the FFA in the right hemisphere,
.05 to examine if any trend for a particular ROI to emerge t(25) = 2.62, p = .007, and left hemisphere, t(21) = 2.29,
would then become apparent in an individual who did not p = .016 (Figure 7). In agreement with the SPM group
show an ROI at our preselected more stringent threshold. analysis (which had been in voxel-wise stereotactic space,
Figure 4. Behavioral factor scores in relation to brain face selectivity: SPM random-effects analysis. (A) Linear relationships with identity-related
behavioral factor scores, across the entire sample (including both DP and non-DP participants) emerge in the right and left FG (both p(FWE) <
.05, cluster level, small volume corrected) and anterior temporal cortex ( p(FWE) < .05, cluster level, whole brain corrected). The right hemisphere
is shown on the right-hand side. (B) The contrast (difference in beta parameters) for all faces > all cars (computed for each participant at the
fixed-effects level and grand mean scaled to zero) is plotted as a function of the identity-related factor scores, with each point corresponding to
one individual participant. The regression lines (fit to all participants) are shown in blue. (C) Right visual cortex ( p(FWE) < .05, cluster level,
whole brain corrected) and amygdala ( p(FWE) < .05, cluster level, small volume corrected) regions showing relationships with expression-related
behavioral factor scores. The right hemisphere is shown on the right-hand side. (D) The contrast all faces > all cars from the peak voxels in
right visual cortex and amygdala plotted as a function of expression-related factor score. The regression lines (fit to the whole sample) are
shown in blue. Note all participants were included in SPM analyses.
1730 Journal of Cognitive Neuroscience Volume 23, Number 7rather than for individually defined ROIs as now), we ob- significant effects were complemented by significant cor-
served a significantly positive linear relationship between relations with behavioral Factor 1 (when partialling out Fac-
the peak face selectivity and the identification factor scores tors 2 and 3) in right FFA (ρ = 0.52, p = .004) and left FFA
for FFA (Figure 5) on the right, β = 0.41, t(25) = 2.89, (ρ = 0.48, p = .015). We also analyzed whether the func-
p = .004, and left, β = 0.28, t(21) = 2.36, p = .015. These tional size (volume) of face-selective ROIs (measured as
Furl et al. 1731Figure 5. Face selectivity in individually defined ROIs. (A) Data are shown for ROIs defined by the contrast all faces > all cars. Within each group (DPs and non-DP controls), rows are sorted by each participantʼs identity-related factor score. The first column represents group (black = DPs; white = non-DP controls); the second is the identity-specific performance score on behavioral Factor 1 (scaled to the range 0 to 1). The remaining columns show face selectivity (beta parameters) for contrast all faces > all cars (scaled to between 0 and 1). A row is filled in black when an ROI could not be identified for that individual participant. (B) The contrast (difference between beta weights) all faces > all cars was computed at the fixed effects level for right (left) and left (center) individually defined FFA and then plotted here as a function of identity-related factor score, with each point representing one participant. The regression lines (fit to the entire sample) are shown in blue. Participants lacking ROIs (filled in black in Figure 5A) were not included in this analysis. The rightmost graph shows the cluster sizes (in numbers of voxels) of the right FFA, plotted against the identity-related factor score. For this analysis, all participants were included except two (see Results for details). number of contiguous face-selective voxels) was linearly In all our ROI regressions, we included the scores for associated with the face identification factor score. In Factors 2 and 3 (object- and expression-related factors) as right FFA only (Figure 5), we found a significant regression regressors. These regressors were not significant, although using the identity-related behavioral Factor 1 scores, β = we observed robust positive slopes and correlations for 129.63, t(24) = 2.51, p = .010. Moreover, we observed sig- our (orthogonally derived) identification Factor 1 in bilat- nificantly larger clusters for right FFA in non-DP controls eral FFA. Notably, this pattern of results was convergent than DPs, t(26) = 1.89, p = .003. The correlation between across all our analyses of right FG or FFA activity (SPM group cluster size in right FFA and the behavioral identification analysis and ROI group analysis of peaks and cluster sizes) Factor 1 scores (partialling out Factors 2 and 3) was also and likewise for the temporal pole. Indeed, the numeric significant ρ = 0.46, p = .01. None of our face selectivity difference in slope between the first factor and the others ROI measures (peak or cluster size) showed effects in right was visibly striking in right FFA for both peaks and cluster posterior STS or the OFAs. sizes (Supplementary Figure 1). Although these differences 1732 Journal of Cognitive Neuroscience Volume 23, Number 7
appeared large and replicated across several convergent However, the FG region was absent when we tested the
analyses, we did not have enough statistical power to identity suppression contrast. Also unlike non-DPs, there
detect interactions between one factor versus the other was no significant expression suppression in right mid-
in relation to the fMRI data (Supplementary Table 4). Our STS. Despite these apparent differences and the overall
results overall seemed consistent with the conclusion that weaker effects observed in DPs, we did not find any signif-
there exists a positive linear relationship between our icant effects when testing group differences or regression
fMRI face selectivity measures and behavioral Factor 1, models using behavioral factor scores for the repetition
but we could offer no evidence favoring any such rela- suppression effects. No interaction was found between
tionships for Factors 2 or 3 other than the relationship of identity and expression repetition in non-DPs or DPs.
Factor 3 to the amygdala and visual cortex in the SPM The regions discussed above showed no repetition sup-
analysis. pression to cars, neither in non-DP nor DPs.
SPM Group Analysis of Repetition Suppression Repetition Suppression in Individually
Defined ROIs
We evaluated identity and expression repetition suppres-
sion for each voxel in the brain (SPM group analysis) and We next analyzed the peak voxel in individually defined
also for individually defined ROIs. For both types of analy- face-selective ROIs for repetition suppression effects (Fig-
sis, we tested identity suppression by computing the one- ures 7 and 8 and Supplementary Table 2), in case they might
tailed main effect of identity repetition (identity different > provide a more sensitive assessment for any group differ-
identity same). This comparison contrasts the rows in Fig- ences. In agreement with the SPM group analysis, non-DP
ure 2C: (IdEd + IdEs) > (IsEd + IsEs); see also Winston participants showed significant effects in their right FFA
et al. (2004). Similarly, expression suppression was tested ROIs (Figure 7) for both identity, t(14) = 4.37, p < .001,
by computing the one-tailed main effect of expression re- and expression repetition suppression, t(14) = 3.59, p =
petition (expression different > expressions same), which .002. We also found significant effects in left FFA for iden-
entails contrasting the columns of Figure 2C: (IdEd + tity, t(12) = 3.01, p = .006, and expression repetition sup-
IsEd) > (IdEs + IsEs). We also tested for the two-tailed in- pression, t(12) = 2.19, p = .023. There was a nearly
teraction of identity and expression suppression (IdEs > significant trend toward expression repetition suppression
IsEd) versus (IdEd > IsEs), which would reveal regions for in right posterior STS, t(12) = 1.60, p = .068, but no identity
which one type of suppression was modulated by whether suppression. We note that the SPM group analysis had local-
the other category was same or different. On the basis of ized expression repetition suppression effects to a mid-STS
previous literature (Fox et al., 2009; Rotshtein et al., 2005; region anterior to the face-selective individual peaks in
Yovel & Kanwisher, 2005; Andrews & Ewbank, 2004), posterior STS (Figure 6). Therefore, the ROI group analysis
we had expected that FG may show identity suppression (now using those latter peaks) may have reduced power for
whereas right (posterior and/or mid) STS would show ex- detecting these mid-STS expression effects, which appeared
pression suppression and that there would be no inter- (according to SPM) located anterior to the ROI peaks.
action effect. Interestingly, we also detected (unpredicted) expression
We began by using SPM group analysis to test whether repetition suppression in the individual right OFA ROIs (Fig-
data from our non-DP participants replicates previous find- ure 8), t(8) = 2.93, p < .010, with some concordant non-
ings (Fox et al., 2009; Winston et al., 2004). Both identity significant tendency in the same direction for the left OFA,
and expression suppression contrasts yielded a right me- t(7) = 1.52, p = .09.
dial FG cluster (Figure 6), sharing the same peak voxel Finally we tested whether DPs could replicate the repeti-
(MNI: 38 −44 −24). This region overlaps with the face- tion suppression pattern observed in non-DP controls. The
selective activation seen in non-DPs (cf. Figure 3) but peaks pattern of results was similar to those of non-DPs in show-
anterior and medial to the peak showing correlations be- ing right FFA suppression for repeated identities, t(11) =
tween face selectivity and identity-related behavioral factor 3.47, p = .003, and expressions, t(11) = 3.91, p = .001. The
scores (cf. Figure 4). The expression suppression contrast left FFA in DPs showed significant expression repetition
also showed a region (Figure 6) in right mid-STS (MNI: 52 suppression, t(9) = 2.99, p = .008, but no effect of identity
−30 4), anterior to the peak right posterior STS face selec- repetition. As with the SPM group analysis, DPs showed
tivity found in non-DPs (cf. Figure 4A). This mid-STS lo- no effects or trends in right posterior STS. Similarly to
cation replicates that observed in previous studies (Fox non-DPs, DPs showed significant expression repetition
et al., 2009; Winston et al., 2004). Some studies have also suppression in right OFA, t(9) = 4.83, p < .001, and left
reported identity suppression in the posterior right STS OFA, t(5) = 3.04, p < .014. The ROI group analysis of rep-
(Fox et al., 2009; Winston et al., 2004), but we did not ob- etition suppression thus did not provide a different out-
serve this. come. In line with the SPM group results, we found the
We tested whether this pattern of repetition suppres- overall pattern of repetition effects to be weaker in DPs
sion was present in DP participants. The SPM group results compared with non-DPs, yet but without any overall signif-
showed expression suppression in the right FG region. icant group differences or behavioral correlations in ROIs,
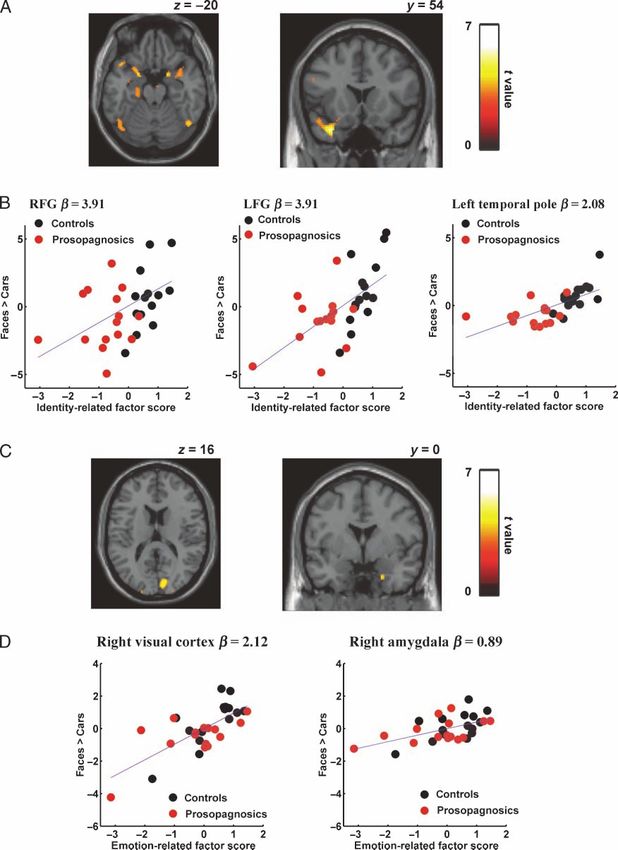
Furl et al. 1733Figure 6. Identity and expression repetition suppression: SPM random- effects analysis. (A) Regions in non-DP control participants showing significant identity repetition suppression in the right FG (left) and expression repetition suppression in right FG (middle) and right mid-STS (right). The right side of each transverse image represents the right hemisphere. (B) Pattern of mean “adjusted responses” (condition-wise beta weights, adjusted for other regressors in general linear model) in non-DP control participants from the peak right FG and right mid-STS voxels found in both identity and expression repetition suppression contrasts. (C) For comparison, we show the pattern of adjusted responses in DPs using the peak right FG and mid-STS voxels shown in (B). All participants were included in SPM analyses. for either identity or expression repetition suppression. not differ significantly between groups (although repetition Also in agreement with the SPM group analysis, we de- suppression tended to be weaker in DPs) nor did it relate tected no interactions between identity and expression significantly to the behavioral factor scores. suppression in any ROI, either for non-DPs or for DPs. This contrasts with the robust statistical relationships Car repetition did not show any effects in any ROI, either we had observed between face selectivity per se (faces > for non-DPs or for DPs. cars) in FG (or individually defined FFA) with the be- In summary, our measures of identity- and expression- havioral Factor 1 of identity-related recognition ability. specific repetition suppression replicated the expected That effect was observed for multiple measures of face findings in non-DP participants. FG showed suppression selectivity, including face selectivity at individual voxels to repeated expressions and identities, whereas right mid- in SPM group analysis, at the peak face selectivity of ROIs STS showed suppression to expressions. However, this did functionally defined in individuals, and the anatomic extent 1734 Journal of Cognitive Neuroscience Volume 23, Number 7
of the face selectivity in these ROIs. Our results thus pro-       individual in our sample, in accord with our “individual
vide new evidence that the neural mechanisms expressing            differences” approach) to fMRI face selectivity in the left
face selectivity do relate to individual differences in face       anterior temporal lobe and right FG. This effect was ob-
identification performance, although repetition suppres-           served for FG face selectivity as identified in SPM group
sion effects apparently may not.                                   analysis and for the peaks and anatomic extent of individu-
                                                                   ally defined FFA ROIs. These results demonstrate that bet-
                                                                   ter performance in facial identity processing tasks was
                                                                   positively associated with fMRI face selectivity in FG bilat-
DISCUSSION
                                                                   erally and left anterior temporal lobe, with peak face selec-
We explored the relationships between behavioral face              tivity in the right and left individually defined FFA, and with
recognition ability and two fMRI measures of neural pro-           the size of the right FFA. The significant brain–behavior
cessing for faces (face selectivity and repetition suppres-        relations we observed applied only to the behavioral com-
sion), exploiting the wide range of face identification            ponent relating to face identification performance (but see
performance among 15 DPs and 15 matched non-DP par-                Supplementary Table 4), even when controlling for the
ticipants. As a group, DPs showed reduced face-selective           other two factors (related to performance for facial ex-
responses in the bilateral FFA and smaller face-selective          pressions or nonface objects). The second and the third
clusters in right FFA. We employed a factor analytic ap-           factors were not related to any of our three face selectivity
proach to our behavioral battery, as recently reported in          fMRI measures: SPM voxels, ROI peaks, or ROI cluster size.
our related structural MR study (Garrido et al., 2009). For        The absence of face-selective ROIs, including for right
this approach, we derived behavioral scores from standard          posterior STS, was also associated with DP-related deficits.
factor analysis of all participantsʼ performance on the test       Thus, we provide abundant new evidence linking face
battery. This yielded three orthogonal components of be-           identification ability to individual differences in function
havioral variability related to recognition for facial identity,   for core face-selective areas (FG, posterior STS) in relation
nonface objects, and facial expressions.                           to fMRI face selectivity (assessed here by the face > car
   Our analyses demonstrate that the identity-related be-          contrast). Although we found several forms of repetition
havioral factor was linearly related (when considering every       suppression in these and related regions, the repetition

Figure 7. Identity and
expression repetition
suppression in individually
defined FFA. Average peak
parameter estimate (beta
weight) with 95% confidence
intervals in right and left
for the six conditions. Also
shown are p values less than
.05 for identity repetition
suppression (denoted
“identity”) and expression
repetition suppression
(denoted “expression”).

                                                                                                              Furl et al.    1735
Figure 8. ROI identity
and expression repetition
suppression in posterior
STS and OFA. Average peak
parameter estimate (beta
weight) with 95% confidence
intervals in right and left
OFA plus right posterior STS
for the six conditions. Also
shown are significant and
near-significant p values
for identity repetition
suppression (denoted
“identity”) and expression
repetition suppression
(denoted “expression”).
phenomena were not strongly linked to individual differ- the prediction that behavioral success in differentiating
ences in behavior, unlike the face selectivity per se. identities (and individual differences in this ability) may
be correlated with FG face selectivity. Our new data in re-
lation to individual differences in face identification skill
Face Selectivity and Successful Recognition
(across non-DP and DP participants considered as one
of Identities
sample of variation in such skill) provide new evidence
The FG and the FFA have received considerable research consistent with this view.
attention. Its robust face selectivity across many normal Our approach allowed us to detect quantitative rela-
observers suggests that it may provide an important mech- tionships between fMRI measures and the magnitude of
anism for face representation. More controversially, it has behavioral skill. A quantitative (rather than all-or-none) re-
been claimed that FG and/or FFA may provide specialized lationship between the extent of face identification ability
mechanisms for individuating identities as opposed to rec- and face selectivity may, in part, help explain the hetero-
ognition of other physical attributes of faces (Rotshtein geneous results seen in the previously published DP case
et al., 2005; Haxby et al., 2000). Such claims have led to studies, typically examining a smaller number of participants
1736 Journal of Cognitive Neuroscience Volume 23, Number 7(Minnebusch et al., 2009; Bentin et al., 2007; Williams et al., duced functional connectivity between right FG and left
2007; Avidan et al., 2005; Hasson et al., 2003; Hadjikhani anterior lobe compared with a non-DP control population.
& de Gelder, 2002). In our study, nearly all DPs (12 of Although these anterior temporal regions may be struc-
15 DPs) evinced normal-appearing right FFAs when we turally deficient in DPs, Behrmann et al. (2007) did not
inspected cases individually. We observed more quantita- find structural or functional deficits that overlapped with
tive relationships here, which may be consistent with DP core functional regions (such as posterior or mid-FG). In
individuals forming the tail end of a potentially more con- contrast, our previous structural study with the same par-
tinuous distribution of facial recognition ability. Such con- ticipants as reported here (Garrido et al., 2009) revealed
tinuous variability might also potentially explain why the reduced gray matter in DPs for a mid-FG region, which
SPM group analysis did not reveal significant effects in FG was relatively near to our face-selective FG region here.
for categorical comparisons between group means. Sig- To provide an initial exploration into possible relations
nificant FG findings were instead most apparent for regres- between structural MR outcomes and functional MR out-
sions aimed at detecting continuous linear relationships comes within the same sample, we used our previously
rather than discrete differences. Although our ROI group published structural measures (see Garrido et al., 2009)
analysis of peak selectivity and cluster size was sensitive to explore the idea that reduced functional face selectivity
to some discrete differences, our data suggest that many (in fMRI) might relate to deficient underlying gray matter
DPs may be part of the wider spectrum of face identifica- in structural MR (Supplementary Results and Supplemen-
tion ability, although this “continuum” versus “dichotomy” tary Table 4). However, this preliminary analysis found
issue requires further research with even larger samples. no significant correlations between functional and struc-
Beyond FG/FFA, our data implicate additional regions tural measures for any of the ROIs showing face selectivity
in face identification ability. Right posterior STS face se- reductions with worse face identification here. Future re-
lectivity was absent or abnormal in many DPs (Figure 5), search with larger samples will be needed to unravel the
although we did not find statistically robust regression ef- structural-functional relation in the context of face iden-
fects for the face identification factor in this region (but tification skills. Moreover, this may require sophisticated
note that there were fewer participants in the analysis multivariate analysis approaches because it is possible that
for STS ROIs). Intriguingly, right STS was also implicated structural variation in one (or several) particular brain re-
in our previous study of the structural correlates of DP- gion could lead to functional variation in remote but inter-
related face impairments, using the same participant popu- connected regions. Hence, those areas showing structural
lation (Garrido et al., 2009). In that study, a mid-STS region variation may not have a one-to-one correspondence with
(somewhat anterior to the more posterior STS face selec- those showing functional variation.
tivity we observed here) showed decreased gray matter
volume in our DP population compared with the same
Measuring Orthogonal Components of
matched non-DP control sample.
Recognition Ability
It is notable also that the SPM group analysis revealed
a sizable correlation of fMRI face selectivity with behavioral We included several tasks (including the CFMT and the
face identification near the left temporal pole (Table 2). FFT) that putatively measure face identification ability. Per-
Previous fMRI work suggests that (in non-DP participants) formance on any one of these tasks, taken by itself, is pre-
anterior temporal cortex may subserve identity-specific sumably attributable in part to identity-related processing.
face perception (Rotshtein et al., 2005) and may represent Yet any raw putative identity-related measure (taken by
person-specific conceptual knowledge (Simmons & Martin, itself ) may be potentially confounded by variability attrib-
2009). At least in the right hemisphere, anterior temporal utable to other visual processes also or to the participantʼs
cortex further can signal information about individual iden- attention during that task. The factor analysis method can
tities (Kriegeskorte, Formisano, Sorger, & Goebel, 2007). provide some greater assurance that the variability as-
Moreover, for DPs, there are recent reports of some struc- sociated with the emergent identity-related performance
tural abnormalities in temporal pole (Behrmann et al., factor is related only to that portion of variability held in
2007). Our previous structural study showed a similar tem- common by a diverse range of face identification-related
poral pole effect in the same sample of DPs we report tasks. Moreover, the factor analysis also ensures this vari-
here, although in the right hemisphere (Garrido et al., ability will be orthogonal to that associated with other fac-
2009). This further accords with recent findings that the tors, as for the object and expression components here.
white matter integrity of connections between regions in Despite the effectiveness of this factor analytic approach,
the occipital and posterior temporal lobes and more anterior we believe that it could be further improved. A greater num-
temporal regions are reduced in some DPs, as suggested ber and diversity of behavioral measures and participants
recently using diffusion tensor tractography (Thomas et al., will presumably produce increasingly “pure,” interpretable,
2009). Interestingly, a DP case study (von Kriegstein, and useful resultant factors. For example, our face identi-
Kleinschmidt, & Giraud, 2006) seems to accord with such fication factor here related to several memory tests (e.g.,
an interregional perspective by showing not only reduced CFMT) and so might be rendered more identity specific by
face responses in the anterior temporal lobe but also re- including more perception-based tests. It is reassuring in
Furl et al. 1737You can also read