KBC Group Analysts' presentation 2Q 2020 Results

Page created by Randall Moran
 
CONTINUE READING
KBC Group Analysts' presentation 2Q 2020 Results
KBC Group
 Analysts’ presentation
 2Q 2020 Results
 6 August 2020 – 11 AM CEST

Dial-in numbers                   +44 1296 480 104                 Teleconference replay will be available on
                                  +32 2717 3266                    www.kbc.com until 21 August 2020
                                  +1 718 354 1176
                                  +420 239 000 221

More infomation: www.kbc.com

KBC Group - Investor Relations Office - Email:   IR4U@kbc.be

                                                               1
KBC Group Analysts' presentation 2Q 2020 Results
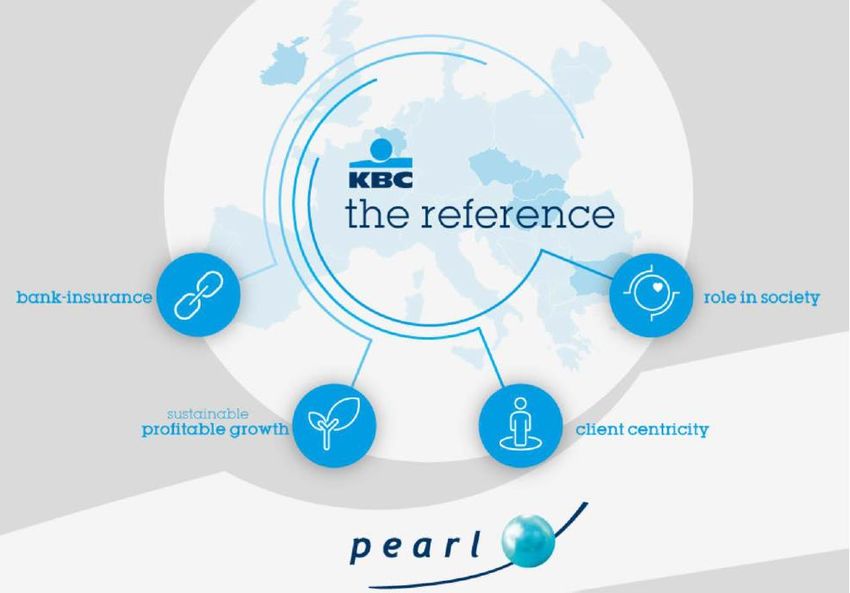
Important information for investors
▪ This presentation is provided for information purposes only. It does not constitute an offer to sell or the solicitation to buy any
  security issued by the KBC Group.

▪ KBC believes that this presentation is reliable, although some information is condensed and therefore incomplete. KBC cannot be
  held liable for any loss or damage resulting from the use of the information.
▪ This presentation contains non-IFRS information and forward-looking statements with respect to the strategy, earnings and capital
  trends of KBC, involving numerous assumptions and uncertainties. There is a risk that these statements may not be fulfilled and
  that future developments differ materially. Moreover, KBC does not undertake any obligation to update the presentation in line
  with new developments.

▪ By reading this presentation, each investor is deemed to represent that it possesses sufficient expertise to understand the risks
  involved.

                                                                2
KBC Group Analysts' presentation 2Q 2020 Results
2Q 2020 key takeaways
                       2Q20 financial performance
❖ Commercial bank-insurance franchises in core
  markets performed well
                                                                                                         1H20
❖ Customer loans and customer deposits increased                                ➢ ROE 4%        *
  y-o-y in all of our core countries
                                                                                ➢ Cost-income ratio 59% (adjusted for specific items)
❖ Lower net interest income and net interest margin                             ➢ Combined ratio 83%
❖ Lower net fee and commission income                                           ➢ Credit cost ratio 0.64% (0.20% without
                                                                                  collective covid-19 impairments**)
❖ Sharply higher net gains from financial
                                                                                ➢ Common equity ratio 16.6% (B3, DC, fully loaded)
  instruments at fair value and higher net other
                                                                   Net result   ➢ Leverage ratio 6.0% (fully loaded)
  income
                                                                   of 210m      ➢ NSFR 142% & LCR 136%
❖ Excellent result of non-life & life insurance
                                                                   EUR in                                   Net result
                                                                                            745
❖ Costs significantly down                                         2Q20                               612
                                                                                                                  702

                                                                                  430
❖ Higher net impairments on loans. The full
                                                                                                                                   210
  collective Covid-19 expected credit losses have
  already been booked in 1H20                                                                                             -5
                                                                                  1Q19     2Q19      3Q19        4Q19    1Q20     2Q20
❖ Solid solvency and liquidity
                                                                                * when evenly spreading the bank tax throughout the year
❖ In line with the recent ECB recommendation, we                                ** 789m EUR collective Covid-19 impairments in 1H20, of which
                                                                                639m EUR management overlay (596m EUR in 2Q20 and 43m EUR
  cannot execute our usual dividend policy. As a                                in 1Q20) and 150m EUR impairments captured by the ECL models
  consequence, no interim dividend will be paid out                             through the updated IFRS 9 macroeconomic variables in 2Q20
  in November 2020
                                                                        3
Comparisons against the previous quarter unless otherwise stated
KBC Group Analysts' presentation 2Q 2020 Results
Overview of building blocks of the 2Q20 net result

                                                                             2.043
                                                                 72                          -27
                                                   253
                                     247                                                                   -877

                       388
        1.083

                                                                                                                  -857

                                                                                                                              -3      -69
                                                                                                                                                210
          NII          NFCI       Technical        FIFV        Other          Total      Bank taxes Opex excl. Impairments   Other   Income   2Q20 net
                                  Insurance                  Income**       Income                   bank tax                         taxes    result
                                   Result*

Q-o-Q     -9%         -10%          +39%                                      +38%                          -6%

Y-o-Y     -4%         -11%           +40%                                      +7%                          -8%

        * Earned premiums – technical charges + ceded reinsurance
        ** Dividend income + net realised result from debt instruments FV through OCI + net other income

                                                                                     4
KBC Group Analysts' presentation 2Q 2020 Results
Main exceptional items
                                                                                 2Q20                   1Q20                   2Q19

        NII – Early termination of 1 large corporate file                                                    +12m EUR
        Non-Life – Reassessment of claims provisions                                                                               -16m EUR
BE BU

        Opex – Staff expenses                                                                                                       -6m EUR
        Impairments – Modification loss from moratorium                                -11m EUR
                        Total Exceptional Items BE BU                    -11m EUR                 +12m EUR              -22m EUR

        NOI – Revaluation of 55% stake in ČMSS
CZ BU

                                                                                                                                   +82m EUR
        Impairments – Modification loss from moratorium                                 -5m EUR
                      Total Exceptional Items CZ BU                       -5m EUR                                       +82m EUR

        IRL - NOI – Additional impact for the tracker mortgage review                                                               -4m EUR
IM BU

        IRL - Opex – Costs, mainly related to sale of part of legacy loan portf.                                                    -2m EUR
        IRL – Impairments – On sale of legacy loan portfolio                                                                       -12m EUR
        HU – Impairments – Modification loss from moratorium                            +7m EUR              -18m EUR
                       Total Exceptional Items IM BU                         +7m EUR              -18m EUR              -18m EUR

        Opex – Staff expenses (management reorganisation costs)                                                                     -4m EUR
GC

        Tax – DTA impact                                                                                                           +34m EUR
                       Total Exceptional Items GC                                                                       +30m EUR

            Total Exceptional Items (pre-tax)                                    -9m EUR                -6m EUR             +72m EUR

           Total Exceptional Items (post-tax)                                    -6m EUR                -7m EUR             +82m EUR

                                                                             5
KBC Group Analysts' presentation 2Q 2020 Results
Contents

 1    2Q 2020 performance of KBC Group

 2    Covid-19

 3    2Q 2020 performance of business units

 4    Strong solvency and solid liquidity

 5    Looking forward

Annex 1: Company profile
Annex 2: Other items

                                            6
KBC Group Analysts' presentation 2Q 2020 Results
KBC Group

Section 1

2Q 2020 performance of KBC Group

               7
KBC Group Analysts' presentation 2Q 2020 Results
Net result at KBC Group
                                                                                               CONTRIBUTION OF BANKING ACTIVITIES
                                                                                                   TO KBC GROUP NET RESULT*
                                                                                                   618                   586
                                                                                                               514

                                                                                        334

                         NET RESULT AT KBC GROUP*
                                                                                                                                                   42
                            745
                                             702                                                                                      -11
                                    612
                                                                                        1Q19       2Q19       3Q19       4Q19        1Q20         2Q20
                 430

                                                                210                           CONTRIBUTION OF INSURANCE ACTIVITIES
                                                                                                   TO KBC GROUP NET RESULT*
                                                                                                                                                  173
                                                       -5
                                                                                                                          143
                1Q19       2Q19    3Q19      4Q19     1Q20      2Q20
                                                                                                   124             99
                                                                                                                                                  119
                                                                                                                          94
                                                                                         96         61             66
                                                                                         33
                                                                                                    83             79     79           3           85
                                                                                         68
                                                                                                                                      36
                                                                                         -4        -20
* Difference between net result at KBC Group and the sum of the banking and insurance                              -46    -30         -20          -31
                                                                                                                                            -13
 contribution is accounted for by the holding-company/group items
                                                                                        1Q19       2Q19       3Q19       4Q19        1Q20         2Q20

                                                                                                     Non-Life result     Non-technical & taxes

              Amounts in m EUR                                                      8
                                                                                                     Life result
KBC Group Analysts' presentation 2Q 2020 Results
Lower net interest income and net interest margin
                                                     NII                            Amounts in m EUR

                                             1,174          1,182     1,195
                                                                                                                   ▪ Net interest income (1,083m EUR)
                   1,129
                       4 16
                               1,132
                                       12   117 14         114 12      111     17
                                                                                      1,083                          • Decreased by 9% q-o-q and by 4% y-o-y
                                114
                  118
                                       1                                       1       106 6                         • The q-o-q decrease was driven primarily by:
                                                                                                                       o  the CNB rate cuts (from 2.25% early February to 0.25% early May 2020)
                               1,006        1,044          1,057      1,066                                            o  the depreciation of the CZK & HUF versus the EUR (-18m EUR q-o-q)
                   992                                                                 971
                                                                                                                       o  lower reinvestment yields
                                                                                                                       o  pressure on loan margins on total outstanding portfolio in most core
                                             -1                                                                           countries (except in Belgium)
                  1Q19         2Q19         3Q19           4Q19        1Q20           2Q20                             o lower netted positive impact of ALM FX swaps
                   NII - netted positive impact of ALM FX swaps*             NII - Insurance                           partly offset by:
                   NII - Holding-company/group                               NII - Banking                             o lower funding cost
                                                                                                                       o higher margin on new production mortgages than the margin on the
                                                 NIM **
                  1.98%
                                                                                                                          outstanding portfolio in Belgium, the Czech Republic and Slovakia
                                                                       1.97%
                               1.94%         1.94%          1.94%                                                      o higher NII due to larger bond portfolio
                                                                                       1.82%

                                                                                                                   ▪ Net interest margin (1.82%)
                                                                                                                     • Decreased by 15 bps q-o-q and by 12 bps y-o-y due mainly to the CNB
                                                                                                                       rate cuts, the negative impact of lower reinvestment yields and an
                   1Q19         2Q19         3Q19           4Q19       1Q20            2Q20                            increase of the interest-bearing assets (denominator)
             * From all ALM FX swap desks
             ** NIM is calculated excluding the dealing room and the net positive impact of ALM FX swaps & repos

             ORGANIC VOLUME TREND                              Total loans**                 o/w retail mortgages           Customer deposits***              AuM               Life reserves
             Volume                                                 158bn                              68bn                         211bn                    202bn                   28bn
             Growth q-o-q*                                           0%                                +1%                           +1%                       +4%                   +2%
             Growth y-o-y                                            +4%                               +4%                           +7%                       -4%                    -3%
* Non-annualised ** Loans to customers, excluding reverse repos (and bonds). Growth figures are excluding
                                                                                                    9       FX, consolidation adjustments, reclassifications and collective Covid-19 ECL
*** Customer deposits, including debt certificates but excluding repos. Customer deposit volumes excluding debt certificates & repos +5% q-o-q and +11% y-o-y
KBC Group Analysts' presentation 2Q 2020 Results
Lower net fee and commission income
                                    F&C                        Amounts in m EUR        ▪ Net fee and commission income (388m EUR)
                                                                                         • Down by 10% q-o-q and by 11% y-o-y
                             444          445
 410            435                                    429
                                                                    388                  • Q-o-q decrease was the result of the following:
                                          243
                                                                                           o Net F&C income from Asset Management Services decreased
 219            230          237                       229
                                                                    219                       by 12% q-o-q as a result of lower management and entry fees
                                                                                              from mutual funds & unit-linked life insurance products
                                                                                           o Net F&C income from banking services decreased by 5% q-o-q
 264            270          275          279          270                                    (-3% q-o-q excluding FX effect) due mainly to lower fees from
                                                                    237
                                                                                              payment services (less transaction volumes as a result from
  -73           -65           -68         -77          -71          -68                       Covid-19) and lower network income, partly offset by higher
 1Q19           2Q19         3Q19         4Q19        1Q20         2Q20                       fees from credit files & bank guarantees
                                                                                           o Distribution costs fell by 4% q-o-q
 Distribution          Banking services         Asset management services                • Y-o-y decrease was mainly the result of the following:
                                                                                           o Net F&C income from Asset Management Services fell by 13%
                                                                                              y-o-y as a result of lower management fees and entry fees
                                                                                           o Net F&C income from banking services decreased by 5% y-o-y
                                                              Amounts in bn EUR
                                                                                              (-2% y-o-y excluding FX effect) driven mainly by lower fees
                                    AuM                                                       from payment services (partly due to less transaction volumes
                                          216
                                                                                              as a result of Covid-19, partly due to the SEPA regulation) and
 210            210          212
                                                        193
                                                                    202                       lower fees from credit files & bank guarantees, partly offset
                                                                                              by higher securities-related fees
                                                                                           o Distribution costs rose by 3% y-o-y due chiefly to higher
                                                                                              commissions paid linked to banking products

                                                                                       ▪ Assets under management (202bn EUR)
 1Q19           2Q19         3Q19         4Q19         1Q20        2Q20
                                                                                         • Increased by 4% q-o-q due to a positive price effect (+5%), partly
                                                                                           offset by net outflows (-1%)
                                                                                         • Decreased by 4% y-o-y as a result of net outflows (-3%) and a
                                                                                           negative price effect (-1%)
                                                                                  10
Non-life premium income up y-o-y
and excellent combined ratio

PREMIUM INCOME (GROSS EARNED PREMIUMS)                                               ▪ Insurance premium income (gross earned
                                                 805
                                                                                       premiums) at 712m EUR
  766               742                                     740
                                  731                                     712          • Non-life premium income (435m EUR) increased by
   351              317           291            364        297           276
                                                                                         2% y-o-y
                                                                                       • Life premium income (276m EUR) down by 7% q-o-q
                                                                                         and by 13% y-o-y
   415              425           440            441        443           435

  1Q19              2Q19          3Q19          4Q19        1Q20         2Q20

          Life premium income                 Non-Life premium income

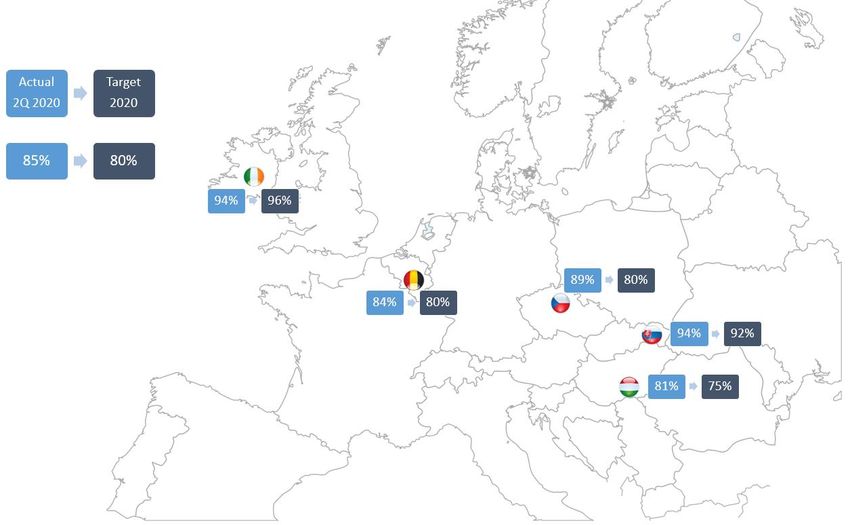
              COMBINED RATIO (NON-LIFE)                                              ▪ The non-life combined ratio for 1H20
                                                                                       amounted to an excellent 83%. This is the
   93%        90%          92%                   92%               90%
                                      83%                                              result of 5% y-o-y premium growth combined
                                                                                       with 13% y-o-y lower technical charges in
                                                                                       1H20. The latter was due mainly to lower
                                                                                       normal claims in 1H20 (especially in Motor
                                                                                       due to Covid-19) and a negative one-off in
                                                                                       1H19 (-16m due to reassessment on claims
         1Q                      1H                    9M                FY            provisions). However, note that 1H20 was
                                                                                       impacted by a higher negative ceded
                                       2019        2020
                                                                                       reinsurance result compared with 1H19
  Amounts in m EUR

                                                                                11
Non-life sales up y-o-y, life sales up q-o-q and y-o-y

  NON-LIFE SALES (GROSS WRITTEN PREMIUM)                                           ▪ Sales of non-life insurance products
                                                         567                         • Up by only 1% y-o-y due to negative impact of Covid-19
    534
                                                                                       on new business (mainly in motor and property) and on
                412          411          400                          415             renewals

   1Q19        2Q19         3Q19          4Q19          1Q20           2Q20

                                                                                   ▪ Sales of life insurance products
                            LIFE SALES                                               • Increased by 32% q-o-q and by 22% y-o-y
                                                                        561
    516                                                                              • The q-o-q and y-o-y increase was driven entirely by
                459                        471
                             403                          427           235            higher sales of unit-linked products in Belgium (due to
    302                                                                                the launch of new products), only partly offset by lower
                261
                             242
                                           311            249                          sales of guaranteed interest products (mainly due to the
                                                                                       suspension of universal single life insurance products in
                                                                        327
    214         198                                       177
                                                                                       Belgium)
                             161           160
                                                                                     • Sales of unit-linked products accounted for 58% of total
   1Q19        2Q19         3Q19          4Q19           1Q20          2Q20            life insurance sales in 2Q20

           Guaranteed interest products         Unit-linked products

  Amounts in m EUR

                                                                              12
Sharply higher FIFV and higher net other income
                                  FIFV                               253                      ▪ The q-o-q strong rebound in net gains from
                                                                     126
                                                                                                financial instruments at fair value was attributable
        99
                                              130                                               mainly to:
                                              44
       62                 8                  48
                                                                     100                        • a positive change in market, credit and funding value
      29
         11               19            17   28
                                                10
                                                                    -3 31
                                                                                                  adjustments (mainly as a result of changes in the
                                -25
              -3   -22    -8      -37                    -58                                      underlying market value of the derivatives portfolio due
                    -2         -1
                                -46
                                                                                                  to increasing equity markets and decreasing
                                                        -186                                      counterparty credit spreads & KBC funding spread, partly
                                                                                                  offset by lower long-term interest rates)
                                                         -59                                      o FVA: 73m EUR (+173m EUR q-o-q)
                                                         -82                                      o CVA: 26m EUR (+105m EUR q-o-q)
                                                        -385
                                                                                                  o MVA: 1m EUR (+8m EUR q-o-q)
       1Q19        2Q19        3Q19          4Q19       1Q20         2Q20                       • excellent dealing room income
Dealing room & other income       M2M ALM derivatives                                           • a higher net result on equity instruments (insurance)
MVA/CVA/FVA                       Net result on equity instruments (overlay insurance)          • a positive change in ALM derivatives

                         NET OTHER INCOME
                   133
                                                                                              ▪ Net other income amounted to 53m EUR, more or
                                                                                                less in line with the normal run rate of around 50m
                                                                                                EUR per quarter
        59                                                             53
                                43            47          50

       1Q19        2Q19        3Q19          4Q19        1Q20        2Q20

     Amounts in m EUR

                                                                                         13
Costs significantly down
                                          OPERATING EXPENSES                                                        ▪ Operating expenses excluding bank taxes
                                                                                                                      decreased by 6% q-o-q primarily as a result of the
                                                                                   1,338
                         1,296                                                                                        announced cost savings related to Covid-19:
                         382            988                         1,045          407                                   o lower staff expenses (partly due to reduced accrued
                                                      975
                                        30            28
                                                                      51                         904                       variable remuneration and less FTEs q-o-q), despite
                                                                                                 27
                                                                                                                           wage inflation in most countries
                                                                                                                         o lower facilities, marketing, travel and event costs
                                                                    994
                         913            957           947                          931           877                     o FX effect (-14m EUR q-o-q)
                                                                                                                    ▪   Operating expenses excluding bank taxes
                         1Q19          2Q19           3Q19          4Q19           1Q20          2Q20
                                                                                                                        decreased by 8% y-o-y due partly to the
                                                                                                                        announced cost savings related to Covid-19,
                                              Bank tax        Operating expenses                                        despite the full consolidation of CMSS (15m EUR
      Amounts in m EUR
                                                                                                                        in 2Q20 versus 5m EUR in 2Q19). Also note that
                                                                                                                        2Q19 was impacted by the 12m EUR negative
    BANK TAX SPREAD IN 2020 (PRELIMINARY)**                                                                             one-offs
               TOTAL                   Upfront                       Spread out over the year
                                                                                                                    ▪   Cost/income ratio (banking) adjusted for specific
                   2Q20          1Q20         2Q20           1Q20           2Q20         3Q20e         4Q20e
                                                                                                                        items* at 52% in 2Q20 and 59% YTD (58% in
                                                                                                                        FY19), the latter distorted by sharply lower FIFV
 BE BU              2            289             2            0              0             0             0
                                                                                                                        (Financial Instruments at Fair Value).
 CZ BU              0             40             0            0              0             0             0              Cost/income ratio (banking): 46% in 2Q20 and
 Hungary            18            25             1            20             18            22           22              66% YTD, both distorted by bank taxes and the
                                                                                                                        latter by sharply lower FIFV
 Slovakia           8             3              0            8              8             0             0

 Bulgaria           -1            17             -1           0              0             0             0          ▪ Total bank taxes (including ESRF contribution) are
                                                                                                                      expected to increase by 3% y-o-y to 504m EUR in
 Ireland            0             4              -1           1              1             1            26
                                                                                                                      FY20
 GC                 0             0              0            0              0             0             0

 TOTAL              27           377             0            29             27            23           48     14
                                                                                                                        * See glossary (slide 90) for the exact definition
Amounts in m EUR                                                                                                        ** Still subject to changes
Overview of bank taxes*                                                                                                                                          Bank taxes of 291m EUR YTD.
                                                                                                                                                                         On a pro rata basis, bank taxes
                                                                                                        Amounts in m EUR                                                 represented 12.1% of 1H20
                                                                                                                                                                         opex at the Belgium BU
                            KBC GROUP                                      Bank taxes of 434m EUR YTD.                                BELGIUM BU
                                                        407
                                                                           On a pro rata basis, bank taxes        273
                                                                                                                                                                  289
      382                                                                  represented 12.2% of 1H20                                                               67
                                                                                                                   63
      109
                                                        115                opex at KBC Group**

                                                                                                                  210                                             222
      273                                               292

                 30            28            51                   27                                                          4                                                 2
                                                                                                                                           0           0
                29 2                                             25 2                                             1Q19      2Q19         3Q19         4Q19        1Q20      2Q20
      1Q19      2Q19          3Q19          4Q19       1Q20       2Q20
                    European Single Resolution Fund (ESRF) contribution
                                                                                                                                  ESRF contribution        Common bank taxes
                    Common bank taxes
                                                                                                                                                                         Bank taxes of 102m EUR YTD.
                                                                                                                                                                         On a pro rata basis, bank
                                                                           Bank taxes of 41m EUR YTD.
                                                                                                                                                                         taxes represented 19.2% of
                                                                           On a pro rata basis, bank
                     CZECH REPUBLIC BU                                     taxes represented 5.7% of
                                                                                                                  INTERNATIONAL MARKETS BU                               1H20 opex at the IM BU

                                                          41               1H20 opex at the CZ BU                   74                                              77
        35                                                                                                                                                          19
                                                                                                                    18
                                                                                                                                                       50
                                                          29
        28
                                                                                                                              26           28
                                                                                                                    56                                              58           25

                                                                                                                              28
                                                          12
         7          1            0            0                        0
                                                                                                                              -2
       1Q19       2Q19         3Q19          4Q19        1Q20      2Q20                                           1Q19       2Q19         3Q19        4Q19        1Q20          2Q20

                                                                                                                                  ESRF contribution         Common bank taxes
                        ESRF contribution          Common bank taxes

* This refers solely to the bank taxes recognised in opex, and as such it does not take account of income tax expenses, non-recoverable VAT, etc.
** The C/I ratio adjusted for specific items of 59% in 1H20 amounts to 51% excluding these bank taxes
                                                                                                15
Full collective Covid-19 expected credit losses have already
          been booked in 1H20
                                               ASSET IMPAIRMENT                                  857
                                                                                                 12          ▪ Higher asset impairments q-o-q
                                                                                   141
                                                                                                               • The q-o-q increase of loan loss provisions was attributable to:
                                                                                                 746
                                                                                   20                            o 746m EUR collective Covid-19 impairments, of which 596m
                         69                                          82             43                              EUR management overlay (compared with 43m EUR in 1Q20)
                                                                     7
                         1              40
                                                      26                                          99                and 150m EUR impairments captured by the ECL models
                         67               4                          75             78
                                       36            25
                                                        1                                                           through the updated IFRS 9 macroeconomic variables. Note
                       1Q19            2Q19          3Q19           4Q19           1Q20          2Q20               that based on the assumptions at the end of 2Q20, the full
                                                                                                                    collective Covid-19 expected credit losses (ECL) have already
                   Other impairments                Impairments on financial assets at AC and FVOCI
                                                                                                                    been booked in 1H20
                   Collective Covid-19 ECL
                                                                                                                 o higher loan loss impairments in Belgium and the Czech
                                              CREDIT COST RATIO                                                     Republic due mainly to several corporate files
                                                                                         0.64%
                                                                                                               • Impairment of 12m EUR on ‘other’, of which a 16m EUR
                   0.42%                                                                                         negative one-off impact of the payment moratorium in Belgium
                                                                                                                 and the Czech Republic, partly offset by a 7m EUR positive one-
                               0.23%
                                                                                                                 off partial reversal of the payment moratorium in Hungary
                                                                           0.12%
                                         0.09%                                                                   booked in 1Q20 (IFRS modification loss from the time value of
                                                                                                                 payment deferral)
                                                     -0.06%      -0.04%
                    FY14       FY15          FY16     FY17        FY18      FY19         1H20

                                                                                                             ▪ The credit cost ratio in 1H20 amounted to:
                                         IMPAIRED LOANS RATIO
                      4.3%
                                                                                                               • 20 bps (12 bps in FY19) without collective Covid-19 ECL
                                      3.7%           3.5%           3.5%                         3.4%
                                                                                                               • 64 bps with collective Covid-19 ECL (already 100% booked in
                                                                                   3.3%
                                                                                                                 1H20)
                                                                                                             ▪ The impaired loans ratio amounted to 3.4%, 1.9% of
                      2.4%            2.1%
                                                                                                               which over 90 days past due
                                                     2.0%           1.9%           1.9%          1.9%

                      1Q19            2Q19           3Q19          4Q19            1Q20          2Q20
                                                                                                        16
Amounts in m EUR              Impaired loans ratio           of which over 90 days past due
KBC Group

 Section 2

 Covid-19

             17
COVID-19 (1/9)
Commitment towards our stakeholders
   Safety & continuity
 • All principles of health & safety in line with local government recommendations
 • Vast majority of staff worked remotely during lockdown. In the meanwhile, partial return of staff on premise (split teams
   (remote/on premise) to ensure continuity)
 • Dedicated crisis team
 • Continuous Covid-19 communication update (such as social distancing instructions) via different information channels
 • Cancellation of all travel & events

  Digital is the new normal
• During lockdown, our customers switched in large numbers to digital channels
• The digital share of total product sales hit record levels in our six core countries
• Growth in % of customers who have at least one of our digital apps in all age categories, but exceptionally strong growth among
  customers of > 55 years

   Digital boost in different core markets
• New additional services in KBC Mobile (Belgium), such as those for purchasing film tickets and for topping up call credit, transport
  solutions like renting of a shared car and the launch of ‘Goal Alert’ (where customers and non-customers of KBC, will be able to
  watch the goals, action replays and highlights of the weekend’s football matches in Belgium). For insured victims of a physical
  accident (private individuals), it is now also possible to upload their medical expenses online and to follow-up the status of the
  processing of their claims digitally
• UBB Interlease was the first leasing company in Bulgaria to introduce fully digital front office activities and the digital signing of
  lease contracts a month before the Covid-19 outbreak. Customers welcomed the digital service and 24% of all leasing contracts
  have already been signed remotely since the start of May
• KBC Bank Ireland experimented with an innovative way to interact with (potential) customers remotely. Live webinars are
  organised where customers are informed about the process of buying, financing and insuring a house. Customers can ask questions
  live and book appointments. The first of its kind in Ireland with 1,300 registrations (via social media)
                                                                         18
COVID-19 (2/9)
                Latest status of government & sector measures in each of our core countries

                             Belgium                                                     Czech Republic                                            Hungary
                        Opt-in: 3 months for consumer finance , 6-9         Opt-in: 3 or 6 months                                     Opt-out: a blanket moratorium
Deferral of payments

                        months for mortgages and non-retail loans,          • Applicable for retail and non-retail clients            until 31 Dec 2020
                        (maximum until 31 Oct 2020 and can be               • For private persons and entrepreneurs: deferral of      • Applicable for retail and non-retail
                        extended to 31 Dec 2020)                              principal and interest payments, while only             • Deferral of principal and interest payments
                        • For private persons: deferral of principal and      deferral of principal payments for non-retail clients   • Interest is accrued over deferral period, but
                           interest payments, while only deferral of        • Interest is accrued over the deferral period, but         unpaid interest cannot be capitalised and
                           principal payments for non-retail clients          has to be paid in the last instalment, resulting in a     must be collected on a linear way during
                        • Interest is accrued over the deferral period,       modification loss for the bank (-5m EUR, booked in        the remaining (extended) lifetime. This
                           with the exception of families with net            2Q)                                                       results in a modification loss for the bank
                           income less than 1,700 EUR. For the latter       • For consumer loans, the interest during the               (-18m EUR booked in 1Q; revised to -11m
                           group, this results in a modification loss for     deferral period cannot exceed 2-week repo rate            EUR in 2Q based on the actual opt-out
                           the bank (-11m EUR booked in 2Q)                   + 8%                                                      ratio)

                         •   A state guarantee scheme up to 40bn EUR to     • The      Czech-Moravian       Guarantee       and       • A guarantee scheme is provided by
                             cover losses incurred on future non-retail       Development      (CZMRB)     launched      several        Garantiqa and the Hungarian Development
                             loans granted before 30 Sep 2020 to viable       guarantee programs (COVID II, COVID II Praha,             Bank. These state guarantees can cover up
Guarantee Scheme &

                                                                              COVID III) for working capital loans provided by          to 90% of the loans with a maximum tenor
 liquidity assistance

                             companies, with a tenor of maximum 12
                             months and with maximum interest of              commercial banks to non-retail clients. The loan          of 6 years
                             1.25%. Guarantee covers 50% of losses above      amount is guaranteed up to 80% or 90% of the            • Funding for growth scheme (launched by
                             3% of total credit losses and 80% above 5%       loan amount. Interest on these loans is subsidised        MNB): a framework amount of 4.2bn EUR
                             of losses                                        up to 25% (COVID II)                                      for SMEs that can receive loans with a 20-
                         •   As of 3Q, a revised state guarantee scheme     • The Export Guarantee and Insurance Cooperation            year tenor at maximum interest rate of 2.5%
                             up to 10bn EUR has been offered to cover         (EGAP) under its COVID Plus program offers              • Annual interest rate on personal loans
                                                                              guarantees on loans provided by commercial                granted by commercial banks may not
                             losses on future SME loans granted before 31
                                                                              banks. EGAP guarantees 70% to 80% of the loan             exceed the central bank base rate by more
                             Dec 2020, with a tenor between 1 and 3
                                                                              amount, depending on the rating of the debtor.            than 5pp
                             years and with maximum interest of 2%.           The program is aimed at companies for which
                             Guarantee covers 80% on all losses               exports accounted for more than 20% of turnover
                                                                              in 2019
                                                                                              19
COVID-19 (3/9)
          Latest status of government & sector measures in each of our core countries

                                Slovakia                                                    Bulgaria                                   Ireland
                                                                                                                                 Opt-in: 3 to 6 months
     Deferral of payments

                            Opt-in: 9 months or 6 months (for leases)                Opt-in: 6 months
                            • Applicable for retail customers, SMEs and              (until 31 Mar 2021 at the latest)           • Applicable for mortgage loans, consumer
                              entrepreneurs                                          • Applicable for retail and non-retail        finance loans and business banking loans with
                            • Deferral of principal and interest payments            • Deferral of principal and interest          repayment schedule
                            • Interest is accrued over the deferral period, but        payments                                  • Deferral of principal and interest payments for
                              the client has the option to pay all interests at      • In case of principal deferral only,         up to 6 months (with revision after 3 months)
                              once after the moratorium or pay it on a linear          tenor is extended with 6 months             for mortgages & consumer finance and 3
                              basis. The latter option would result in an            • Interest is accrued over deferral           months for business banking
                              immaterial modification loss for the bank                period and is payable in 12 months        • Option for customers to extend their loan term
                                                                                       (consumer and non-retail) or 60             by up to 6 months to match payment break
                                                                                       months      (mortgages)     in    equal     term
                                                                                       instalments                               • Interest is accrued over the deferral period

                            • Anti-Corona Guarantee program offered by the         • 0.4bn EUR of state guarantees provided      • The Irish authorities put substantial relief
Guarantee Scheme &
 liquidity assistance

                              Slovak Investment Holding (SIH), aiming at SMEs,       by the Bulgarian Development Bank to          measures in place amongst others via the
                              consists of two components: (i) state guarantee        commercial banks. From this amount,           SBCI. KBC Bank Ireland is mainly focused on
                              with 50% portfolio cap and (ii) the interest rate      0.1bn EUR is used to guarantee 100%           individual customers, therefore the relief
                              subsidy reaching up to 4% p.a.                         on consumer loans, while 0.3bn EUR is         programs for business customers are less
                            • In addition, the financial aid in the form of the      planned to be used to guarantee 80% on        relevant
                              State guarantee schemes with guarantee fee             non-retail loans
                              subsidy can be provided by (i) Export-Import Bank
                              of SR guaranteed up to 80% for loan < 2m EUR
                              and (ii) Slovak Investment Holding for loans 2-20m
                              EUR guaranteed up to 90%. No portfolio cap

                                                                                                20
COVID-19 (4/9)
    IFRS 9 scenarios

                OPTIMISTIC                                      BASE-CASE                                  PESSIMISTIC                         • Despite a gradual lifting of lockdown measures in many
                SCENARIO                                        SCENARIO                                    SCENARIO                             countries, there remains substantial uncertainty about the
    Virus spread quickly and                        Virus spread and impact                     Spread continues until                           economic impact of the precautionary lockdown measures
    definitively brought under                      under control without                       vaccination becomes                              as well as about the policy reactions to mitigate the impact
    control, with no further risk of                additional extensive                        available, with partial or full                  of the crisis
    future lockdowns, fast decline                  lockdown measures                           lockdowns                                      • Because of this uncertainty, we continue working with
    in number of cases
                                                                                                                                                 three alternative scenarios: a base-case scenario, a more
    Steep and steady recovery                       More moderate, but still                    Longer term stagnation and                       optimistic scenario and a more pessimistic scenario
    from 3Q20 onwards with a fast                   steady recovery from 3Q20                   negative growth, with                          • The definition of each scenario remains approximately the
    return to pre-Covid-19 activity                 onwards with a recovery to                  unsteady recovery path
    levels                                          pre-Covid-19 activity levels
                                                                                                                                                 same as in the previous quarter, but we are assigning the
                                                    by end 2023                                                                                  following probabilities: 45% for the base-case scenario,
                                                                                                                                                 40% for the pessimistic and 15% for the optimistic
    Sharp, short V pattern                          Pronounced V/U-pattern                      More L-like pattern, with
                                                                                                right leg only slowly
                                                                                                                                                 scenario
                                                                                                increasing                                     • We have revised up euro area GDP growth for 2020 to
                                                                                                                                                 -9.6% and, mechanically, this less negative outcome for
                                                                                                                                                 2020 translates into a downward revision of 2021 growth
Macroeconomic scenarios*                                                                                                                         to 6.2%
June 2020

Real GDP growth                                        2020                                                    2021                                        2022

                                  Optimistic            Base          Pessimistic         Optimistic            Base            Pessimistic   Optimistic   Base    Pessimistic
Euro area                            -6.0%              -9.6%            -14.0%              6.5%               6.2%              -3.2%         1.3%       1.2%       5.0%
Belgium                              -5.0%              -9.5%            -13.2%              6.0%               5.7%              -3.2%         1.3%       1.3%       5.0%
Czech Republic                       -5.0%             -10.0%            -15.0%              4.0%               6.0%               3.0%         2.5%       3.5%       2.7%
Hungary                              -3.0%              -6.2%            -10.0%              4.0%               5.0%               4.0%         3.5%       3.5%       3.5%
Slovakia                             -5.0%             -10.0%            -14.0%              4.5%               7.0%               1.5%         2.6%       4.5%       2.5%
Bulgaria                             -4.0%              -8.0%            -12.0%              3.0%               5.0%               4.0%         3.0%       3.0%       3.0%
Ireland                              -2.0%              -5.0%            -10.0%              2.0%               4.0%               1.0%         2.6%       3.5%       2.5%
•    The macro-economic information is based on the economic situation in June 2020 and hence do not yet reflect the official
     macroeconomic figures for 2020Q2 as reported by different authorities                                                        21
COVID-19 (5/9)
   IFRS 9 scenarios

Macroeconomic scenarios
June 2020
 Unemployment
                               2020                                2021                               2022
 rate
                  Optimistic    Base    Pessimistic   Optimistic   Base    Pessimistic   Optimistic   Base   Pessimistic
 Belgium            5.9%        7.2%      10.0%         5.8%       7.6%         12.0%      5.6%       6.9%      9.5%
 Czech Republic     3.1%        5.2%       7.0%         3.5%       5.7%         7.1%       3.0%       4.6%      7.6%
 Hungary            4.8%        6.4%       9.0%         4.2%       5.6%         7.5%       4.0%       4.8%      5.9%
 Slovakia           8.0%        9.0%      12.0%         9.2%       10.5%        13.0%      7.7%       8.0%     14.0%
 Bulgaria           6.0%        8.0%      11.0%         4.1%       10.0%        13.0%      4.2%       7.0%     12.0%
 Ireland            8.2%       11.0%      20.0%         6.1%       7.0%         16.0%      5.1%       6.0%     10.0%

 House-price
                               2020                                2021                               2022
 index
                  Optimistic   Base     Pessimistic   Optimistic   Base    Pessimistic   Optimistic   Base   Pessimistic
Belgium             -1.0%      -3.0%      -6.0%         0.0%       -2.0%        -4.0%      1.5%       1.0%     -1.0%
Czech Republic      0.0%       -2.0%      -4.0%         -0.8%      -3.5%        -6.0%      2.0%       2.0%      0.0%
Hungary             -1.0%      -5.0%      -7.5%         0.0%       -3.0%        -5.0%      2.5%       2.0%      1.0%
Slovakia            -1.0%      -5.0%      -7.0%         0.5%       -2.0%        -3.0%      2.0%       2.0%      1.0%
Bulgaria            0.5%       -2.0%      -4.0%         1.0%       -1.0%        -3.0%      3.0%       3.0%      0.0%
Ireland             -6.0%      -12.0%     -20.0%        5.0%       8.0%         -5.0%      4.0%       5.0%      3.0%

                                                                           22
COVID-19 (6/9)
    Stress assumptions applied
                                                                                                      • As in the first quarter, our Expected Credit Loss (ECL) models were not able to
    Loan     portfolio*:                                                                                adequately reflect all the specificities of the Covid-19 crisis nor the various
                                                                                                        government measures implemented in the different countries to support
    (in billions of EUR)                                      YE19      1Q20      1H20
                                                                                                        households, SMEs and Corporates through this crisis. Therefore, an expert-based
      Portfolio outstanding                                   175       180        179
                                                                                                        calculation at portfolio level has been performed via a management overlay
           Retail                                             42%       40%        41%
                of which mortgages                            38%       37%        38%
                of which consumer finance                      3%        3%         3%                • In the first quarter, this exercise was performed for a certain number of
           SME                                                22%       21%        21%                  (sub)sectors. Driven by significant uncertainty about how the virus would spread,
           Corporate                                          37%       39%        38%                  the extent of the consequential lockdown measures and the government response
                                                                                                        to the economic instability. The significant uncertainty still exists, especially around
                                                                                                        the possibility and timing of resurgence of the virus or even a return in several
                                                                                                        waves, but the widespread extent of the economic crunch has become clearer.
                                                                                                        Therefore, the scope of the management overlay has been expanded to include
                                                                                                        all sectors of our corporate and SME portfolio as well as our retail portfolio

    Total loan portfolio by IFRS 9 ECL stage *                                                        • To be consistent with optimistic and pessimistic scenarios we applied the following
                                                                                                        stress-assumptions to the performing and non- performing portfolio by the end of
                     3.5%                3.3%                  3.4%                                     June 2020 :
    Stage 3                             10.7%
    Stage 2         11.3%                                     11.3%
                                                                                                  Existing performing        • A 3-step methodology has been applied (see next slide)
                                                                                                  portfolio                  • In line with ECB/ESMA/EBA guidance, any general government
                                                                                                                               measure has not led to an automatic staging
    Stage 1         85.2%               86.0%                 85.4%                               Existing non-              • An additional impact assessment was performed on a portfolio basis
                                                                                                  performing portfolio         for the stage 3 collective exposures based on expert judgement
                                                                                                                             • Additional impairments due to Covid-19 on individually assessed
                                                                                                                               stage 3 loans are already included in P&L impairments and thus not
                     FY19                1Q20                 1H20                                                             included in the management overlay

                                                                                                                 23
•   Aligned with the credit risk view of our loan portfolio as reported in the quarterly financial statements
COVID-19 (7/9)
  Stress methodology applied on the performing portfolio

  3-step approach to estimate additional Covid-19 impact on the performing portfolio :

                                                      Step 1: Covid-19 stress
                                                      On the performing portfolio we applied an expert-based stress migration matrix* linked to the macro
                                                      forecast for end June 2020. After doing so, a certain portion of the portfolio moved to inferior PD rating
                                                      classes or default, a certain portion remained unchanged and a minor portion improved. As such, we
                                                      obtain an estimate of the Covid-19 ECL (Expected Credit Loss) according to our base-case scenario
                      COVID-19                        (versus the normal through-the-cycle migration matrix)
                       effect
                                                      Step 2: Additional sector stress effect
                                                      The COVID-19 ECL generated by the migration matrix, was further refined by taking a sectoral stress
              Sector                                  effect into account. The purpose of this step is to reflect the fact that some sectors will be more heavily
              stress                                  affected than others, something which had not been included in the migration matrices.
                                                      All exposures in the SME and Corporate portfolio were classified as high, medium or low risk based on
              effect
                                                      the expected impact of the Covid-19 crisis on the sector affected (for Mortgages and Consumer finance,
                                                      no sectoral stress was applied). Based on this classification, the following weights have been applied to
                       Scenario                       the ECL impact: 150% for high risk sectors, 100% for medium risk sectors and 50% for low risk sectors (see
                        weight                        more details on next slide). This resulted in a sector-driven Covid-19 base-case ECL following the base-
                        effect                        case scenario

                                                      Step 3: Application of scenario weight
                                                      To define the collective Covid-19 impact, under an optimistic and pessimistic scenario, a scaling factor
                                                      was applied on the estimated sector-driven Covid-19 base-case ECL. The final overlay was determined by
                                                      weighting the Covid-19 ECL under the three scenarios with the following weights: 45% for the base-case,
                                                      15% for the optimistic and 40% for the pessimistic scenario (see more details on next slide)

* The migration matrix is defined per country and per segment                                 24
COVID-19 (8/9)
    Details of the collective Covid-19 ECL

    SME & Corporate loan portfolio* of 106bn EUR split by Covid-19 sector sensitivity:
                     Low                                                                                                                             Some details on the composition of ‘other sectors < 1%’:
                       35%                                           3.1%          Sum of other sectors < 1% (incl. Aviation sector)                 • The aviation sector was fully assigned as high risk sector,
                                                                     1.2%          Hotels, bars & restaurants                                          but with limited share of 0.3%
                                                                     1.3%          Shipping (transportation)
                                                                     1.4%          Metals                                                            • The sector of exploration and production of oil, gas &
                                                                     2.0%          Services (entertainement & leisure)                                 other fuels was fully allocated as high risk sector, but
                                           20% High                  2.9%          Commercial real-estate                                              with limited share of 0.2%
                                                                     3.5%          Automotive
                                                                                                                                                     The construction sector was defined as medium risk, due
                   45%                                                                                                                               to limited interruption, was one of the first sectors to
                                                                     4.6%          Distribution retail
                                                                                                                                                     restart and also temporary unemployment cover foreseen
            Medium                                                                                                                                   by the Belgian government
                                                                    1H20

    Sector-driven Covid-19 ECL (base-case scenario):                                                                    Collective Covid-19 ECL per country:
    KBC Group                                               Performing portfolio                                                                           Performing portfolio                   Non-
                                                                                                                                                                                                          Total
                                   High risk         Medium           Low risk Mortgages                                                      Optimistic     Base      Pessimistic Probability Performing       2Q20 1Q20
                                                                                                                                                                                                          1H20
                                    sectors        risk sectors        sectors     &        TOTAL                       EUR m                    15%         45%          40%       weigthed portfolio
    EUR m                            150%             100%              50%    other retail                             KBC Group                   484          611         870        696         93     789   746   43
    Base-case scenario                      175              244            68          124    611                      By country:
       Optimistic scenario                   146              200                52                  86           484        Belgium                285          355         478        393         20     413   378    35
       Pessimistic scenario                  248              337                96                189            870        Czech Republic         103          129         186        148         10     158   152     6
                                                                                                                             Slovakia                30           34          50         40          0      40    39     1
                                                                                                                             Hungary                 37           48          69         55          0      55    54     1
                                                                                                                             Bulgaria                 5           14          19         15         13      28    28   n/a
                                                                                                                             Ireland                 24           32          68         45         50      95   95    n/a

                                                                                                                        25
•    Aligned with the credit risk view of our loan portfolio as reported in the quarterly financial statements.
COVID-19 (9/9)
   Impact of the collective Covid-19 ECL

                         Impairment on financial assets
                                                                                             •   The 3-step stress approach to the performing portfolio and the
                              at AC and at FVOCI                                                 additional impact assessment of the non-performing portfolio
                                                                                                 resulted in a total collective Covid-19 ECL of 789m EUR in
        1Q20 78 43       121
                                                                                                 1H20, of which:
                                                                                                    •   a 43m EUR management overlay was booked in 1Q20
        2Q20     99      150                  596                845                                •   a 596m EUR management overlay was booked in 2Q20
                                                                                                    •   the ECL models captured an impact of 150m EUR in
                   177         150                   639                  966                           2Q20 through the updated macroeconomic variables
        1H20
                                                                                                        used in the calculation
                                Collective Covid-19 ECL = 789m
                                                                                             •   The total collective Covid-19 ECL of 789m EUR in 1H20 consists
       Impairments on financial assets at AC and at FVOCI without any COVID-19 impact            of 7% stage 1, 81% stage 2 and 12% stage 3 impairments
       Covid-19 impact already captured by ECL models
       Management overlay                                                                    •   Including the collective Covid-19 ECL, the Credit Cost Ratio
                                                                                                 amounted to 0.64% in 1H20

                                                                                             •   We are reiterating our estimate for FY20 impairments (on
                                                                                                 financial assets at AC and at FVOCI) at roughly 1.1bn EUR as a
  Credit Cost %                                 FY19         3M20               1H20             result of the coronavirus pandemic. Depending on a number of
                                                           (annualized)     (annualized*)
                                                                                                 events such as the length and depth of the economic downturn,
  Without collective COVID-19 ECL               0.12%        0.17%              0.20%            the significant number of government measures in each of our
  With collective COVID-19 ECL                               0.27%              0.64%            core countries, and the unknown number of customers who will
                                                                                                 call upon these mitigating actions, we estimate the FY20
 * No annualisation of the Collective Covid-19 ECL                                               impairments to range between roughly 0.8bn EUR (optimistic
                                                                                                 scenario) and roughly 1.6bn EUR (pessimistic scenario)

Amounts in m EUR                                                                            26
KBC Group

Section 3

2Q 2020 performance of business units

                27
Business profile

                                       BELGIUM    CZECH                                                 GROUP
                                                             SLOVAKIA    HUNGARY   BULGARIA   IRELAND
                                                 REPUBLIC                                               CENTRE

2Q20 NET RESULT (in million euros)       204m      77m           -6m       16m        14m       -70m      -26m

ALLOCATED CAPITAL (in billion euros)     6.9bn     1.7bn         0.6bn     0.8bn      0.4bn    0.6bn    0.2bn

LOANS (in billion euros)                 104bn     29bn          8bn       5bn        3bn       10bn

DEPOSITS (in billion euros)              137bn     40bn          7bn       8bn        5bn        5bn

BRANCHES (end 2Q20)                      514       221           117       208        177        16

Clients (end 2Q20)                       3.6m      4.2m          0.6m      1.6m       1.4m      0.3m

                                                            28
Belgium BU (1): net result of 204m EUR

                                    NET RESULT                                                            Net result at the Belgium Business Unit amounted
                                                                                                          to 204m EUR
                                                 412
                           388
                                     368                                                                      • The quarter under review was characterised by slightly
                                                                                                                lower net interest income (fully due to the 12m EUR
                                                                                                                positive one-off in 1Q20), lower net fee and
                                                                         204
                                                                                                                commission income, higher dividend income, sharply
            176                                                                                                 higher trading and fair value income, higher net other
                                                                                                                income, an excellent combined ratio, lower operating
                                                                                                                expenses (due largely to lower bank taxes and lower
                                                                                                                staff expenses) and sharply higher impairment charges
                                                                                                                q-o-q
                                                                                                              • Customer deposits excluding debt certificates and
                                                               -86                                              repos rose by 11% y-o-y, while customer loans
            1Q19        2Q19        3Q19        4Q19          1Q20      2Q20                                    increased by 3% y-o-y
        Amounts in m EUR

   ORGANIC VOLUME TREND                         Total loans**              o/w retail mortgages              Customer deposits***                   AuM             Life reserves
   Volume                                              104bn                         37bn                              137bn                       185bn                 26bn
   Growth q-o-q*                                        -1%                           +1%                                -1%                        +4%                  +2%
   Growth y-o-y                                        +3%                            +3%                                +7%                        -5%                   -3%
* Non-annualised ** Loans to customers, excluding reverse repos (and bonds). Growth figures are excluding FX, consolidation adjustments, reclassifications and collective Covid-19 ECL
*** Customer deposits, including debt certificates but excluding repos. Customer deposit volumes excluding debt certificates & repos +5% q-o-q and +11% y-o-y

                                                                                             29
Belgium BU (2): lower NII and NIM
                                                                                 Amounts in m EUR
                                                NII
                625          621         637          634          640           635                       ▪ Net interest income (635m EUR)
                 7           10          13            7
                                                      101
                                                                    9
                                                                   99
                                                                                  5
                                                                                  94
                                                                                                             • Excluding the 12m EUR positive one-off in 1Q20, NII rose by 1%
                106          101         105
                                                                                                               q-o-q due mainly to:
                                                                                                               o higher margins on new loan production than on outstanding
                                                                                                                  portfolio in all segments
                                         519          526          532           536
                                                                                                               o higher NII due to larger bond portfolio
                511          510
                                                                                                               o slightly lower funding cost
                                                                                                               partly offset by:
                                                                                                               o lower reinvestment yields
               1Q19          2Q19       3Q19          4Q19        1Q20          2Q20                           o lower NII insurance
    NII - netted positive impact of ALM FX swaps*      NII - contribution of banking                           o lower netted positive impact of FX swaps
    NII - contribution of insurance                                                                          • Rose by 2% y-o-y

* From all ALM FX swap desks
** NIM is calculated excluding the dealing room and the net positive impact of ALM FX swaps & repos          • Note that NII banking rose by 1% q-o-q and by 5% y-o-y

                                            NIM**
                                                                                                           ▪ Net interest margin (1.63%)
              1.71%                     1.68%         1.68%       1.68%
                            1.67%                                               1.63%                        • Fell by 5 bps q-o-q and 4 bps y-o-y due chiefly to the negative
                                                                                                               impact of lower reinvestment yields and an increase of the
                                                                                                               interest-bearing assets (denominator). Also note that the NIM in
                                                                                                               1Q20 was positively impacted by the +12m EUR one-off item
                                                                                                               (which explains -3 bps of the -5 bps q-o-q)

               1Q19          2Q19        3Q19         4Q19         1Q20          2Q20

                                                                                                      30
Credit margins in Belgium
                                      PRODUCT SPREAD ON CUSTOMER LOAN BOOK, OUTSTANDING
1.3
1.2
1.1
1.0
0.9
0.8
0.7
0.6
0.5
0.4
0.3
0.2
0.1
0.0
   1Q15   2Q15   3Q15   4Q15   1Q16    2Q16   3Q16    4Q16   1Q17   2Q17   3Q17    4Q17   1Q18   2Q18   3Q18   4Q18   1Q19   2Q19   3Q19   4Q19   1Q20   2Q20

                                                                Customer loans

                                                     PRODUCT SPREAD ON NEW PRODUCTION
1.5
1.4
1.3
1.2
1.1
1.0
0.9
0.8
0.7
0.6
0.5
0.4
0.3
0.2
0.1
   1Q15   2Q15   3Q15   4Q15   1Q16    2Q16   3Q16    4Q16   1Q17   2Q17   3Q17    4Q17   1Q18   2Q18   3Q18   4Q18   1Q19   2Q19   3Q19   4Q19   1Q20   2Q20

                                              SME and corporate loans              Mortgage loans

                                                                                  31
Belgium BU (3): lower net F&C income
                                                        Amounts in m EUR
                               F&C
                                                                                ▪ Net fee and commission income (271m EUR)
 286         293         297         307        308                               • Decreased by 12% q-o-q due mainly to:
                                                             271
                                                                                    o lower entry and management fees from mutual funds
                                                                                      and unit-linked life insurance products
                                                                                    o lower fees from payment services (linked to Covid-19)
 342         343         353         366        354
                                                             321
                                                                                    o lower network income
                                                                                    partly offset by:
                                                                                    o higher fees from credit files & bank guarantees
                                                                                    o higher securities-related fees
 -56         -51         -56         -58         -46         -50

 1Q19       2Q19        3Q19         4Q19       1Q20        2Q20                  • Fell by 7% y-o-y driven chiefly by lower entry &
                                                                                    management fees and higher distribution costs, partly
  F&C - contribution of insurance     F&C - contribution of banking                 offset by higher securities-related fees and to a lesser
                                                                                    extent higher network income, higher fees from
                                                                                    payment services and higher fees from credit files &
                                                                                    bank guarantees
                               AuM                     Amounts in bn EUR

 195        195          197         200
                                                 178
                                                             185                ▪ Assets under management (185bn EUR)
                                                                                  • Increased by 4% q-o-q due to a positive price effect
                                                                                    (+5%), partly offset by net outflows (-1%)
                                                                                  • Decreased by 5% y-o-y as a result of net outflows (-4%)
                                                                                    and a negative price effect (-1%)

1Q19        2Q19        3Q19         4Q19       1Q20         2Q20

                                                                           32
Belgium BU (4): higher y-o-y non-life sales,
excellent combined ratio
                                                                   Amounts in m EUR

NON-LIFE SALES (GROSS WRITTEN PREMIUM)
 340
                                                            359                            ▪ Sales of non-life insurance products
                                                                                             • Increased by 1% y-o-y
                  273                                                     276
                                263
                                                 247                                         • Premium growth mainly in classes ‘Fire’ and ‘Motor
                                                                                               comprehensive cover’, partly offset by the negative
                                                                                               impact of Covid-19 on ‘Workmen’s compensation’

1Q19              2Q19          3Q19         4Q19           1Q20          2Q20

                                                                                           ▪ Combined ratio amounted to an excellent 85% in
             COMBINED RATIO (NON-LIFE)                                                       1H20 (89% in FY19). This is the result of 3% y-o-y
93%         95%
                                                                                             premium growth combined with 16% y-o-y lower
                         92%                 91%
                                    85%                            89%                       technical charges in 1H20. The latter was due mainly
                                                                                             to lower normal claims in 1H20 (especially in Motor
                                                                                             due to Covid-19) and a negative one-off in 1H19
                                                                                             (-16m due to reassessment on claims provisions).
                                                                                             However, note that 1H20 was impacted by a negative
                                                                                             ceded reinsurance result (compared with a positive
                                                                                             ceded reinsurance result in 1H19)
       1Q                      1H                      9M                FY

                           2019           2020
                                                                                      33
Belgium BU (5): higher life sales, good cross-selling ratios
                                                                           Amounts in m EUR
                                     LIFE SALES
                                                                                 488                  ▪ Sales of life insurance products
              423                                                                                       • Rose by 44% q-o-q driven entirely by higher sales of
                          362                       380
                                                                                 206                      unit-linked products due to the launch of new
                                                                   339
                                       319                                                                products
              267
                          230                       282
                                                                                                        • Increased by 35% y-o-y driven entirely by higher sales
                                                                   215
                                       214                                                                of unit-linked products, only partly offset by lower
                                                                                 282                      sales of guaranteed interest products (fully due to the
              157
                                                                                                          suspension of universal single life insurance products)
                          132          105                         124
                                                     98
                                                                                                        • Guaranteed interest products and unit-linked
              1Q19       2Q19         3Q19          4Q19          1Q20           2Q20                     products accounted for 42% and 58%, respectively, of
                                                                                                          life insurance sales in 2Q20
                     Guaranteed interest products         Unit-linked products

              MORTGAGE-RELATED CROSS-SELLING RATIOS
90                                                                                            90.9%   ▪ Mortgage-related cross-selling ratios
85                                                                                                      • 90.9% for property insurance
                                                                                              82.2%
80                                                                                                      • 82.2% for life insurance
75
70
65
60   63.7%
                                     Property insurance                  Life insurance
55
50
45    49.5%
40

                                                                                                34
Belgium BU (6): sharply higher FIFV and higher net other
income
                                                                   Amounts in m EUR
                                     FIFV                               149                      ▪ The q-o-q strong rebound in net gains from
                                                                         49                        financial instruments at fair value was due to:
                                                  89
        54
                                                   46                    74
                                                                                                   • a positive change in market, credit and funding
                     43
        48
                              17
                                           6       22                                                value adjustments (mainly as a result of changes in
       30                8                 18       24                      30                       the underlying market value of the derivatives
                    19                           -3          1         -4
       -23                         -18
               -1             -2
                                    -9
                                           -15                                                       portfolio due to increasing equity markets and
                                                           -113                                      decreasing counterparty credit spreads & KBC
                                                                                                     funding spread, despite lower long-term interest
                                                            -26                                      rates)
                                                            -78                                    • a higher net result on equity instruments
                                                                                                     (insurance)
                                                           -217
       1Q19         2Q19           3Q19          4Q19      1Q20         2Q20                       • higher dealing room income
                                                                                                   • a positive change in ALM derivatives
Dealing room & other income          M2M ALM derivatives
MVA/CVA/FVA                          Net result on equity instruments (overlay insurance)

                          NET OTHER INCOME
                                                                                                 ▪ Net other income amounted to 45m EUR in
          45
                         50          51
                                                                            45
                                                                                                   2Q20
                                                   41
                                                             35

        1Q19         2Q19           3Q19          4Q19      1Q20        2Q20

                                                                                            35
Belgium BU (7): lower opex and higher impairments
                                                                     Amounts in m EUR
                                                                                             ▪ Operating expenses: -37% q-o-q and -10% y-o-y
                         OPERATING EXPENSES                                                    • Operating expenses without bank taxes decreased by 4% q-o-q
                                                                                                 and by 9% y-o-y due chiefly to
      807                                                     828
                                                                                                 o lower staff expenses (partly due to reduced variable
      273                                                     289                                   remuneration and less FTEs)
                    575
                     4               552           550                    521                    o lower marketing, ICT, travel and event costs
                                                                           2                     partly offset by:
                                                                                                 o higher professional fees (only q-o-q, as it was stable y-o-y)
      534           572                                       539         519                  • Note that 2Q19 was impacted by a 6m EUR negative one-off as
                                                                                                 a result of a management reorganisation
                                                                                               • Adjusted for specific items, the C/I ratio amounted to 51% in
    1Q2019          2Q19            3Q19          4Q19       1Q20        2Q20
                                                                                                 2Q20 and 58% YTD (60% in FY19)
                                                                                               • Cost/income ratio: 44% in 2Q20 and 66% YTD, both distorted
                              Bank tax        Operating expenses
                                                                                                 by bank taxes and the latter by sharply lower FIFV in 1Q20
                                                                                             ▪ Loan loss impairments increased to 458m EUR in 2Q20
                          ASSET IMPAIRMENT                                                     (compared with 116m EUR in 1Q20), largely due to 329m
                                                                          469                  EUR impairments from Covid-19 management overlay
                                                                          11
                                                                                               (compared with 35m EUR in 1Q20) and 49m EUR
                                                                                               impairments captured by the ECL models through the
                                                                          378                  updated macroeconomic variables. Furthermore, both
                                                   109        117
                                                                 0
                                                                                               1Q20 and 2Q20 were impacted by several corporate
       83
       1
                                                    2
                                                             35                                files. Credit cost ratio amounted to 27 bps (22 bps in
                     31                            107                                         FY19) without collective Covid-19 ECL and 63 bps with
       82                                                     81          80
                    30
                          1              21                                                    collective Covid-19 ECL in 1H20
      1Q19          2Q19             3Q19         4Q19       1Q20        2Q20                ▪ Impaired loans ratio amounted to 2.4%, 1.2% of which
Other impairments                   Impairments on financial assets at AC and FVOCI            over 90 days past due
Collective Covid-19 ECL
                                                                                             ▪ Impairment of 11m EUR on ‘other’ (IFRS modification
                                                                                        36
                                                                                               loss from the time value of payment deferral)
Net result at the Belgium BU

                                                                                     CONTRIBUTION OF BANKING ACTIVITIES TO
                                                                                        NET RESULT OF THE BELGIUM BU*
                                                                                                289          287             301

         NET RESULT AT THE BELGIUM BU*
                                                                                    102
                                    412                                                                                                                68
               388       368

                                                          204                                                                            -55
   176
                                                                                    1Q19       2Q19          3Q19        4Q19           1Q20         2Q20

                                                                                    CONTRIBUTION OF INSURANCE ACTIVITIES TO
                                                                                        NET RESULT OF THE BELGIUM BU*
                                                                                                                                                      136
                                               -86                                                                           111
                                                                                                              81
  1Q19        2Q19      3Q19       4Q19       1Q20       2Q20                                    99                                                   80
                                                                                                                             70
   Amounts in m EUR                                                                  74          37           47
                                                                                     21
                                                                                                 69           68             65                       74
                                                                                     55
* Difference between net profit at the Belgium Business Unit and the sum of                                                                     4
                                                                                     -2          -7
                                                                                                                             -25                      -17
  the banking and insurance contribution is accounted for by the rounding up                                 -34                         -32
  or down of figures                                                                                                                      -3
                                                                                                                                         -30
                                                                                    1Q19       2Q19          3Q19        4Q19           1Q20         2Q20

                                                                                           Non-Life result     Life result         Non-technical & taxes
                                                                               37
Czech Republic BU
                                                                        Amounts in m EUR               Net result of 77m EUR in 2Q20
                                    NET RESULT
                          248                                                                          ▪ -7% q-o-q excluding FX effect due mainly to sharply higher
                          82
                                                     205                                                 Covid-19 related impairments and lower net interest
             177
                                      159                                                                income, largely offset by sharply higher net results from
                                                                                                         financial instruments at fair value and lower costs
                          166
                                                                 88             77                     ▪ Customer deposits (including debt certificates, but
                                                                                                         excluding repos) rose by 8% y-o-y, while customer loans
                                                                                                         rose by 6% y-o-y
             1Q19        2Q19         3Q19          4Q19        1Q20           2Q20

                                    One-off gain ČMSS
                                                                                                       Highlights
                                      NII & NIM                         Amounts in m EUR
                                                                                                       ▪ Net interest income
                                                                 351
                                                                                                           • -29% q-o-q and -19% y-o-y (both excl. FX effect)
                                                    338
            302          308
                                      329
                                                                                                           • Q-o-q decrease primarily due to the CNB rate cuts (from 2.25%
           3.25%        3.18%
                                     2.93%          2.90%       2.98%                                        early February to 0.25% early May 2020), the depreciation of the
                                                                                235                          CZK versus the EUR and lower netted positive impact of ALM FX
                                                                               2.32%
                                                                                                             swap
                                                                                                           • Y-o-y decrease is less severe primarily due to the full consolidation
                                                                                                             of ČMSS and good growth in loan volume
                                                                                                       ▪ Net interest margin
            1Q19        2Q19         3Q19           4Q19        1Q20           2Q20                        • Fell by 66 bps q-o-q due mainly to the several repo rate cuts in
                                    NIM       NII
                                                                                                             March and May, a positive technical item in 1Q20 and an increase
                                                                                                             of the interest-bearing assets (denominator)
    ORGANIC VOLUME TREND                                  Total loans **               o/w retail mortgages       Customer deposits***                   AuM               Life reserves
    Volume                                                    29bn                            15bn                           40bn                       10.8bn                  1.3bn
    Growth q-o-q*                                              0%                             +2%                             +3%                        +8%                     +2%
    Growth y-o-y                                              +6%                             +6%                             +8%                        +2%                     -4%
* Non-annualised ** Loans to customers, excluding reverse repos (and bonds). Growth figures are excluding FX, consolidation adjustments, reclassifications and collective Covid-19 ECL
*** Customer deposits, including debt certificates but excluding repos.                      38
Czech Republic BU
                                                                               ▪ Net F&C income
                           F&C                                                   • -2% q-o-q and -19% y-o-y (both excl. FX effect)
                                                       Amounts in m EUR          • Q-o-q decrease driven mainly by lower fees from payment
                67        70                                                       services (mainly linked to Covid-19), lower network income,
       58                              59                                          lower credit-related fees and lower entry fees for asset
                                                55                                 management
                                                              51

                                                                               ▪ Assets under management
                                                                                 • 10.8bn EUR
                                                                                 • +8% q-o-q due entirely to a positive price & FX effect
                                                                                 • +2% y-o-y due to net inflows (+5%), partly offset by a negative
   1Q19        2Q19      3Q19         4Q19     1Q20         2Q20                   price & FX effect (-3%)
                                                                               ▪ Trading and fair value income
                                                                                 • 215m EUR higher q-o-q net results from financial instruments at
                                                                                   fair value (FIFV) to 90m EUR due mainly to higher dealing room
                                                                                   results and a positive q-o-q change in market, credit and funding
                                                                                   value adjustments
                    CROSS-SELLING RATIOS                                       ▪ Insurance
Mortg. & prop.         Mortg. & life risk    Cons.fin. & life risk               • Insurance premium income (gross earned premium): 116m EUR
                                                                                   o Non-life premium income (72m EUR) +10% y-o-y excluding FX
                                                                                      effect, due to growth in all products (except ‘travel’ due to
                                                                                      Covid-19)
              61%
59%     60%
                        48%     49%   48%       54%     54%    50%                 o Life premium income (44m EUR) -10% q-o-q and -23% y-o-y,
                                                                                      excluding FX effect. Q-o-q and y-o-y decrease mainly in single
2018    2019 1H20       2018    2019 1H20       2018    2019 1H20
                                                                                      life insurance products
                                                                                 • Combined ratio of 86% in 1H20 (94% in FY19)

                                                                          39
Czech Republic BU
                                                                                               ▪ Operating expenses
                    OPERATING EXPENSES                                 Amounts in m EUR
                                                                                                 • 164m EUR; -4% q-o-q and -3% y-o-y, both excluding FX
                                                           221                                     effect and bank taxes
     204                                        200
     35
                 179               187                         41                                  o Q-o-q decrease was due mainly to lower staff and
                  1                                                           164                     marketing expenses
                                                                                                   o Y-o-y decrease was chiefly the result of lower staff
                                                                                                      expenses and lower marketing, travel & event costs,
                178                                        181
    169                                                                                               despite the full consolidation of ČMSS (11m EUR in 2Q20)
                                                                                                 • Adjusted for specific items, C/I ratio amounted to roughly
                                                                                                   40% in 2Q20 and 48% YTD (47% in FY19)
    1Q19        2Q19               3Q19        4Q19        1Q20              2Q20                • Cost/income ratio at 38% in 2Q20 and 51% YTD, both
                                                                                                   distorted by bank taxes and the latter by sharply lower FIFV
                        Bank tax          Operating expenses
                                                                                                   in 1Q20

                        ASSET IMPAIRMENT                            Amounts in m EUR
                                                                                               ▪ Loan loss and other impairment
                                                                                                 • Loan loss impairments increased q-o-q due mainly to:
                                                                              175
                                                                               5
                                                                                                   o 152m EUR collective Covid-19 ECL, of which 135m EUR
                                                                                                      management overlay (compared with 6m EUR in 1Q20)
                                                                              152
                                                                                                      and 17m EUR impairments captured by the ECL models
                                                                                                      through the updated macroeconomic variables
                                                                                                   o 18m EUR ‘impairments on financial asset at AC’, due
                                    9                          9                                      mainly to a few corporate files
                    7
                                                                              18
                        3
                                                   3       1
                                                                   6
                                                                                                 • Credit cost ratio amounted to 0.10% (0.04% in FY19)
    -2 0
                4
                                               1       1   2                                       without collective Covid-19 ECL and 0.62% with collective
      -1                                                                                           Covid-19 ECL in 1H20
    1Q19        2Q19               3Q19        4Q19        1Q20              2Q20
                                                                                                 • Impaired loans ratio amounted to 2.2%, 1.2% of which over
Other impairments                  Impairments on financial assets at AC and FVOCI                 90 days past due
Collective Covid-19 ECL
                                                                                                 • Impairment of 5m EUR on ‘other’ (IFRS modification loss
                                                                                          40       from the time value of payment deferral)
International Markets BU
                                                        Amounts in m EUR                             Net result of -45m EUR was negatively impacted by 215m
                             NET RESULT                                                              EUR collective Covid-19 ECL
                                           119
                   104
                   29          85
                                           27
                                            2
                                                                                                     ▪ Slovakia -6m EUR, Hungary 16m EUR, Ireland -70m EUR
       70
       13           9          23
                                           50
                                                                                                       and Bulgaria 14m EUR
                               4
       14                                               35
                   55          45
       25                                               10
                                           38           12           14
       18                                                10          16
                   11          12
                                                       4                                             Highlights (q-o-q results)
                                                                                                     ▪ Stable net interest income. NIM 2.58% in 2Q20 (-3 bps q-o-q and
                                                                     -70
                                                                                                       -7 bps y-o-y)
                                                                       -6                            ▪ Lower net fee and commission income
                                                                      -45                            ▪ Higher result from financial instruments at fair value
      1Q19        2Q19        3Q19        4Q19        1Q20           2Q20
                                                                                                     ▪ An excellent combined ratio of 78% in 1H20
                Bulgaria      Ireland      Hungary        Slovakia                                   ▪ Lower non-life & life insurance sales
                                                                                                     ▪ Lower costs
                                                                                                     ▪ Sharply higher loan loss impairment charges in 2Q20, due
                                                                                                       almost entirely to 215m EUR collective Covid-19 ECL (of which
                                                                                                       39m in Slovakia, 54m in Hungary, 28m in Bulgaria and 95m in
                                                                                                       Ireland)

ORGANIC VOLUME TREND                                 Total loans **            o/w retail mortgages             Customer deposits***                    AuM             Life reserves
Volume                                                   25bn                            16bn                              24bn                        5.4bn                0.7bn
Growth q-o-q*                                             +1%                             +1%                               +4%                         +9%                  +4%
Growth y-o-y                                              +7%                             +5%                               +9%                        +16%                   -5%

* Non-annualised ** Loans to customers, excluding reverse repos (and bonds). Growth figures are excluding FX, consolidation adjustments, reclassifications and collective Covid-19 ECL
*** Customer deposits, including debt certificates but excluding repos.
                                                                                          41
International Markets BU - Slovakia
                                                                                                    Net result of -6m EUR
                                   NET RESULT                        Amounts in m EUR
                                                   38
                                                                                                    Highlights (q-o-q results)
                                                                                                    ▪ Lower net interest income as volume growth was offset by the
                                                                                                      negative impact of lower reinvestment yields and pressure on
               18                                                                                     loan margins on the outstanding portfolio (except for SMEs)
                           11           12                                                          ▪ Roughly stable net fee & commission income
                                                                                                    ▪ Higher result from financial instruments at fair value
                                                               4
                                                                                                    ▪ Lower net other income
                                                                                                    ▪ Excellent combined ratio (81% in 1H20)
                                                                           -6                       ▪ Lower non-life and life insurance sales
              1Q19        2Q19        3Q19        4Q19        1Q20        2Q20                      ▪ Lower operating expenses due mainly to lower bank taxes,
                                                                                                      lower staff expenses and lower ICT & marketing costs
                                                                                                    ▪ Sharply higher loan loss impairment charges in 2Q20, due
                                                                                                      almost entirely to 39m EUR collective Covid-19 ECL, of which
                                                                                                      33m EUR management overlay (compared with 1m in 1Q20)
                                                                                                      and 6m EUR impairments captured by the ECL models through
   ORGANIC                        Total        o/w retail             Customer                        the updated macroeconomic variables. Credit cost ratio of
   VOLUME TREND                 loans **       mortgages             deposits***                      0.19% (0.14% in FY19) without collective Covid-19 ECL and
   Volume                         8bn              4bn                    7bn                         0.66% with collective Covid-19 ECL in 1H20

   Growth q-o-q*                 +2%               +4%                    +4%
   Growth y-o-y                  +6%              +11%                    +5%
                                                                                                    Volume trend
                                                                                                    ▪ Total customer loans rose by 2% q-o-q and by 6% y-o-y, the
• Non-annualised                                                                                      latter due mainly to the increasing mortgage portfolio
** Loans to customers, excluding reverse repos (and bonds). Growth figures are excluding FX,        ▪ Total customer deposits increased by 4% q-o-q and by 5% y-o-y
consolidation adjustments, reclassifications and collective Covid-19 ECL
                                                                                                      (both due mainly to retail deposits)
*** Customer deposits, including debt certificates but excluding repos.
                                                                                               42
International Markets BU - Hungary
                                                                                                    Net result of 16m EUR

                                 NET RESULT                    Amounts in m EUR
                                                                                                    Highlights (q-o-q results)
                          55
                                                  50
                                                                                                    ▪ Higher net interest income excluding FX effect due chiefly to
                                      45                                                              loan volume growth and the positive reinvestment impact of
                                                                                                      the higher short-term yields
                                                                                                    ▪ Lower net fee and commission income excluding FX effect due
              25                                                                                      mainly to Covid-19
                                                                          16                        ▪ Higher net results from financial instruments at fair value
                                                              10                                    ▪ Excellent combined ratio (80% in 1H20)
                                                                                                    ▪ Lower operating expenses excluding FX effect due largely to
            1Q19        2Q19        3Q19        4Q19         1Q20       2Q20                          lower bank taxes and lower staff expenses, partly offset by
                                                                                                      higher ICT costs
                                                                                                    ▪ Sharply higher loan loss impairment charges in 2Q20, due
                                                                                                      almost entirely to 54m EUR collective Covid-19 ECL, of which
                                                                                                      41m EUR management overlay (compared with 1m EUR in
                                                                                                      1Q20) and 13m EUR impairments captured by the ECL models
                                                                                                      through the updated macroeconomic variables. Credit cost ratio
    ORGANIC                      Total          o/w retail           Customer                         of -0.04% (-0.02% in FY19) without collective Covid-19 ECL and
    VOLUME TREND               loans **         mortgages           deposits***                       0.96% with collective Covid-19 ECL in 1H20
                                                                                                    ▪ 6m EUR reversal of impairment on ‘other’ (7m EUR less IFRS
    Volume                        5bn                  2bn               8bn
                                                                                                      modification losses on the assumption that 40% of the
    Growth q-o-q*                 +2%                  +3%               +7%                          customers will opt out of the mandatory payment moratorium)
    Growth y-o-y                 +14%                  +5%              +20%
                                                                                                    Volume trend
• Non-annualised                                                                                    ▪ Total customer loans rose by 2% q-o-q and by 14% y-o-y, the
** Loans to customers, excluding reverse repos (and bonds). Growth figures are excluding FX,
consolidation adjustments, reclassifications and collective Covid-19 ECL                              latter due mainly to corporate and consumer finance loans
*** Customer deposits, including debt certificates but excluding repos.                             ▪ Total customer deposits rose by +7% q-o-q and +20% y-o-y
                                                                                               43
International Markets BU - Bulgaria
                                                                                                    Net result of 14m EUR
                                 NET RESULT                        Amounts in m EUR

                          29
                                                  27
                                                                                                    Highlights (q-o-q results)
                                      23                                                            ▪ Higher total income due mainly to higher non-life insurance
                                                                                                      result (including ceded reinsurance result) driven by covid-19,
                                                                                                      higher life insurance result and higher net other income
              13                                                           14
                                                              10                                    ▪ Excellent combined ratio at 76% in 1H20
                                                                                                    ▪ Lower operating expenses due chiefly to lower bank taxes, lower
                                                                                                      staff and ICT costs
            1Q19        2Q19        3Q19        4Q19         1Q20         2Q20                      ▪ Sharply higher loan loss impairment charges in 2Q20, due
                                                                                                      entirely to 28m EUR collective Covid-19 ECL, of which 23m EUR
                                                                                                      management overlay and 5m EUR impairments captured by the
                                                                                                      ECL models through the updated macroeconomic variables.
                                                                                                      Credit cost ratio of -0.11% (0.14% in FY19) without collective
                                                                                                      Covid-19 ECL and 0.66% with collective Covid-19 ECL in 1H20

   ORGANIC                       Total         o/w retail              Customer
   VOLUME TREND                loans **        mortgages              deposits***
                                                                                                    Volume trend:
                                                                                                    ▪ Total customer loans +4% q-o-q and +14% y-o-y, the latter
   Volume                        3bn                   1bn                 5bn                        mainly due to corporates, SMEs and retail mortgages
   Growth q-o-q*                 +4%                +4%                    +3%                      ▪ Total customer loans: new bank portfolio +4% q-o-q and +15%
                                                                                                      y-o-y, while legacy -1% q-o-q and -22% y-o-y
   Growth y-o-y                 +14%               +11%                    +8%
                                                                                                    ▪ Total customer deposits increased by 3% q-o-q and by 8% y-o-y
• Non-annualised
                                                                                                      (the latter due mainly to retail & SMEs)
** Loans to customers, excluding reverse repos (and bonds). Growth figures are excluding FX,
consolidation adjustments, reclassifications and collective Covid-19 ECL
*** Customer deposits, including debt certificates but excluding repos.
                                                                                               44
International Markets BU - Ireland
                                                                                                    Net result of -70m EUR

              14
                                  NET RESULT                       Amounts in m EUR
                                                              12                                    Highlights (q-o-q results)
                          9                                                                         ▪ Lower net interest income due mainly to the maturity of high
                                       4                                                              yield sovereign bonds and pressure on the mortgage margin,
                                                  2
                                                                                                      despite lower funding costs
                                                                                                    ▪ Lower net results from financial instruments at fair value
                                                                                                    ▪ Lower expenses due to lower bank taxes, lower staff expenses,
                                                                                                      lower professional fees and lower marketing costs
                                                                                                    ▪ Sharply higher loan loss impairment charges in 2Q20, due
                                                                          -70                         almost entirely to 95m EUR collective Covid-19 ECL, of which
            1Q19        2Q19        3Q19        4Q19        1Q20         2Q20
                                                                                                      35m EUR management overlay and 60m EUR impairments
                                                                                                      captured by the ECL models through the updated
                                                                                                      macroeconomic variables. Credit cost ratio of 0.00% (-0.32% in
                                                                                                      FY19) without collective Covid-19 ECL and 0.94% with collective
                                                                                                      Covid-19 ECL in 1H20

   ORGANIC                       Total         o/w retail             Customer
   VOLUME TREND                loans **        mortgages             deposits***                    Volume trend
                                                                                                    ▪ Total customer loans rose by 2% y-o-y driven by new
   Volume                       10bn               10bn                    5bn
                                                                                                      production of fixed rate mortgages
   Growth q-o-q*                 0%                   0%                  +2%                       ▪ Total customer deposits increased by 2% q-o-q and by 1% y-o-y
   Growth y-o-y                  +2%                  +2%                 +1%                         as the increase in retail deposits more than offset the
                                                                                                      deliberate decrease in expensive corporate deposit
• Non-annualised
** Loans to customers, excluding reverse repos (and bonds). Growth figures are excluding FX,
consolidation adjustments, reclassifications and collective Covid-19 ECL
*** Customer deposits, including debt certificates but excluding repos.                        45
You can also read