2019 Management Report - First Half REPSOL Group
←
→
Page content transcription
If your browser does not render page correctly, please read the page content below
REPSOL Group                       2019 Management Report
                                          First Half

Translation of a report originally
issued in Spanish.
In the event of a discrepancy,
the Spanish language version
prevails
ABOUT THIS REPORT

  The Repsol1 Group’s Interim Management Report must be read together with the 2018 Consolidated Management
  Report.2 In conjunction with this report, Repsol publishes condensed interim consolidated financial statements3 for
  the first half of 2019 (hereinafter, “interim financial statements of the first half of 2019”). The Board of Directors of
  Repsol, S.A., at its meeting of July 23, 2019, has approved both reports.

  The financial information contained in this document, unless otherwise indicated, has been produced in line with
  the Group’s reporting model set out in Note 5 “Segment reporting” of the consolidated financial statements for
  2018. Some of the financial indicators and ratios are classified as Alternative Performance Measures (APMs) in
  accordance with European Securities Markets Authority (ESMA) guidelines. Appendix II, “Alternative Performance
  Measures,” sets out the reconciliation of the adjusted figures to IFRS‐EU figures, also available on www.repsol.com.

  The non‐financial information corresponding to sustainability indicators contained in this document was calculated
  according to corporate rules that specify the criteria and common methods to be applied to each topic.

  The forward‐looking information contained in the sections of this document reflects the plans, forecasts or estimates
  of the Group’s managers at the date of preparation. These are based on assumptions that are considered
  reasonable, but such forward‐looking information should not be interpreted as an assurance of the entity’s future
  performance. Such plans, forecasts or estimates are subject to risks and uncertainties that imply that the Group’s
  future performance may not necessarily conform to forecasts.

  MISSION, VISION AND PRINCIPLES:

  The Group’s principles “Value Creation, Respect, Efficiency and Anticipation” supplement the Company’s values of
  “Integrity, Responsibility, Flexibility, Transparency and Innovation” set out in the Code of Ethics and Conduct. All
  of this is intended to fulfill the Company’s Mission and make its Vision an achievable challenge.

  Repsol’s mission (its reason for being) is to be an energy company that is committed to a sustainable world.

  Repsol’s vision (where it is going) is to be a global energy company that uses innovation, efficiency and respect to
  create sustainable value for the community.

  Additional information is available at https://www.repsol.com.

1
  In this report, the names "Repsol," "the Repsol Group" or "the Company" are used interchangeably to refer to the company group consisting of
Repsol, S.A. and its subsidiaries, associates and joint arrangements.
2
  This Interim Management Report has been prepared solely for the purpose of updating the consolidated Management Report for 2018.
3
  The interim financial statements of the first half of the year have been subject to a limited independent review by the Group’s auditor.

                                                                      2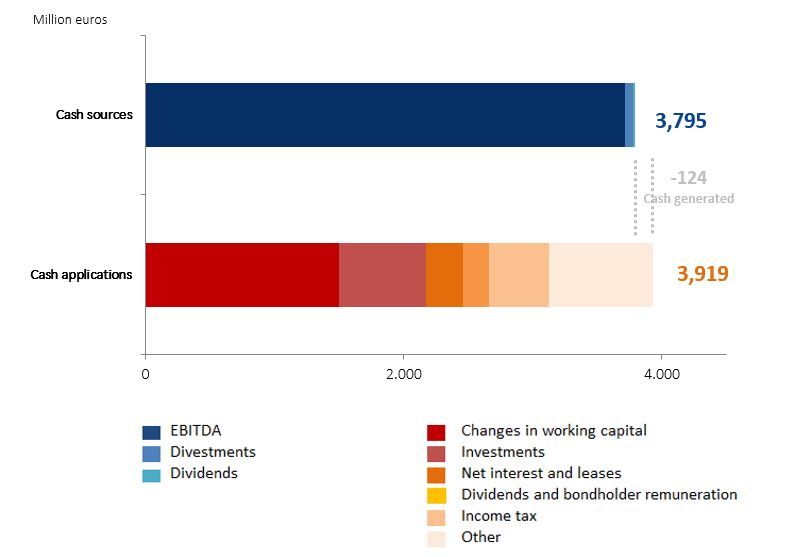
Translation of a report originally issued in Spanish
                                                               In the event of a discrepancy, the Spanish language version prevails

                                                                                CONTENTS

1.      SUMMARY OF MAIN EVENTS .................................................................................................................................... 4
2.      CORPORATE GOVERNANCE....................................................................................................................................... 7
3.      ENVIRONMENT ......................................................................................................................................................... 8

     3.1          MACROECONOMIC ENVIRONMENT ................................................................................................................................ 8

     3.2          ENERGY LANDSCAPE ........................................................................................................................................................ 8

4.      FINANCIAL PERFORMANCE AND SHAREHOLDER REMUNERATION ........................................................................ 10

     4.1          INCOME ......................................................................................................................................................................... 10

     4.2          CASH FLOW .................................................................................................................................................................... 13

     4.3          FINANCIAL POSITION ..................................................................................................................................................... 14

     4.4          SHAREHOLDER REMUNERATION ................................................................................................................................... 16

5.      OUR BUSINESS PERFORMANCE .............................................................................................................................. 18

     5.1          UPSTREAM ..................................................................................................................................................................... 18

     5.2          DOWNSTREAM .............................................................................................................................................................. 21

6.      SUSTAINABILITY ...................................................................................................................................................... 23

APPENDICES

APPENDIX I: RISKS ............................................................................................................................................................ 25
APPENDIX II: ALTERNATIVE PERFORMANCE MEASURES ................................................................................................. 26
APPENDIX III: TABLE OF CONVERSIONS AND ABBREVIATIONS ........................................................................................ 35

                                                                                               3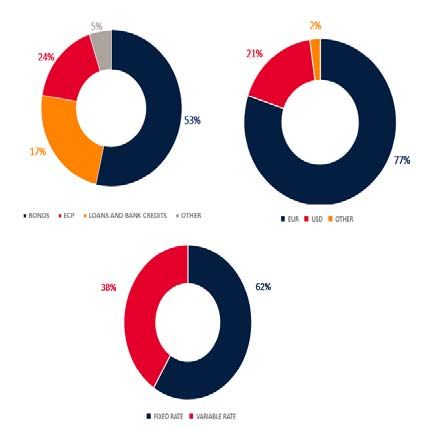
1.     SUMMARY OF MAIN EVENTS
In the first half we made progress in the lines of action set out in the latest strategic update: enhanced
shareholder remuneration, profitable management of businesses, including its international expansion,
and development of new businesses tied to the energy transition.

RESULTS

Against a backdrop of a subdued economy and rising geopolitical instability, the financial performance of
our businesses felt the pressure of volatile crude oil prices and weakening global indicators for heavy
industries during first half of 2019 (1H 2019).

 RESULTS FOR THE PERIOD (million euros)                                              1H 2019     1H 2018 ∆%
  Upstream                                                                               646        647      ‐    €1,115 m
  Downstream                                                                             715        762  (6)%
                                                                                                                  Adjusted net
  Corporate and other                                                                  (246)      (277)  11%
                                                                                                                  income
 Adjusted net income                                                                    1,115    1,132    (2)%
  Inventory effect                                                                          63     202   (69)%
  Special items                                                                           (45)     212        ‐
 Net income                                                                             1,133    1,546   (27)%

Upstream results are in line with those of the first half of previous year (1H 2018). Lower realization prices
of crude oil were offset by lower exploration and production costs and by the strengthening of the dollar
against the euro.

Downstream results were lower than in 1H 2018 as a result of the weaker performance of Refining in Spain,
which was hit by significant drop of margins and maintenance shutdowns, and of Wholesale and Gas
Trading, due to a milder winter in North America. The decreases were partly offset by improved
performance in Chemicals, Refining Peru and Trading.

Corporate and other continued to lower financing and corporate structure costs despite the impact of the
application of IFRS 16 (see Note 2.2.1 to the Financial Statements for 1H 2019) and weaker performance in
the management of positions (currency and treasury shares).

Adjusted net income, which is intended to reflect the ordinary profit arising from the businesses, came to
€1,115 million, 2% less than in 2018.

The inventory effect amounted to €63 million vs €202 million in 1H 2018, due to the behavior of crude oil
and petroleum product prices in the period.

Special items showed a decline owing to the absence of major divestments, whereas in 2018 this caption
reflected a gain on disposal of the 20% stake in Naturgy.                                                         ↑47%
                                                                                                                  Cash flow from
In sum, the Group’s net income in the first half of 2019 was €1,133 million, 27% lower than in 2018. Earnings
per share came to €0.73.
                                                                                                                  operations

EBITDA, at €3,712 million, was slightly lower than in 2018. Cash flow from operations in the first half (€2,530
million), which increased significantly compared to the same period last year (+47%) due to the
improvement in working capital, covered investments, interest payments and shareholder remuneration;
free cash flow (€1,093 million), is lower than in 2018 (€4,306 million), due to the disposal of our stake in
Naturgy in May 2018 (€3,816 million).

Net debt with leases amounted to €7,464 million (€7,457 million in the first quarter), with leverage of 19.4%.
Net debt ex leases came to €3,662 million (€3,686 million at the end of the first quarter and €3,439 million
at year‐end 2018) with leverage of 10.6%.

                                                            4
Translation of a report originally issued in Spanish
                                               In the event of a discrepancy, the Spanish language version prevails

Shareholder remuneration in the six‐month period was equivalent to 0.411 euros per share in January1,
implying an increase of 6% over the previous year. At the Annual General Meeting of May 31, 2019, the
shareholders resolved to reduce capital through redemption of treasury shares to offset the dilutive effect                         ↑6%
of bonus share issues arranged in 2019.                                                                                             Shareholder
ACTIVITIES                                                                                                                          remuneration

In the Upstream segment, the highlights were the success of our exploration campaign, with discoveries in
Indonesia (Sakakemang2), the United States (Alaska and Gulf of Mexico), Malaysia and Norway, the start of
production at Buckskin in the Gulf of Mexico (USA) and at Angelin (Trinidad and Tobago), the acquisition of
new acreage in Indonesia, Norway and Russia, and the deal struck to establish a joint venture with Shell
and Gazprom Neft for the exploration of two blocks in the Gyudan Peninsula (North Russia‐Siberia).

The Downstream segment continued its international expansion in Mobility and development of the
Electricity and Gas businesses. In Mexico, the half‐year ended with 195 service stations in operation, while
Repsol Electricidad y Gas topped 890 thousand customers and acquired three renewable projects in Spain
with a capacity of 794 MW. Building on digitization opportunities, Waylet reached 1.2 million users and
signed an agreement with El Corte Inglés to add the department store’s payment card to the platform.

REPLACEMENTS ON THE BOARD

At the Annual General Meeting of May 31, 2019, the shareholders resolved to re‐elect Mr. Antonio Brufau
Niubó (Chairman) and Mr. Josu Jon Imaz San Miguel (CEO) for the four‐year term mandated by the bylaws,
together with other re‐elections and appointments, while reducing the number of Directors to fifteen.

SUSTAINABILITY AND DIGITIZATION

A new Global Sustainability Plan was approved in the first half of the year, setting long‐term goals and
targets (2025). Against the backdrop of an energy transition toward a low‐emissions future to limit the
effects of climate change, in 2019 Repsol implemented improvement actions at its facilities that prevented
99.6 thousand tons in CO2 emissions, thereby reducing energy consumption.

As to employee accidents, there was no fatality among our own personnel, but a contractor in Marcellus,
Canada, died in an accident. The process safety indicator is 0.47 (the same figure as in 2018).

Regarding gender diversity, following the renewal of the Board, the percentage of women reached 33%.
This fulfills the target set out in the Global Sustainability Plan.

During the first half we launched more than 20 new digital cases. There are now over 150 initiatives
underway, of which more than 50 are already in the process of being scaled up to the entire organization.
In 2018, we created 10 hubs or expert centers; this year they have continued to grow in capabilities and
experience, making forward strides toward a corporate data and artificial intelligence platform based on a
multi‐cloud strategy. In addition, more than 1,000 people took face‐to‐face training courses on new digital
trends and ways of working, and we rolled out our Digital for Leaders program (seminars attended by more
than 100 Repsol executives and leaders).

1 It corresponds to the commitment to purchase of free‐allocation rights assumed by Repsol (see Note 4.4).
2
  In July, Repsol signed a Memorandum of Understanding with the Indonesian gas distributor PT Perusahaan Gas Negara for the sale of natural
gas to be produced in the Sakakemang Area. The final gas sales agreement is expected to be signed in the coming months. No further material
events occurred after June 30, 2019.

                                                                     5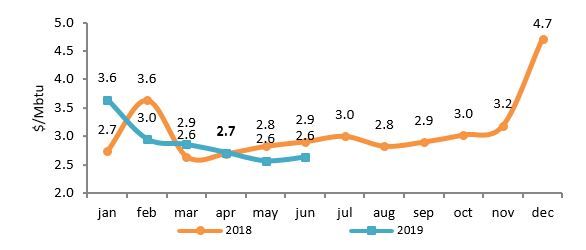
MAIN FIGURES AND INDICATORS

      Financial indicators (1)                          1H 2019     1H 2018        Our business performance (1)                          1H 2019 1H 2018
      Results                                                                      Upstream
       Operating income (2)                                2,002      2,043        Net daily hydrocarbon production (kboe/d)                  697        724
       Adjusted net income                                 1,115      1,132        Net daily liquids production (kbbl/d)                      251        266
       Net income                                          1,133      1,546        Net daily gas production (kboe/d)                          446        458
       Earnings per share (€/share)                         0.73       0.93        Average crude oil price realization ($/bbl)               59.6       64.2
       EBITDA (2)                                          3,712      3,811        Average gas price realization ($/kscf)                      3.2        3.3
       Investments                                         1,468      1,245        EBITDA(2)                                                2,213      2,289
       Capital employed (3)                               34,697     33,864
       Capital employed (with leases)                     38,391           ‐       Adjusted net income                                        646        647
       ROACE (%)(4)                                           7.6        8.2       Cash flow from operations (2)                            1,605      1,272
       ROACE (with leases) (%)(4)                             7.0          ‐       Investments                                                961        900

      Financial position and cash flows                                            Downstream
       Cash flow from operations (2)                       2,530       1,726       Distillation utilization Spanish Refining (%)            89.3        90.4
       Free cash flow (2)                                  1,093       4,306       Conversion utilization Spanish Refining (%)             102.0       103.9
       Cash flow generated                                 (124)       3,373       Refining margin indicator Spain ($/bbl)                    4.4         6.9
       Net debt                                            3,662       2,706       Sales of oil products (kt)                             24,251      25,217
       Net debt (with leases)                              7,464           ‐       Sales of petrochemical products (kt)                    1,458       1,313
                                                                                   LPG sales (kt)                                            699         739
      Shareholder remuneration                                                     Gas sales in North America (TBtu)                         287         258
       Shareholder remuneration (€/share) (5)              0.411       0.388       Generation (GWh)                                        2,185            ‐
                                                                                   EBITDA(2)                                               1,580       1,649
                                                                                   Adjusted net income                                       715         762
                                                                                   Cash flow from operations (2)                           1,093         547
      Sustainability indicators                         1H 2019        2018        Investments                                               482         325
      People
       No. of employees (6)                                25,797    25,288
       New employees (7)                                    2,014     3,810
      Safety and environment
       Lost time injury rate (8)                             0.76       0.89
       Total recordable incident rate (9)                    1.18       1.59
       Annual CO2 emissions reduction (Mt) (10)              0.09       0.31       Macroeconomic environment                             1H 2019 1H 2018
                                                                                   Average Brent price ($/bbl)                              66.0    70.6
      Stock market indicators                            1H 2019    1H 2018        Average WTI price ($/bbl)                                57.4    65.5
       Share price at year‐end (€/share)                   13.79      16.77        Average Henry Hub price ($/MBtu)                          2.9     2.9
       Average share price (€/share)                       14.81      15.44        Electricity pool ‐ OMIE (€/MWh)                          51.8    50.2
       Market cap at period‐end (million €)               21,489     26,094        Average exchange rate (€/$)                              1.13    1.21

(1)
        Where applicable, figures shown in million euros.
(2)
        In 2019, this includes the effects of application of IFRS 16 (see Note 2.2.1 to the condensed consolidated financial statements for the first half of
        2019).
(3)
        Capital employed from continuing operations.
(4)
        ROACE has been annualized by straight extrapolation from data for the period. It does not include discontinued operations.
(5)
        Fixed price guaranteed by Repsol for bonus share rights awarded under the “Repsol Flexible Dividend” program (see Note 4.1 to the interim
        financial statements for the first half of 2019).
(6)
        Number of employees of companies at which Repsol establishes people management policies and guidelines, irrespective of the type of contract
        (fixed, temporary, partially retired, etc.). The figure for 2018 is the annual figure.
(7)
        Only fixed or temporary employees with no prior working relationship with the company are treated as new hires. 37% of new employees in
        2019 and 40% in 2018 were under permanent contracts. The 2018 figure is the full‐year rate.
(8)
        Lost time injury rate: number of cases with personal consequences (fatalities and lost time) over the year per million hours worked. The 2018
        figure is the full‐year rate.
(9)
        Total recordable incident rate: total number of cases with personal consequences (fatalities, lost time, medical treatment and restricted work)
        over the period per million hours worked. The 2018 figure is the full‐year rate.
(10)
        Reduction of CO2 compared with the 2010 baseline. The 2018 figure is the full‐year amount.

                                                                               6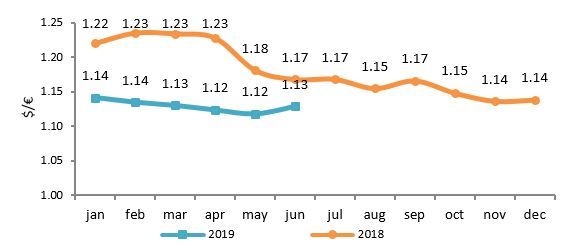
Translation of a report originally issued in Spanish
                                       In the event of a discrepancy, the Spanish language version prevails

2. CORPORATE GOVERNANCE

Changes in the Board of Directors

At the Annual General Meeting held on May 31, 2019, the shareholders of Repsol, S.A. resolved to re‐elect
as Directors Mr. Antonio Brufau, Mr. Josu Jon Imaz, Mr. José Manuel Loureda and Mr. John Robinson West,          33%
to ratify and re‐elect as a Director Mr. Henri Philippe Reichstul, and to appoint as Directors Ms. Aránzazu
                                                                                                                 Women on the
Estefanía Larrañaga and Ms. María Teresa García‐Milá Lloveras. All will serve a term of office of 4 years as
                                                                                                                 Board
mandated by the bylaws.

In addition, at the Annual General Meeting the shareholders resolved to appoint Mr. Mariano Marzo Carpio
as Lead Independent Director and to reduce the number of Directors to fifteen.

The composition of the Board and its Committees is now as follows:

                                                          7
3. ENVIRONMENT
3.1 MACROECONOMIC ENVIRONMENT
In 2019, the global economy has recovered to some extent from the slowdown in 2018, yet remains slack.
According to International Monetary Fund (IMF) estimates (World Economic Outlook April 2019), global
growth in 2019 will reach 3.3 %. 3.3%
Forecast world
After the stagnation in activity and financial markets at the end of 2018, central banks in developed growth in 2019
countries turned their monetary policy around. In 2018 the United States Federal Reserve (the Fed) raised
benchmark rates four times and heralded further increases for 2019, while the European Central Bank
ended its government debt purchase program (“quantitative easing”) and announced that in 2019 it
would likewise start to raise rates. However, in early 2019 both central banks relaxed their stance and
put monetary normalization on hold. In addition, since the risks of a trade war are still high, further
stimulus measures have been rolled out, and both central banks are expected to cut rates soon.
This policy response may encourage a pick‐up in activity in late 2019 and 2020. On balance, however,
risks to growth are still on the rise, as any further upsurge in trade turbulence would be destructive and
the leeway for policy response is narrow.
Given increasing uncertainty and lower growth in the Eurozone, during the first months of 2019 the dollar
strengthened, with the euro/dollar pair reaching 1.11 in May. However, from that point onward the
central banks’ change of approach has narrowed the interest rate differential and the U.S. has itself
shown signs of a downtrend, so the exchange rate is tending to settle at around 1.13.
Average exchange rate (€/$) over time
€/$ 1.13
Average
exchange rate
first half
3.2 ENERGY LANDSCAPE
Brent crude
During the first half of 2019, oil prices displayed high volatility. Brent crude began the year trading at its
lowest levels since 2017, at just above $50 per barrel ($/bbl); it then followed an upward path that led it
to exceed $75/bbl by the end of April. Subsequently, the price corrected to $60/bbl in mid‐June and 66 $/bbl
ended the six‐month period at $65/bl. At the end of the first half, the price of Brent crude stood at an Brent
average of $66/bbl, 7% below the average for the same period in 2018. WTI crude averaged 57.4 $/bbl,
bringing the differential between the two to $8.6/bbl in the period.
On the supply side, after prices fell in the fourth quarter of 2018, OPEC and several non‐OPEC exporting
countries decided in December to return to an output‐cutting policy. OPEC+, as this group of countries is
now known, undertook to withdraw about 1.2 million barrels per day from their combined output (‐800
OPEC and ‐400 non‐OPEC) from January 2019 onward. Compliance with the cuts has been significant; in
fact, in the past few months the leaders on each side, Saudi Arabia for OPEC and Russia for non‐OPEC,
8Translation of a report originally issued in Spanish
In the event of a discrepancy, the Spanish language version prevails
cut output far more deeply even than originally agreed. OPEC+ containment of supply is the main reason
behind the price increase to $75/bbl at the end of April. Last year’s December agreement had an original
duration of six months; however, following the OPEC+ meeting of July 1 and 2 this year, cuts will be
extended to March 2020.
Another factor influencing the supply side is the increase in U.S. output, although average growth in 2019
is expected to be less than last year’s.
However, it is on the demand side that the greatest uncertainties lie. So far this year, most analysts and
the major official energy agencies, such as the International Energy Agency (IEA) and the U.S. Energy
Information Administration (EIA), have lowered their forecasts for global demand growth for this year
and 2020. The revised forecast is a response to the worsening economic outlook, particularly in view of
deteriorating confidence indices in the manufacturing sector in the context of the U.S.‐China trade war.
Average Brent price over time
85,0 81.2
78.9
80,0 76.9
74.3 74.3
71.8 72.6
75,0
69.2 65.9
70,0 65.2
71.1 64.7
71.3
65,0
$/bbl
59.5
60,0 66.1 64.1 57.4
64.0
55,0
50,0
45,0
40,0
jan feb mar apr may jun jul aug sep oct nov dec
2018 2019
Natural Gas ‐ Henry Hub
The Henry Hub price of U.S. natural gas averaged $2.9/MBtu in the first half of 2019, unchanged from the
same period in 2018, under heavy pressure from the existing situation of overproduction. Year‐on‐year
and for the first half, dry gas production grew (+12%) far ahead of demand (+3%). A healthy rise in
electricity demand was not enough to counteract the rapid growth of production. U.S. exports of liquefied
natural gas increased (+ 56%), serving as support for the price of gas.
$2.9/MBtu
According to the latest data released in the United States, the balance adjustment seen in 2018 would
not reoccur until 2020 if we see a slowdown in production growth, strong domestic demand and robustly
Henry Hub
expanding exports.
Average Henry Hub price over time
94. FINANCIAL PERFORMANCE AND SHAREHOLDER REMUNERATION
4.1 INCOME
€ Million 1H 2019 1H 2018 ∆
Upstream 646 647 (1)
Downstream 715 762 (47) Adjusted net
Corporate and other (246) (277) 31 income in line
Adjusted net income 1,115 1,132 (17) with previous
Inventory effect 63 202 (139) year
Special items (45) 212 (257)
Net income 1,133 1,546 (413)
Income for the first half of 2019 (1H 2019) arose in a context of considerable weakening of the Refining
margin indicator in Spain ($4.4/bbl vs. $6.9/bbl in 1H 2018), lower crude oil prices (Brent 66.0 vs. 70.6 in
1H 2018) and a strengthening of the dollar against the euro (€/$ 1.13 vs. €/$ 1.21 in 1H 2018).
Repsol earned adjusted net income of €1,115 million (‐2%), net income of €1,133 million (‐27% vs. 2018,
which included the gain on the disposal of Naturgy in that year) and cash flow from operations of €2,530
million (+47%). The half‐year ended with net debt with leases standing at €7,464 million (€3,662 million
ex leases).
EBITDA of €3,712 million was slightly lower (‐3%) than in the same period of 2018.
TOTAL
EBITDA (€ Million) 1H 2019 1H 2018
Upstream 2,213 2,289
Downstream 1,580 1,649
Corporate and other (81) (127)
TOTAL 3,712 3,811
Upstream
Average production in the first half of 2019 came to 697 kboe/d, 4% lower than in the same period of
2018. This decline occurred mainly in Libya, Venezuela, Trinidad and Tobago and the United States, and
was partly offset by increases driven by new wells (Colombia and Canada), acquisitions (Norway) and the
start of production at Buckskin (USA).
As to exploration, during the six‐month period 10 exploration and 6 delineation/appraisal wells were €1,133 m
drilled, 9 with positive results, 5 negative and 2 under evaluation. Net income
For further information on the activities of the Upstream segment, see section 5.1.
Adjusted net income in Upstream businesses amounted to €646 million, in line with 1H 2018 (€647
million). Lower realization prices for crude oil (‐7%) and lower marketed volumes were offset by lower
exploration and production costs and decreased taxes, and by the strengthening of the dollar against the
euro.
10Translation of a report originally issued in Spanish
In the event of a discrepancy, the Spanish language version prevails
Upstream adjusted net income variation
€646 m
Upstream
adjusted net
income
(1)
Includes, inter alia, costs related to production and the results of investees and non‐controlling interests.
Investments in the first half (€961 million) increased by 7% compared to 1H 2018, and were allocated
primarily to production and/or development assets, mainly in the United States, Trinidad and Tobago,
Norway, the UK, Algeria and Canada.
Downstream
Adjusted net income in the first half of 2019 was €715 million, compared to €762 million in the first half of
2018.
Downstream adjusted net income variation
€715 m
Downstream
adjusted net
income
The change in income is mainly due to the following factors:
‐ In Refining, income decreased as a result of a sharp drop in margins due to the worst international
environment (through narrowing of the heavy crudes spread and the fall in the middle distillates
and naphtha spread) and maintenance shutdowns in Spain. This was partly offset by higher
margins in Peru.
‐ In Trading, improved performance is mainly due to enhanced margins in LPG, middle distillates
and crude oil operations.
- In Chemicals, the improvement in results is mainly due to increased sales, better margins and
lower operating incidents in the period.
11- In Commercial Businesses, the worst performance is mainly due to decreased income in
Wholesale and Trading Gas, reflecting narrower margins brought on by a mild winter in North
America.
Operating investment in the Downstream segment amounted to €482 million in the first half of 2019
(48% up on 1H 2018). The largest investments were undertaken to enhance energy efficiency, safety and
the environment. Other highlights were the investments due to international expansion in Mexico and
the new Electricity and Gas businesses.
Corporate and other
Income for the half‐year period amounted to €‐246 million (compared to €‐277 million in 1H 2018).
Corporate maintained its efforts to reduce corporate costs, despite of initiatives in digitization and
technology. While financing costs continued to decrease, the financial result worsened as a result of
application of IFRS 16 (see Note 2.2.1 to the 1H 2019 consolidated financial statements) and the weaker
performance in the management of positions (currency and treasury shares).
Net income came to €1,133 million, 27% less than in 2018.
PERFORMANCE INDICATORS 2019 2018
Return on average capital employed (ROACE) (%) 7.6 8.2 (1) 7.6%
Return on average capital employed (ROACE) (with leases) (%) 7.0 ‐
ROACE
Earnings per share (€/share) 0.73 0.93
(1)
Does not include discontinued operations (Naturgy). If included, ROACE would be 9%.
12Translation of a report originally issued in Spanish
In the event of a discrepancy, the Spanish language version prevails
4.2 CASH FLOW
Free cash flow in 2019 came to €1,093 million, compared to €4,306 million in 2018, a figure mainly
reflecting the proceeds of disposal of the stake in Naturgy (€3,816 million).
↑47%
CASH FLOW (€ Million) 1H 2019 1H 2018 Cash flow from
EBITDA 3,712 3,811 operations
Changes in working capital (659) (1,414)
Dividends received 17 4
Income tax receipts/(payments) (463) (490)
Other receipts/(payments) (77) (185)
I. Cash flow from operations 2,530 1,726
Payments on investments (1,503) (1,258)
Proceeds from divestments 66 3,838
II. Cash flow from investments (1,437) 2,580
FREE CASH FLOW (I+II) 1,093 4,306
Dividends and other equity instruments (201) (196)
Net interest and leasing (287) (280)
Treasury shares (729) (457)
CASH GENERATED (1) (124) 3,373
(1) Does not include derivatives on shares of Repsol, S.A. transacted with financial institutions,
out of a total notional amount of 76 million shares, which form part of “cash flows from
financing activities and other items” (+€695 million).
Cash flow from operations (€2,530 million) covered investments and payment of interest and dividends,
and, partly, purchases of treasury shares. Improvement over 1H 2018: the maintenance of business
EBITDA levels was positively impacted by less variation in working capital, mainly in the Downstream
segment (impacted in 2018 by a considerable increase in the cost of inventories as a result of higher
prices).
Cash flow from investments (€‐1,437 million) reflects the international expansion in Mexico and the new
businesses of Repsol Electricidad y Gas in Downstream segment, as well as the increased investment
effort in productive assets in the Upstream segment. In 1H 2018, the highlight was the cash proceeds of
disposal of the stake in Naturgy.
As a result of the foregoing, after satisfying financing costs (€‐287 million), shareholder remuneration (€‐
201 million) and the acquisition of treasury shares (see section 4.4), cash generated amounted to €‐124
million.
Cash sources and applications
134.3 FINANCIAL POSITION
During the first half of 2019, in line with the commitment to strengthen the Group’s financial structure,
we continued to take effective steps toward achieving solid levels of debt and leverage.
€3,662 m
Following financial prudence and in order to maintain high liquidity, the Group’s liquid resources at year‐ Net debt
end in the form of cash and available credit facilities far exceed the maturities of short‐term debt.
A highlight of the first half was first application of IFRS 16, which led to changes in the Group’s debt
metrics. For further information, see Note 2.2.1 to the interim consolidated financial statements for the
first half of 2019 and Appendix II to this report.
Indebtedness
Net debt (€3,662 million) and net debt with leases (€7,464 million) remained at levels similar to 2018.
Change in net debt
(1)
Includes finance leases recognized under the previous accounting standard (€1,624 million) and leases recognized after
the application of IFRS 16 (€2,103 million).
(2)
Includes, inter alia, new leases arranged in the period, other receipts/payments from operating activities and the
€10,000 m
exchange rate effect. Gross debt
The breakdown and maturity of gross debt ex leases (€10,000 million) at June 30, 2019 is as follows:
3.500
3.000
2.500
2.000
1.500
1.000
500
0
2019 2020 2021 2022 2023 y sg
BONDS ECP Other Gross Debt
14Translation of a report originally issued in Spanish
In the event of a discrepancy, the Spanish language version prevails
Main funding efforts
During the first six months of 2019, there have been no issues of bonds or debt securities. In February
2019 the bond issued by Repsol International Finance B.V. (RIF) was redeemed at maturity. This bond was
issued in January 2012 under the EMTN Program for a nominal amount of €1,000 million and an annual
fixed coupon of 4.875%.
Additionally, RIF runs a Euro Commercial Paper (ECP) Program guaranteed by Repsol, S.A., capped at
€2,000 million; the outstanding balance at June 30, 2019 was €1,725 million.
For further information, see Note 4.1.5 to the interim consolidated financial statements for 1H 2019.
Financial prudence
Group liquidity, including committed undrawn credit facilities, stood at €7,832 million at June 30, 2019, Liquidity
which is enough to cover short‐term debt maturities by a multiple of 1.63. Repsol had undrawn credit 1.63 x
facilities amounting to €1,896 and €2,265 million at June 30, 2019 and December 31, 2018, respectively. S/T debt
maturities
INDICATORS OF FINANCIAL POSITION 06/30/2019 06/30/2018
Net debt (€ million) 3,662 2,706
Net debt / Total capital employed ‐ ex leases (%) 10.6 8.0
Debt interest (1) / EBITDA (%) 3.1 3.8
Net financial debt ‐ with leases (€ million) 7,464 ‐
Net debt – with leases / Total capital employed – with leases (%) 19.4 ‐
(1)
Excludes finance cost of leases.
Credit rating
At present, the credit ratings assigned to Repsol, S.A. by the rating agencies are as follows:
STANDARD & POOR’S MOODY’S FITCH
PLAZO Repsol, S.A. Repsol, S.A. Repsol, S.A.
Long‐term BBB Baa1 BBB
Short‐term A‐2 P‐2 F‐3
Outlook positive stable positive
Most recent change 12/12/2018 12/10/2018 10/19/2018
Treasury shares and own equity investments
At June 30, 2019, the balance of treasury shares stood at 79 million shares (including 76 million shares as
the underlying of derivative contracts entered into by Repsol, S.A. with financial institutions) representing
5% of share capital as of that date. For further information, see Note 4.1 “Treasury shares and own equity
investments” to the interim financial statements for the first half of 2019.
154.4 SHAREHOLDER REMUNERATION
Remuneration received by shareholders in the first half of 2019 as part of the “Repsol Flexible Dividend”
scheme includes the amount of the irrevocable commitment to purchase bonus share rights undertaken
by Repsol as part of the bonus issue concluded in January 2019 (€0.411 gross per right). Thus, in the first ↑ 6%
half of 2019, Repsol paid out a gross total of €175 million to shareholders and distributed 31,481,529 new Shareholder
shares, worth €453 million, to shareholders opting to take their dividend in the form of new company remuneration
shares. vs. 1H 2018
In addition, in July 2019, under the “Repsol Flexible Dividend” program, replacing what would have been
the final dividend from 2018 profit, Repsol paid out €223 million in cash (€0.505 gross per right) to
shareholders opting to sell their bonus share rights back to the Company and delivered 39,913,458
shares, worth €564 million, to shareholders opting to take their dividend in the form of new company
shares (71.69% of shareholders).
At the 2019 Annual General Meeting, the shareholders resolved to reduce capital through redemption of
treasury shares1 to offset the dilutive effect of bonus issues concluded in 2019 as part of the “Repsol
Flexible Dividend” program described above. The main effect of the reduction in capital will be an increase
in earnings per share, to the benefit of shareholders.
For additional information on the total remuneration received by shareholders and the bonus issues under
the “Repsol Flexible Dividend” program, see Note 4.1 “Equity” to the interim financial statements for the
first half of 2019.
Our share price
The Repsol share price ended the first half of 2019 at levels similar to those at the beginning of the fiscal
year.
Repsol share price vs. the Ibex 35 Repsol vs. the European oil sector1
€14.81
Average
share price
Source: Bloomberg
(1)
European peers considered: BP, Shell, Total, Eni, Equinor, Galp and OMV.
1
Through redemption of treasury shares available on March 27, 2019 and shares acquired through a share buyback program and, where
appropriate, through settlement of derivatives arranged prior to March 27, 2019.
16Translation of a report originally issued in Spanish
In the event of a discrepancy, the Spanish language version prevails
The Group’s main stock market indicators in 2019 and 2018 are detailed below:
MAIN STOCK MARKET INDICATORS 1H 2019 1H 2018
Shareholder remuneration (€/share) (1) 0.411 0.388
Share price at period‐end (2)
(euros) 13.79 16.77
Period average share price (€) 14.81 15.44
High (€) 15.52 17.28
Low (€) 13.64 13.75
Number of shares outstanding at end of the period (million) 1,559 1,556
Market capitalization at period‐end (million euros) (3) 21,489 26,094
Book value per share (euros) (4) 20.2 19.8
(1)
For each period, shareholder remuneration includes dividends paid and the fixed price guaranteed by Repsol for the bonus share
rights awarded under the “Repsol Flexible Dividend” program.
(2)
Share price at period‐end in the continuous market of the Spanish stock exchanges.
(3)
Period‐end closing market price per share, times the number of shares outstanding.
(4)
Equity attributed to the parent/Number of shares outstanding at period‐end.
17Translation of a report originally issued in Spanish
In the event of a discrepancy, the Spanish language version prevails
5. OUR BUSINESS PERFORMANCE
5.1 UPSTREAM
Main operating figures
Our performance in 1H 2019 € Million 1H 2019 1H 2018 ∆
Operating income 1,174 1,236 (62)
Income tax (547) (594) 47
1H 2019 1H 2018 Investees and non‐controlling
19 5 14
Total net production of liquids (kbbl/d) 251 266 interests
Adjusted net income (1) 646 647 (1)
Total net daily gas production (kboe/d) 446 458 Special items 75 (132) 207
Total net daily hydrocarbon production (kboe/d) 697 724 Net income 721 515 206
Average crude oil price realization ($/bbl) 59.6 64.2 Effective tax rate (%) 47 48 (1)
Average gas realization price ($/kscf) 3.2 3.3 EBITDA 2,213 2,289 (76)
Bonds, dry wells, and general and administration Investments 961 900 61
75 223
expenses (€Million) (1)
(1)
Adjusted net income by geographical region:
1)
Only direct costs allocated to exploration projects.
Geographical region 1H 2019 1H 2018 ∆
Europe, Africa and Brazil 335 358 (23)
Latin America – Caribbean 217 260 (43)
North America 65 115 (50)
Asia and Russia 119 132 (13)
Exploration and other (90) (218) 128
Adjusted net income 646 647 (1)
Main events of the six‐month period (1/3):
Production came to 697 kboe/d in the first half of 2019, representing a decrease of 4% (27 kboe/d) compared
to the same period in 2018. The decrease is mainly due to the interruption of production in Libya in the first
two months of the year for security reasons, lower demand for gas in Venezuela, maintenance shutdowns in
Trinidad and Tobago and in the United States reflecting the decline of the Shenzi field, and disposal of the stake
in Midcontinent. All this was partially offset by increasing production from the new wells in Akacias, Colombia,
and Duvernay, Canada, the acquisition of Mikkel and Visund in Norway, and the start of production at Buckskin
in the United States.
Exploration campaign: In the first half of the year, 10 exploration wells and 6 delineation/appraisal wells were
drilled, 9 with positive results (5 exploration wells in the USA, Indonesia, Malaysia (2) and Norway and 4
appraisal wells in the USA), 5 with negative results (4 exploration wells in Bulgaria, Colombia (2) and Norway
and 1 appraisal well in Algeria) and 2 with results under evaluation (1 exploration well in Bolivia and 1 appraisal
well in Algeria). At the end of the period no exploration or appraisal drilling was underway.
Acreage: We acquired one block in Indonesia (exploration, operated), 6 blocks in Norway, including 4 in the
2018 APA Round (concessions in predefined areas) and two acquired (Mikkel Field), 5 blocks in Russia (1
exploration), 1 block in the USA (Moccasin field, Gulf of Mexico).Translation of a report originally issued in Spanish
In the event of a discrepancy, the Spanish language version prevails
Main events of the six‐month period (2/3):
NORTH AMERICA
United States: positive exploration campaign in Alaska and the Gulf of Mexico, start of production at Buckskin, and
major asset exchange agreement
The presence of hydrocarbons was confirmed in the southern sector of the Pikka unit in Alaska, where the first
delineation well, known as Pikka‐B, was completed in January and the Pikka‐C appraisal drilling was completed in
April, both with positive results.
In June, hydrocarbon production began at the Buckskin deepwater project (in which Repsol holds a 22.5% stake,
LLOG being the operator) in the Keathley Canyon area in the U.S. Gulf of Mexico.
In late April, an important discovery was announced at the Blacktip exploration well, located in deep waters of
the Gulf of Mexico (USA) 400 km south of Houston, with a net crude area more than 122 meters thick. Repsol has
an 8.5% stake in this hydrocarbon discovery in the Alaminos Canyon basin, alongside Shell (operator), Chevron
and Equinor. The project is at the stage of appraisal and delineation of reserves. The Blacktip‐1 ST1 appraisal
drilling was also positive in June.
LATIN AMERICA ‐ CARIBBEAN
Trinidad and Tobago: start of gas production at Angelin
In February, the BPTT consortium (30% Repsol) announced the start of gas production from its Angelin platform
(West Block), which is remotely operated and located 60 km off the southeastern coast of the island of Trinidad,
on a 65‐meter sheet of water.
Colombia: record production at Akacias and signing of new contracts for two marine blocks
In March, at the Akacias project (Colombia), in which Repsol holds a 45% stake, a record total production of 20
kbbl per day was achieved as a result of the drilling work in Phase I of the Development Plan approved in 2018.
The final objective is to achieve in the medium term a total output of 50 kbbl per day.
In April Repsol signed two contracts with Colombia's National Hydrocarbons Agency (ANH) for exploration and
production in the marine blocks GUA OFF‐1 and COL‐4, located off the Colombian coast in the Caribbean Sea.
Repsol is the operating company for block GUA‐OFF‐1 with a 50% stake (Ecopetrol owns the remaining 50%)
and for block COL‐4, also with a 50% stake (ExxonMobil owns the remaining 50%).
Venezuela: complex environment
In the first half, Repsol's average production in Venezuela reached 59 kboe per day (62 kboe in 2018). Political
instability, economic recession and inflation continued throughout the period. For further information, see Note
5.3 to the interim consolidated financial statements for 1H 2019.
ASIA AND OCEANIA
Indonesia: the country's largest gas discovery in the Sakakemang block
In February, the largest gas discovery in Indonesia in 18 years was announced; it is also one of the 10 largest in
the world of the past 12 months. The well, called Kaliberau Dalam‐2X (KBD‐2X), is in the Sakakemang onshore
block on the southern island of Sumatra. Repsol is the operator with a 45% stake. This discovery has a
preliminary estimate of recoverable resources of at least 2 trillion cubic feet (TCF) of gas.
Russia: deal with Gazprom Neft and Shell for joint exploration of two blocks in Siberia
In June Repsol signed a memorandum of understanding with Gazprom Neft and Shell to form a joint venture
for the exploration of two adjoining license blocks, Leskinsky and Pukhutsyayakhsky, located in the Gyudan
Peninsula on the coast of Siberia. Gazprom Neft will have a 50% stake and Repsol and Shell 25% each. The
agreement is expected to be completed in 2020 when authorizations are in place.
19Main events of the six‐month period (3/3):
EUROPE
Norway: new awards, extensions, acquisitions and exploration discovery
In January, the Norwegian Ministry of Petroleum and Energy announced that Repsol would be awarded stakes
in three new exploration licenses and the extension of an existing one. The new licenses are in the large
Egersund Basin (3) and the Barents Sea (1) and further strengthen Repsol's position in the country.
In February Repsol announced a deal to acquire from Total 7.65% of the Mikkel field in Norway, which
currently produces a total of 50 kbbl per day.
In March, an exploration discovery was made with the Telesto well (7.7% Repsol) in the PL 120 production
license in the Tampen area, in the North Sea (Norway). Repsol participated in the oil discovery together with
Equinor (operator), Petoro and ConocoPhillips. The preliminary estimate is that recoverable resources could
be between 12 million and 28 million barrels of oil.
Greece: signing of a new exploration contract
In April, Repsol signed an exploration contract in Greece for the offshore Ionian block (located in the Ionian
Sea north of Kefalonia and west of the islands of Lefkada and Corfu), thus increasing Repsol's presence in this
country, where it already has two onshore blocks. The Ionian block has an area of 6,671 km2. Repsol has a
50% stake (operator), while the Greek company Hellenic holds the remaining 50%. The agreement is pending
ratification by the Greek Parliament.
Bulgaria: new exploration block acquired
In April, Repsol announced that it had acquired 20% of the Khan Kubrat offshore exploration block in Bulgaria,
with Shell participating as operator with 50% and Woodside Petroleum taking the remaining 30%.
AFRICA
Libya: complex environment
In the first half, Repsol's average production in Libya reached 24 kbbl per day (36 kbbl per day in 2018). The
situation of political uncertainty continues, affecting the security conditions of the country and the oil
industry. For further information, see Note 5.3 to the interim consolidated financial statements for 1H 2019.
20Translation of a report originally issued in Spanish
In the event of a discrepancy, the Spanish language version prevails
5.2 DOWNSTREAM
Main figures Our performance in 2019
1H 2019 1H 2018
Refining capacity (kbbl/d) 1,013 1,013
Europe (including the stake in ASESA) 896 896 € Million 1H 2019 1H 2018 ∆
Rest of world 117 117 Operating income 955 985 (30)
Conversion rate in Spain (%) 63 63 Income tax (231) (229) (2)
Conversion utilization Spanish Refining (%) 102.0 103.9 Investees and non‐controlling
Distillation utilization Spanish Refining (%) 89.3 90.4 (9) 6 (15)
interests
Processed crude oil (million t) 22.1 22.4 Adjusted net income (1) 715 762 (47)
Europe 19.8 20.1 Inventory effect 63 202 (139)
Rest of world 2.3 2.3 Special items (88) (18) (70)
Refining margin indicator ($/b) Net income 690 946 (256)
Spain 4.4 6.9
Effective tax rate (%) 24 23 1
Peru 6.0 2.0
EBITDA 1,580 1,649 (69)
Number of service stations 4,871 4,759
Investments 482 325 157
Europe 4,113 4,182
(1)
Rest of world 758 577 Adjusted net income by geographical region:
Oil product sales (kt) 24,251 25,217
Geographical region 1H 2019 1H 2018 ∆
Europe 21,332 22,036
Europe 680 723 (43)
Rest of world 2,919 3,181
Rest of the world 35 39 (4)
Petrochemical product sales (kt) 1,458 1,313 Adjusted net income 715 762 (47)
Europe 1,192 1,085
Rest of world 266 228
LPG sales (kt) 699 739
Europe 684 727
Rest of world 15 12
Gas sales in North America (Tbtu) 287 258
LNG regasified (100%) in Canaport (Tbtu) 17.6 12.5
Electricity generation (GWh) (1) 2,186 ‐
Installed electricity capacity (MWh) 2,952 600
(1) Electricity generation by Repsol Electricidad y Gas. Does not
include energy produced at cogeneration plants (which is included
in installed capacity).
Main events of the six‐month period (1/2):
Refining: high utilization levels and new bio ingredients in the formulation of fuels
Utilization levels held constant and shutdowns were conducted at the refineries in La Coruña and Bilbao.
‐ At La Coruña, multiple investments were made in technological innovation and safety aimed at improving the
integrity, energy efficiency and operational effectiveness of the facilities. The coke unit concentrated most of
the actions.
‐ The Bilbao Refinery shut down its conversion facility for maintenance work and updating of production
facilities, a highlight being the environmental improvements implemented in the Fluid Catalytic Cracking (FCC)
unit, resulting in reduced particulate emissions. In addition, a shutdown has begun to implement
modifications designed to improve the efficiency of the units.
We started to use advanced bio ingredients in the formulation of our marketed fuels. These bio ingredients do not
compete with food uses and are waste by‐products of industrial and domestic processes.
Chemicals: higher product sales and new certifications
Membership of the Circular Plastics Alliance (CPA), an initiative launched by the European Commission last
December 11 to encourage the use of recycled plastic in the EU market.
21Main events of the six‐month period (2/2):
Food Safety Certification (FSSC 22000) was obtained for the polyolefin centers in Puertollano and Sines. In 2018
the certificate was achieved at the Tarragona industrial complex and, with the addition of these two newly
certified sites, Repsol became the first polyolefin producer holding this certification for all its industrial facilities,
demonstrating its commitment and leadership in the field of food safety.
Awarded “Best Producer of Low Density Polyethylene in Europe” prize by customers in recognition of our work
as a reliable supplier.
Mobility: international expansion, electric mobility and digitization
At the end of the half year Repsol operates 195 service stations out of 278 contracts signed in Mexico.
The Waylet payment app topped 1.2 million registered users at the close of the first half. Users can use Waylet
to pay for goods and services at all Repsol network service stations and more than 3,500 affiliated retailers.
We signed an agreement with El Corte Inglés whereby from June 17 onward their department store customers
can make payment using our Waylet smartphone app. There are now several deals in place between the two
groups, in an increasingly close strategic alliance.
Repsol unveiled the first ultra‐fast charging point for electric vehicles on the Iberian Peninsula, with a maximum
power of 700 kilowatts (kW). The facility, located at the Repsol service station in Lopidana (Alava), allows electric
vehicles that can withstand that level of power to charge in five to ten minutes. Repsol's charging network,
through our investee IBIL, now operates more than 200 public access charging points, of which 33 points of sale
are located at Repsol service stations.
Repsol and the Confortauto repair garage network (110 facilities throughout Spain) have formed an alliance to
support the adaptation of gasoline vehicles to LPG. The DGT environmental label thus obtained allows drivers
access to traffic‐restricted areas in large cities.
Electricity and gas: new renewable energy projects and growth of the customer base
The current portfolio of electricity subscribers comes to 890,000 (16% more than at the beginning of the
marketing business eight months ago with the acquisition of Viesgo's unregulated low‐emission electricity
generation businesses and regulated and unregulated gas and electricity marketing businesses).
A new deal was struck with the Corte Inglés for power and gas subscriptions to become available at 16 locations:
Madrid, Valencia, Zaragoza, Alcorcón, Seville, Getafe, Huelva, Jerez de la Frontera, Malaga, Murcia, Alicante,
Badajoz, Albacete, Santa Cruz de Tenerife and Las Palmas.
Repsol announced its involvement in the construction of one of the world’s largest floating wind farms off the
north coast of Portugal, 20 kilometers from Viana do Castelo. The facillity will have an installed capacity of 25
MW and is expected to be operational by the end of this year.
Three renewable power generation projects were acquired in Spain, with a total capacity of 794 MW. The
projects are at different stages of execution and consist of a 335 MW wind farm straddling the provinces of
Zaragoza and Teruel, another wind farm located between Palencia and Valladolid with a total installed capacity
of 255 MW, and a 204 MW solar project in Cadiz. The projects will come online over the next four years and will
be operated by Repsol Electricidad y Gas.
These projects, together with the photovoltaic project in Valdesolar (Badajoz) and the floating wind farm on the
coast of Portugal, add up to 1,083 MW under development, in addition to the 2,952 MW of installed operating
capacity currently available to the Group.
22Translation of a report originally issued in Spanish
In the event of a discrepancy, the Spanish language version prevails
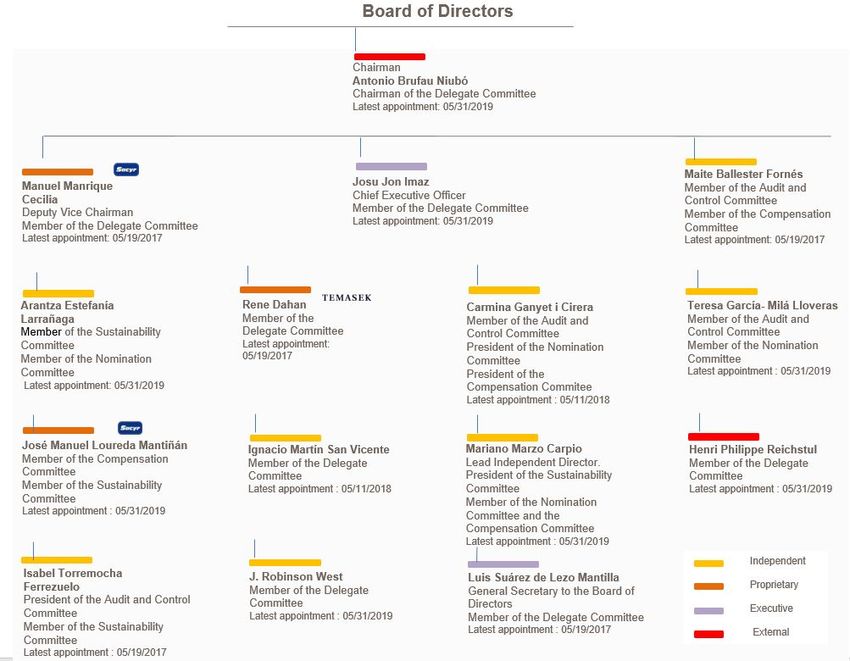
6. SUSTAINABILITY
Main events of the half‐year period:
Global Sustainability Plan: The Executive Committee approved a new, more cross‐sectional Global Sustainability
Plan, incorporating objectives in the supply chain, aiming at a broader horizon (up to 2025) and integrating the
Safety and Environment objectives resulting from the strategic rethinking process carried out in 2018. The new
plan sets 31 medium‐term objectives and 35 annual lines of action, articulated around the six axes of the
Sustainability Model, aimed at the business units, the supply chain, employees and the wider community. All
actions in the plan are tied to the United Nations Sustainable Development Goals to which the Company is
committed.
The Global Sustainability Plan is the Company’s roadmap from which Local Sustainability Plans are rolled out for
each country or site, while remaining sensitive to the specific circumstances and needs of each location where the
Group operates. In the first half, new plans were published in Canada, the UK and Algeria. These new additions
mean there are now 16 countries and 6 industrial complexes with Sustainability commitments (more than 330
annual actions have been specified, distributed across the 6 axes of the model), which in the last two years makes
for growth of more than 40% in the number of plans.
In addition, six consolidated documents were drawn up, one for each axis, setting out the actions established in
the 2018 Local Sustainability Plans.
The Global Plan and the Local Sustainability Plans are available at www.repsol.com.
Sustainable Development Goals. With the involvement of the Group’s Executive Committee, the United Nations
2030 Agenda was made known among the Group’s employees, alongside our plan to help achieve those goals. In
addition, a support plan has been set in motion that seeks to integrate commitment, awareness‐raising and
training in SDGs with the Company’s culture. The aim is to align with the needs of different stakeholders and
identify metrics to measure contributions to the 2030 Agenda in those SDGs where as an energy company we can
make a genuine difference.
Climate change. The scope of our annual verifications of the greenhouse gas (GHG) emissions inventory in the
Upstream businesses has widened (99% of the Company’s emissions inventory now undergoes checks). In May,
Repsol published the book “Towards a Low‐Emission Future,” our roadmap for tackling climate change, setting
out our policies and commitments facing the twofold challenge of supplying the energy that society needs while
cutting greenhouse gas emissions in line with the aims of the Paris Agreement. In June we published the second
report on our “green” bond issued in May 2017: the proceeds are used to fund or refinance projects aimed at
preventing or reducing GHGs in the Company’s activities.
Further information is available at www.repsol.com.
23 People. The 2020 target set in the Global Sustainability Plan is to increase the proportion of women on the Board
and in leadership positions to 30%. The latest changes on the Board (see section 2) have increased the proportion
of women to 33%.
During the first six months of 2019 there were 2,014 new hires (10% more than in 1H 2018), of which 37% were
under permanent contracts. We reached a total headcount of 25,797 at the close of the six‐month period.
Respect for Human Rights and Community Relations. Human Rights and Community Relations Policy has been
updated: (i) express mention of international human rights standards; (ii) reference to stakeholders within the
scope of the policy; (iii) references to the right to water; and (iv) to non‐obstruction of the activities of human
rights advocates.
Safe operation. During the first half there was a fatality in Marcellus, Canada, as a result of an accident involving a
contractor’s water transport truck.
Total Frequency Index ‐Personal safety performance indicator‐ (TFI) decreased by 21% with respect to the 2018
indicator, with a 10% decrease in the number of incidents involving lost days and a 4% reduction in hours worked.
The process accident rate as measured by the PSIR indicator (TIER1 + TIER2) is similar to the 2018 indicator.
As to safety culture, a new Safety Leadership program was launched, named “Safety Leap,” aimed at all the
Company’s leaders. The first session was attended by the Executive Committee. We published a “White Paper on
Safety Culture,” reflecting the Company’s understanding of safety culture, the model it has designed, and the
current areas of work. The second edition of the World Safety and Environment Days took place in June. Attended
by more than 400 professionals, the event aimed to tackle the new challenges and lead the roll‐out of strategic
rethinking on safety and the environment through to 2025.
Innovation and technology. Repsol acquired 28% of Begas Motor (a company with a strong research capability in
alternative fuel engines, engine control electronics, communication buses and diagnostic systems, especially for
LPG systems). In addition, Repsol acquired 8% of Ampere Power Energy, S.L., which designs, produces and markets
stationary electricity storage systems. Both investments form part of the Venture Capital fund created for the
period 2016‐2020, whereby Repsol committed to a contribution of €85 million.
Responsible tax policy. In the first half of 2019, Repsol paid more than €6,100 million in taxes and similar public
charges, having filed more than 21,000 tax returns.
Repsol voluntarily partnered with the tax agencies of five OECD countries in an OECD‐sponsored pilot program for
multilateral joint research and assessment of tax risks at multinational companies (International Compliance
Assurance program, ICAP). The tax agency partners rated Repsol as a Group with low tax non‐compliance risk.
Repsol Petróleo, Repsol Trading and Petronor were licensed as Authorized Economic Operators (AEOs) for
streamlined customs processing and for security and protection. The AEO license signals recognition as a reliable
operator in foreign trade, proves compliance with key security measures and good practices in the international
supply chain of goods and acknowledges willingness to cooperate with customs authorities.
For further information, see the Responsible tax policy section at www.repsol.com.
Ethics and compliance. During the six‐month period, work continued to disseminate the Code of Ethics and Conduct
internally, with specific training courses for employees, and with further emphasis on personal data protection
and anti‐corruption.
24You can also read